A car market in crisis


Low sales
If we look back to the pivotal moment at the start of the health crisis, the state of the automotive market as a whole was precarious, or, at the very least, fluctuating.
Admittedly, 2023 and 2024 saw a relative recovery in sales, but this recovery was far from being shared by everyone. While two of the world’s leaders started to recover, many other countries, particularly in Europe, saw their markets remain sluggish.
In China, registrations rose by 9.5% between 2023 and 2024, for a total of 26.9 million vehicles. The Nanfang Zhoumo newspaper reported that 96 cities in the country had more than one million vehicles.
At the same time, car-related household consumption was also down, against a general backdrop of inflation and, even more importantly, soaring vehicle prices in Europe and the United States.
Fig 1 – Vehicle sales from 2019 to 2024
Download this infographic for your presentations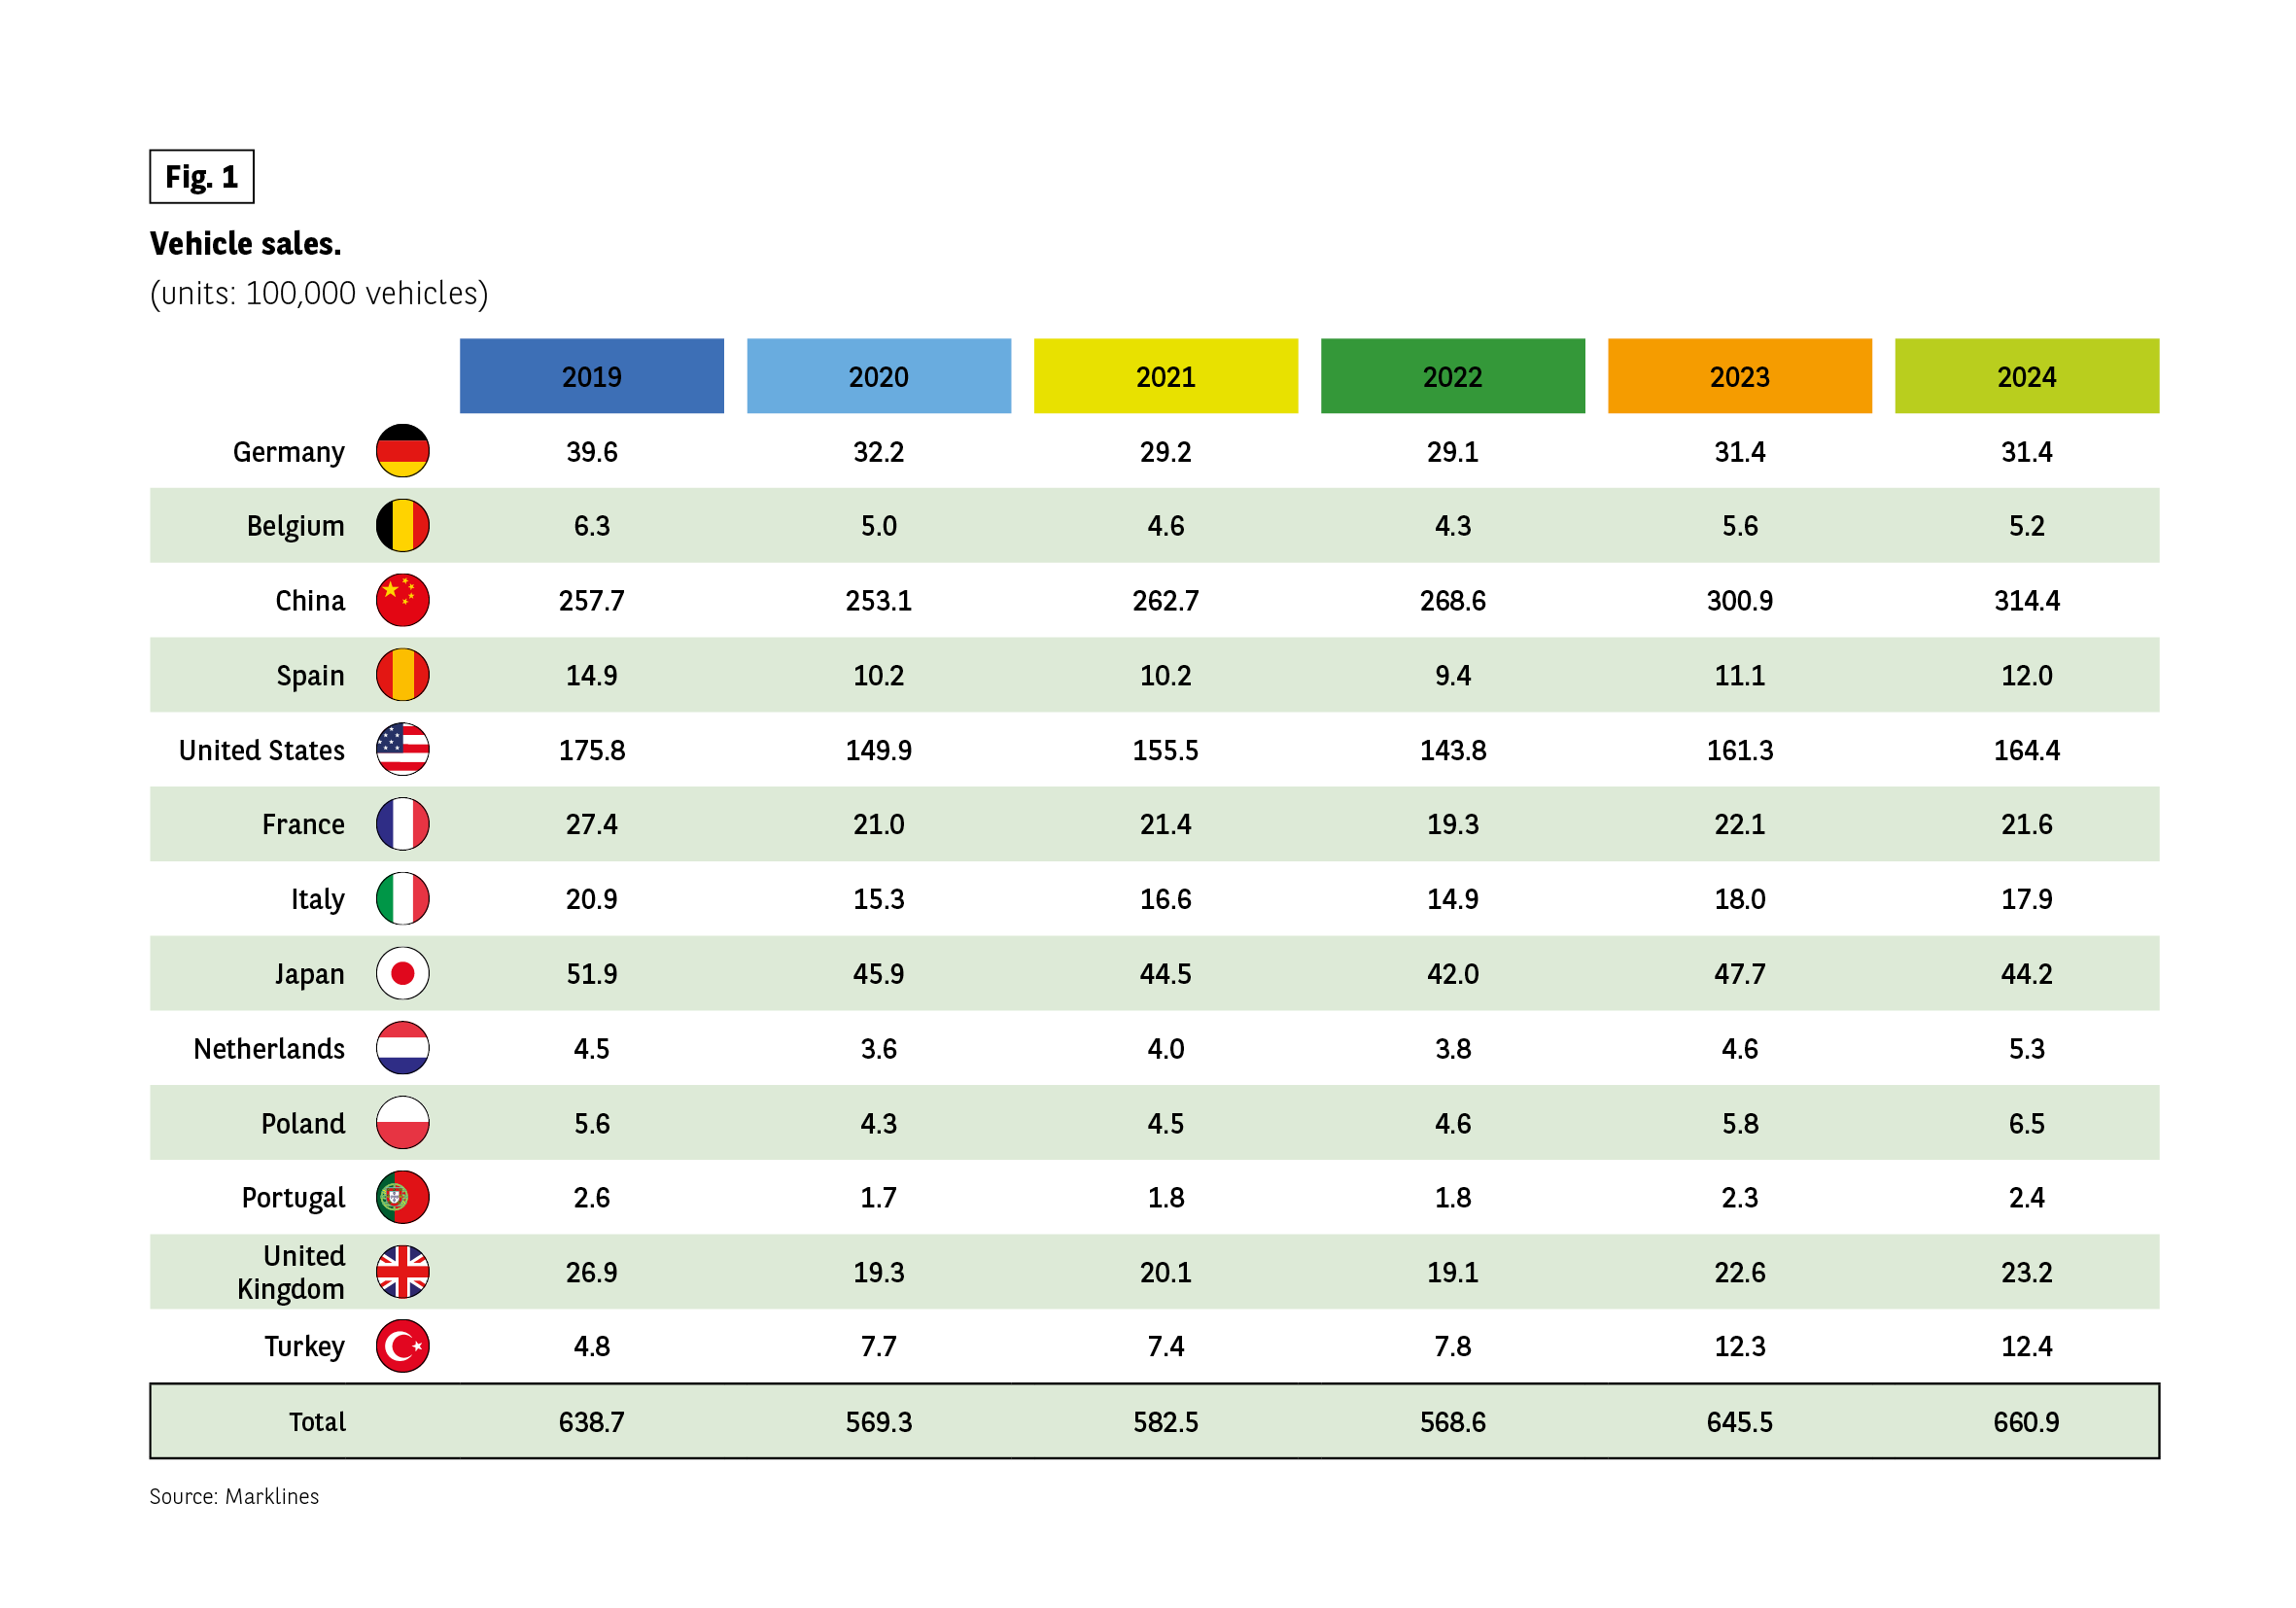 The table shows vehicle sales in units of 100,000 for 13 countries from 2019 to 2024.
Total all countries: 638.7 in 2019, 569.3 in 2020, 582.5 in 2021, 568.6 in 2022, 645.5 in 2023, 660.9 in 2024.
Germany: 39.6; 32.2; 29.2; 29.1; 31.4; 31.4.
Belgium: 6.3; 5.0; 4.6; 4.3; 5.6; 5.2.
China: 257.7; 253.1; 262.7; 268.6; 300.9; 314.4.
Spain: 14.9; 10.2; 10.2; 9.4; 11.1; 12.0.
United States: 175.8; 149.9; 155.5; 143.8; 161.3; 164.4.
France: 27.4; 21.0; 21.4; 19.3; 22.1; 21.6.
Italy: 20.9; 15.3; 16.6; 14.9; 18.0; 17.9.
Japan: 51.9; 45.9; 44.5; 42.0; 47.7; 44.2.
Netherlands: 4.5; 3.6; 4.0; 3.8; 4.6; 5.3.
Poland: 5.6; 4.3; 4.5; 4.6; 5.8; 6.5.
Portugal: 2.6; 1.7; 1.8; 1.8; 2.3; 2.4.
United Kingdom: 26.9; 19.3; 20.1; 19.1; 22.6; 23.2.
Turkey: 4.8; 7.7; 7.4; 7.8; 12.3; 12.4.
Source: Marklines.
The table shows vehicle sales in units of 100,000 for 13 countries from 2019 to 2024.
Total all countries: 638.7 in 2019, 569.3 in 2020, 582.5 in 2021, 568.6 in 2022, 645.5 in 2023, 660.9 in 2024.
Germany: 39.6; 32.2; 29.2; 29.1; 31.4; 31.4.
Belgium: 6.3; 5.0; 4.6; 4.3; 5.6; 5.2.
China: 257.7; 253.1; 262.7; 268.6; 300.9; 314.4.
Spain: 14.9; 10.2; 10.2; 9.4; 11.1; 12.0.
United States: 175.8; 149.9; 155.5; 143.8; 161.3; 164.4.
France: 27.4; 21.0; 21.4; 19.3; 22.1; 21.6.
Italy: 20.9; 15.3; 16.6; 14.9; 18.0; 17.9.
Japan: 51.9; 45.9; 44.5; 42.0; 47.7; 44.2.
Netherlands: 4.5; 3.6; 4.0; 3.8; 4.6; 5.3.
Poland: 5.6; 4.3; 4.5; 4.6; 5.8; 6.5.
Portugal: 2.6; 1.7; 1.8; 1.8; 2.3; 2.4.
United Kingdom: 26.9; 19.3; 20.1; 19.1; 22.6; 23.2.
Turkey: 4.8; 7.7; 7.4; 7.8; 12.3; 12.4.
Source: Marklines.
A renewal deficit with serious consequences
Before the health crisis, between 2015 and 2019, the European market (European Union + United Kingdom) recorded between 16 and 17 million new passenger car registrations each year. Between 2020 and 2024, this figure fell to an average of 11.75 million. Cumulatively, over the last five years, the renewal ‘deficit’ has exceeded 20 million passenger cars.
As well as weakening the industrial and commercial sectors, this situation is directly contributing to the structural ageing of the vehicle fleet and slowing down the uptake of cleaner, more efficient vehicles, such as hybrid and electric models.
In a realistic scenario of demographic stabilisation and a moderate extension of the lifespan (scrappage age) of vehicles, from 20 years at present to 22 years in 10 years’ time, Europe should aim for an annual rate of around 13.5 million new vehicle registrations to avoid further ageing of its in-use car fleet.
Production feeling the effects
Quite logically, the market’s hesitations are reflected in vehicle production. Production capacity has been under-utilised since 2020. Once again, China remains a special case, with overproduction that particularly involves electric vehicles. Faced with sluggish domestic consumption, Chinese manufacturers are lowering their prices and shifting their focus to exports, with the support of the government. They primarily target countries with little or no protection, unlike the United States, which has erected a particularly dissuasive wall of customs duties. China is now the world’s leading exporter of light vehicles.
Fig 2 – Passenger car production by country 2019–2024
Download this infographic for your presentations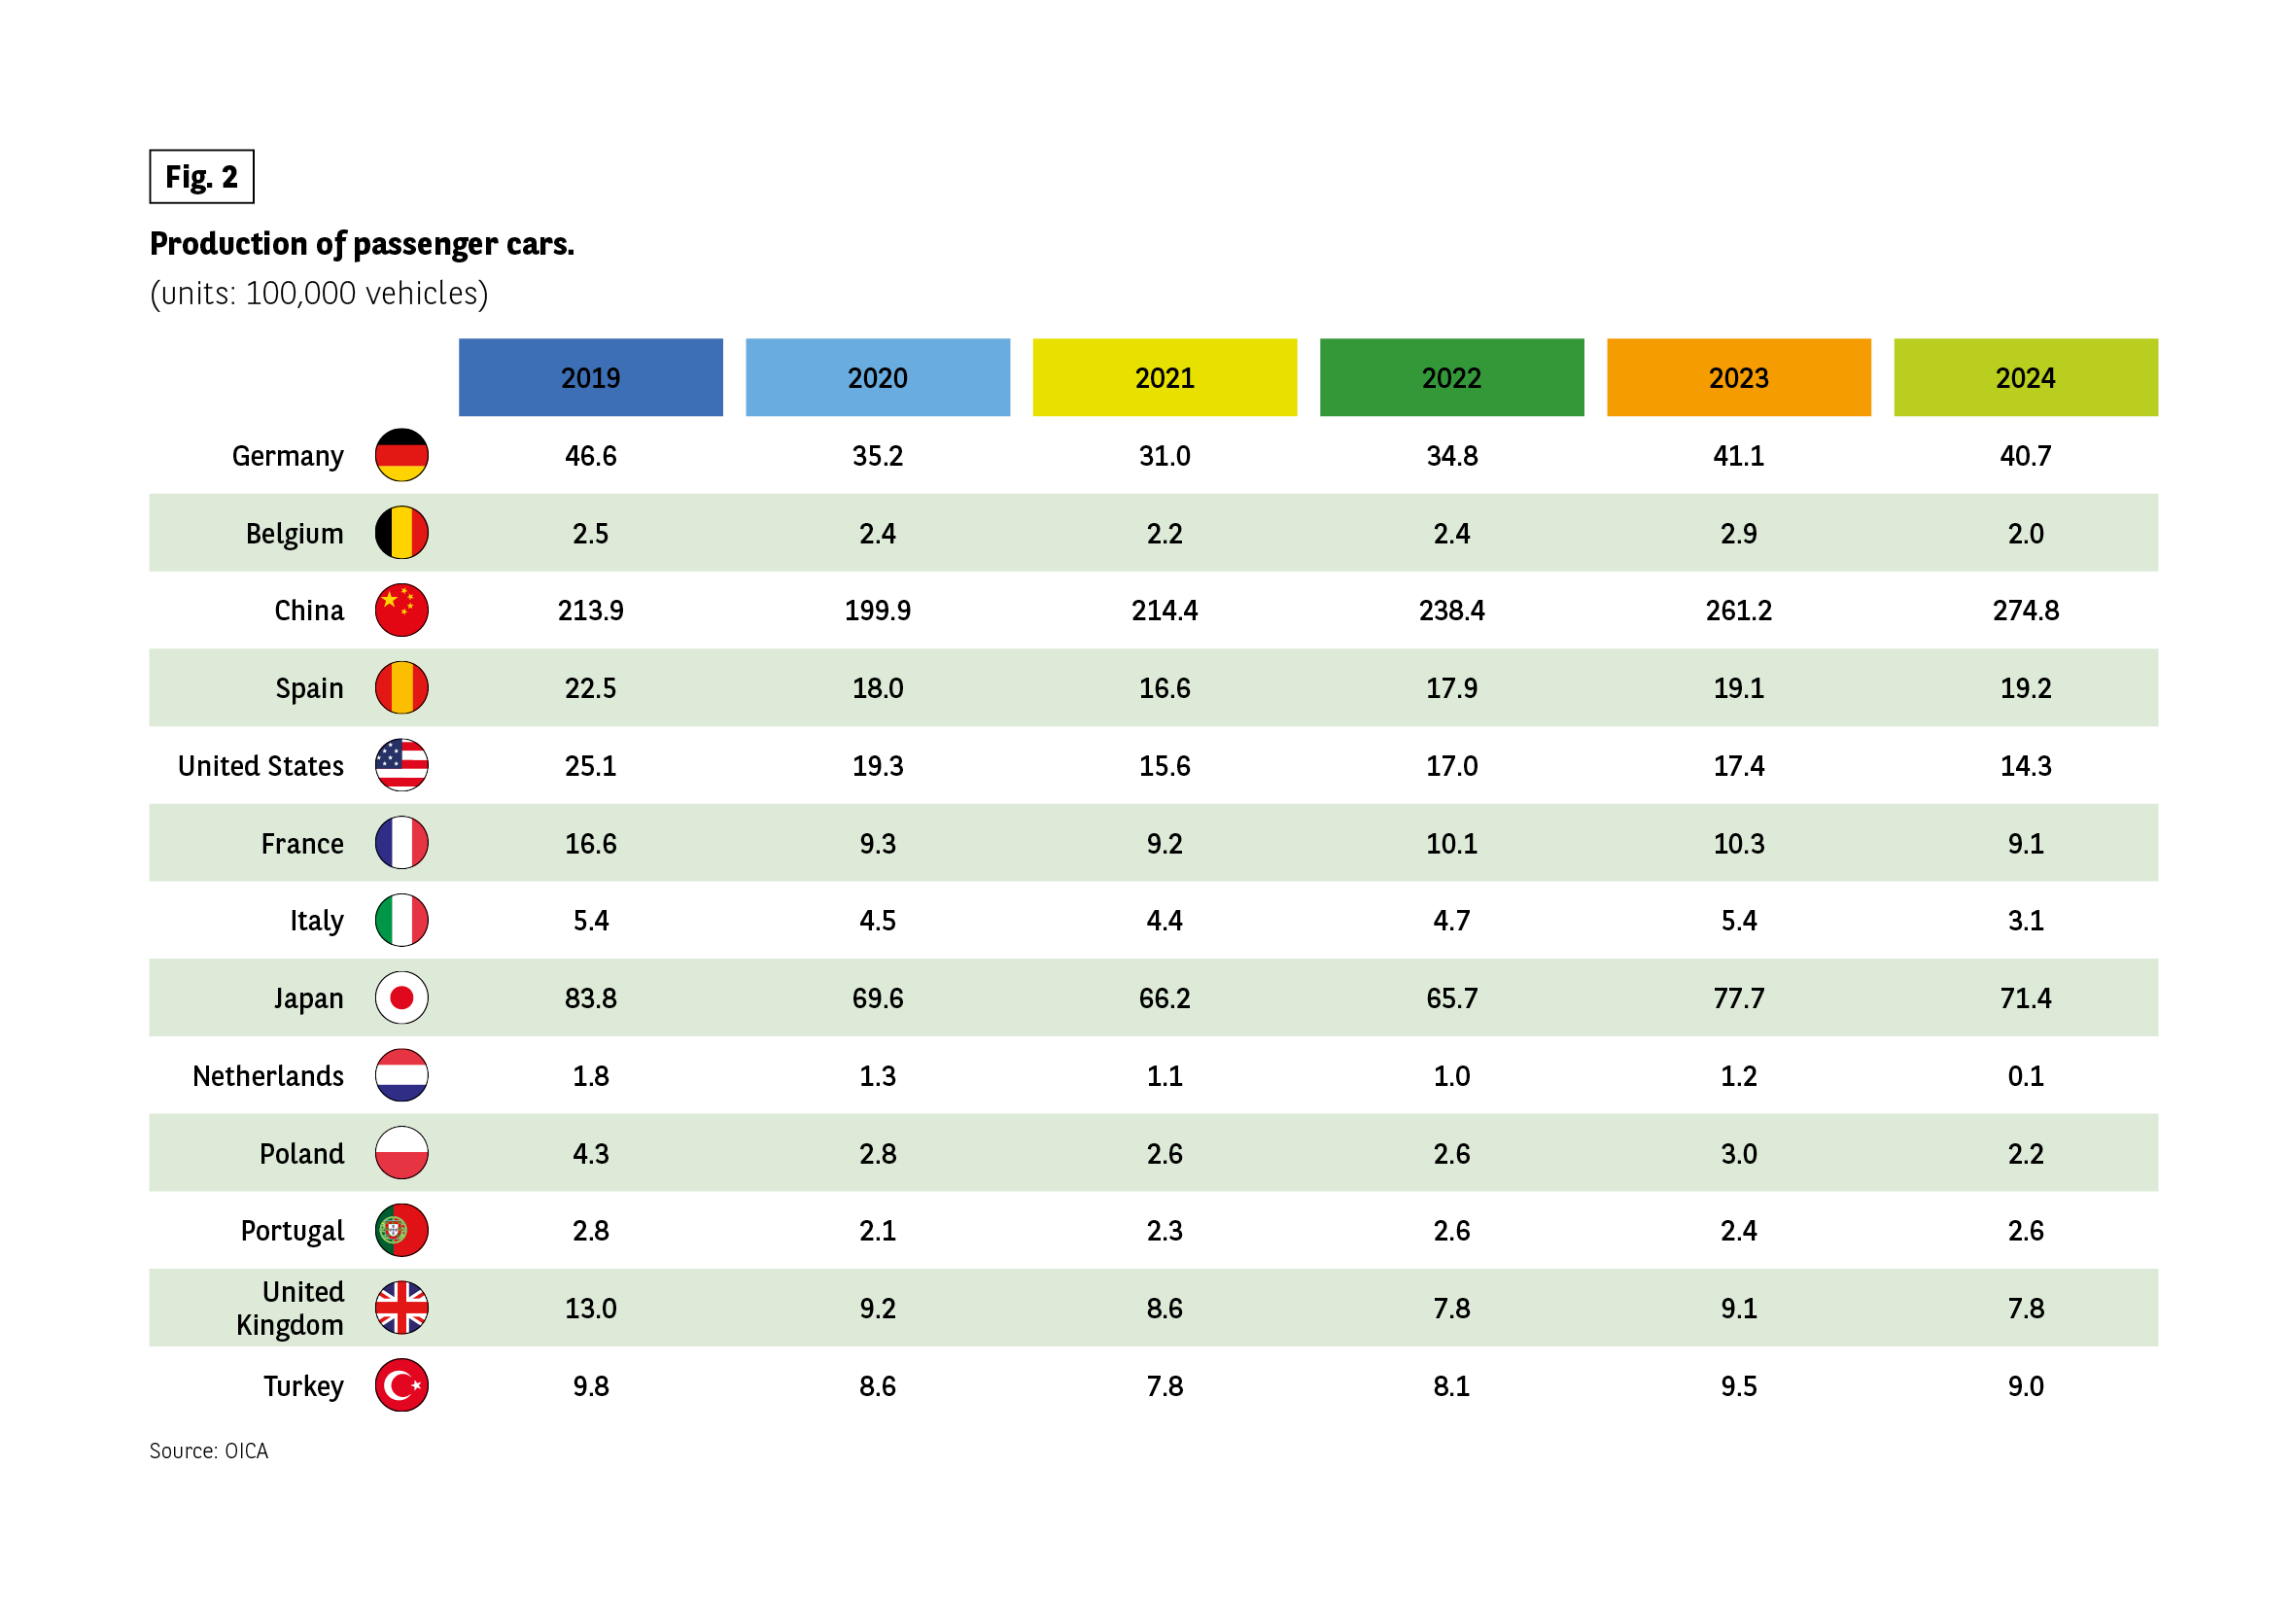 The table presents passenger car production in units of 100,000 vehicles for 13 countries from 2019 to 2024.
Germany: 46.6 in 2019, 35.2 in 2020, 31.0 in 2021, 34.8 in 2022, 41.1 in 2023, 40.7 in 2024.
Belgium: 2.5, 2.4, 2.2, 2.4, 2.9, 2.0.
China: 213.9, 199.9, 214.4, 238.4, 261.2, 274.8.
Spain: 22.5, 18.0, 16.6, 17.9, 19.1, 19.2.
United States: 25.1, 19.3, 15.6, 17.0, 17.4, 14.3.
France: 16.6, 9.3, 9.2, 10.1, 10.3, 9.1.
Italy: 5.4, 4.5, 4.4, 4.7, 5.4, 3.1.
Japan: 83.8, 69.6, 66.2, 65.7, 77.7, 71.4.
Netherlands: 1.8, 1.3, 1.1, 1.0, 1.2, 0.1.
Poland: 4.3, 2.8, 2.6, 2.6, 3.0, 2.2.
Portugal: 2.8, 2.1, 2.3, 2.6, 2.4, 2.6.
United Kingdom: 13.0, 9.2, 8.6, 7.8, 9.1, 7.8.
Turkey: 9.8, 8.6, 7.8, 8.1, 9.5, 9.0.
The table presents passenger car production in units of 100,000 vehicles for 13 countries from 2019 to 2024.
Germany: 46.6 in 2019, 35.2 in 2020, 31.0 in 2021, 34.8 in 2022, 41.1 in 2023, 40.7 in 2024.
Belgium: 2.5, 2.4, 2.2, 2.4, 2.9, 2.0.
China: 213.9, 199.9, 214.4, 238.4, 261.2, 274.8.
Spain: 22.5, 18.0, 16.6, 17.9, 19.1, 19.2.
United States: 25.1, 19.3, 15.6, 17.0, 17.4, 14.3.
France: 16.6, 9.3, 9.2, 10.1, 10.3, 9.1.
Italy: 5.4, 4.5, 4.4, 4.7, 5.4, 3.1.
Japan: 83.8, 69.6, 66.2, 65.7, 77.7, 71.4.
Netherlands: 1.8, 1.3, 1.1, 1.0, 1.2, 0.1.
Poland: 4.3, 2.8, 2.6, 2.6, 3.0, 2.2.
Portugal: 2.8, 2.1, 2.3, 2.6, 2.4, 2.6.
United Kingdom: 13.0, 9.2, 8.6, 7.8, 9.1, 7.8.
Turkey: 9.8, 8.6, 7.8, 8.1, 9.5, 9.0.
Fig 3 – Automotive production capacity utilization rates
Download this infographic for your presentations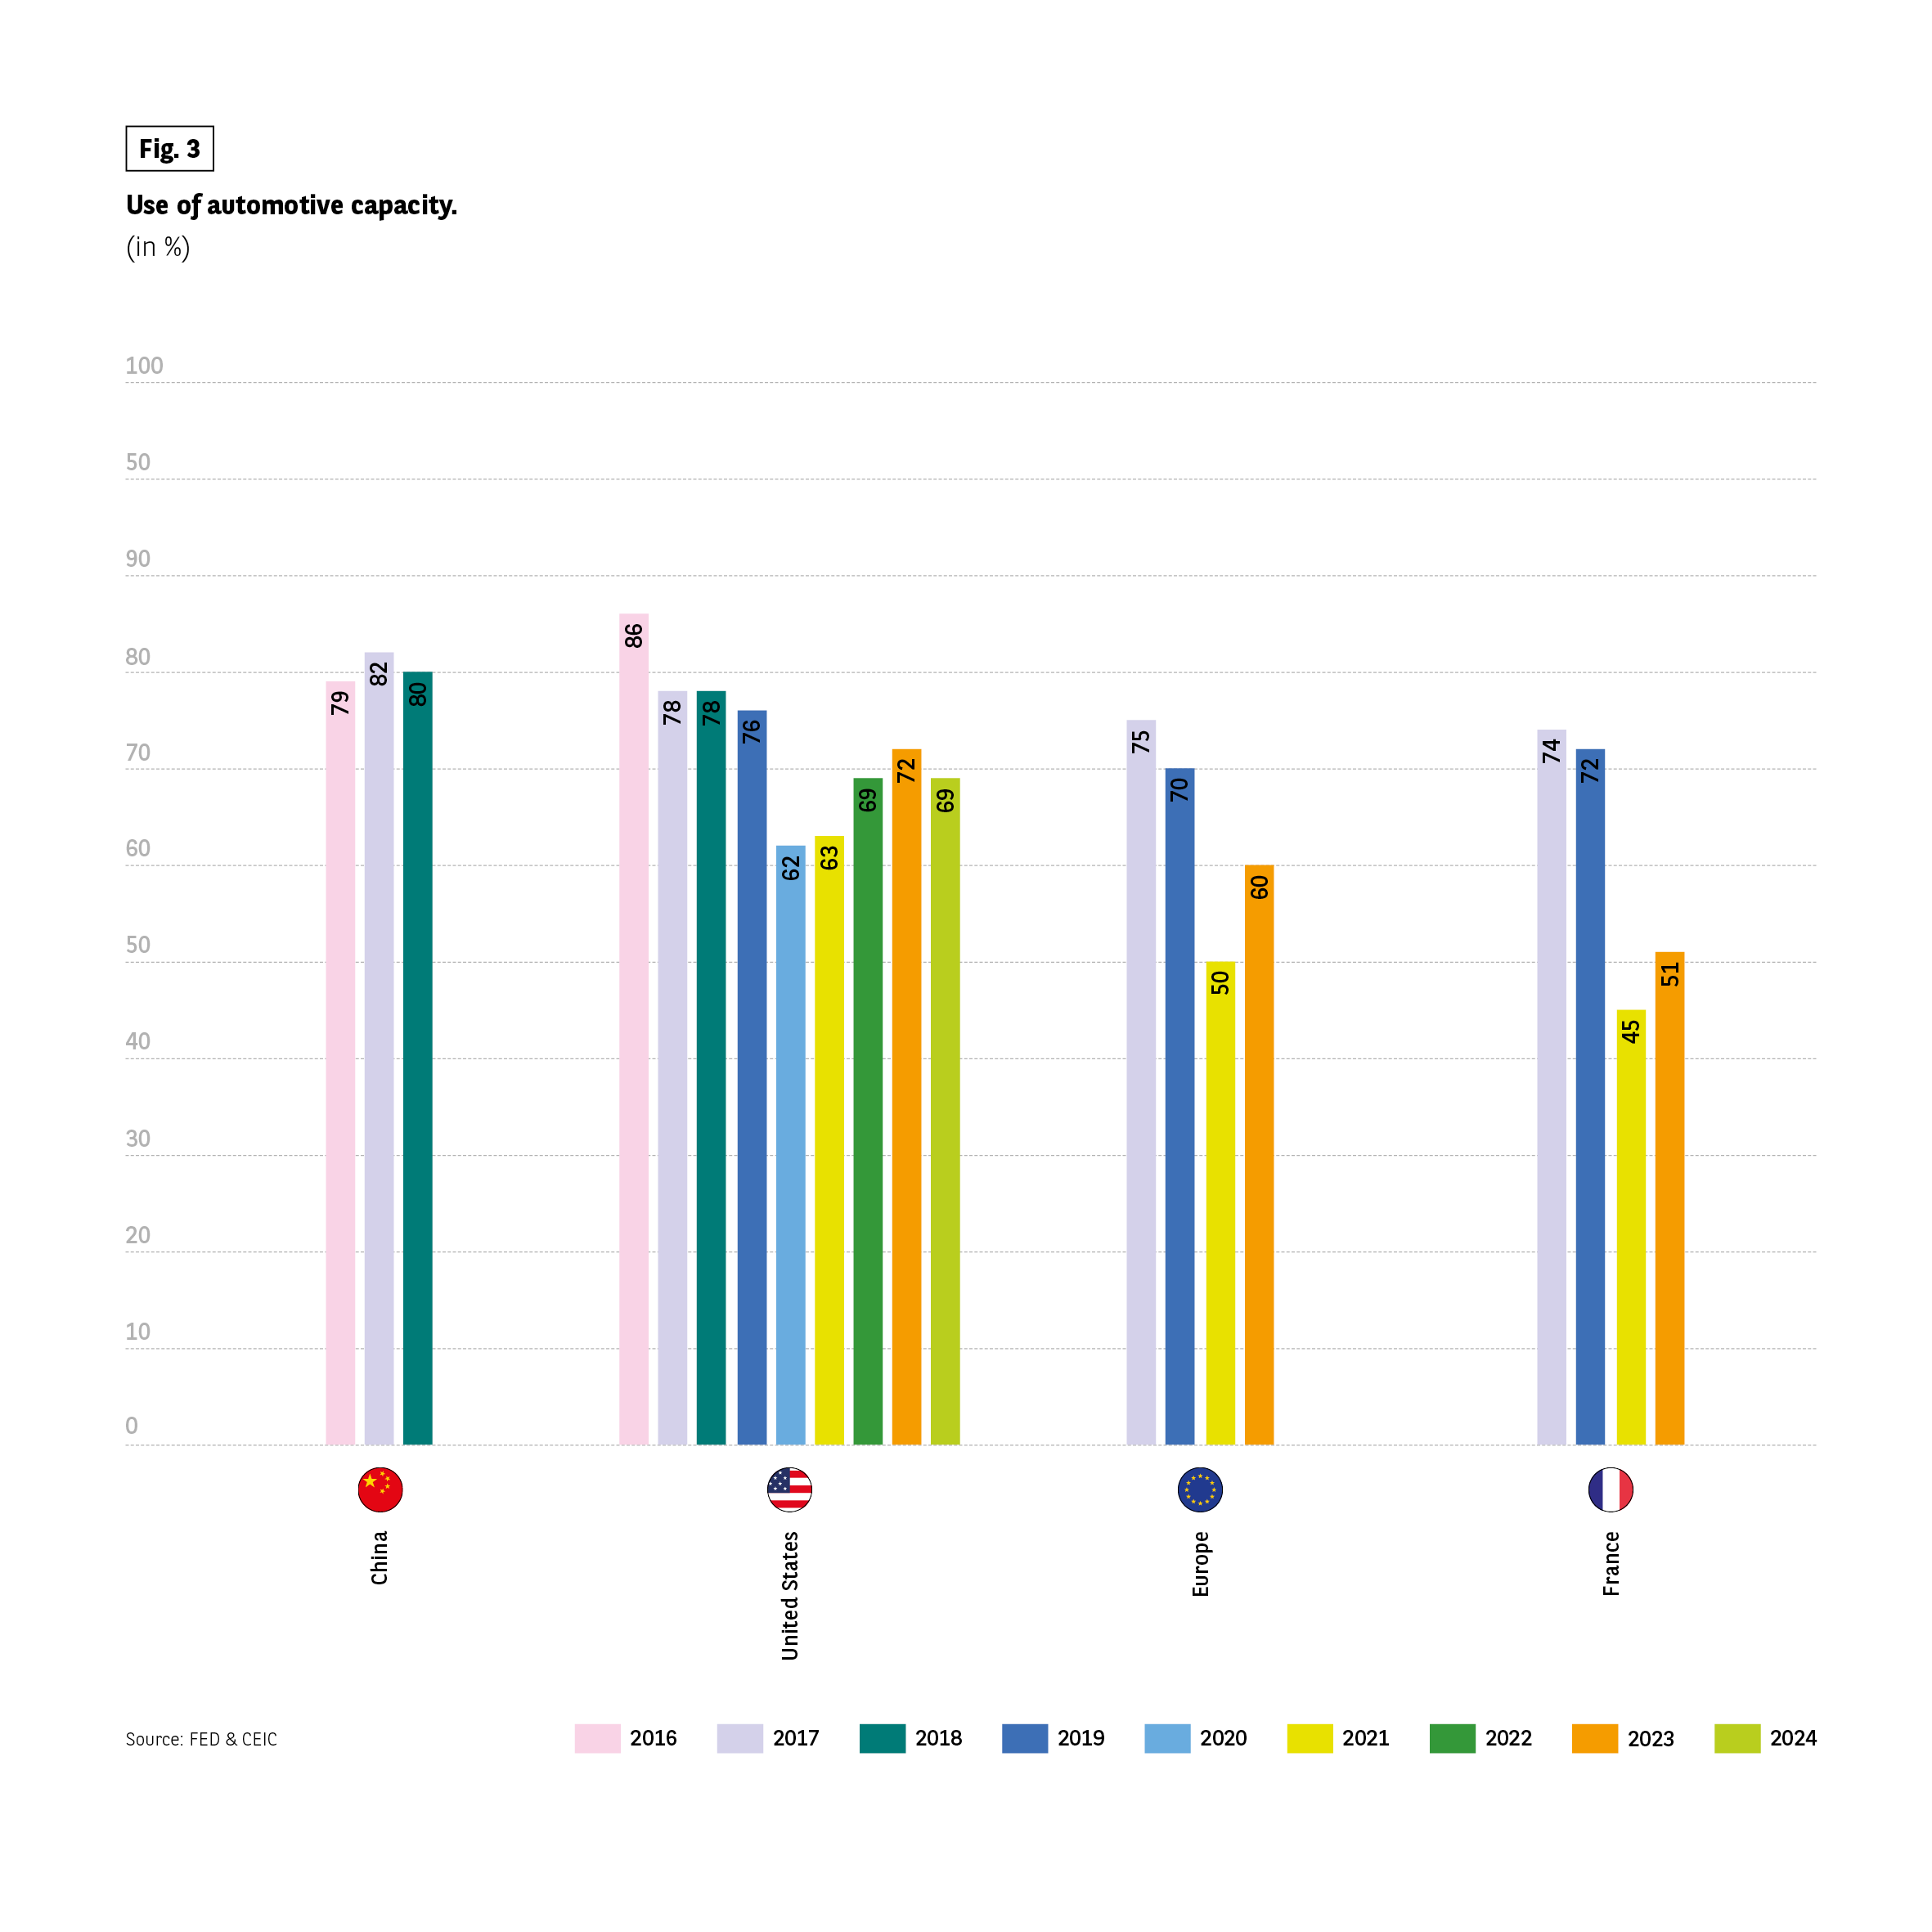 The bar chart shows automotive production capacity utilization in percent from 2016 to 2024 for China, the United States, Europe and France.
China: 79% in 2016, 82% in 2017, 80% in 2018.
United States: 86% in 2016, 78% in 2017, 78% in 2018, 76% in 2019, 62% in 2020, 63% in 2021, 69% in 2022, 72% in 2023, 69% in 2024.
Europe: 75% in 2019, 70% in 2020, 50% in 2021, 60% in 2022.
France: 74% in 2019, 72% in 2020, 45% in 2021, 51% in 2022.
Source: FED & CEIC.
The bar chart shows automotive production capacity utilization in percent from 2016 to 2024 for China, the United States, Europe and France.
China: 79% in 2016, 82% in 2017, 80% in 2018.
United States: 86% in 2016, 78% in 2017, 78% in 2018, 76% in 2019, 62% in 2020, 63% in 2021, 69% in 2022, 72% in 2023, 69% in 2024.
Europe: 75% in 2019, 70% in 2020, 50% in 2021, 60% in 2022.
France: 74% in 2019, 72% in 2020, 45% in 2021, 51% in 2022.
Source: FED & CEIC.
Employment heavily impacted
The impact on employment is just as brutal, once again mainly on the ‘old continent’. From a series of plant closures to the impact on subcontracting and relocation to less costly climes, the future is even more uncertain, especially with the production of electric vehicles requiring less labour.
Fig 4 – Share of motor vehicle manufacturing employment
Download this infographic for your presentations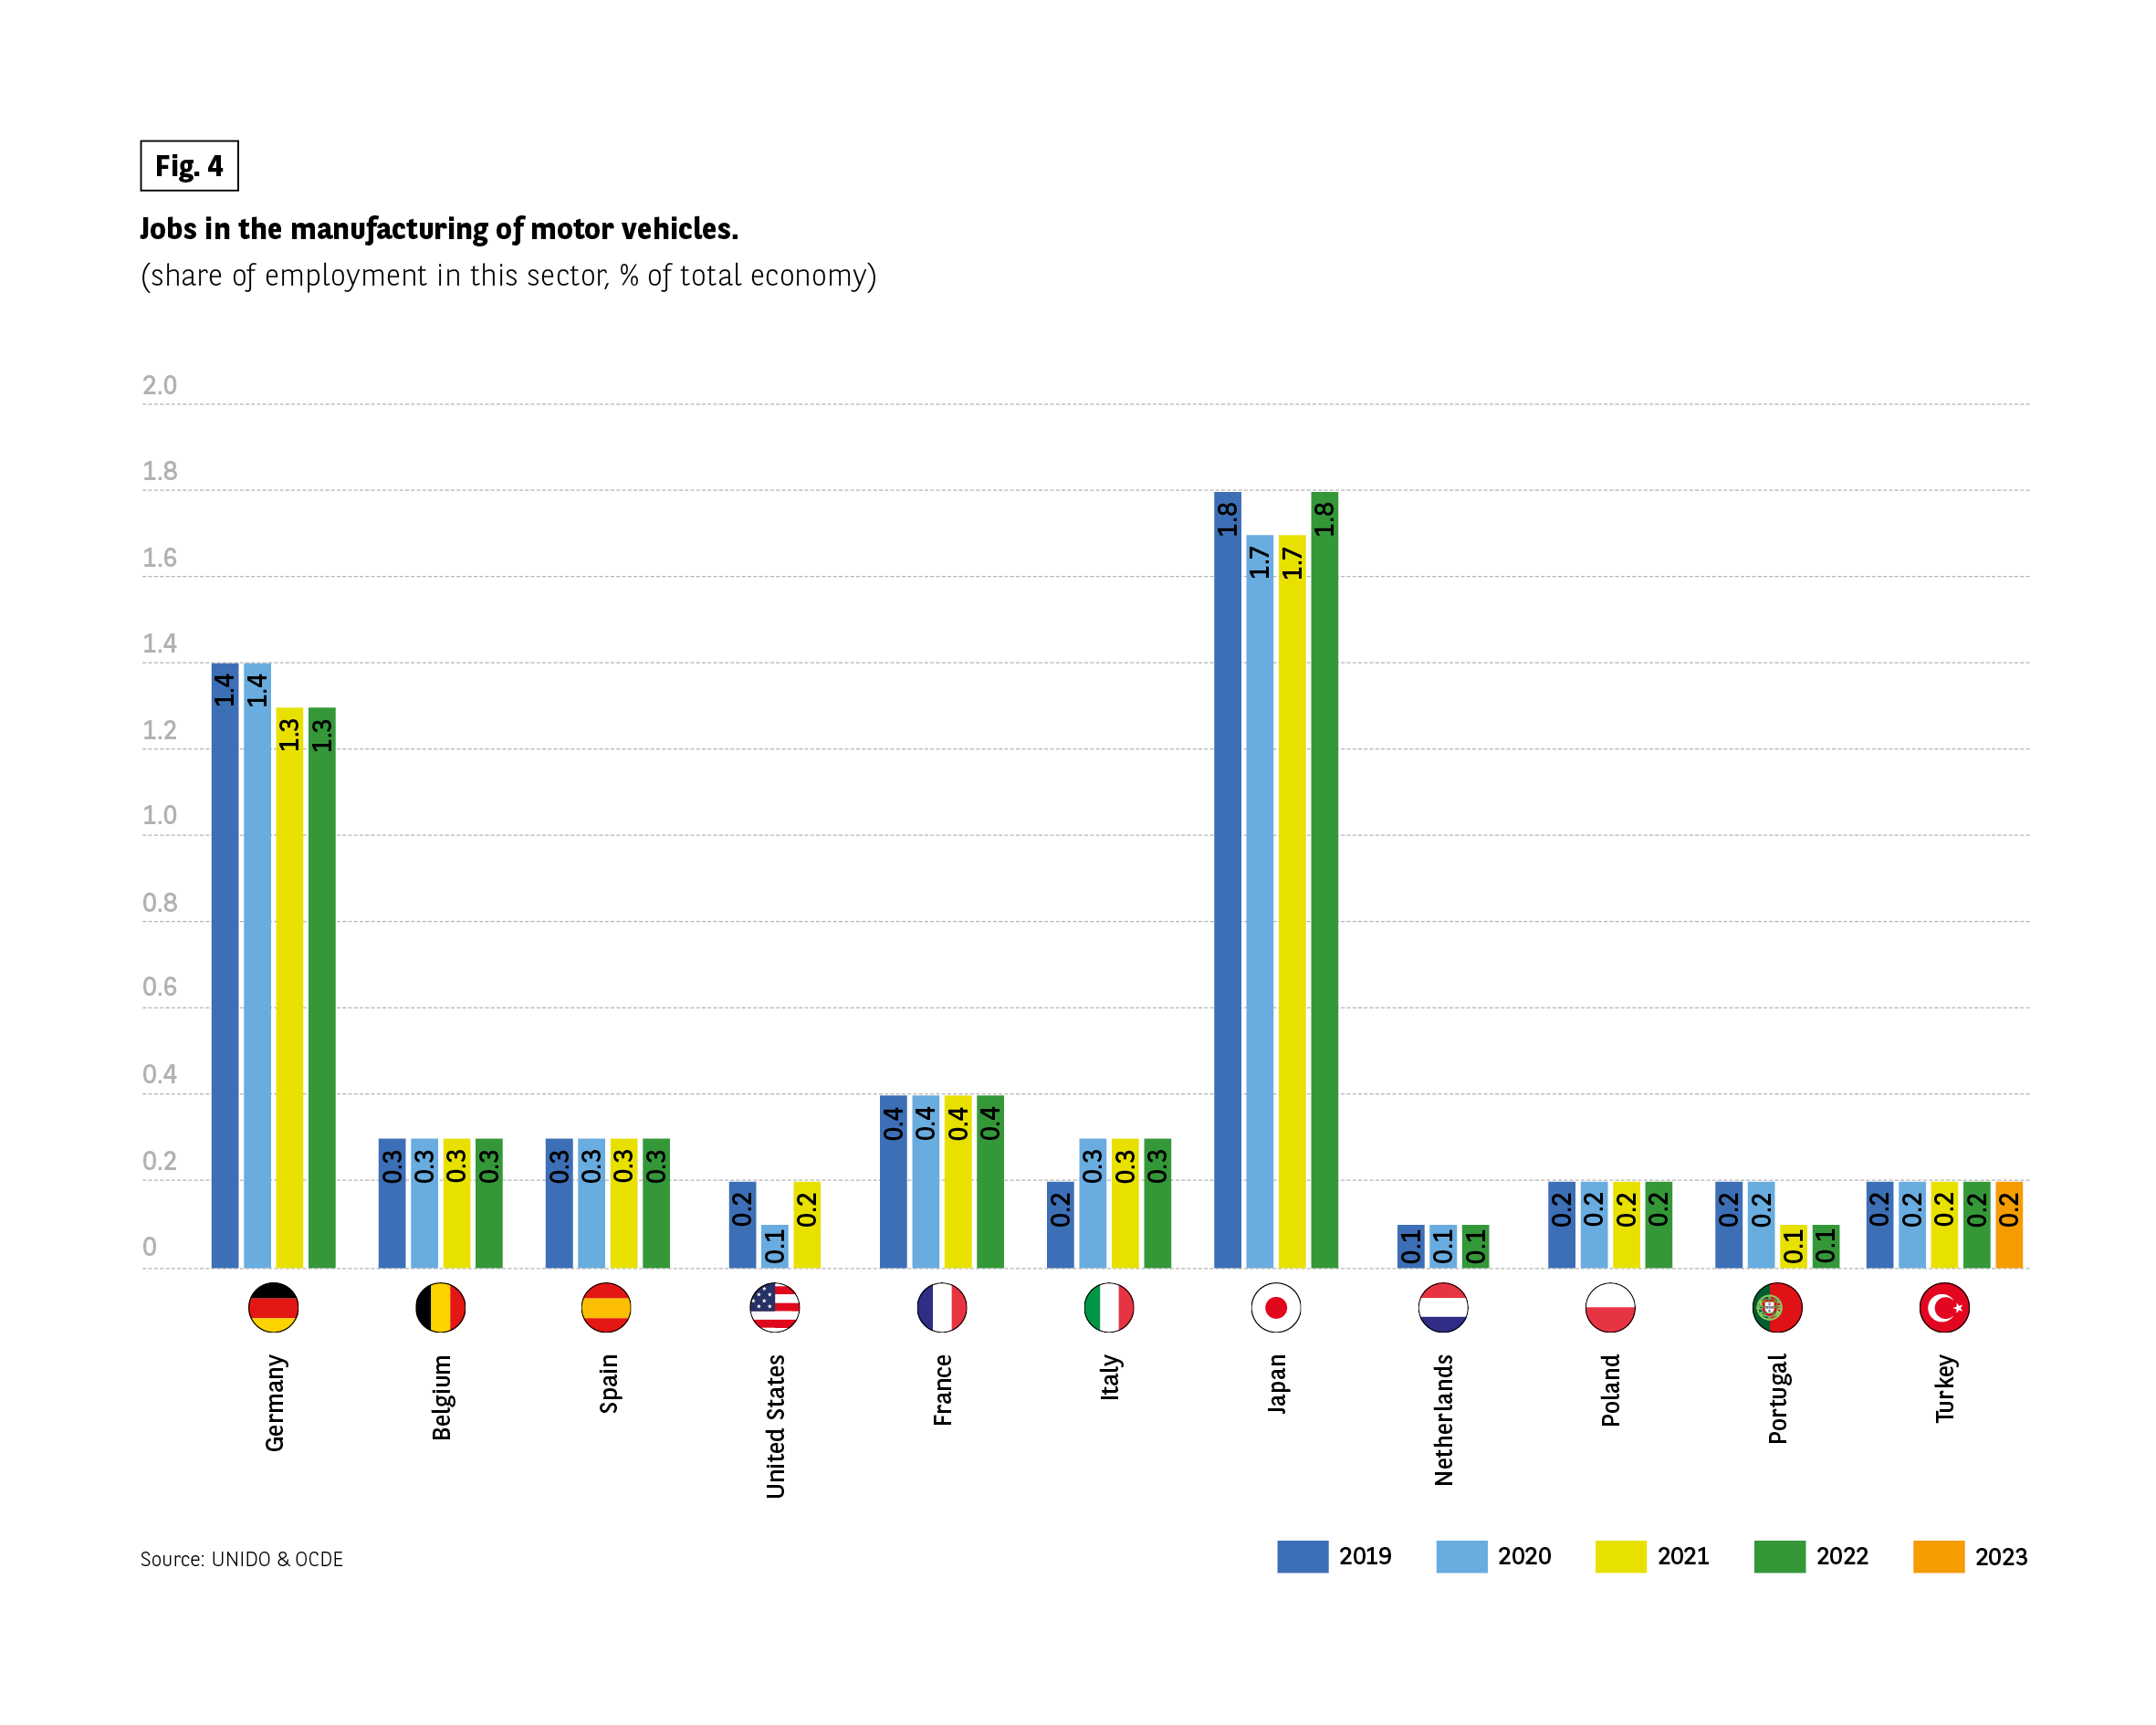 The chart shows the share of total national employment represented by motor vehicle manufacturing between 2019 and 2023.
Germany: 1.4% in 2019, 1.4% in 2020, 1.3% in 2021, 1.3% in 2022.
Belgium: 0.3% for all years.
Spain: 0.3% for all years.
United States: 0.2% in 2019, 0.1% in 2020, 0.2% in 2021.
France: 0.4% for all years.
Italy: 0.2% in 2019, 0.3% thereafter.
Japan: 1.8% in 2019, 1.7% in 2020, 1.7% in 2021, 1.8% in 2022.
Netherlands: 0.1% for all years.
Poland: 0.2% for all years.
Portugal: 0.2% in 2019 and 2020, 0.1% in 2021 and 2022.
Turkey: 0.2% for all years.
Source: UNIDO & OECD.
The chart shows the share of total national employment represented by motor vehicle manufacturing between 2019 and 2023.
Germany: 1.4% in 2019, 1.4% in 2020, 1.3% in 2021, 1.3% in 2022.
Belgium: 0.3% for all years.
Spain: 0.3% for all years.
United States: 0.2% in 2019, 0.1% in 2020, 0.2% in 2021.
France: 0.4% for all years.
Italy: 0.2% in 2019, 0.3% thereafter.
Japan: 1.8% in 2019, 1.7% in 2020, 1.7% in 2021, 1.8% in 2022.
Netherlands: 0.1% for all years.
Poland: 0.2% for all years.
Portugal: 0.2% in 2019 and 2020, 0.1% in 2021 and 2022.
Turkey: 0.2% for all years.
Source: UNIDO & OECD.
Europe hit hard by job losses
Fig 5 – Job creations and cuts in automotive sector
Download this infographic for your presentations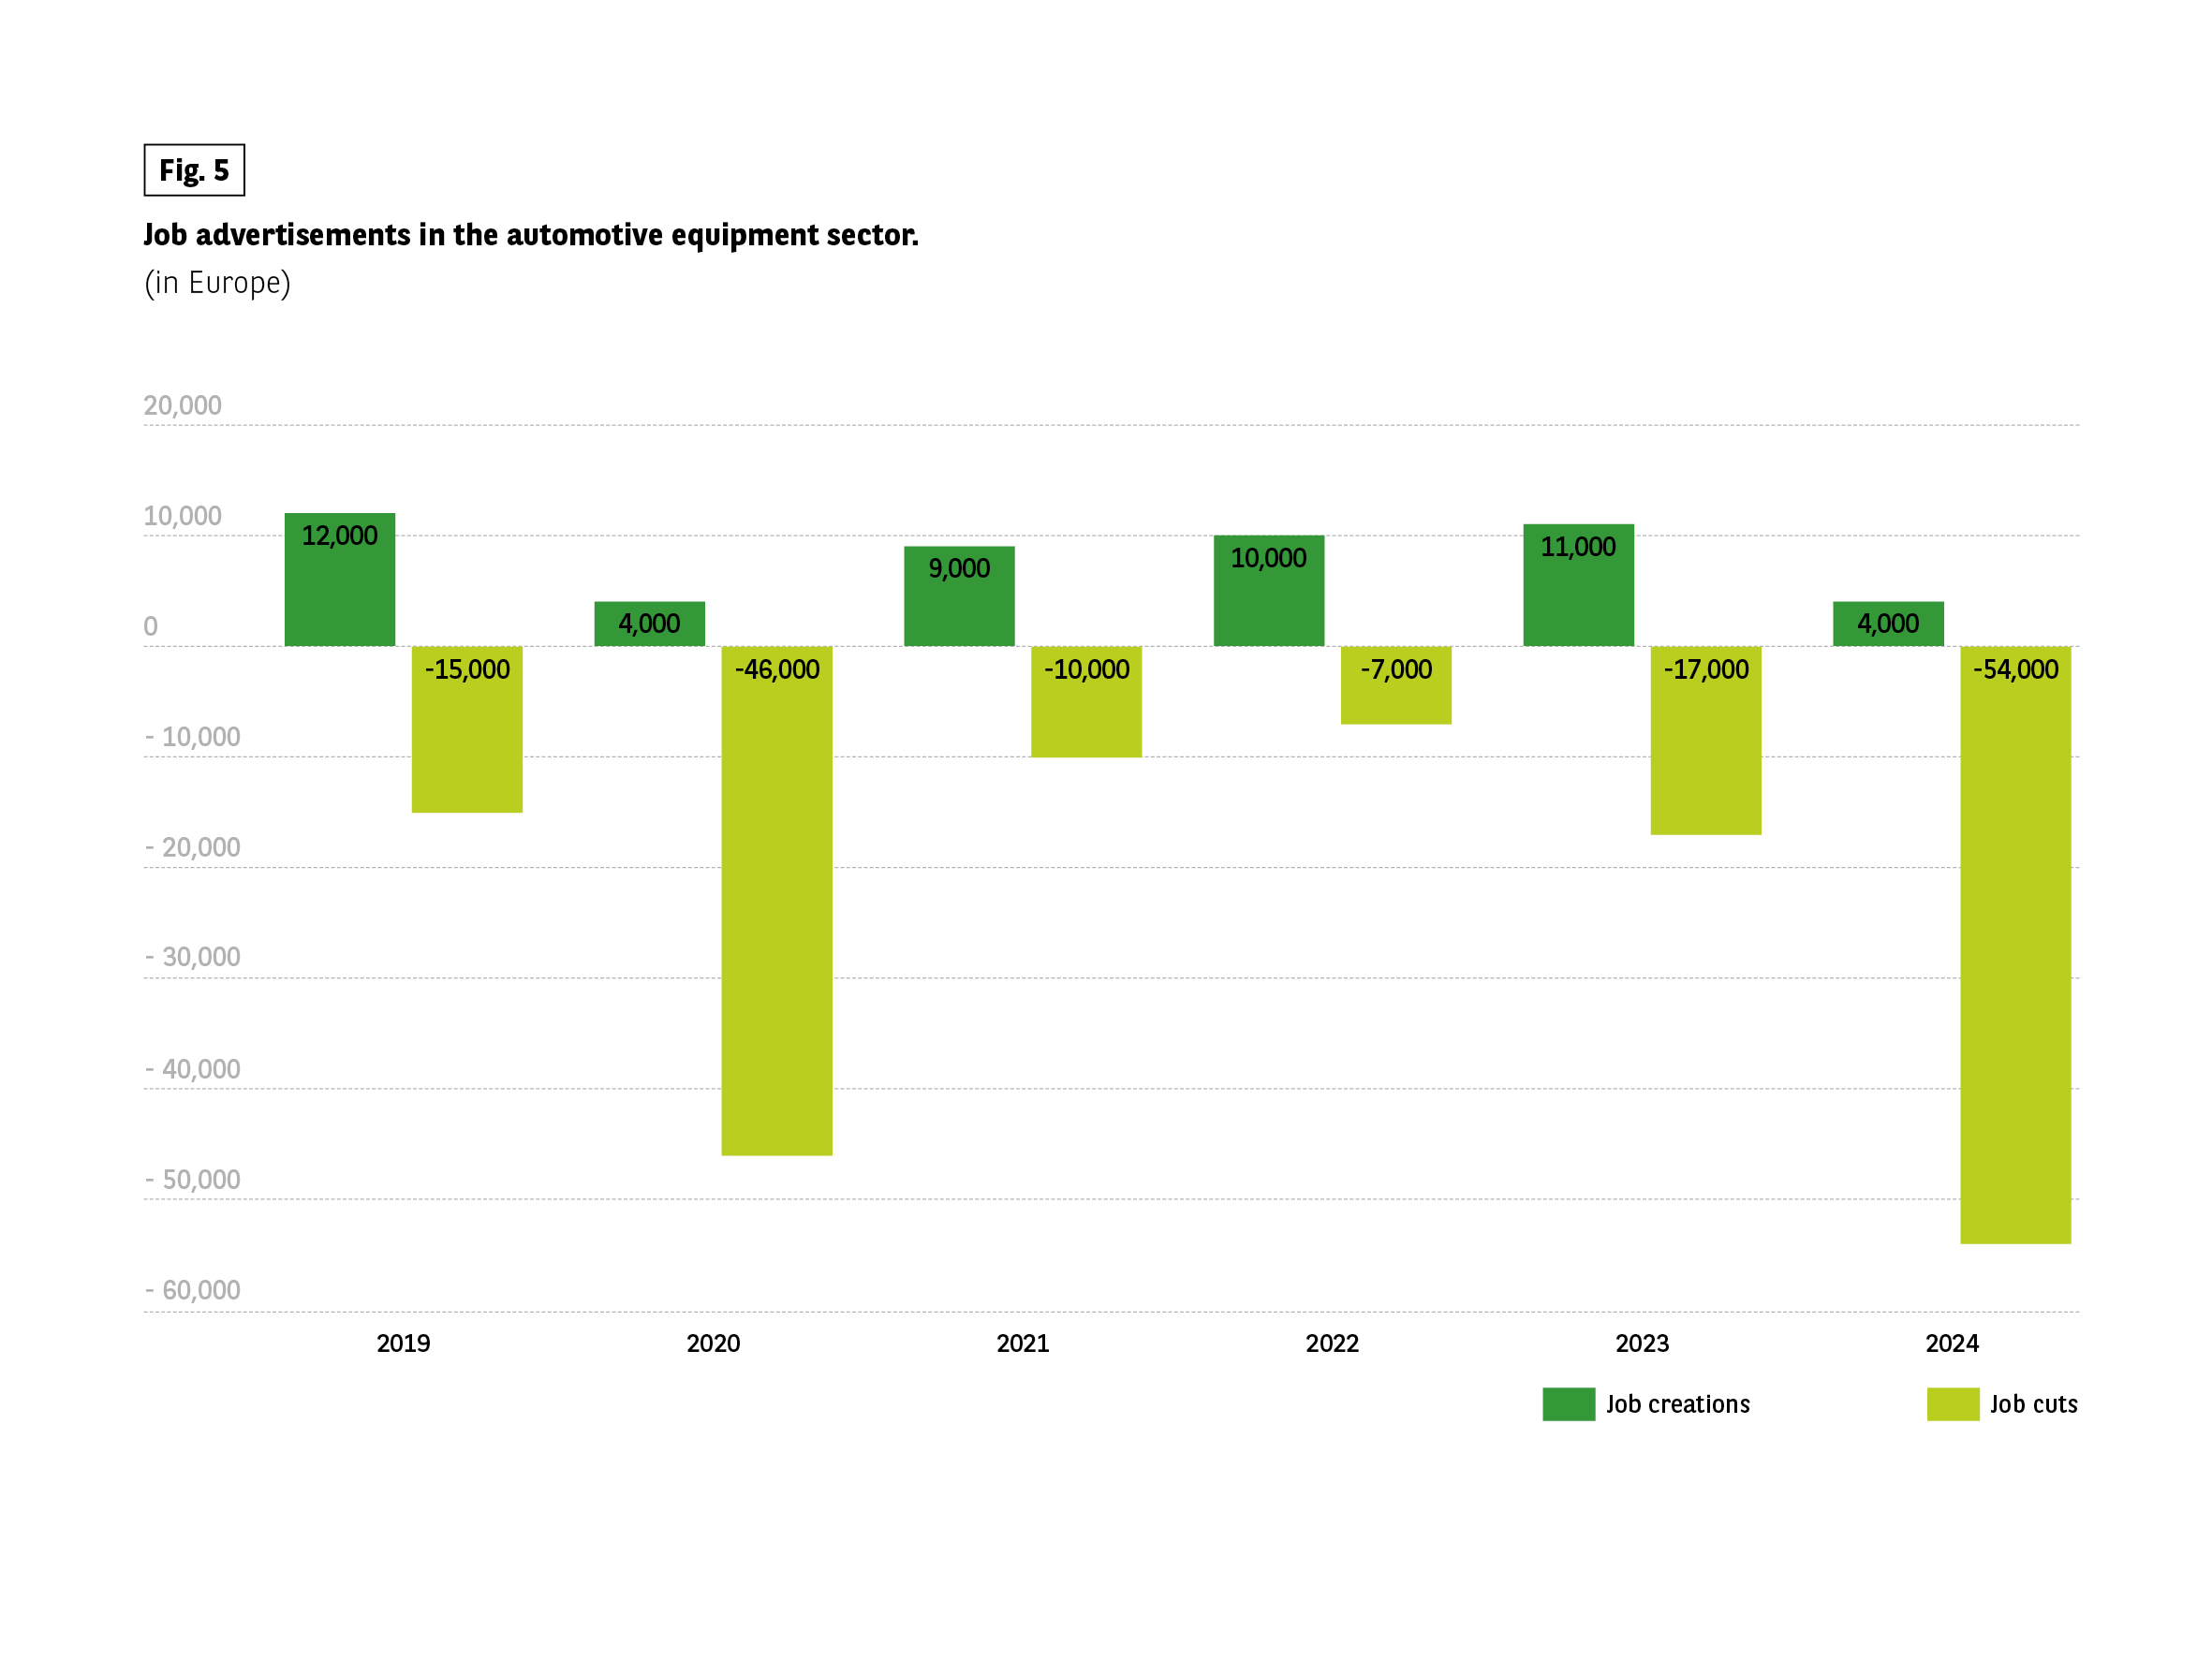 The bar chart presents job creations and job cuts in the automotive equipment sector in Europe.
2019: 12,000 jobs created, 15,000 jobs cut.
2020: 4,000 jobs created, 46,000 jobs cut.
2021: 9,000 jobs created, 10,000 jobs cut.
2022: 10,000 jobs created, 7,000 jobs cut.
2023: 11,000 jobs created, 17,000 jobs cut.
2024: 4,000 jobs created, 54,000 jobs cut.
The bar chart presents job creations and job cuts in the automotive equipment sector in Europe.
2019: 12,000 jobs created, 15,000 jobs cut.
2020: 4,000 jobs created, 46,000 jobs cut.
2021: 9,000 jobs created, 10,000 jobs cut.
2022: 10,000 jobs created, 7,000 jobs cut.
2023: 11,000 jobs created, 17,000 jobs cut.
2024: 4,000 jobs created, 54,000 jobs cut.
The case of France
In 2012, 95,444 people in France were employed in the production of vehicles, trailers and semi-trailers. By 2023, this figure had fallen to 70,000*. Internal restructuring, relocations and permanent closures account for most of this inexorable decline.
*Source: Eurostat. ** Source: Eurofound & CLEPA analysis.
A transition to electric that is not necessarily straightforward
Despite all this, the anticipated electric shift is not – or is no longer – crystal-clear and devoid of all clouds. After a period of strong growth, sales seem to be stagnating, or even falling in some countries, due to a combination of factors, not least of which is price, the questioning of policies to limit the use of combustion engine vehicles, and the persistent resistance to change on the part of a large proportion of customers when it comes to this technology. In China, where sales have exceeded 7 million units, the effects of overproduction are also being felt.
Fig 6 – Electric vehicle market share by country
Download this infographic for your presentations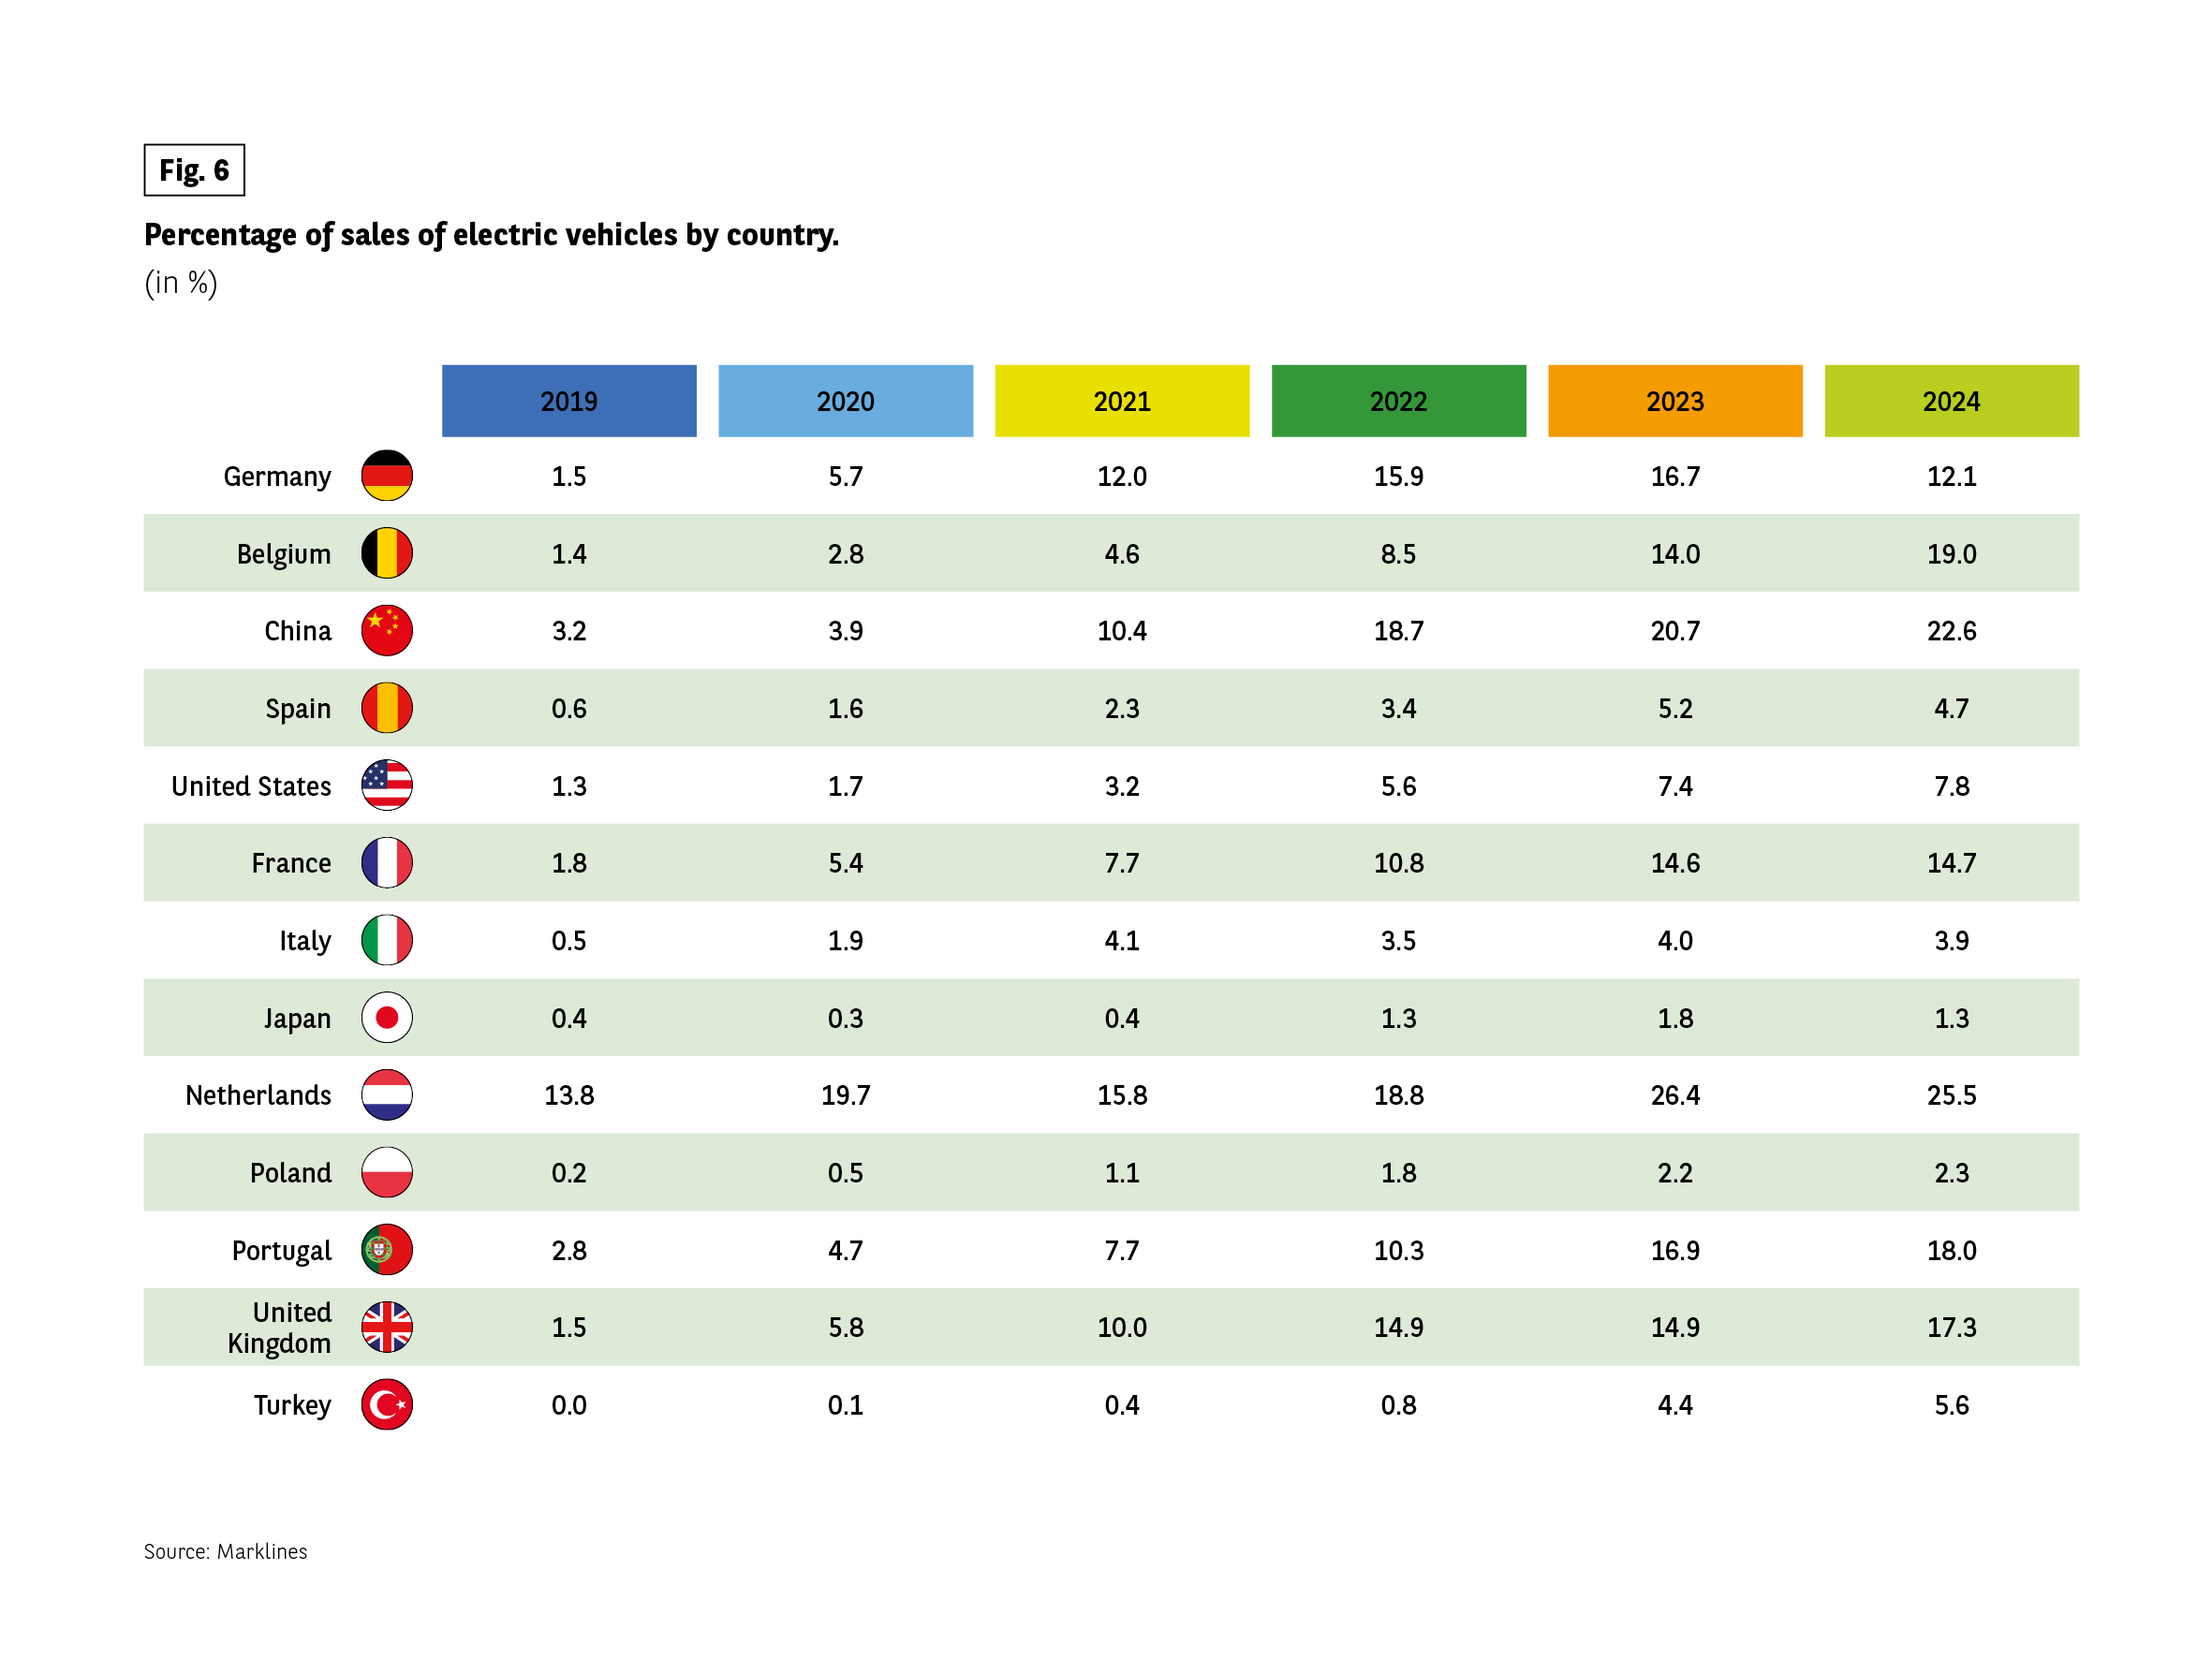 The table shows the percentage share of electric vehicles in total vehicle sales.
Germany: 1.5% in 2019, 5.7% in 2020, 12.0% in 2021, 15.9% in 2022, 16.7% in 2023, 12.1% in 2024.
Belgium: 1.4%, 2.8%, 4.6%, 8.5%, 14.0%, 19.0%.
China: 3.2%, 3.9%, 10.4%, 18.7%, 20.7%, 22.6%.
Spain: 0.6%, 1.6%, 2.3%, 3.4%, 5.2%, 4.7%.
United States: 1.3%, 1.7%, 3.2%, 5.6%, 7.4%, 7.8%.
France: 1.8%, 5.4%, 7.7%, 10.8%, 14.6%, 14.7%.
Italy: 0.5%, 1.9%, 4.1%, 3.5%, 4.0%, 3.9%.
Japan: 0.4%, 0.3%, 0.4%, 1.3%, 1.8%, 1.3%.
Netherlands: 13.8%, 19.7%, 15.8%, 18.8%, 26.4%, 25.5%.
Poland: 0.2%, 0.5%, 1.1%, 1.8%, 2.2%, 2.3%.
Portugal: 2.8%, 4.7%, 7.7%, 10.3%, 16.9%, 18.0%.
United Kingdom: 1.5%, 5.8%, 10.0%, 14.9%, 14.9%, 17.3%.
Turkey: 0.0%, 0.1%, 0.4%, 0.8%, 4.4%, 5.6%.
Source: Marklines.
The table shows the percentage share of electric vehicles in total vehicle sales.
Germany: 1.5% in 2019, 5.7% in 2020, 12.0% in 2021, 15.9% in 2022, 16.7% in 2023, 12.1% in 2024.
Belgium: 1.4%, 2.8%, 4.6%, 8.5%, 14.0%, 19.0%.
China: 3.2%, 3.9%, 10.4%, 18.7%, 20.7%, 22.6%.
Spain: 0.6%, 1.6%, 2.3%, 3.4%, 5.2%, 4.7%.
United States: 1.3%, 1.7%, 3.2%, 5.6%, 7.4%, 7.8%.
France: 1.8%, 5.4%, 7.7%, 10.8%, 14.6%, 14.7%.
Italy: 0.5%, 1.9%, 4.1%, 3.5%, 4.0%, 3.9%.
Japan: 0.4%, 0.3%, 0.4%, 1.3%, 1.8%, 1.3%.
Netherlands: 13.8%, 19.7%, 15.8%, 18.8%, 26.4%, 25.5%.
Poland: 0.2%, 0.5%, 1.1%, 1.8%, 2.2%, 2.3%.
Portugal: 2.8%, 4.7%, 7.7%, 10.3%, 16.9%, 18.0%.
United Kingdom: 1.5%, 5.8%, 10.0%, 14.9%, 14.9%, 17.3%.
Turkey: 0.0%, 0.1%, 0.4%, 0.8%, 4.4%, 5.6%.
Source: Marklines.
The price war is raging at a time when state subsidies are running out in many parts of the country. These same regions are struggling to support manufacturers in the sector. All the signs of the involution, so dear to Presi- dent Xi Jinping, are beginning to show: unbridled competition is wiping out economic and technological gains.
In many countries, help-to-buy schemes have simply been abolished, as in the United States, or are in the process of disappearing, as in China. (Fig. 6) (Fig. 7).
Fig 7 – Electric vehicle sales by country
Download this infographic for your presentations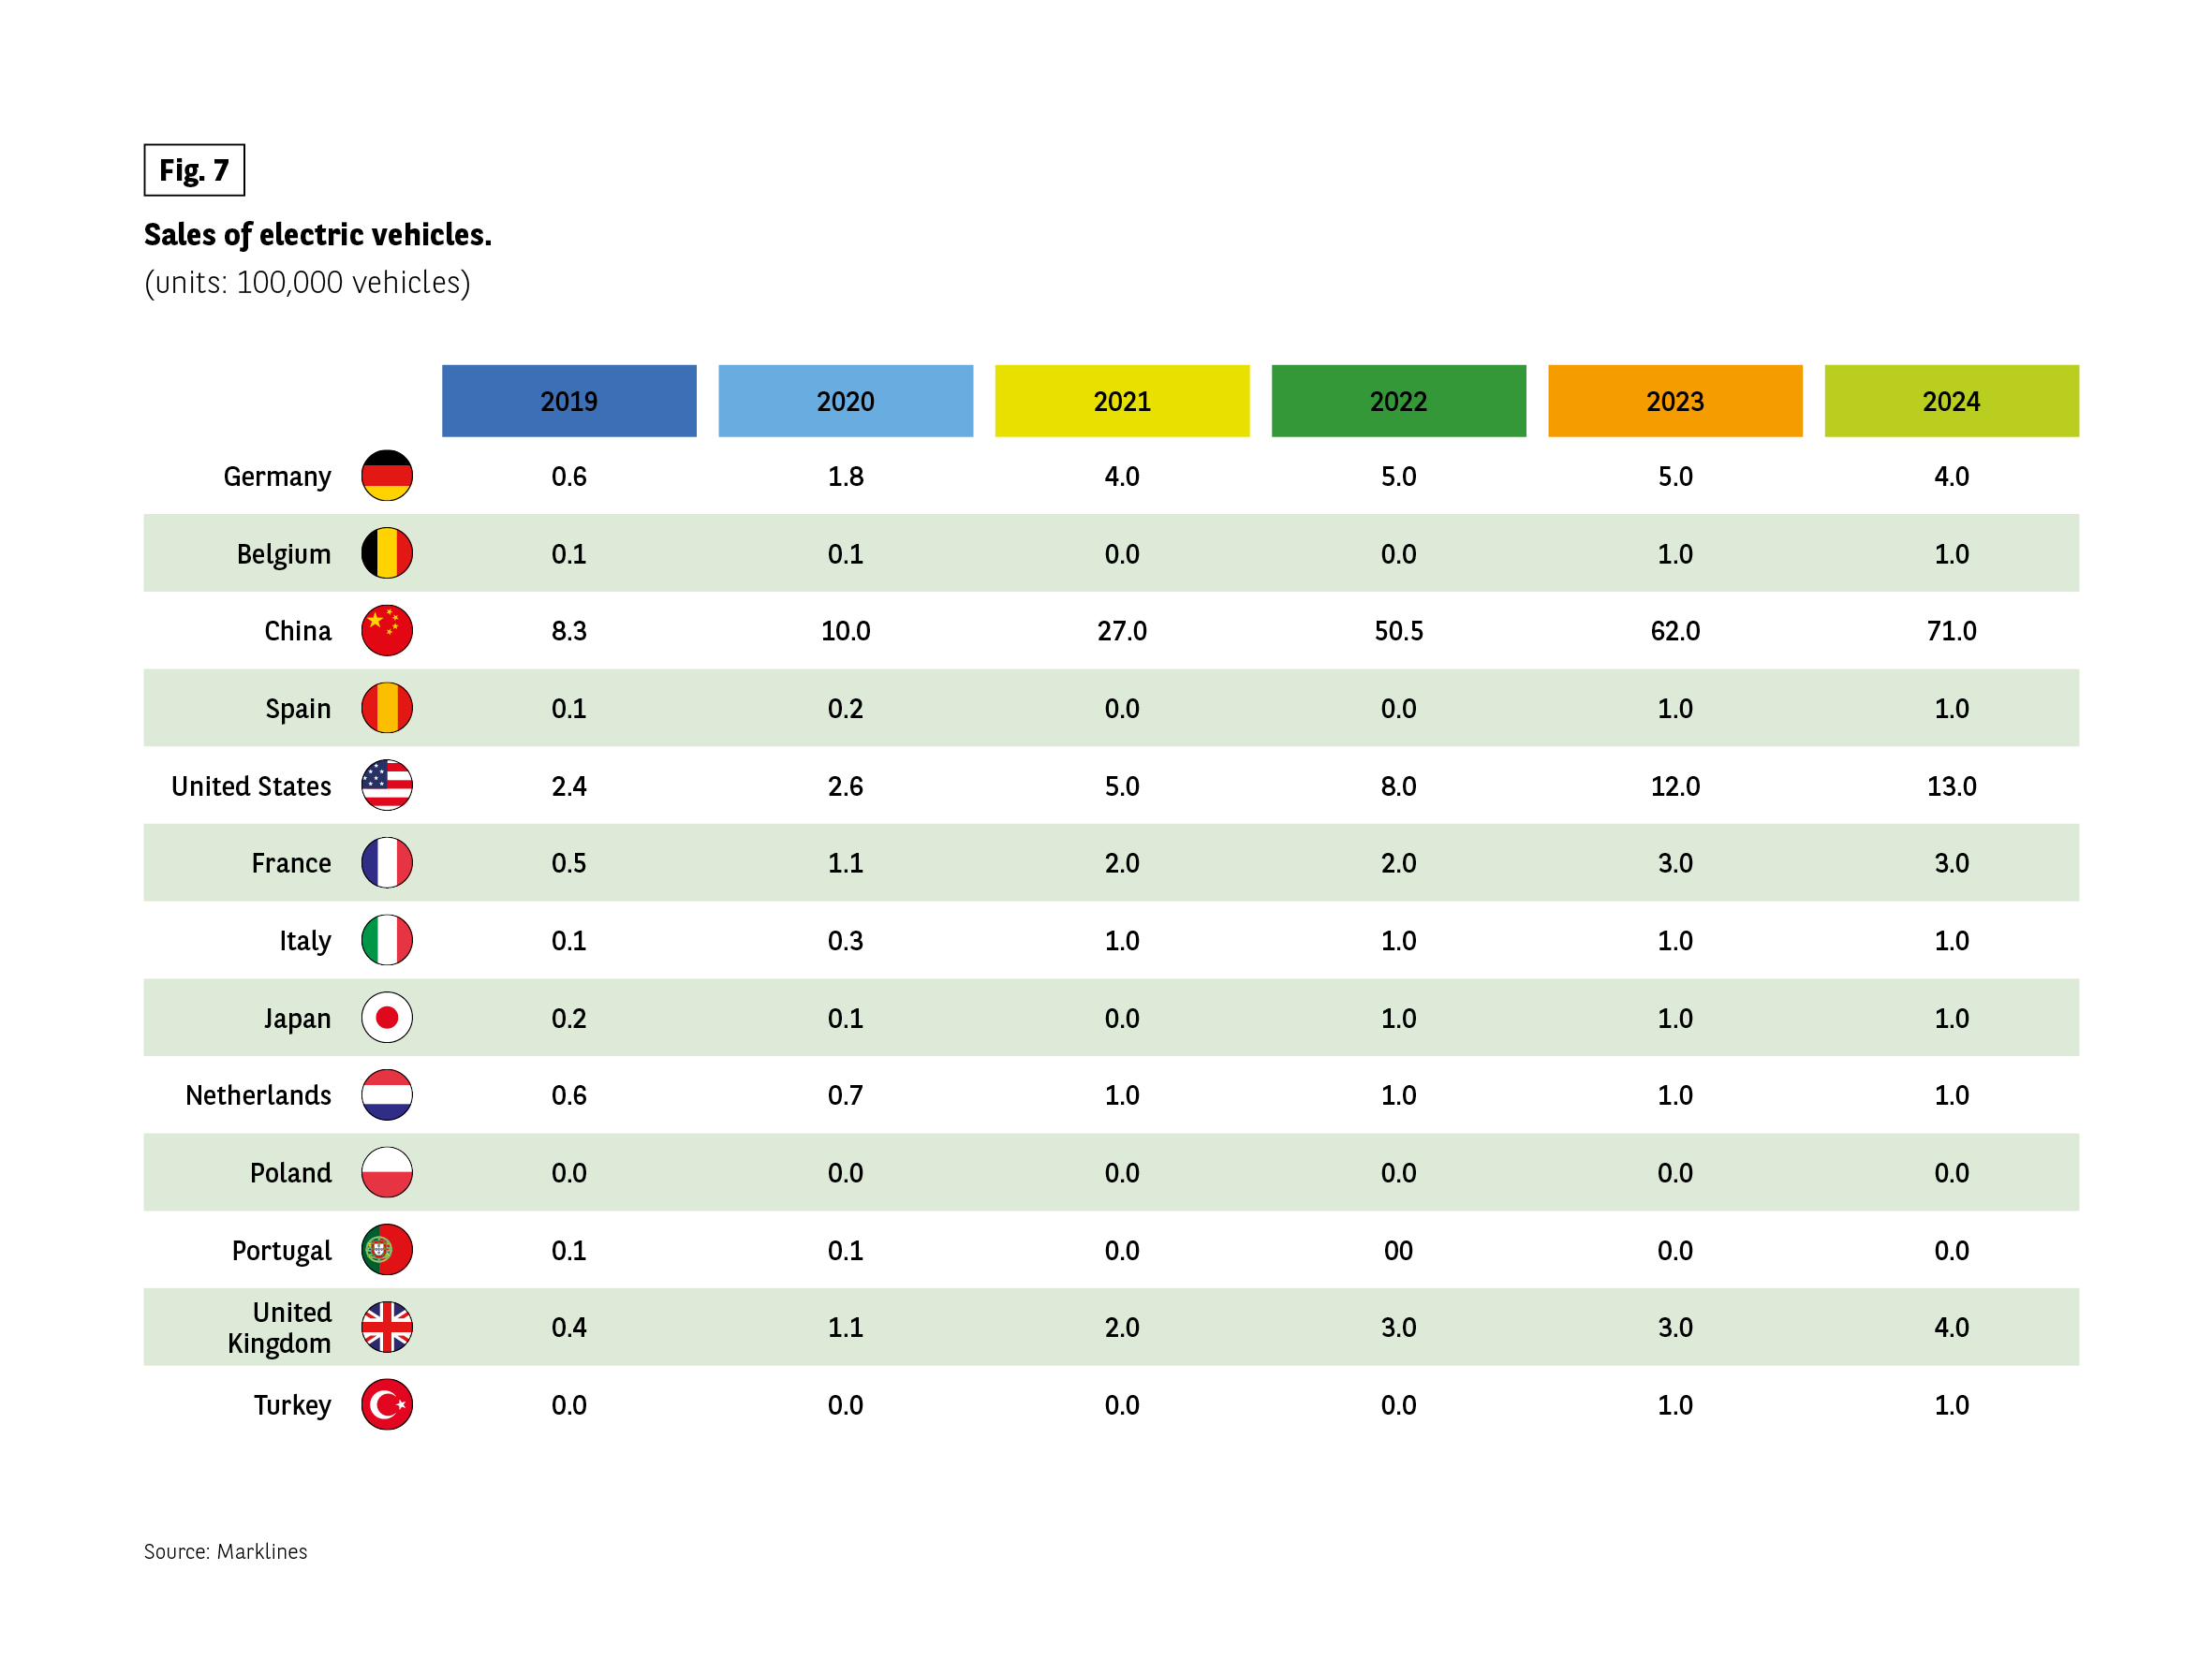 The table shows electric vehicle sales in units of 100,000 for 13 countries from 2019 to 2024.
Germany: 0.6; 1.8; 4.0; 5.0; 5.0; 4.0.
Belgium: 0.1; 0.1; 0.0; 0.0; 1.0; 1.0.
China: 8.3; 10.0; 27.0; 50.5; 62.0; 71.0.
Spain: 0.1; 0.2; 0.0; 0.0; 1.0; 1.0.
United States: 2.4; 2.6; 5.0; 8.0; 12.0; 13.0.
France: 0.5; 1.1; 2.0; 2.0; 3.0; 3.0.
Italy: 0.1; 0.3; 1.0; 1.0; 1.0; 1.0.
Japan: 0.2; 0.1; 0.0; 1.0; 1.0; 1.0.
Netherlands: 0.6; 0.7; 1.0; 1.0; 1.0; 1.0.
Poland: 0.0 each year.
Portugal: 0.1; 0.1; 0.0; 0.0; 0.0; 0.0.
United Kingdom: 0.4; 1.1; 2.0; 3.0; 3.0; 4.0.
Turkey: 0.0 until 2022 then 1.0 in 2023 and 2024.
Source: Marklines.
The table shows electric vehicle sales in units of 100,000 for 13 countries from 2019 to 2024.
Germany: 0.6; 1.8; 4.0; 5.0; 5.0; 4.0.
Belgium: 0.1; 0.1; 0.0; 0.0; 1.0; 1.0.
China: 8.3; 10.0; 27.0; 50.5; 62.0; 71.0.
Spain: 0.1; 0.2; 0.0; 0.0; 1.0; 1.0.
United States: 2.4; 2.6; 5.0; 8.0; 12.0; 13.0.
France: 0.5; 1.1; 2.0; 2.0; 3.0; 3.0.
Italy: 0.1; 0.3; 1.0; 1.0; 1.0; 1.0.
Japan: 0.2; 0.1; 0.0; 1.0; 1.0; 1.0.
Netherlands: 0.6; 0.7; 1.0; 1.0; 1.0; 1.0.
Poland: 0.0 each year.
Portugal: 0.1; 0.1; 0.0; 0.0; 0.0; 0.0.
United Kingdom: 0.4; 1.1; 2.0; 3.0; 3.0; 4.0.
Turkey: 0.0 until 2022 then 1.0 in 2023 and 2024.
Source: Marklines.
The main points of the Draghi report for the automotive industry
The report on the future of European competitiveness was presented by Mario Draghi to Ursula von der Leyen, President of the European Commission, on 9 September 2024. It contains 170 proposals, several of which concern the automotive sector.
- Implementation of a Europe-wide plan to increase coordination in the value chain.
- Better coherence and predictability of regulations proportionate to the objectives pursued.
- Technology-neutral approach.
- A coherent digital policy for the automotive sector.
- Mobilising European savings to finance the automotive industry.
- Mandatory percentage of local content.