The frustration is palpable


CONSUMERS OFTEN STRUGGLE TO BUY WHAT THEY WANT
Budgetary constraints that put the brakes on spending not only generate disappointment, but also a deep sense of frustration. 86% of Europeans have experienced the frustrationof not being able to afford what they want (Fig. 17). If we focus on specific timeframes, we can observe that almost a third of consumers are frustrated on a weekly basis and more than half are frustrated at least once a month. Once again, Romania, Portugal and Poland are the countries in which the dissatisfaction is most pronounced, while in Belgium, France and the UK, the frustration is less perceptible.
On this topic, there is a clear generational divide, with younger people lamenting their inability to fully unleash their consumerist urges.
Fig 17 – Frustration at not being able to afford a desired purchase
Download this infographic for your presentations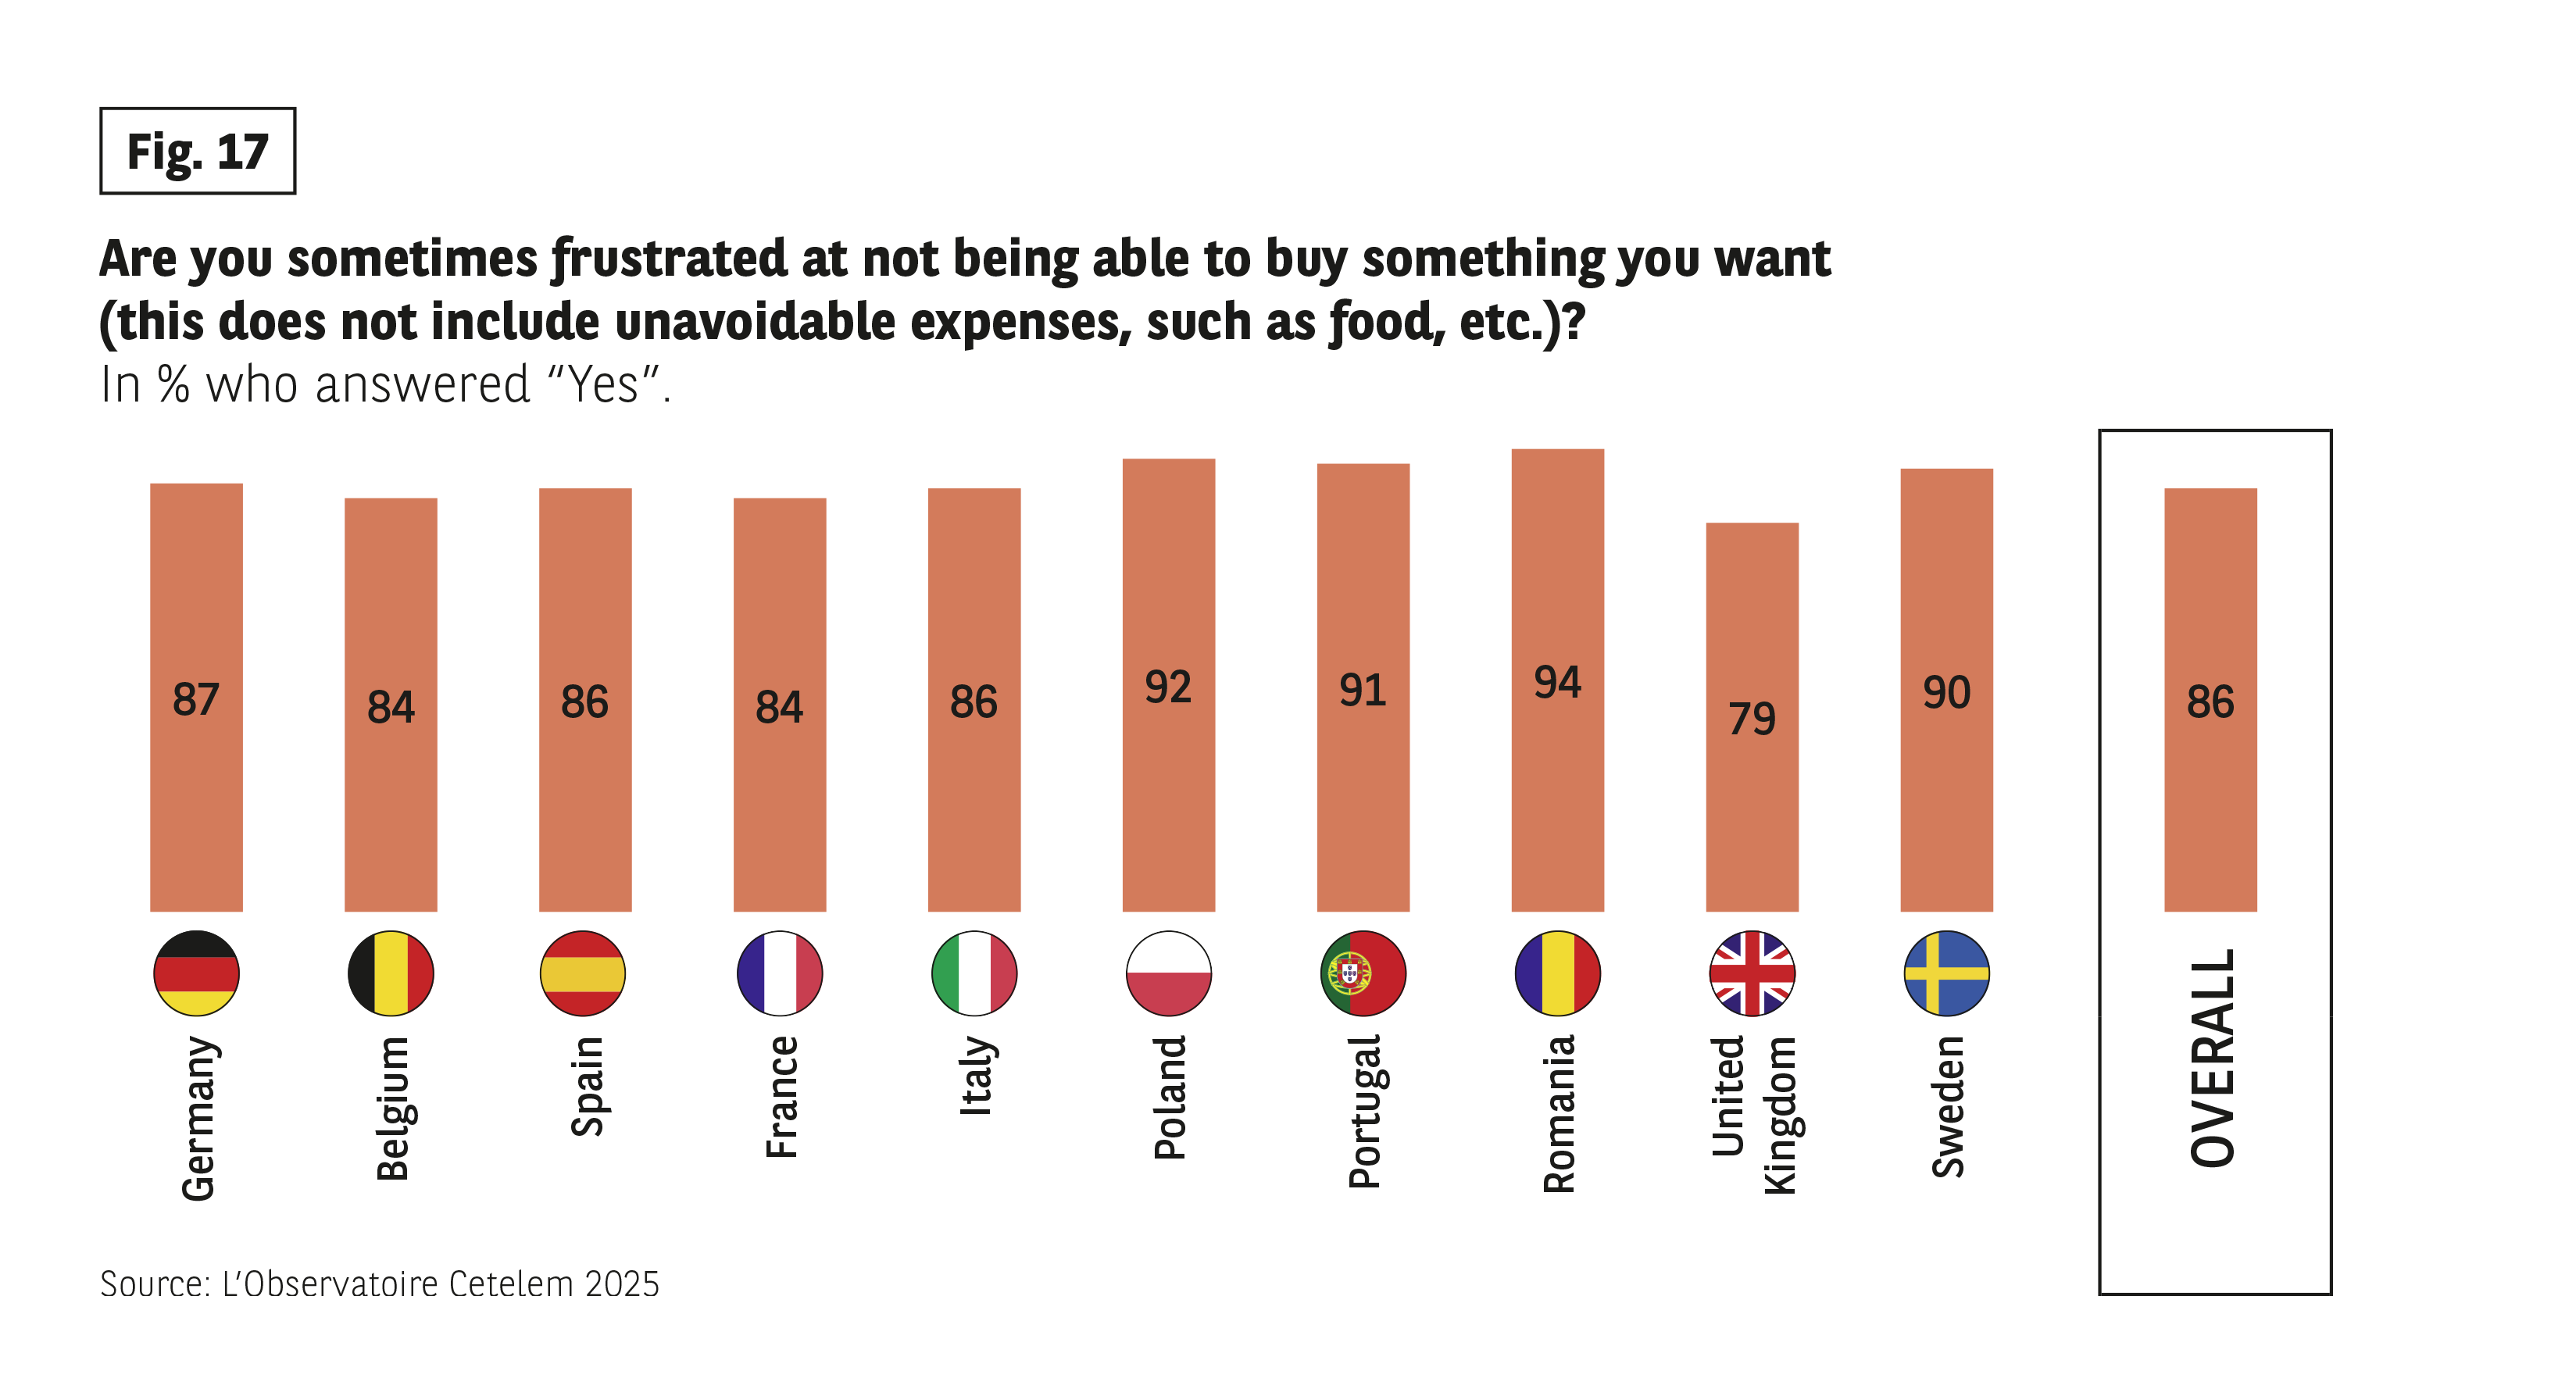 Question: “Do you ever get frustrated that you can’t buy something you want?”
Data (% saying “Yes”):
• Germany: 87
• Belgium: 84
• Spain: 86
• France: 84
• Italy: 86
• Poland: 92
• Portugal: 91
• Romania: 94
• United Kingdom: 79
• Sweden: 90
• Overall: 86
Source: The Cetelem 2025 Observatory.
Question: “Do you ever get frustrated that you can’t buy something you want?”
Data (% saying “Yes”):
• Germany: 87
• Belgium: 84
• Spain: 86
• France: 84
• Italy: 86
• Poland: 92
• Portugal: 91
• Romania: 94
• United Kingdom: 79
• Sweden: 90
• Overall: 86
Source: The Cetelem 2025 Observatory.
FINANCIAL CONSTRAINTS INEVITABLY CURB SPENDING
No consumption category can escape the budgetary constraints that lead to frustration. Of course, generally speaking, the higher the price of a product or service, the more likely it is that people will forego its purchase due to financial constraints. This explains why spending on travel, furniture, electrical appliances or vehicles is usually halted by a lack of funds. However, people often decide against going out or purchasing an entertainment product for similar reasons.(Fig. 18).
Italy and Portugal are the countries in which consumers forego the highest number of items put to them by this survey. It is also worth noting that the French are much more likely than average to have foregone food purchases for financial reasons.
Meanwhile, the generational differences are very similar to those uncovered by the previous question, with young people being forced to keep their wallets shut more often than their elders, much to their chagrin.
Fig 18 – Giving up on a purchase: budgetary constraint or conviction/values?
Download this infographic for your presentations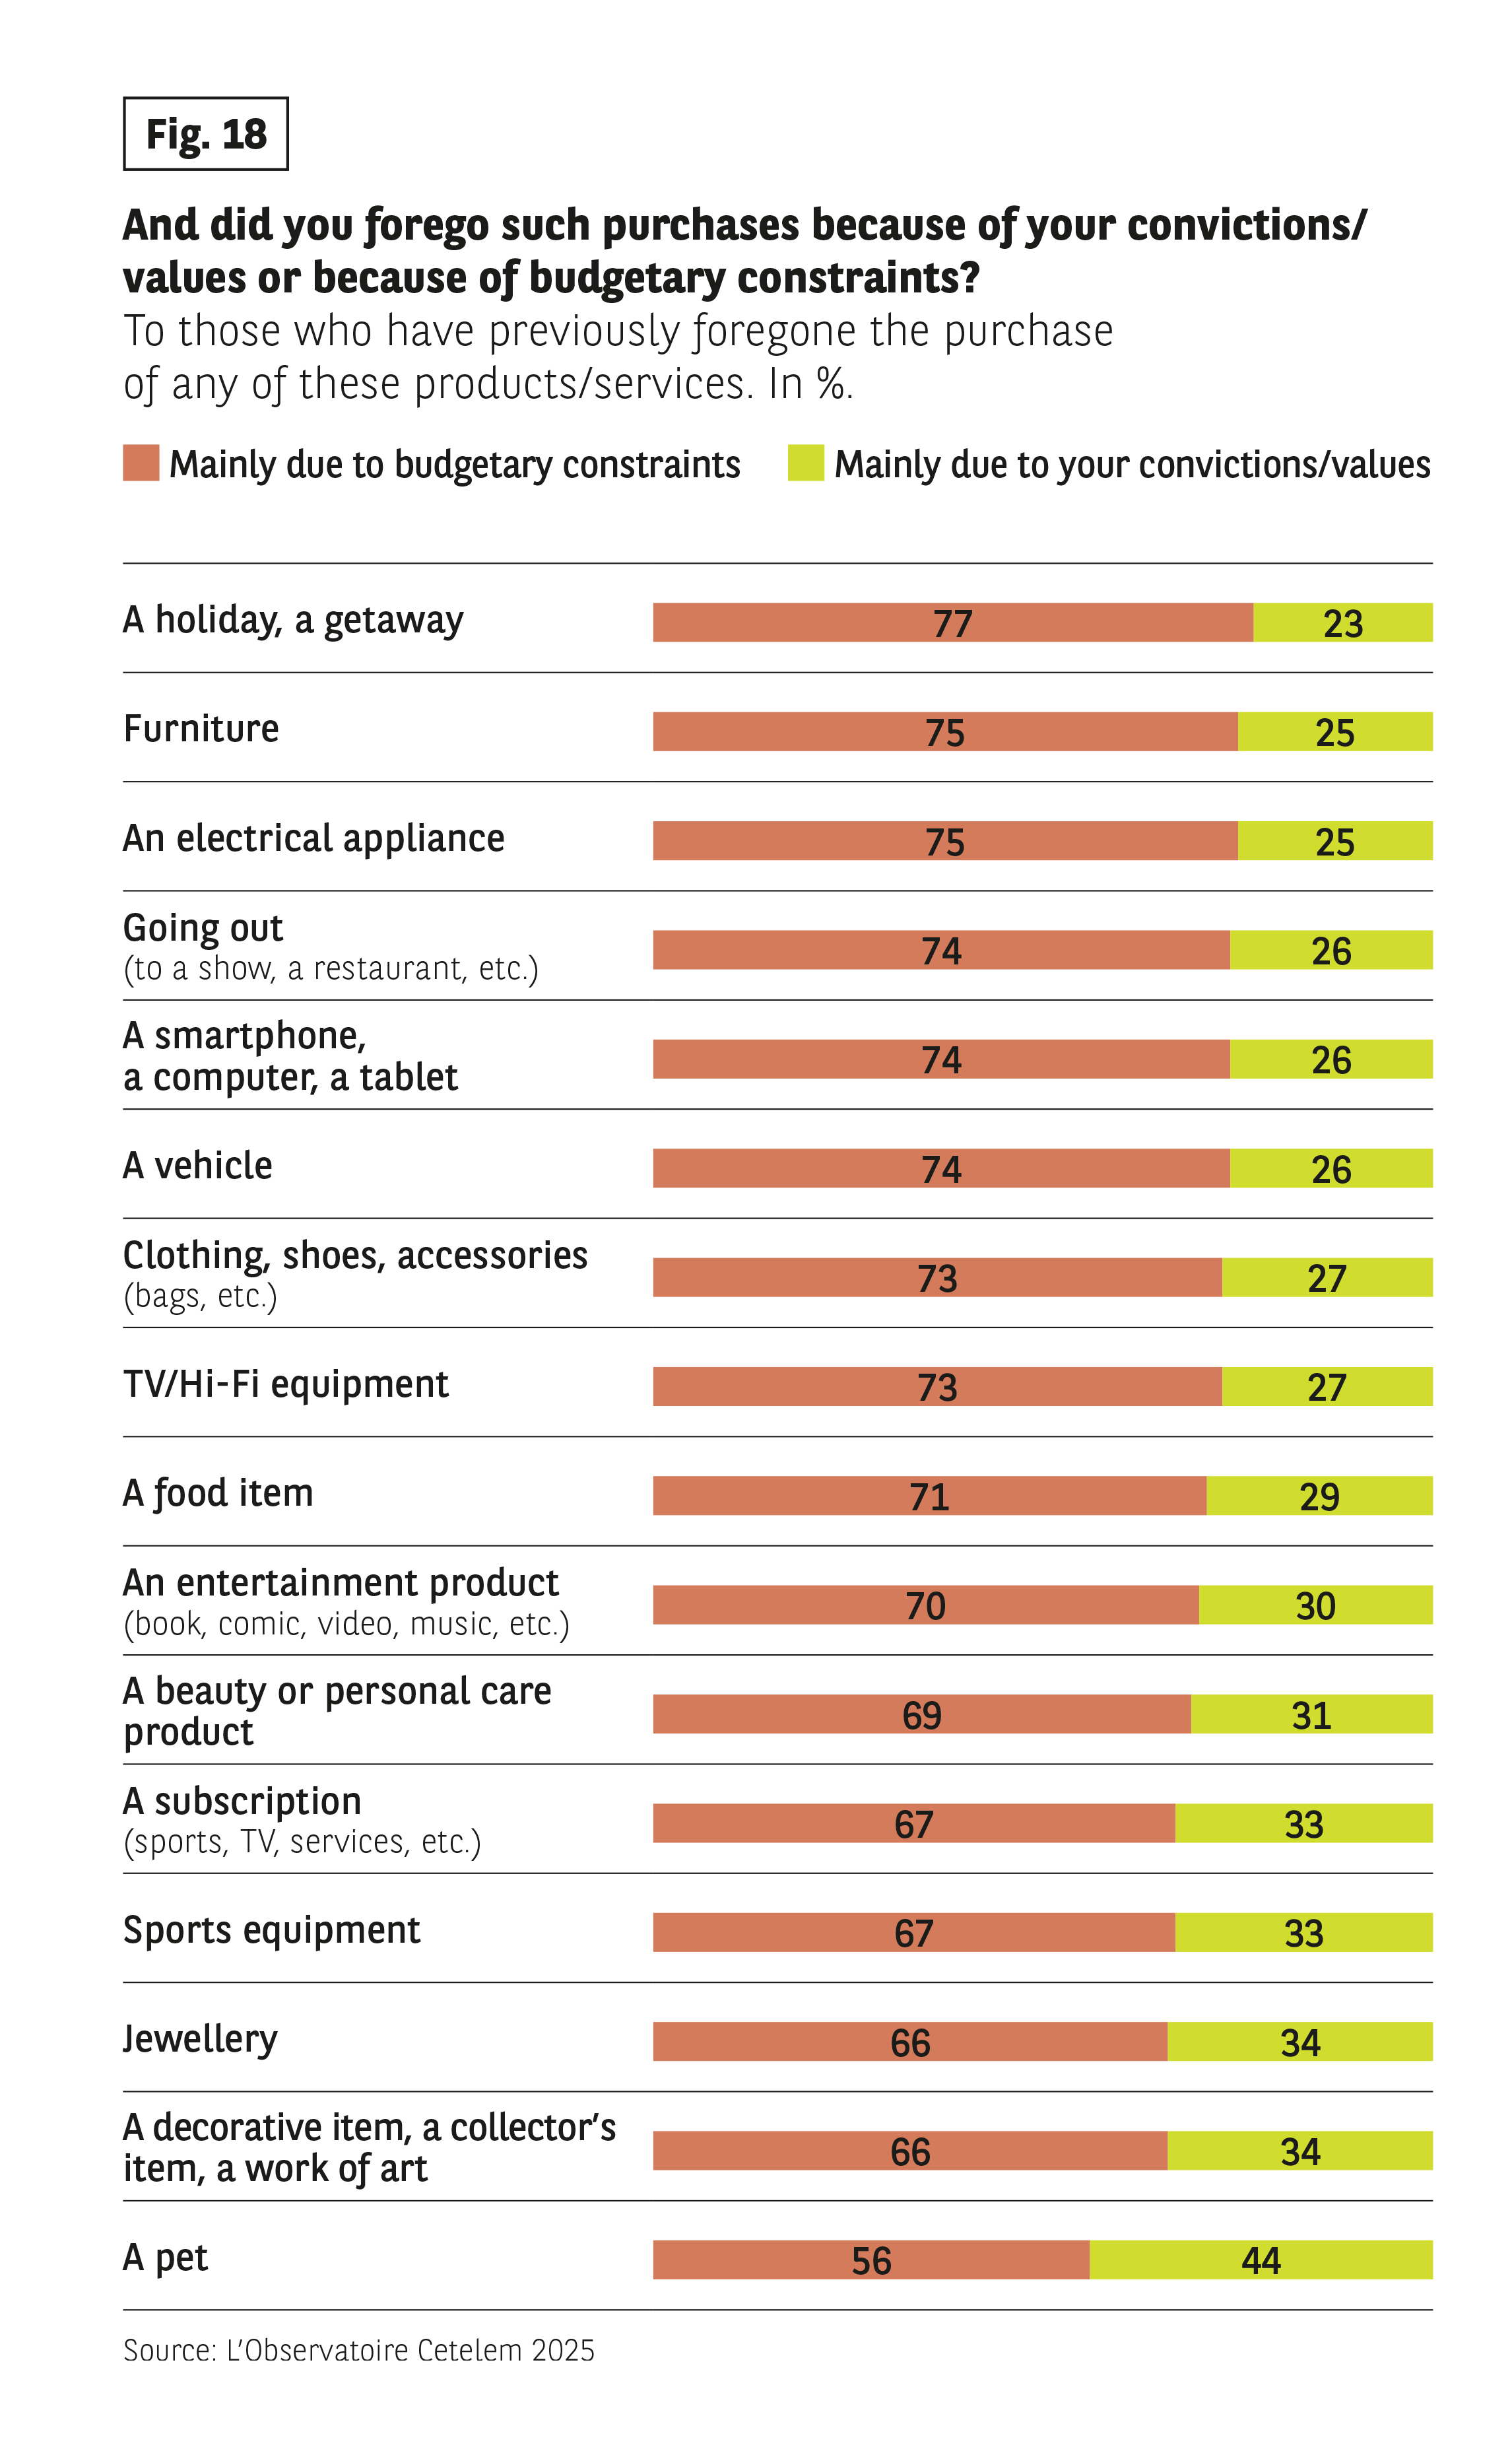 Question: “Did you give it up more out of conviction/values or rather out of budgetary constraints?”
Data (% budget constraint / % conviction):
• Travel/getaway: 77 / 23
• Furniture : 75 / 25
• Appliances: 75 / 25
• Release: 74 / 26
• Smartphone / computer / tablet: 74 / 26
• Vehicle: 74 / 26
• Clothing / accessories: 73 / 27
• TV / hi-fi equipment : 73 / 27
• Food Product: 71 / 29
• Entertainment: 70 / 30
• Beauty / care product: 69 / 31
• Subscription: 67 / 33
• Sports equipment: 67 / 33
• Jewel: 66 / 34
• Decorative object / art: 66 / 34
• Pet: 56 / 44
Source: The Cetelem 2025 Observatory.
Question: “Did you give it up more out of conviction/values or rather out of budgetary constraints?”
Data (% budget constraint / % conviction):
• Travel/getaway: 77 / 23
• Furniture : 75 / 25
• Appliances: 75 / 25
• Release: 74 / 26
• Smartphone / computer / tablet: 74 / 26
• Vehicle: 74 / 26
• Clothing / accessories: 73 / 27
• TV / hi-fi equipment : 73 / 27
• Food Product: 71 / 29
• Entertainment: 70 / 30
• Beauty / care product: 69 / 31
• Subscription: 67 / 33
• Sports equipment: 67 / 33
• Jewel: 66 / 34
• Decorative object / art: 66 / 34
• Pet: 56 / 44
Source: The Cetelem 2025 Observatory.