
Attached and satisfied: Europeans cherish their homes


 8 min
reading time
Before examining how space is shared, it is worth looking at how Europeans view their homes. The overall picture is one of strong emotional ties, positive perceptions and high, stable levels of satisfaction. Yet beneath this uniform surface lies a clear divide, one dictated less by nationality than by tenure, age and property type.
HOMEOWNERSHIP DRIVES EMOTIONAL CONNECTION
Europeans remain overwhelmingly attached to their homes: 86% say as much, with nearly half describing themselves as “very attached”. This sense of connection varies by individual profile, strengthening significantly with ownership, rising from 78% among tenants to over 90% among homeowners. Country-level differences remain modest, though Germany, the UK and France sit at the bottom of the scale, reflecting their status as the three markets with the lowest homeownership rates in the survey sample.
Fig. 1 – Attachment to one’s home, by housing tenure and country
Download this infographic for your presentations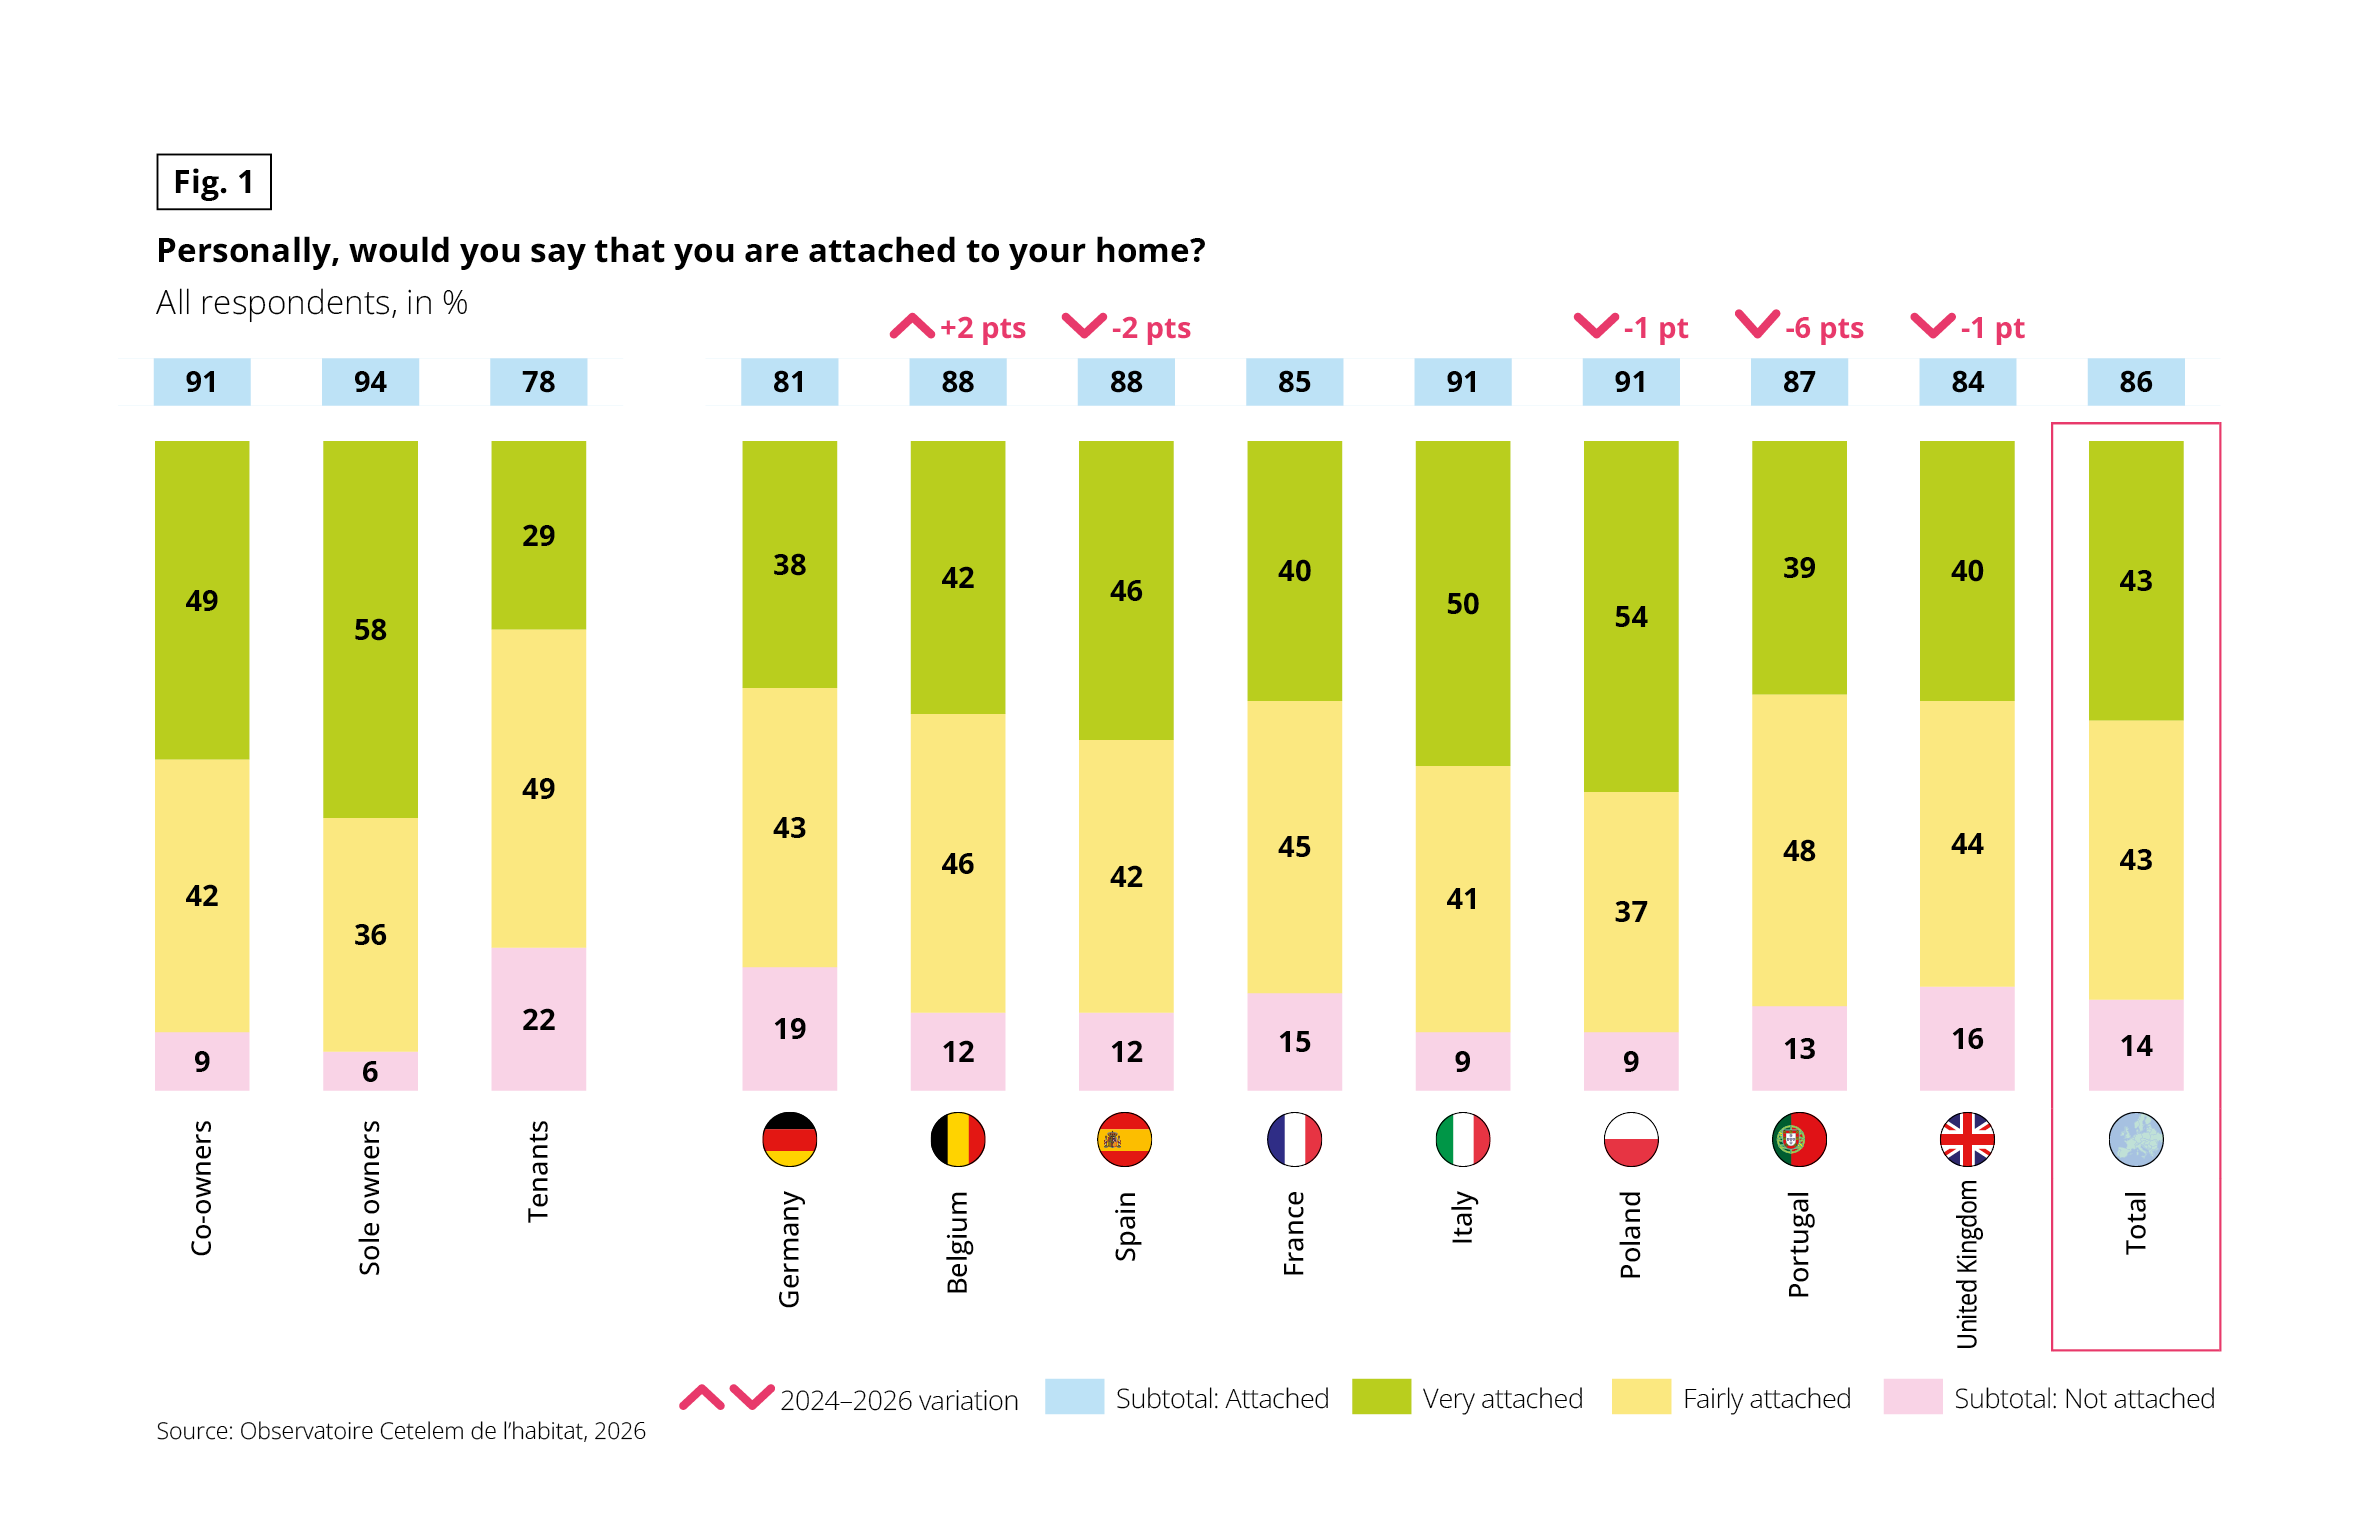 Stacked vertical bar chart. Question: “Personally, would you say that you are attached to your home?” Base: all respondents, in %. Each column splits into “Very attached”, “Fairly attached” and “Not attached”. The subtotal “Attached” (very plus fairly) is shown above each column. For some countries, the 2024–2026 variation of this subtotal, in percentage points, is also shown. Source: Observatoire Cetelem de l’habitat, 2026.
Data in the form very attached / fairly attached / not attached (attached subtotal):
By housing tenure:
• Co-owners: 49 / 42 / 9 (91)
• Sole owners: 58 / 36 / 6 (94)
• Tenants: 29 / 49 / 22 (78)
By country:
• Germany: 38 / 43 / 19 (81), no variation shown
• Belgium: 42 / 46 / 12 (88), +2 pts
• Spain: 46 / 42 / 12 (88), −2 pts
• France: 40 / 45 / 15 (85), no variation shown
• Italy: 50 / 41 / 9 (91), no variation shown
• Poland: 54 / 37 / 9 (91), −1 pt
• Portugal: 39 / 48 / 13 (87), −6 pts
• United Kingdom: 40 / 44 / 16 (84), −1 pt
• Total: 43 / 43 / 14 (86), no variation shown
Sole owners are the most attached (94%) and tenants the least (78%). Among countries, Italy and Poland are the highest (91% each) and Germany the lowest (81%). Portugal records the largest decline (−6 pts).
Over a two-year period, attachment to the home remains broadly stable, with one notable exception: Portugal has fallen by 6 percentage points (from 93% to 87%). This drop tracks a recent decline in the country’s homeownership rate, driven by the end of a decade of ultra-cheap credit and home prices that have more than doubled since 2014 (the steepest increase in our sample) while incomes rose by just 33% over the same period, making homeownership increasingly elusive for younger generations.
This divide across housing tenures, alongside the trend in Portugal, points to the same underlying reality: it is not national culture that shapes emotional attachment, but ownership status. Above all, we cherish what we own.
Fig. 2 – Homeownership rate in 2025
Download this infographic for your presentations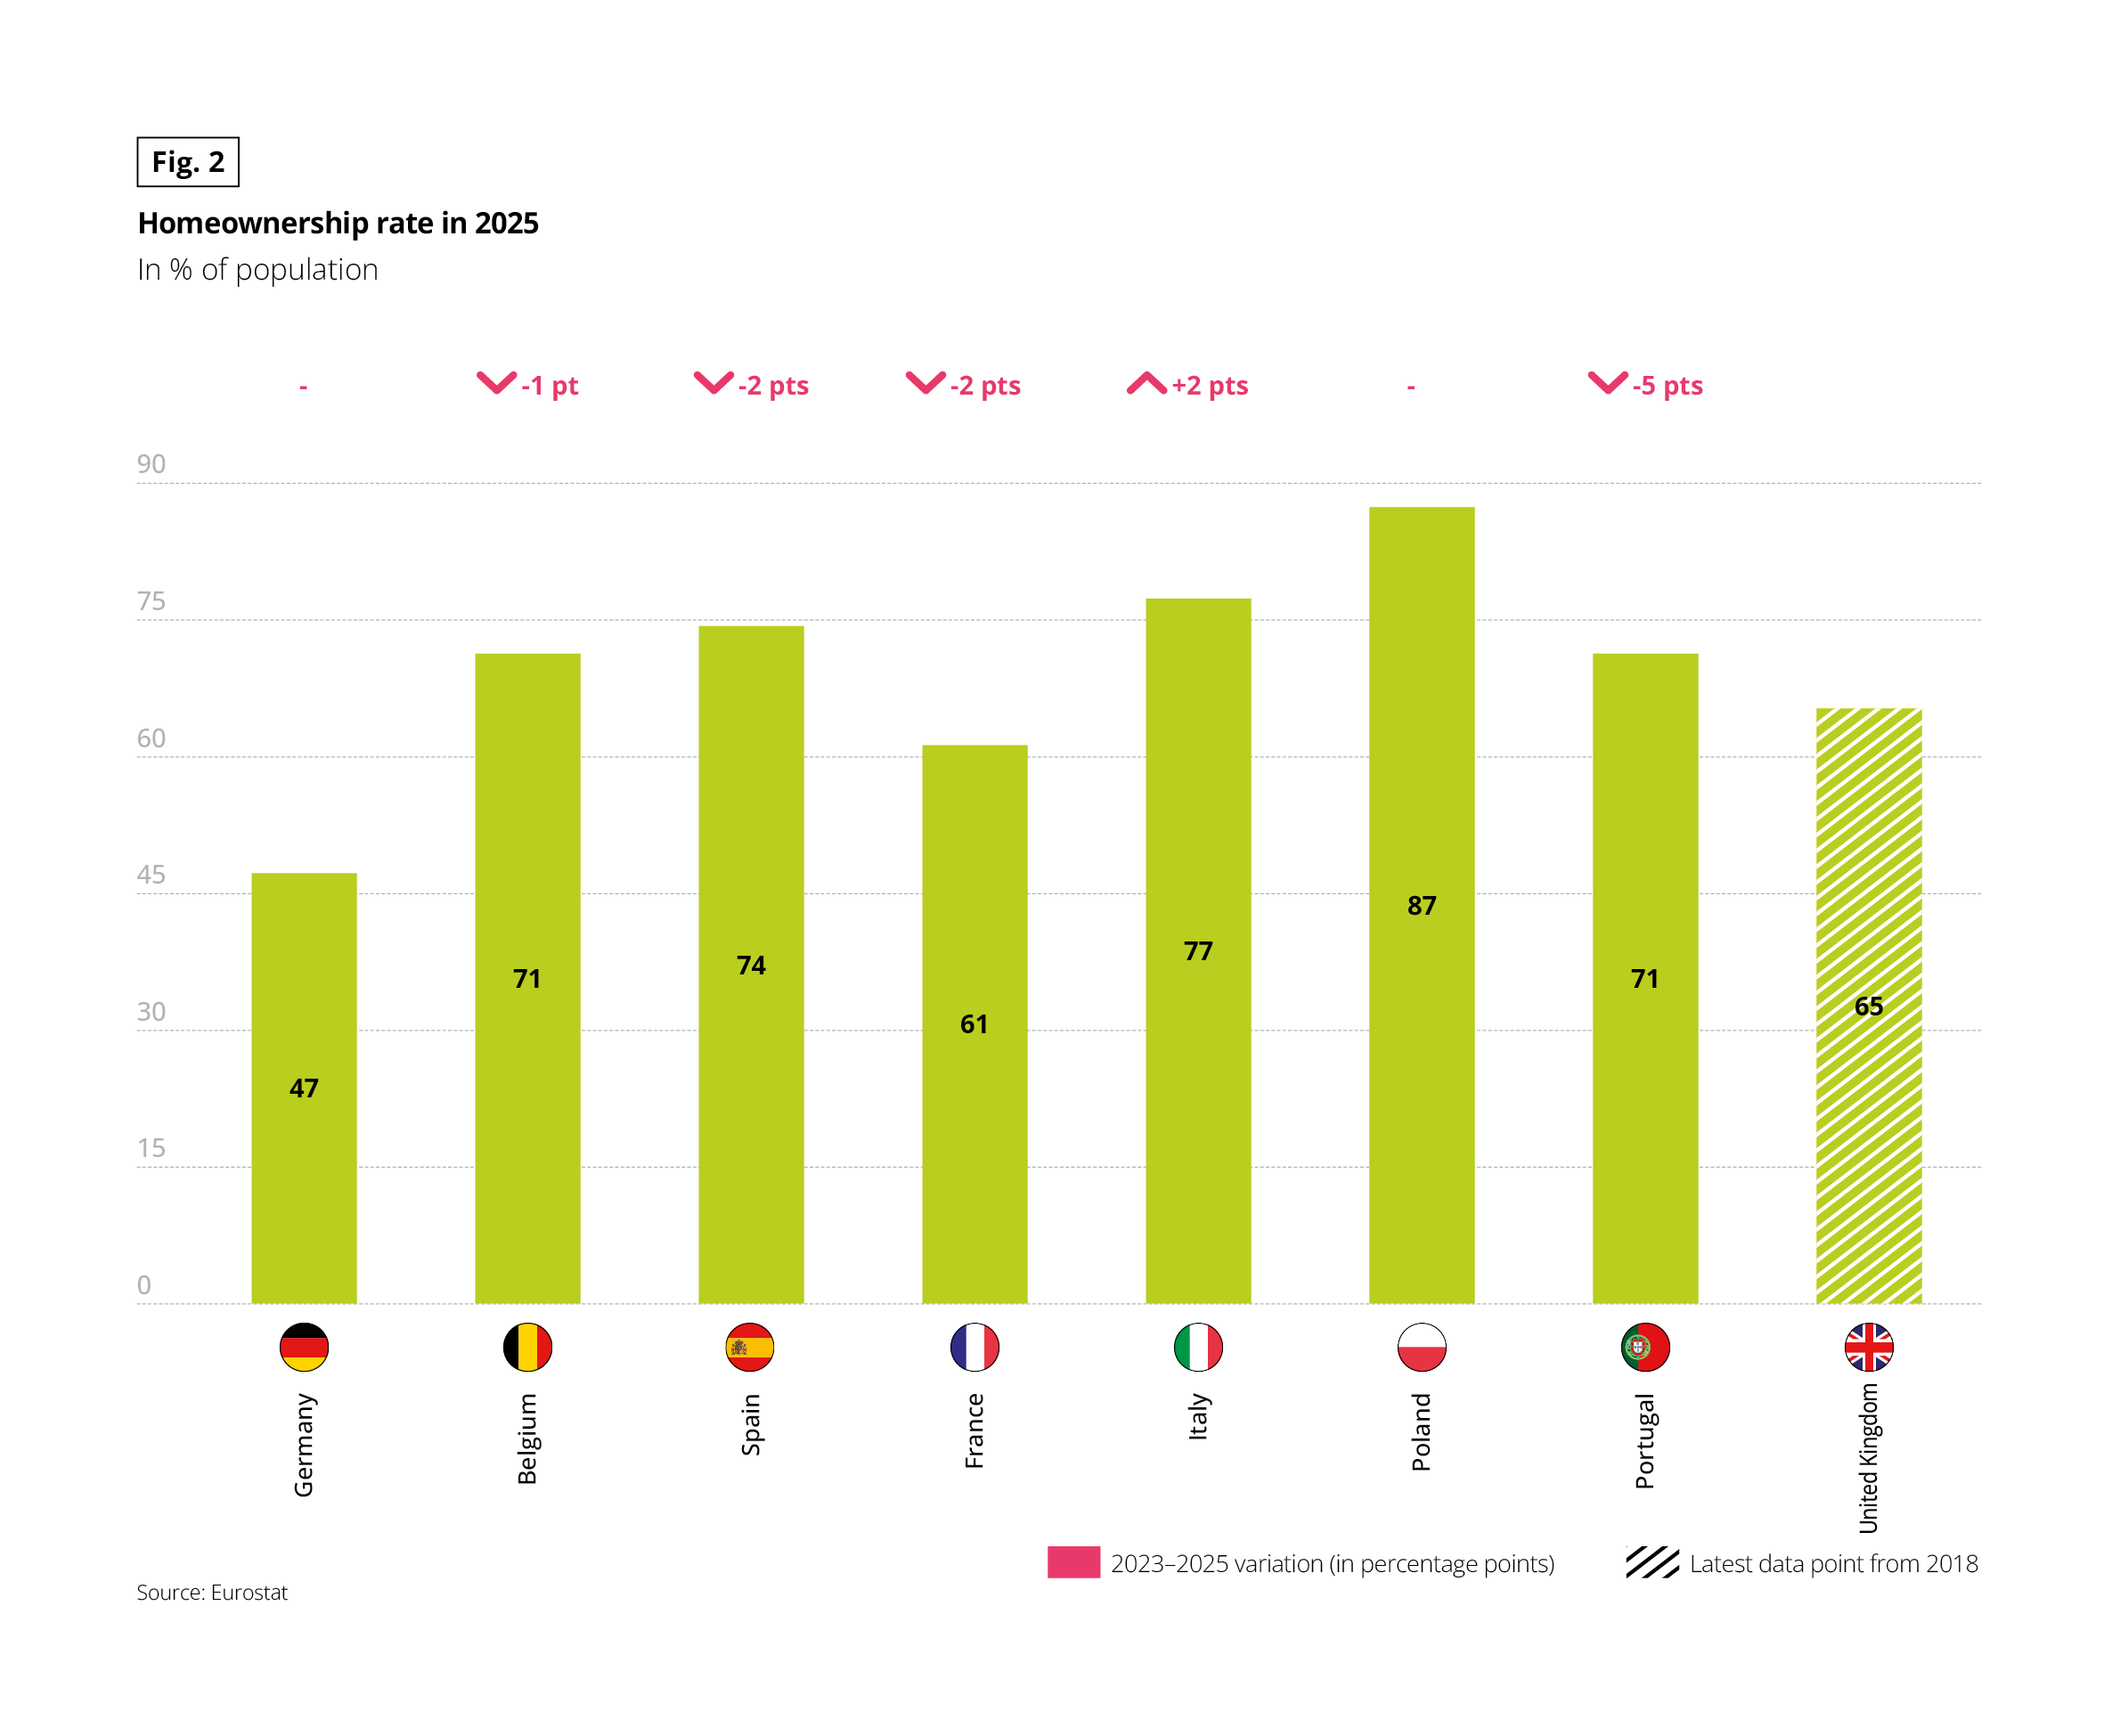 Vertical bar chart. Unit: % of population. Above each bar, the 2023–2025 variation in percentage points is shown when available. The United Kingdom bar is hatched: its latest data point is from 2018. Source: Eurostat.
Data by country, in the form rate (2023–2025 variation):
• Germany: 47% (no variation shown)
• Belgium: 71% (−1 pt)
• Spain: 74% (−2 pts)
• France: 61% (−2 pts)
• Italy: 77% (+2 pts)
• Poland: 87% (no variation shown)
• Portugal: 71% (−5 pts)
• United Kingdom: 65% (latest data from 2018, no variation shown)
Poland has the highest homeownership rate and Germany the lowest. Italy is the only country with an increase over 2023–2025, and Portugal has the sharpest decline.
POSITIVE PERCEPTION OF HOUSING ENDURES, BUT PERCEIVED VALUE FOR MONEY DETERIORATES
Europeans describe their homes primarily through a practical, sensory lens. Comfort leads by a wide margin: 9 in 10 consider their home comfortable, ahead of value for money (84%) and the desire to stay long term (81%). This ranking holds true across all demographics, though it is slightly more pronounced among homeowners.
The true divide lies elsewhere: in the perceived temporary nature of the property. Nearly half of all tenants view their home as merely a stepping stone, compared to a third of co-owners and a quarter of house owners. For tenants, housing is not a lifelong project but a transition point, leading to a more limited emotional and financial investment.
Fig. 3 – How respondents describe their home, by housing tenure
Download this infographic for your presentations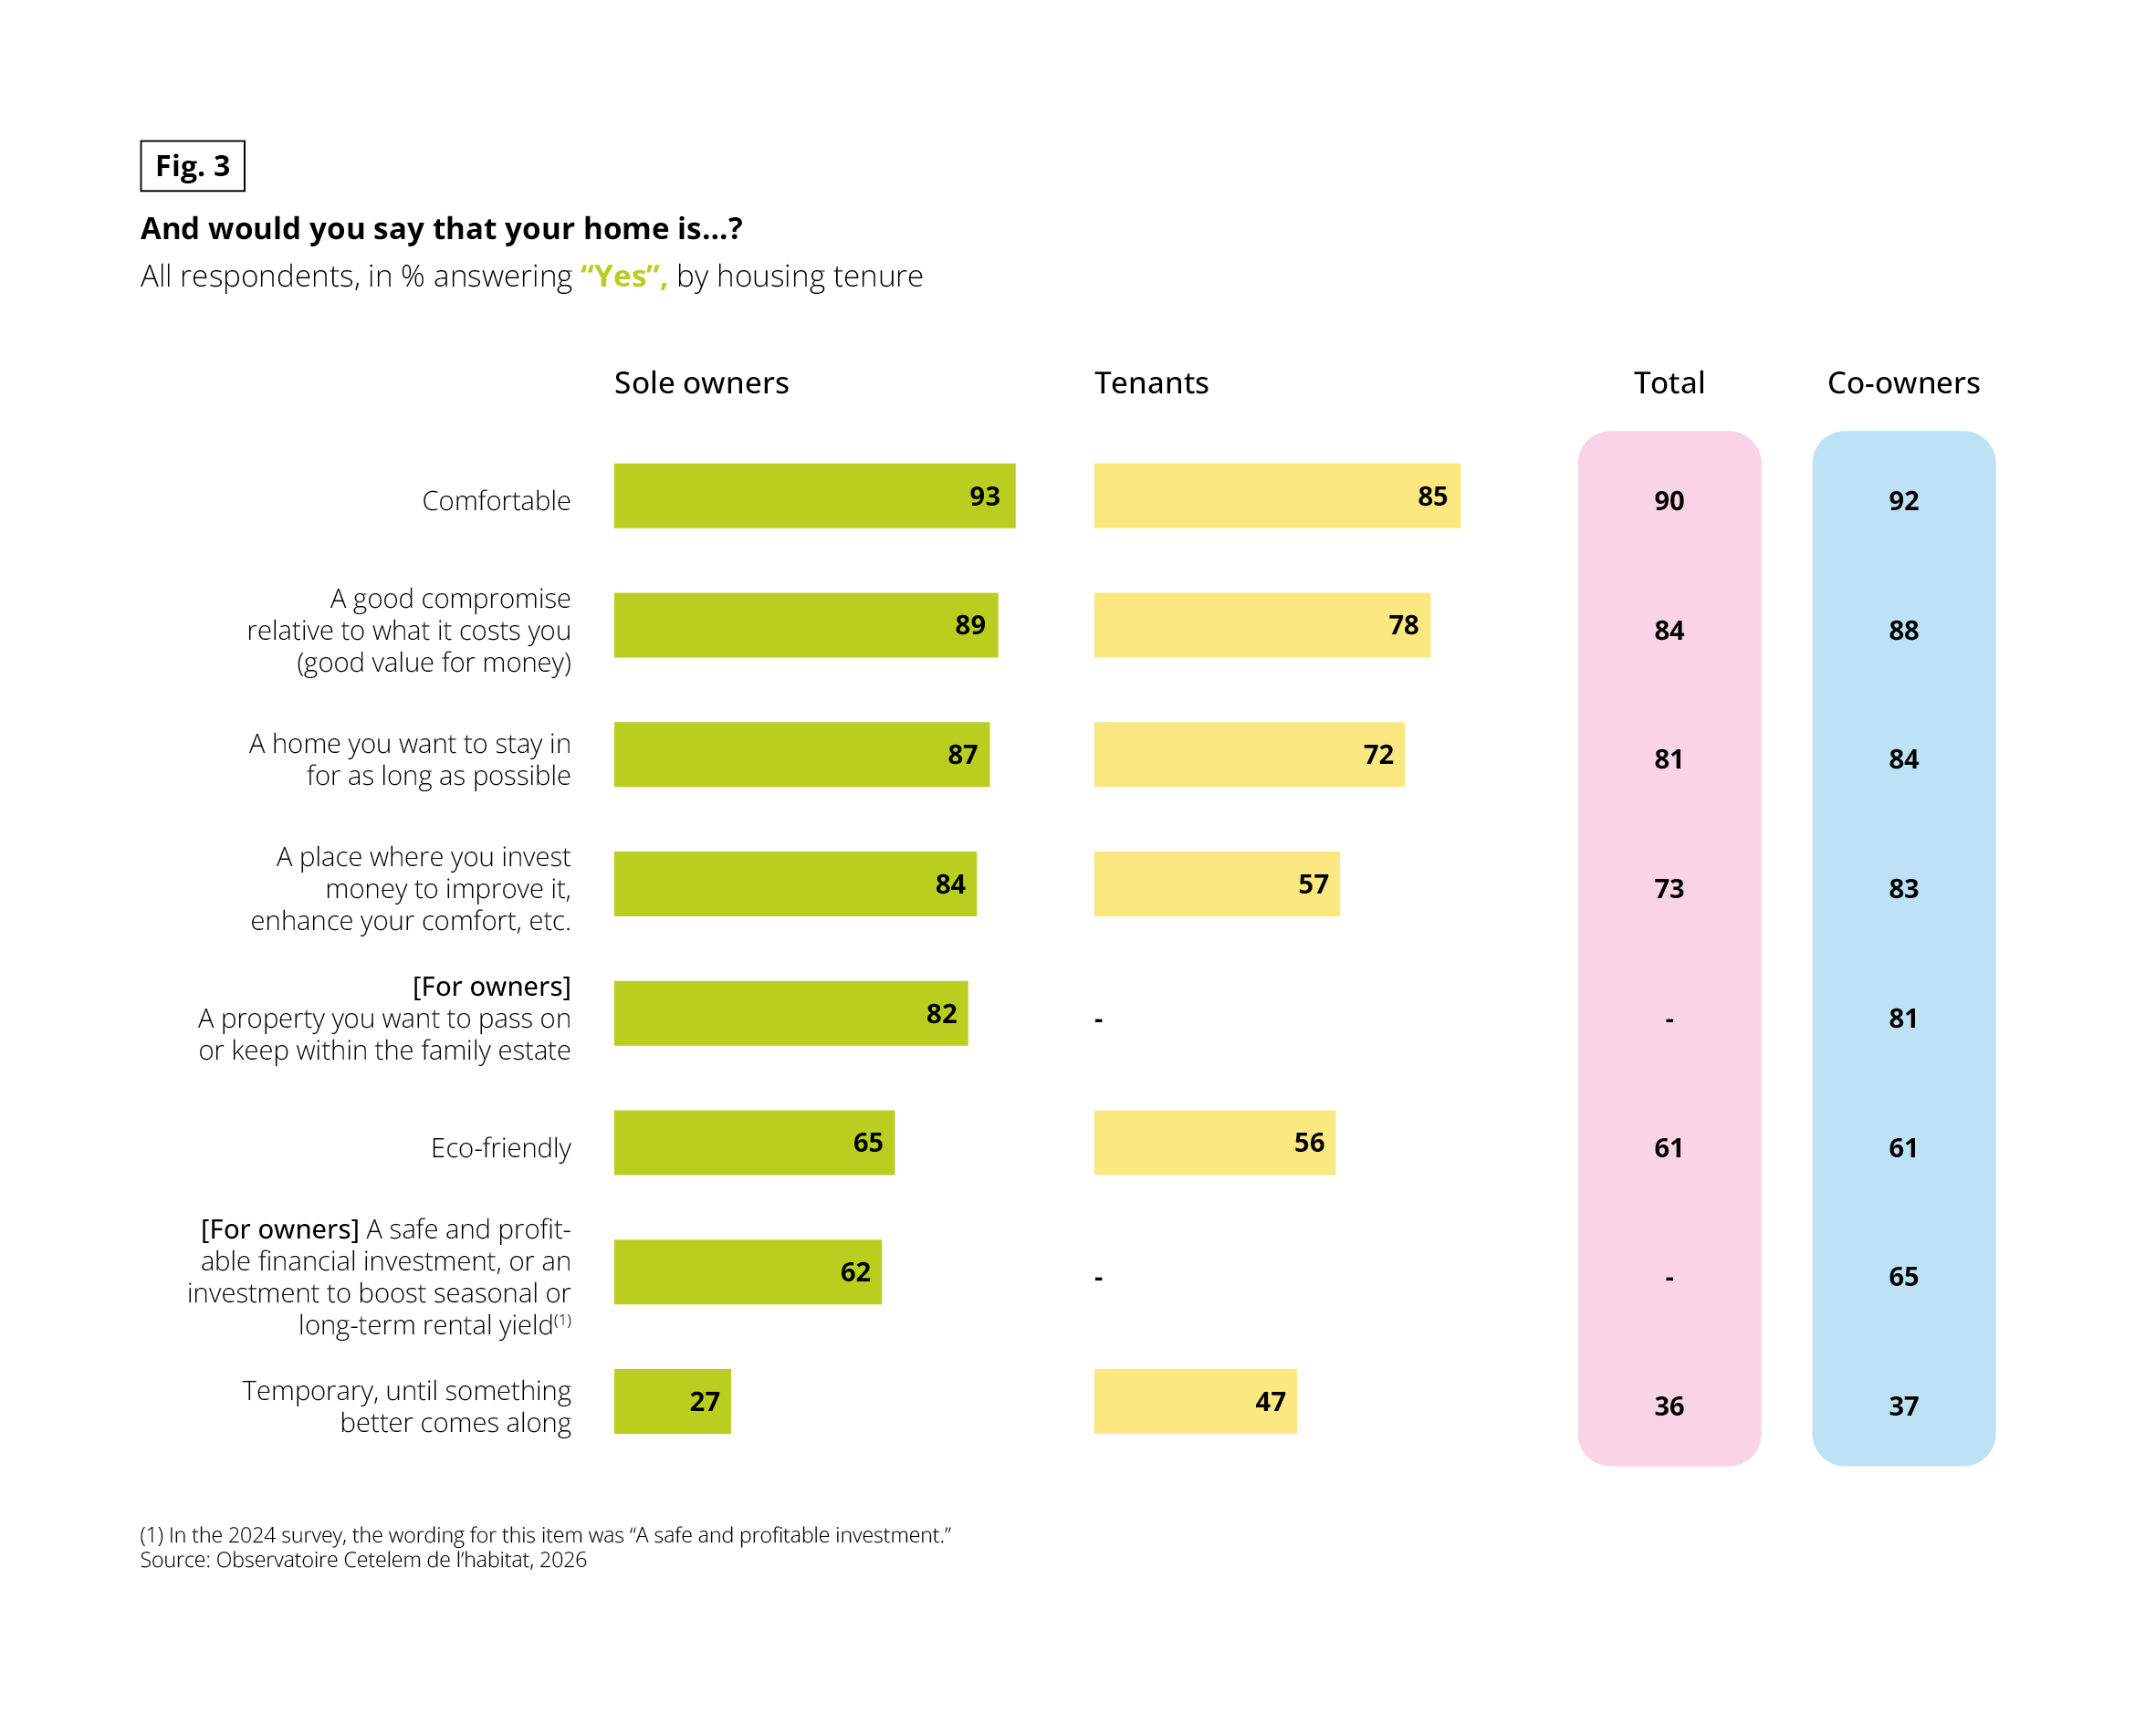 Chart with horizontal bars for sole owners and tenants, plus figures for the total and for co-owners. Question: “And would you say that your home is…?” Base: all respondents, in % answering “Yes”, by housing tenure. Items marked “[For owners]” only have values for owners; for tenants and the total, no value is shown. Source: Observatoire Cetelem de l’habitat, 2026.
Data in the form sole owners / tenants / total / co-owners:
• Comfortable: 93 / 85 / 90 / 92
• A good compromise relative to what it costs you (good value for money): 89 / 78 / 84 / 88
• A home you want to stay in for as long as possible: 87 / 72 / 81 / 84
• A place where you invest money to improve it, enhance your comfort, etc.: 84 / 57 / 73 / 83
• [For owners] A property you want to pass on or keep within the family estate: 82 / no value / no value / 81
• Eco-friendly: 65 / 56 / 61 / 61
• [For owners] A safe and profitable financial investment, or an investment to boost seasonal or long-term rental yield: 62 / no value / no value / 65
• Temporary, until something better comes along: 27 / 47 / 36 / 37
Note: in the 2024 survey, the wording of the financial investment item was “A safe and profitable investment.”
Owners rate their home higher than tenants on every item except “temporary” (27% of sole owners against 47% of tenants). The largest gap is on “a place where you invest money to improve it” (84% against 57%).
Over a two-year period, perceptions of housing remain positive, though two opposing economic trends have emerged: the feeling of getting good value for money has fallen by 4 percentage points (from 88% to 84%), while the proportion of homes viewed as temporary has risen by the same margin (from 32% to 36%). This shift is driven by the growing burden of fixed expenses: as rent, energy bills and insurance absorb an ever-larger share of household budgets, housing is increasingly seen as a forced expenditure and a transitional arrangement, rather than a worthwhile, long-term investment.
A breakdown by country adds nuance to this picture. Perceived comfort has fallen most noticeably in Poland, the only country significantly below the sample average. This reflects the nature of its housing stock, dominated by large housing estates inherited from the socialist era, and an exceptionally high overcrowding rate: nearly a third of Polish homes are considered too small for the number of occupants, compared to roughly 1 in 10 across other surveyed countries (3 times lower).
Fig. 4 – Overcrowding rate in 2025
Download this infographic for your presentations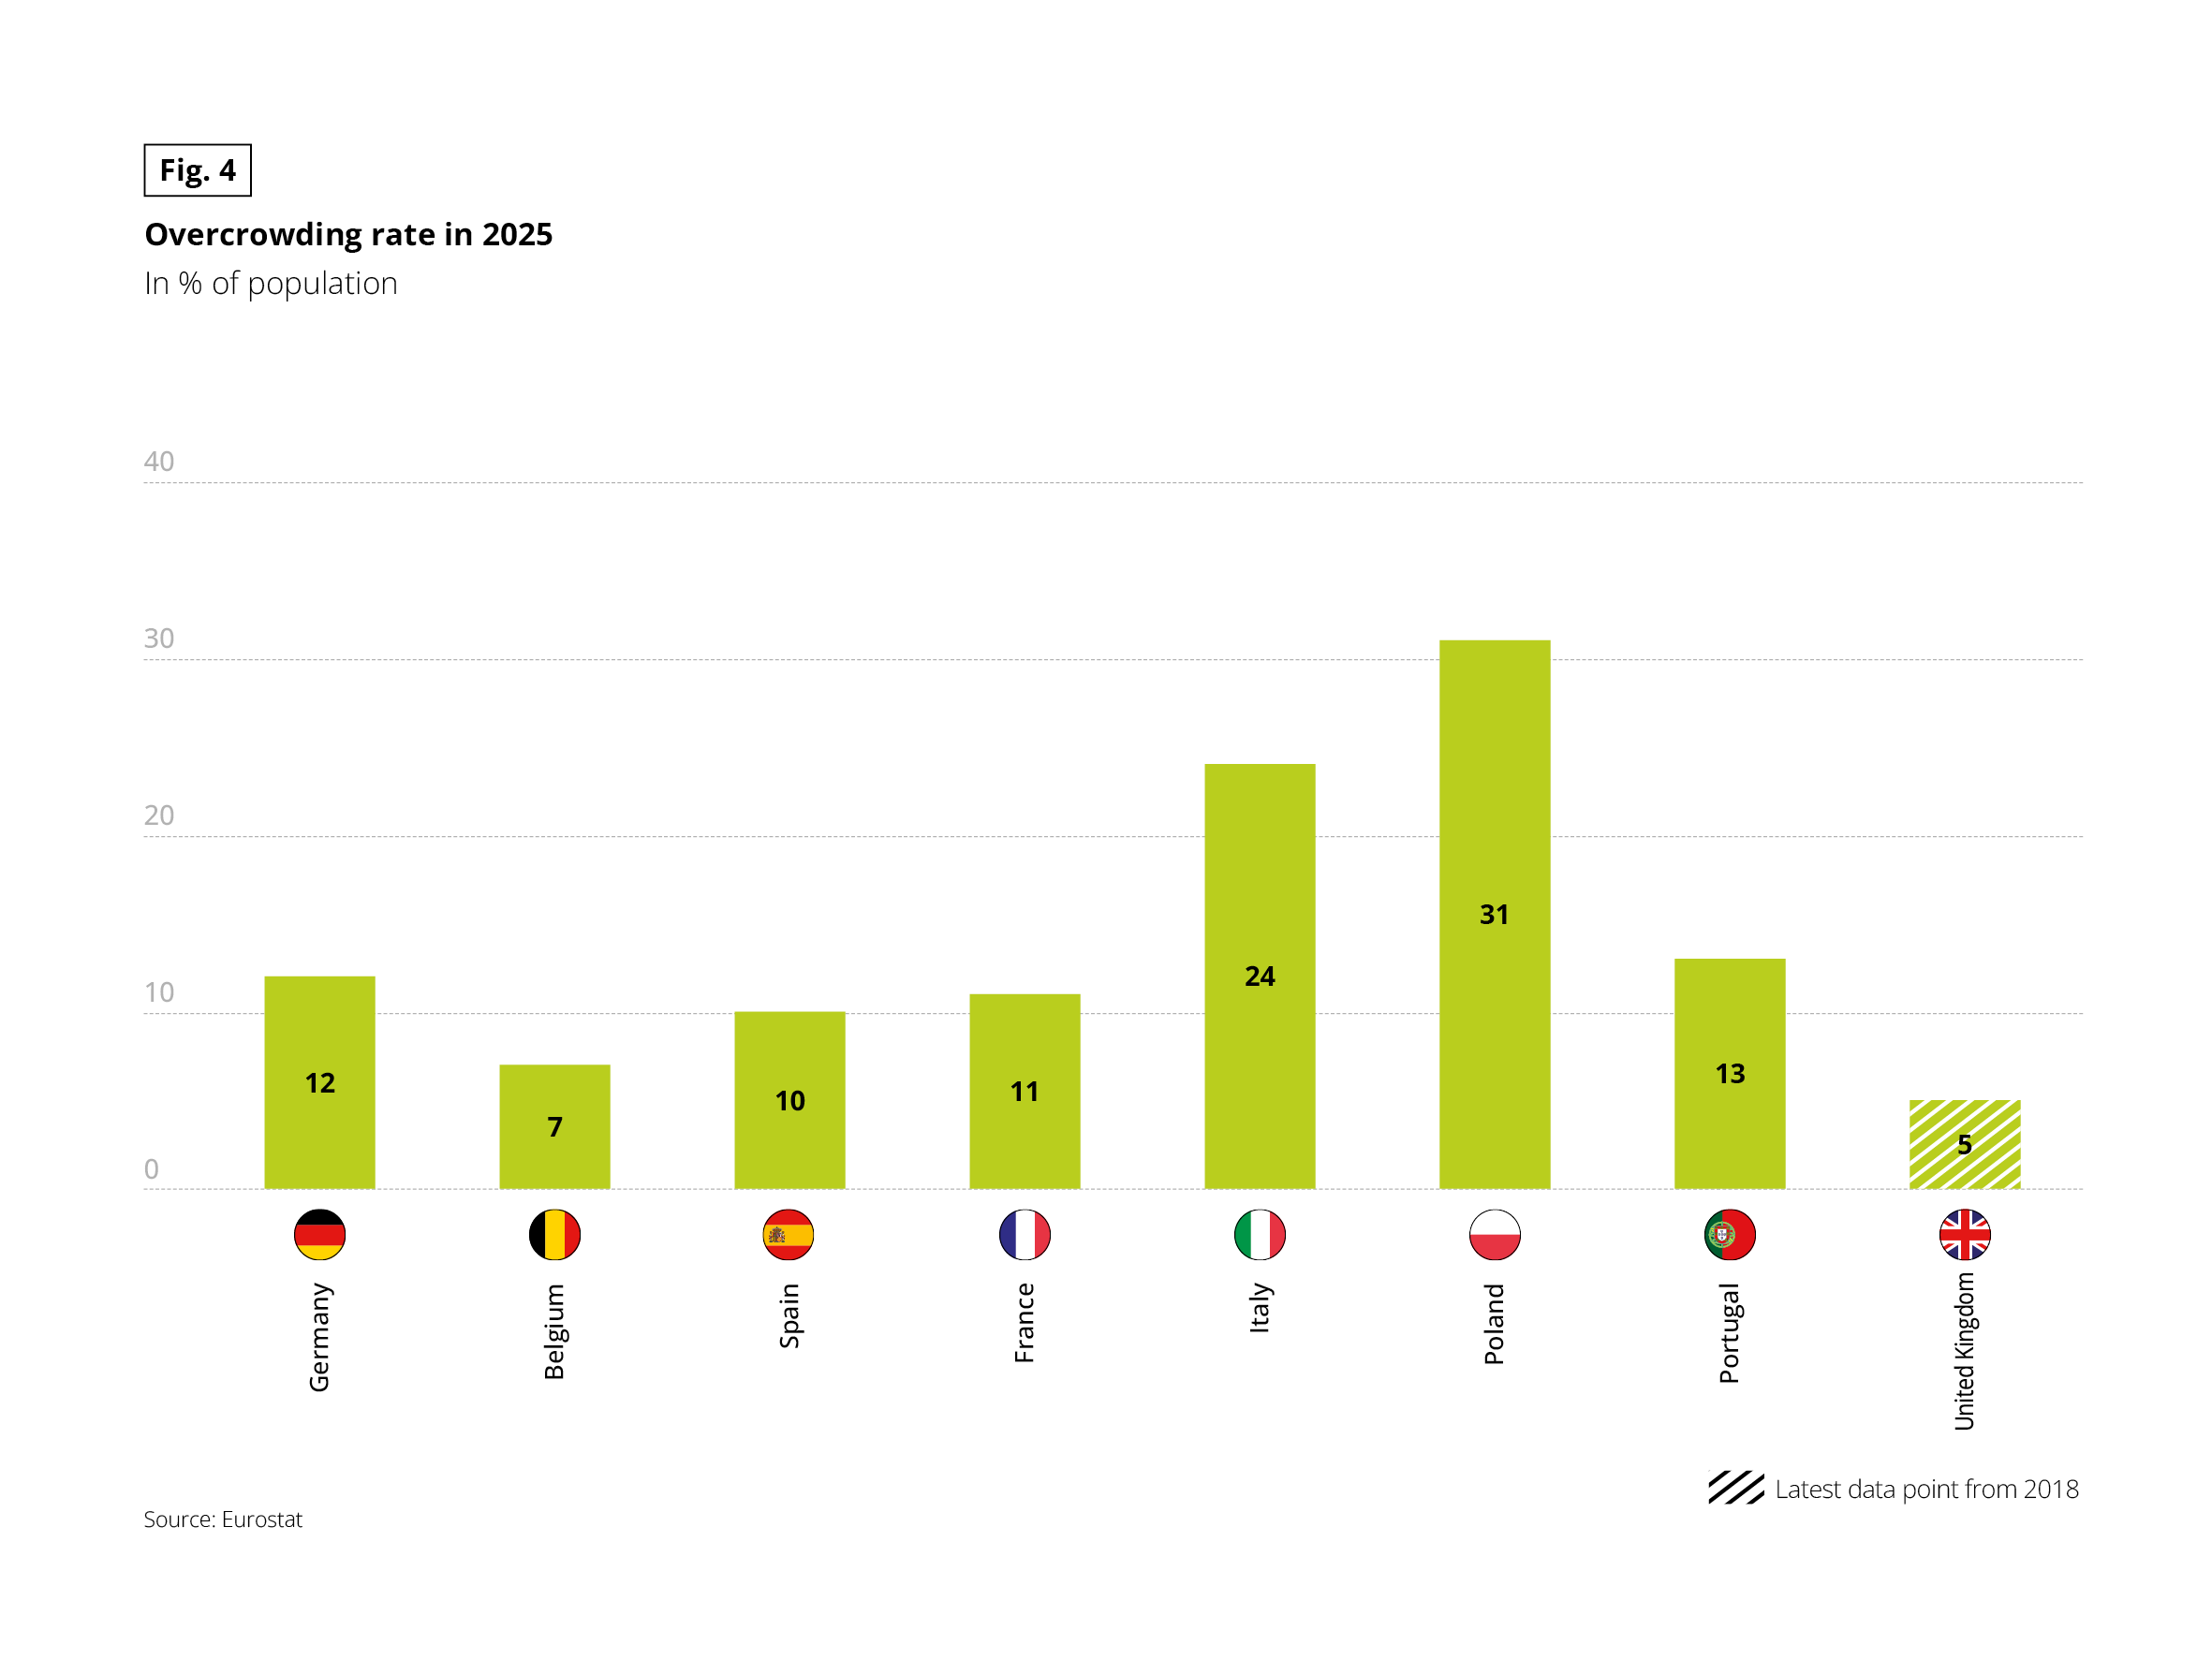 Vertical bar chart. Unit: % of population. The United Kingdom bar is hatched: its latest data point is from 2018. Source: Eurostat.
Data by country: Germany 12%, Belgium 7%, Spain 10%, France 11%, Italy 24%, Poland 31%, Portugal 13%, United Kingdom 5% (2018 data).
Poland (31%) and Italy (24%) are far above the other countries. Belgium has the lowest rate among the 2025 values (7%).
This contrast is no coincidence: across Southern Europe, property frequently remains within the family, serving as both a store of savings and a safety net. In North-Western Europe, where the rental market is more developed (as reflected in relatively low homeownership rates) and household wealth is more often held in financial assets, housing is viewed primarily as a functional commodity rather than an estate to be passed down.
Fig. 5 – Heritage and investment perceptions of one’s home, by country
Download this infographic for your presentations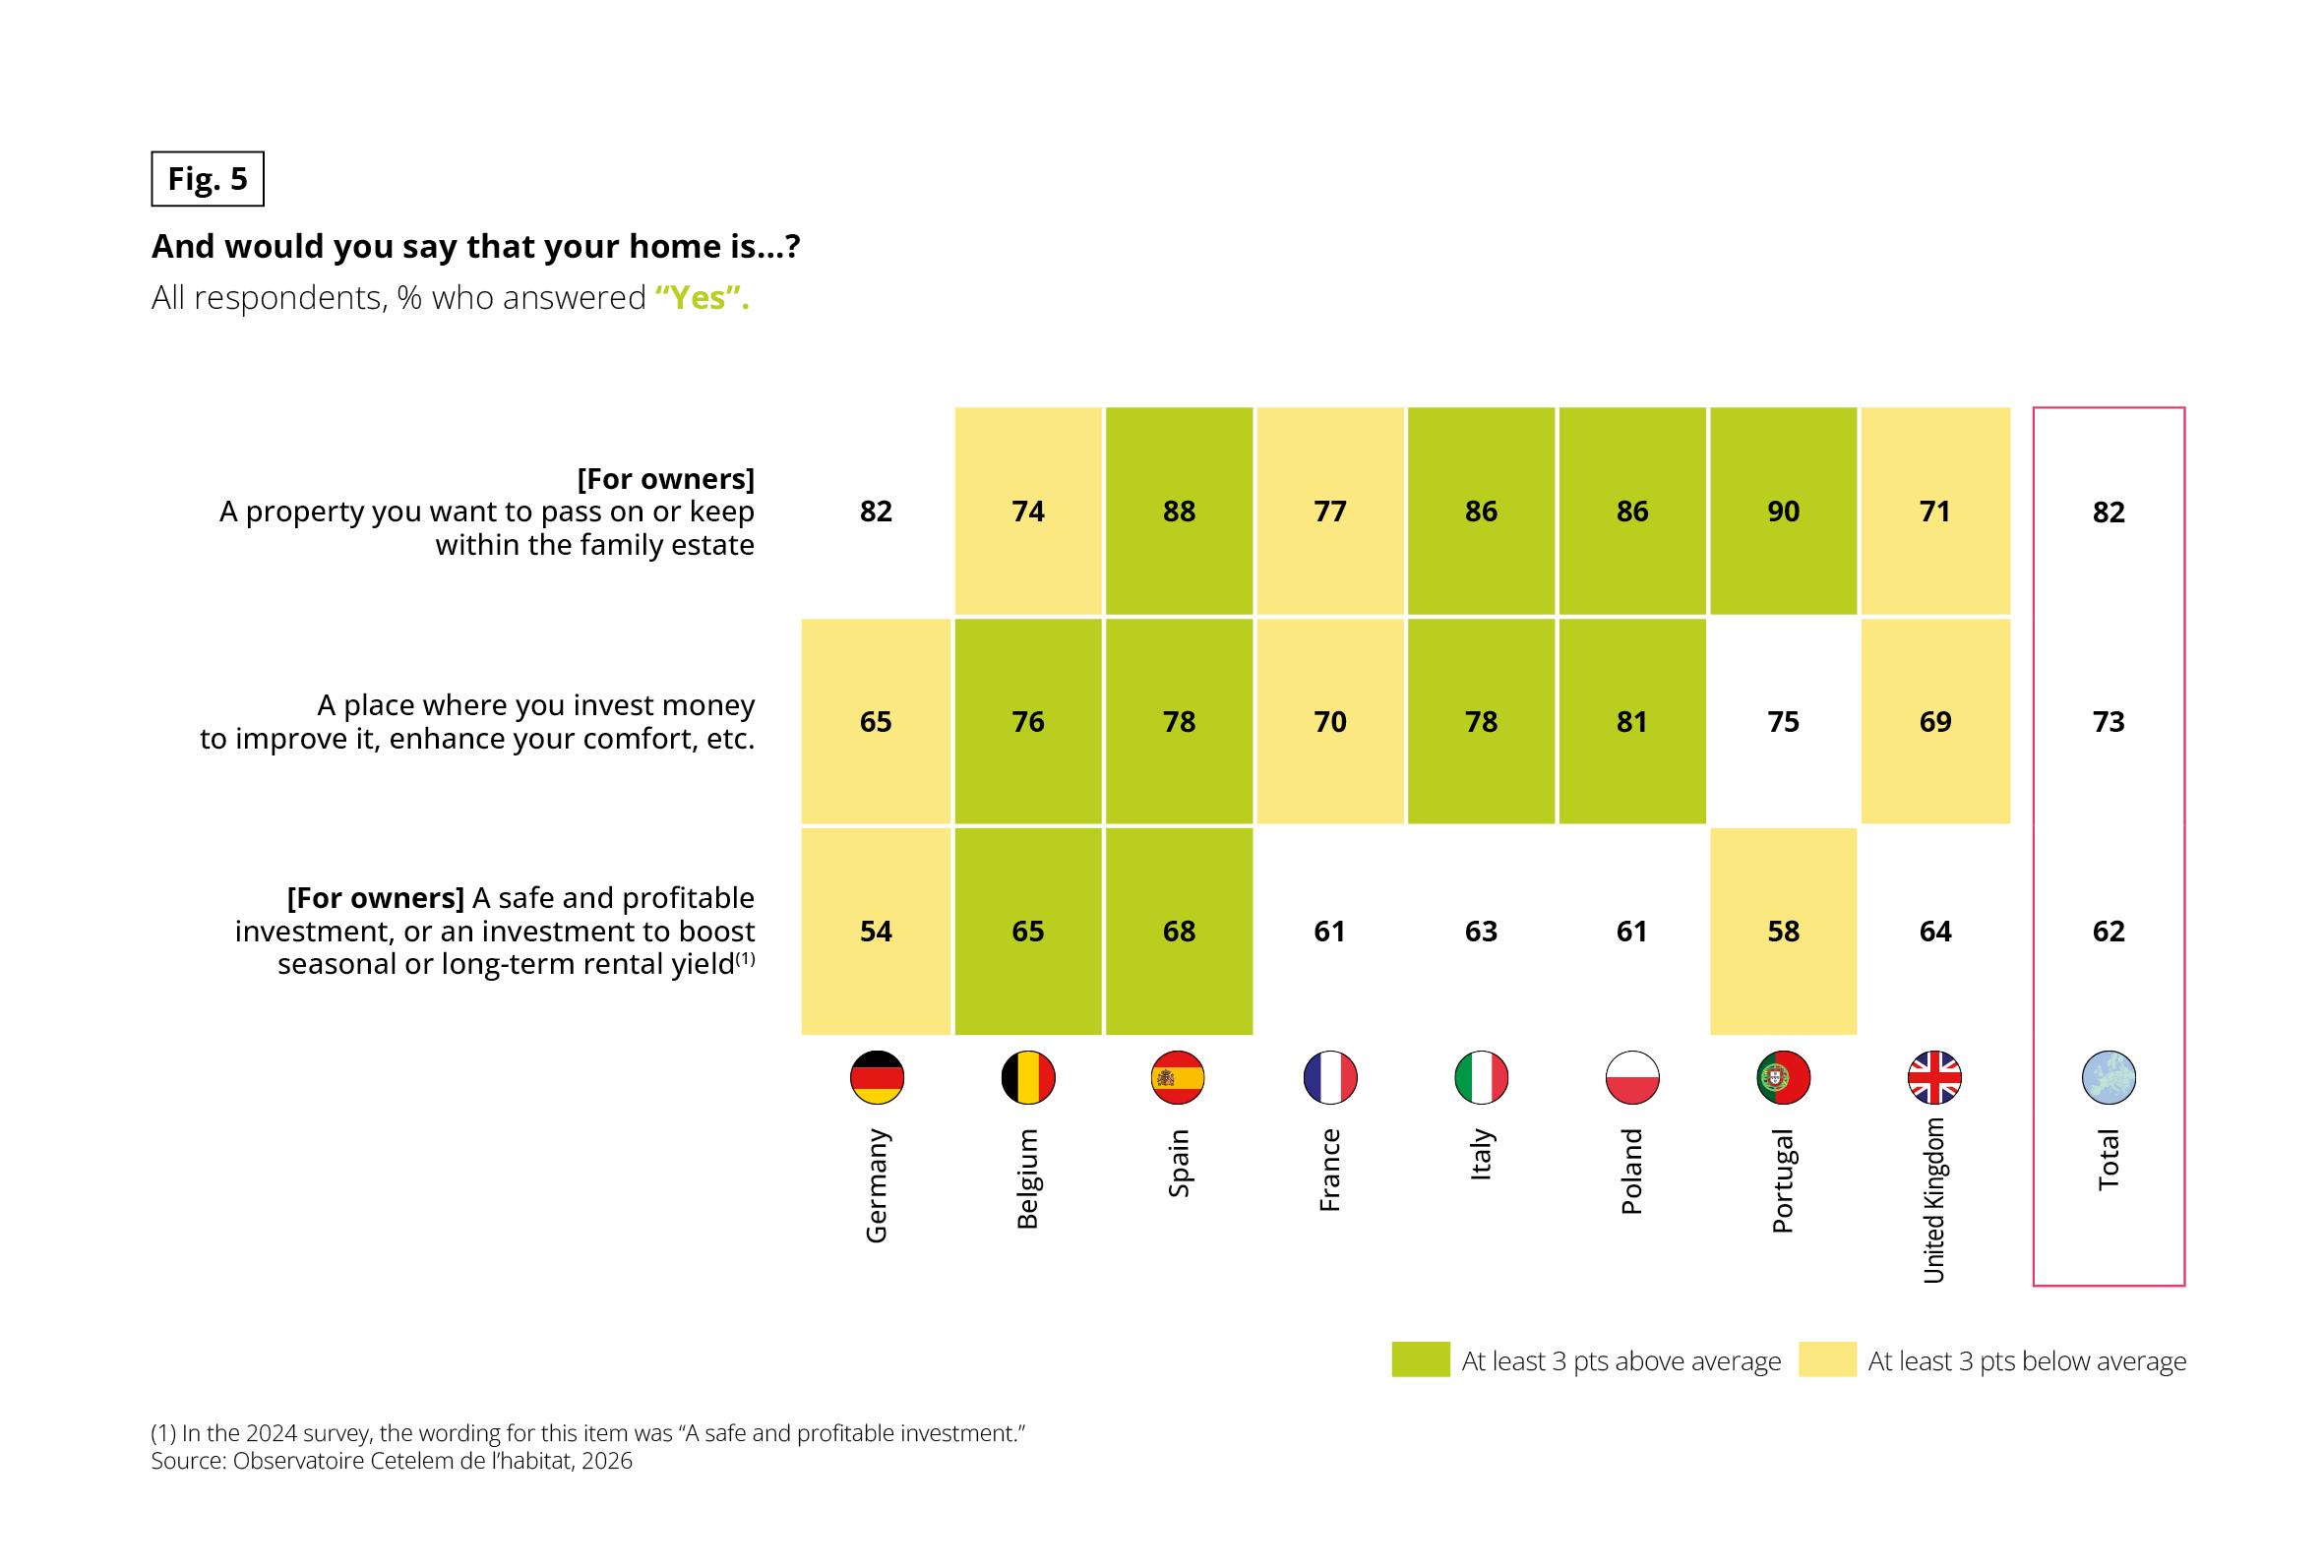 Colour-coded table. Question: “And would you say that your home is…?” Base: all respondents, % who answered “Yes”. Cells are shaded to show gaps with the total: “at least 3 pts above average” or “at least 3 pts below average”. Cells without shading are within 3 points of the total. The shading is also stated in the text below. Source: Observatoire Cetelem de l’habitat, 2026.
[For owners] A property you want to pass on or keep within the family estate (total 82%):
• Above average: Spain 88, Italy 86, Poland 86, Portugal 90
• Below average: Belgium 74, France 77, United Kingdom 71
• Close to average: Germany 82
A place where you invest money to improve it, enhance your comfort, etc. (total 73%):
• Above average: Belgium 76, Spain 78, Italy 78, Poland 81
• Below average: Germany 65, France 70, United Kingdom 69
• Close to average: Portugal 75
[For owners] A safe and profitable financial investment, or an investment to boost seasonal or long-term rental yield (total 62%):
• Above average: Belgium 65, Spain 68
• Below average: Germany 54, Portugal 58
• Close to average: France 61, Italy 63, Poland 61, United Kingdom 64
Note: in the 2024 survey, the wording of the third item was “A safe and profitable investment.”
Spain is above average on all three items. Germany is below average on the last two.
Home thus remains a place of comfort and stability, but its economic balance is coming under strain, with a small yet growing share of households viewing it as a stepping stone rather than a destination.
EXTREME SEASONS EXPOSE DISPARITIES IN HOUSING COMFORT
Perceived housing comfort fluctuates with the seasons: naturally, summer discomfort dominates in Southern Europe, while winter discomfort prevails in the North. Yet beyond these predictable patterns, it is the stark divergence in experiences across sociodemographic profiles that proves most telling.
In spring and autumn, virtually all Europeans consider their home pleasant, with half finding it very pleasant. During extreme seasons, however, satisfaction drops sharply: winter marks the lowest point, closely followed by summer.
These seasonal variations converge on a single striking figure: 34% of Europeans describe their home as unpleasant during at least one season, meaning one in three suffers from poor living conditions for part of the year, and 9% even rate at least one season as very unpleasant.
Housing discomfort across Europe has edged up by 1 percentage point year-on-year, with spikes of up to 4 points depending on the season and country. Spain records the steepest increases, particularly during spring and autumn.
Fig. 6 – Pleasantness of one’s home by season
Download this infographic for your presentations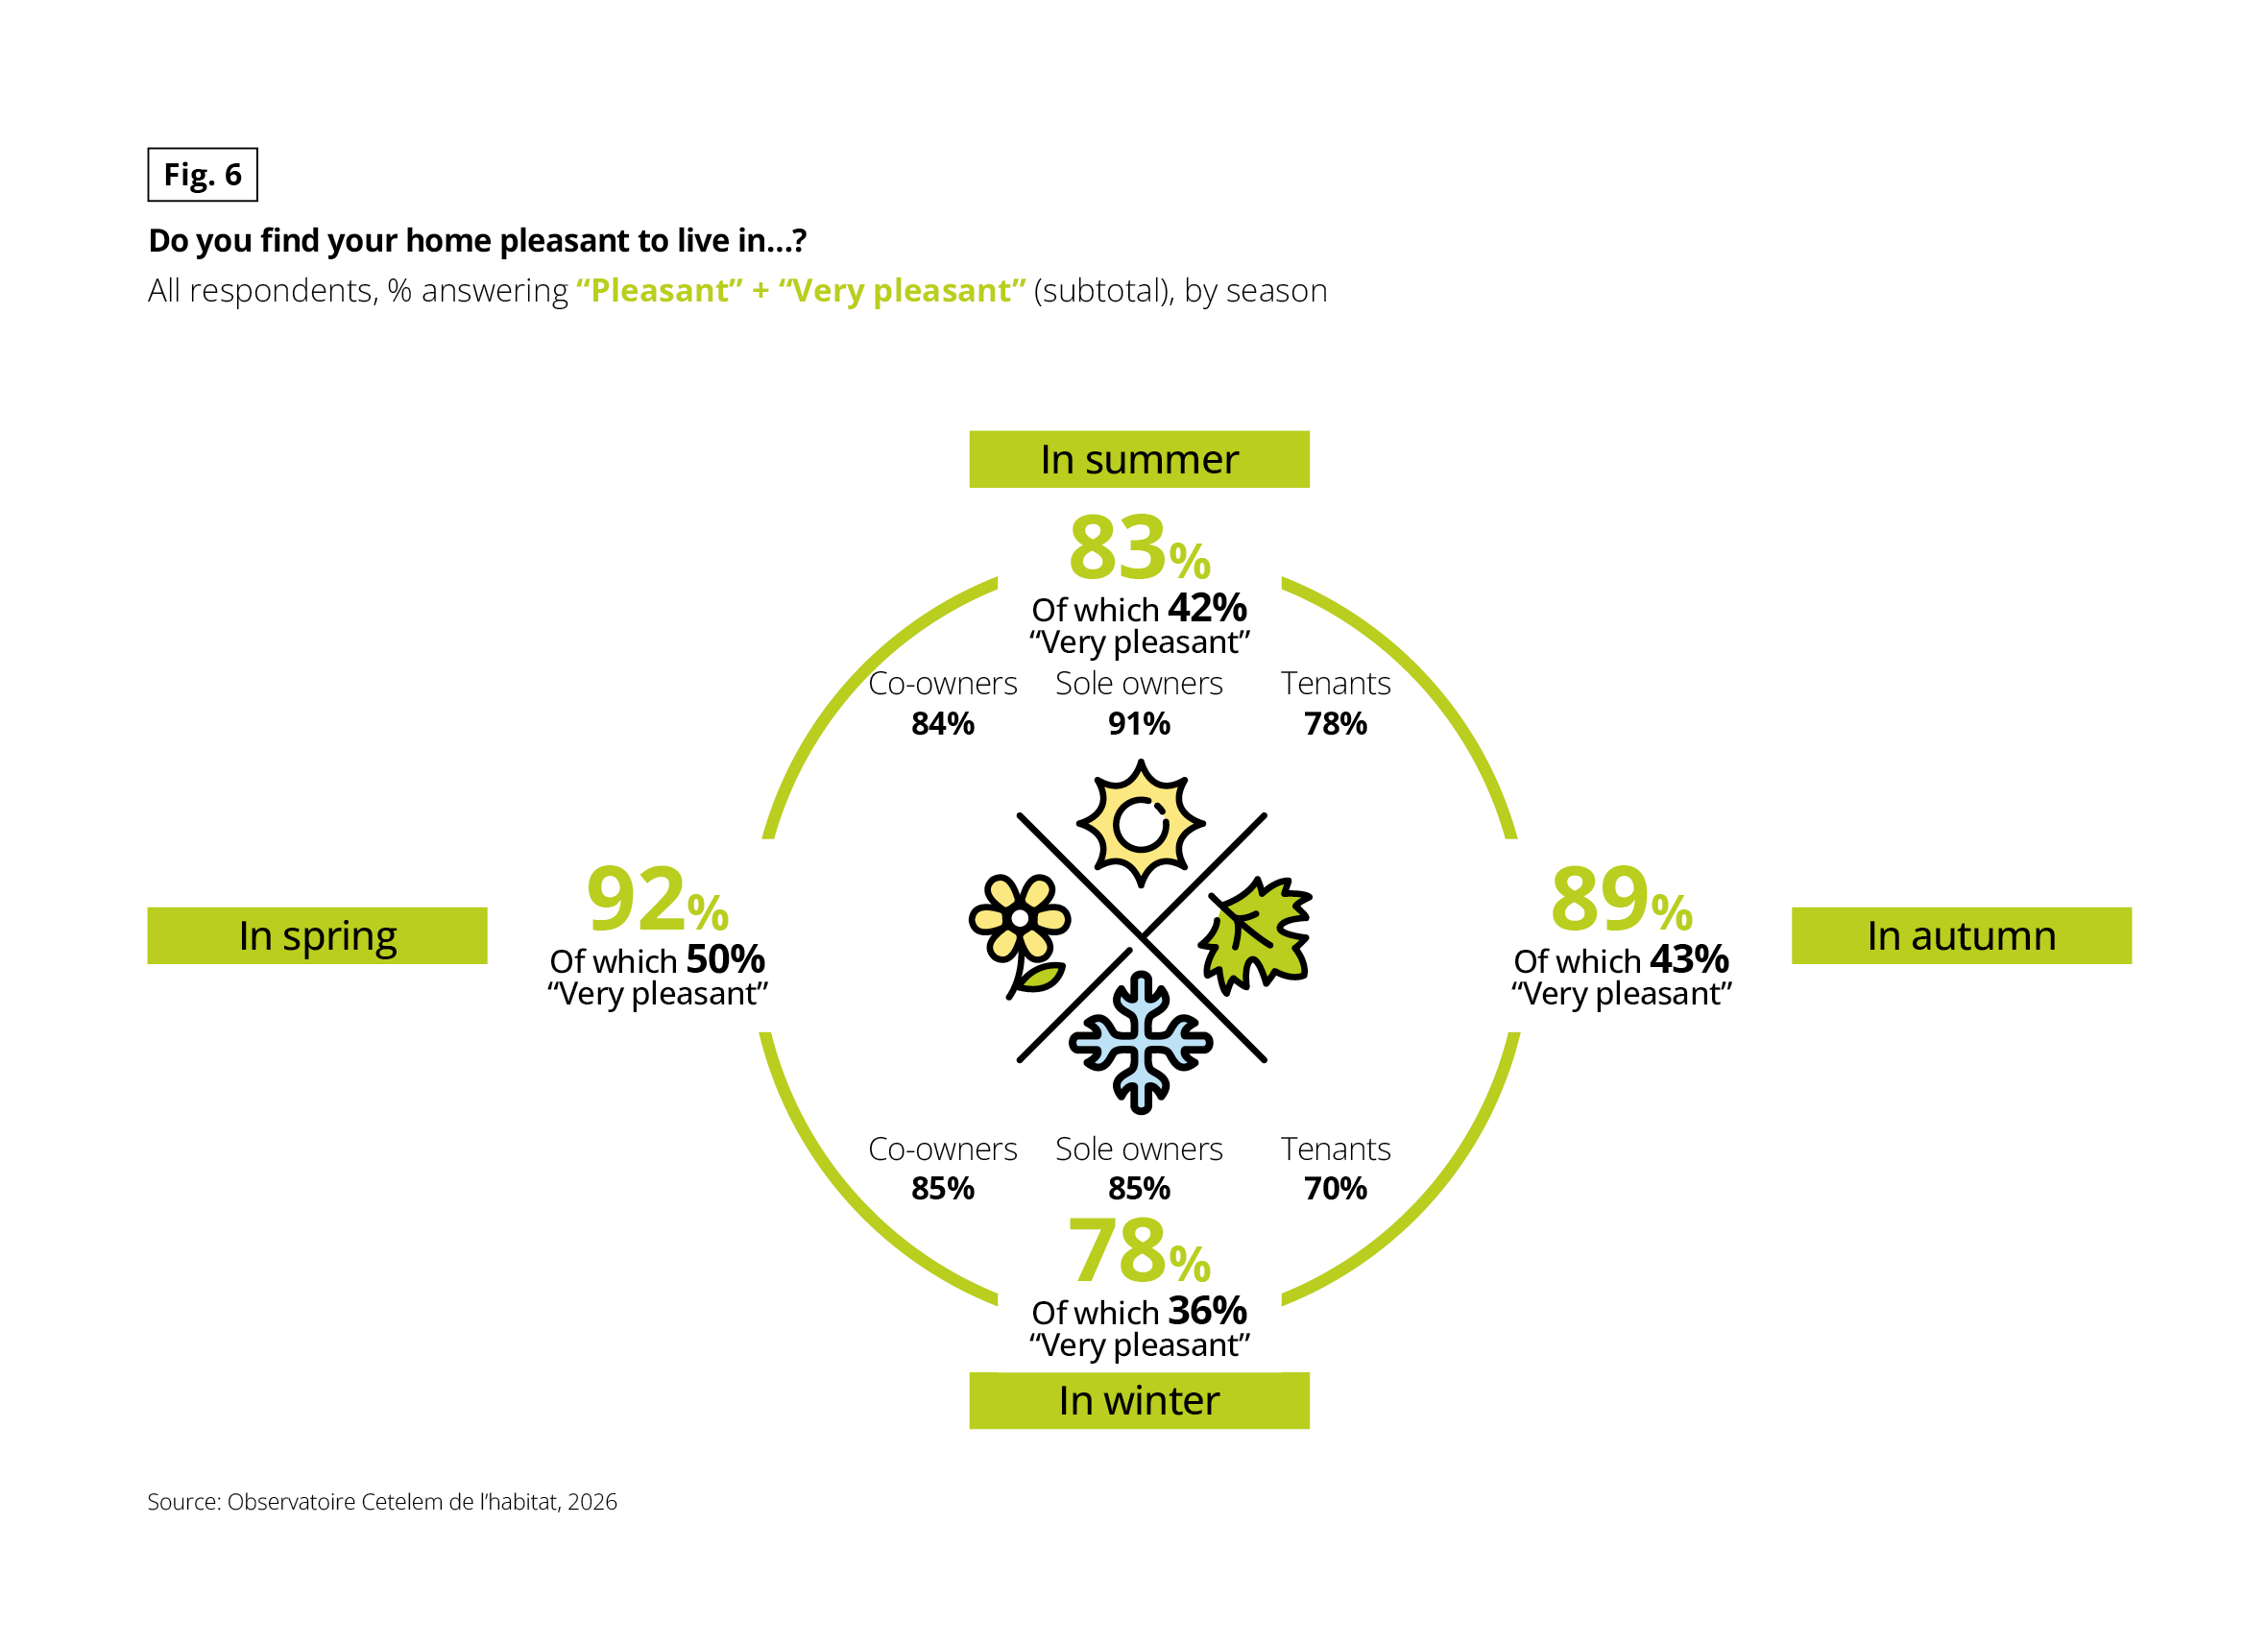 Circular diagram with four seasons. Question: “Do you find your home pleasant to live in…?” Base: all respondents, % answering “Pleasant” plus “Very pleasant” (subtotal), by season. Source: Observatoire Cetelem de l’habitat, 2026.
Results:
• In spring: 92%, of which 50% “very pleasant”
• In autumn: 89%, of which 43% “very pleasant”
• In summer: 83%, of which 42% “very pleasant”. By tenure: co-owners 84%, sole owners 91%, tenants 78%
• In winter: 78%, of which 36% “very pleasant”. By tenure: co-owners 85%, sole owners 85%, tenants 70%
Homes are most pleasant in spring and least pleasant in winter. Tenants give the lowest scores in both summer and winter, with a gap of 15 points against owners in winter.
These averages mask sharp inequalities. Tenants are the most exposed to seasonal discomfort in both summer and winter, lagging roughly 10 percentage points behind homeowners. Among homeowners, and specifically during the summer months, apartment owners suffer more (84% consider their home pleasant) than individual homeowners (91%) and house owners (92%), a clear sign that multi-family housing is less resilient to heat. Geographically, summer discomfort hits Spain, Italy and Portugal hardest, given their hotter summers, whereas winter cold takes a heavy toll on Poland and Germany.
These disparities are equally apparent in the cumulative findings for the question featured above: “Do you find your home pleasant to live in?” Across all four seasons, discomfort peaks at 38% in Poland and Portugal, compounded by exposure to both seasonal extremes, while remaining lowest in Belgium and Spain (31%). France and Germany (34% each) mirror the European average precisely, a ranking that does not simply mirror regional temperatures, demonstrating that building quality matters at least as much as climate.
Fig. 7 – European thermal (dis)comfort map, 1990–2020
Download this infographic for your presentations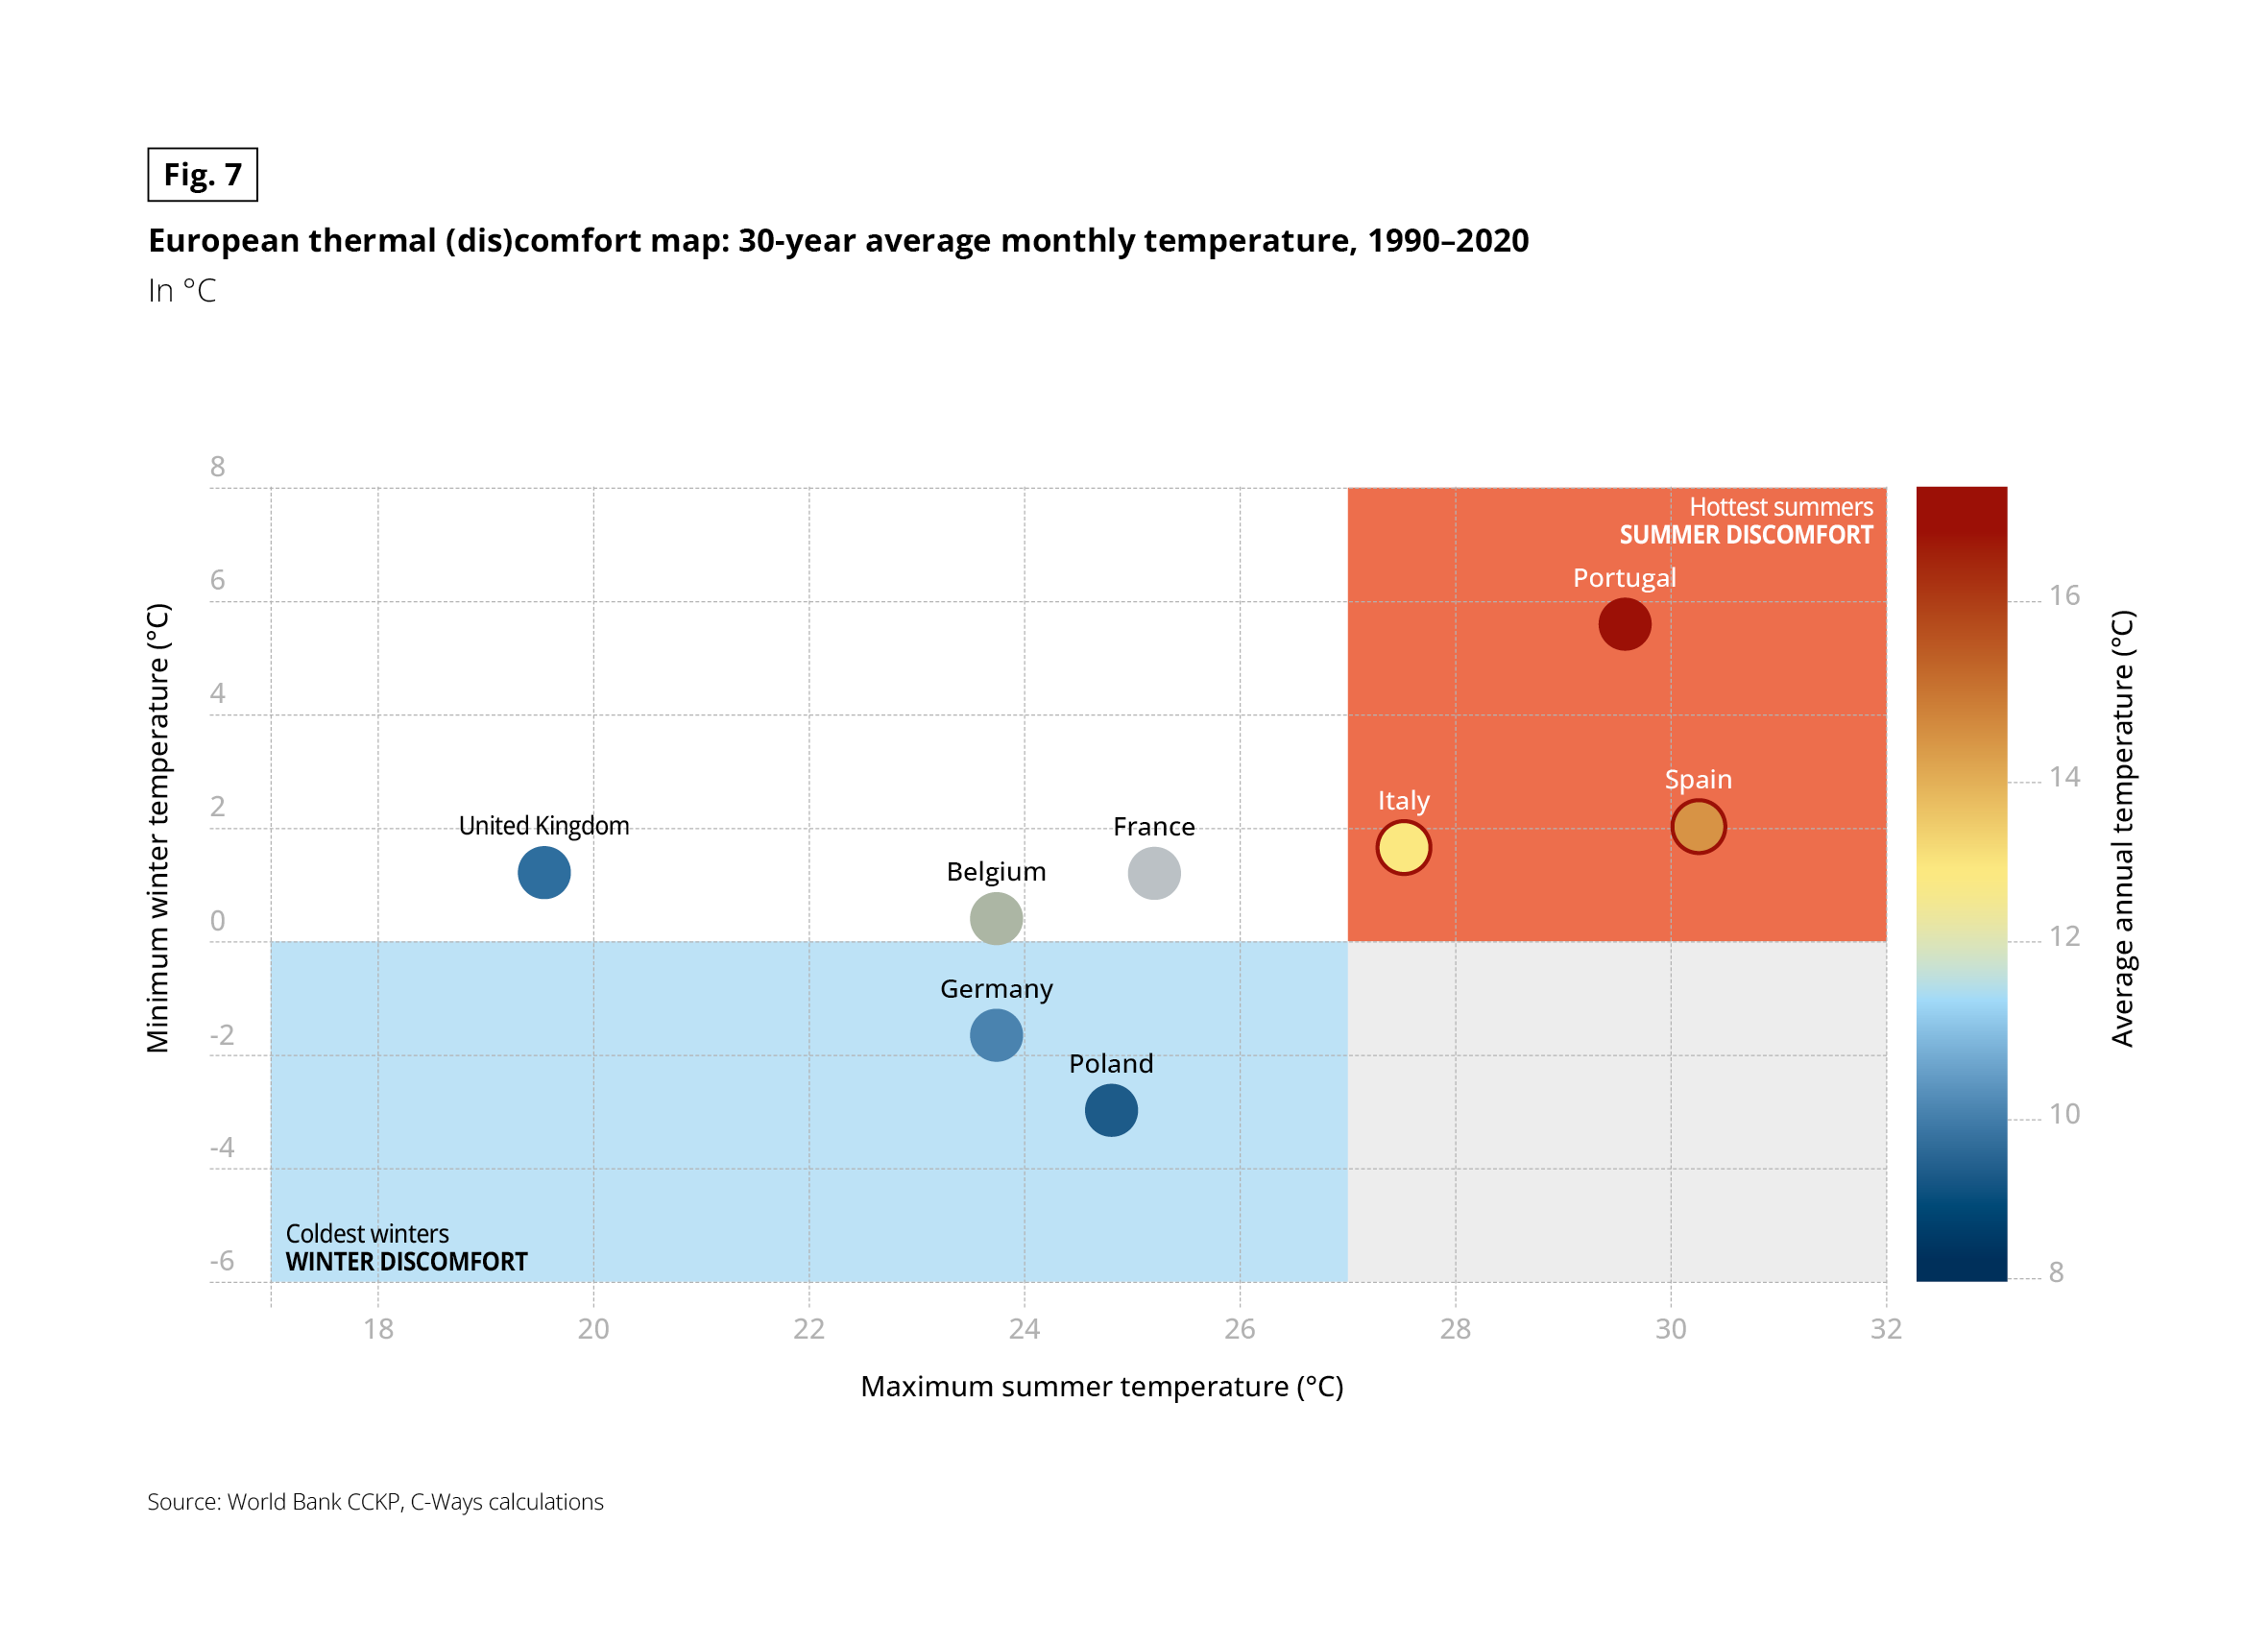 Scatter plot with one point per country. Horizontal axis: maximum summer temperature in °C (from 18 to 32). Vertical axis: minimum winter temperature in °C (from −6 to 8). Point colour shows the average annual temperature, on a scale from about 8°C (dark blue) to about 17°C (dark red). 30-year averages of monthly temperature, 1990–2020. Source: World Bank CCKP, C-Ways calculations.
Two zones are highlighted. The upper-right red zone, “Hottest summers – SUMMER DISCOMFORT”, covers maximum summer temperatures of about 27°C and above, with winter minimums above 0°C. The lower-left blue zone, “Coldest winters – WINTER DISCOMFORT”, covers winter minimums below 0°C with summer maximums below about 27°C. The lower-right zone is neutral and unlabelled.
Approximate positions read from the chart, in the form maximum summer / minimum winter temperature:
• Portugal: about 29.6°C / 5.6°C, in the summer discomfort zone, warmest annual average (dark red)
• Spain: about 30.3°C / 2.0°C, in the summer discomfort zone (orange)
• Italy: about 27.5°C / 1.7°C, in the summer discomfort zone (yellow)
• France: about 25.2°C / 1.2°C, outside both zones (grey)
• Belgium: about 23.7°C / 0.4°C, outside both zones (grey-green)
• United Kingdom: about 19.5°C / 1.2°C, outside both zones (blue)
• Germany: about 23.7°C / −1.7°C, in the winter discomfort zone (blue)
• Poland: about 24.8°C / −3.0°C, in the winter discomfort zone, coolest annual average (dark blue)
Beyond indoor temperatures and property size (as measured by overcrowding rates), building age provides further confirmation of this comfort gap. A vast portion of the European housing stock predates the earliest thermal regulations, creating a double penalty for countries combining extreme seasonal temperature swings with ageing, poorly insulated homes. Germany and Belgium exemplify this issue, with some of the oldest residential stock in the study, as over two-thirds of properties were built before 1980. It is precisely within this ageing building stock that both seasonal discomfort and the urgent challenge of energy renovation converge (detailed in the final section of this study).
Fig. 8 – Residential housing stock by construction period
Download this infographic for your presentations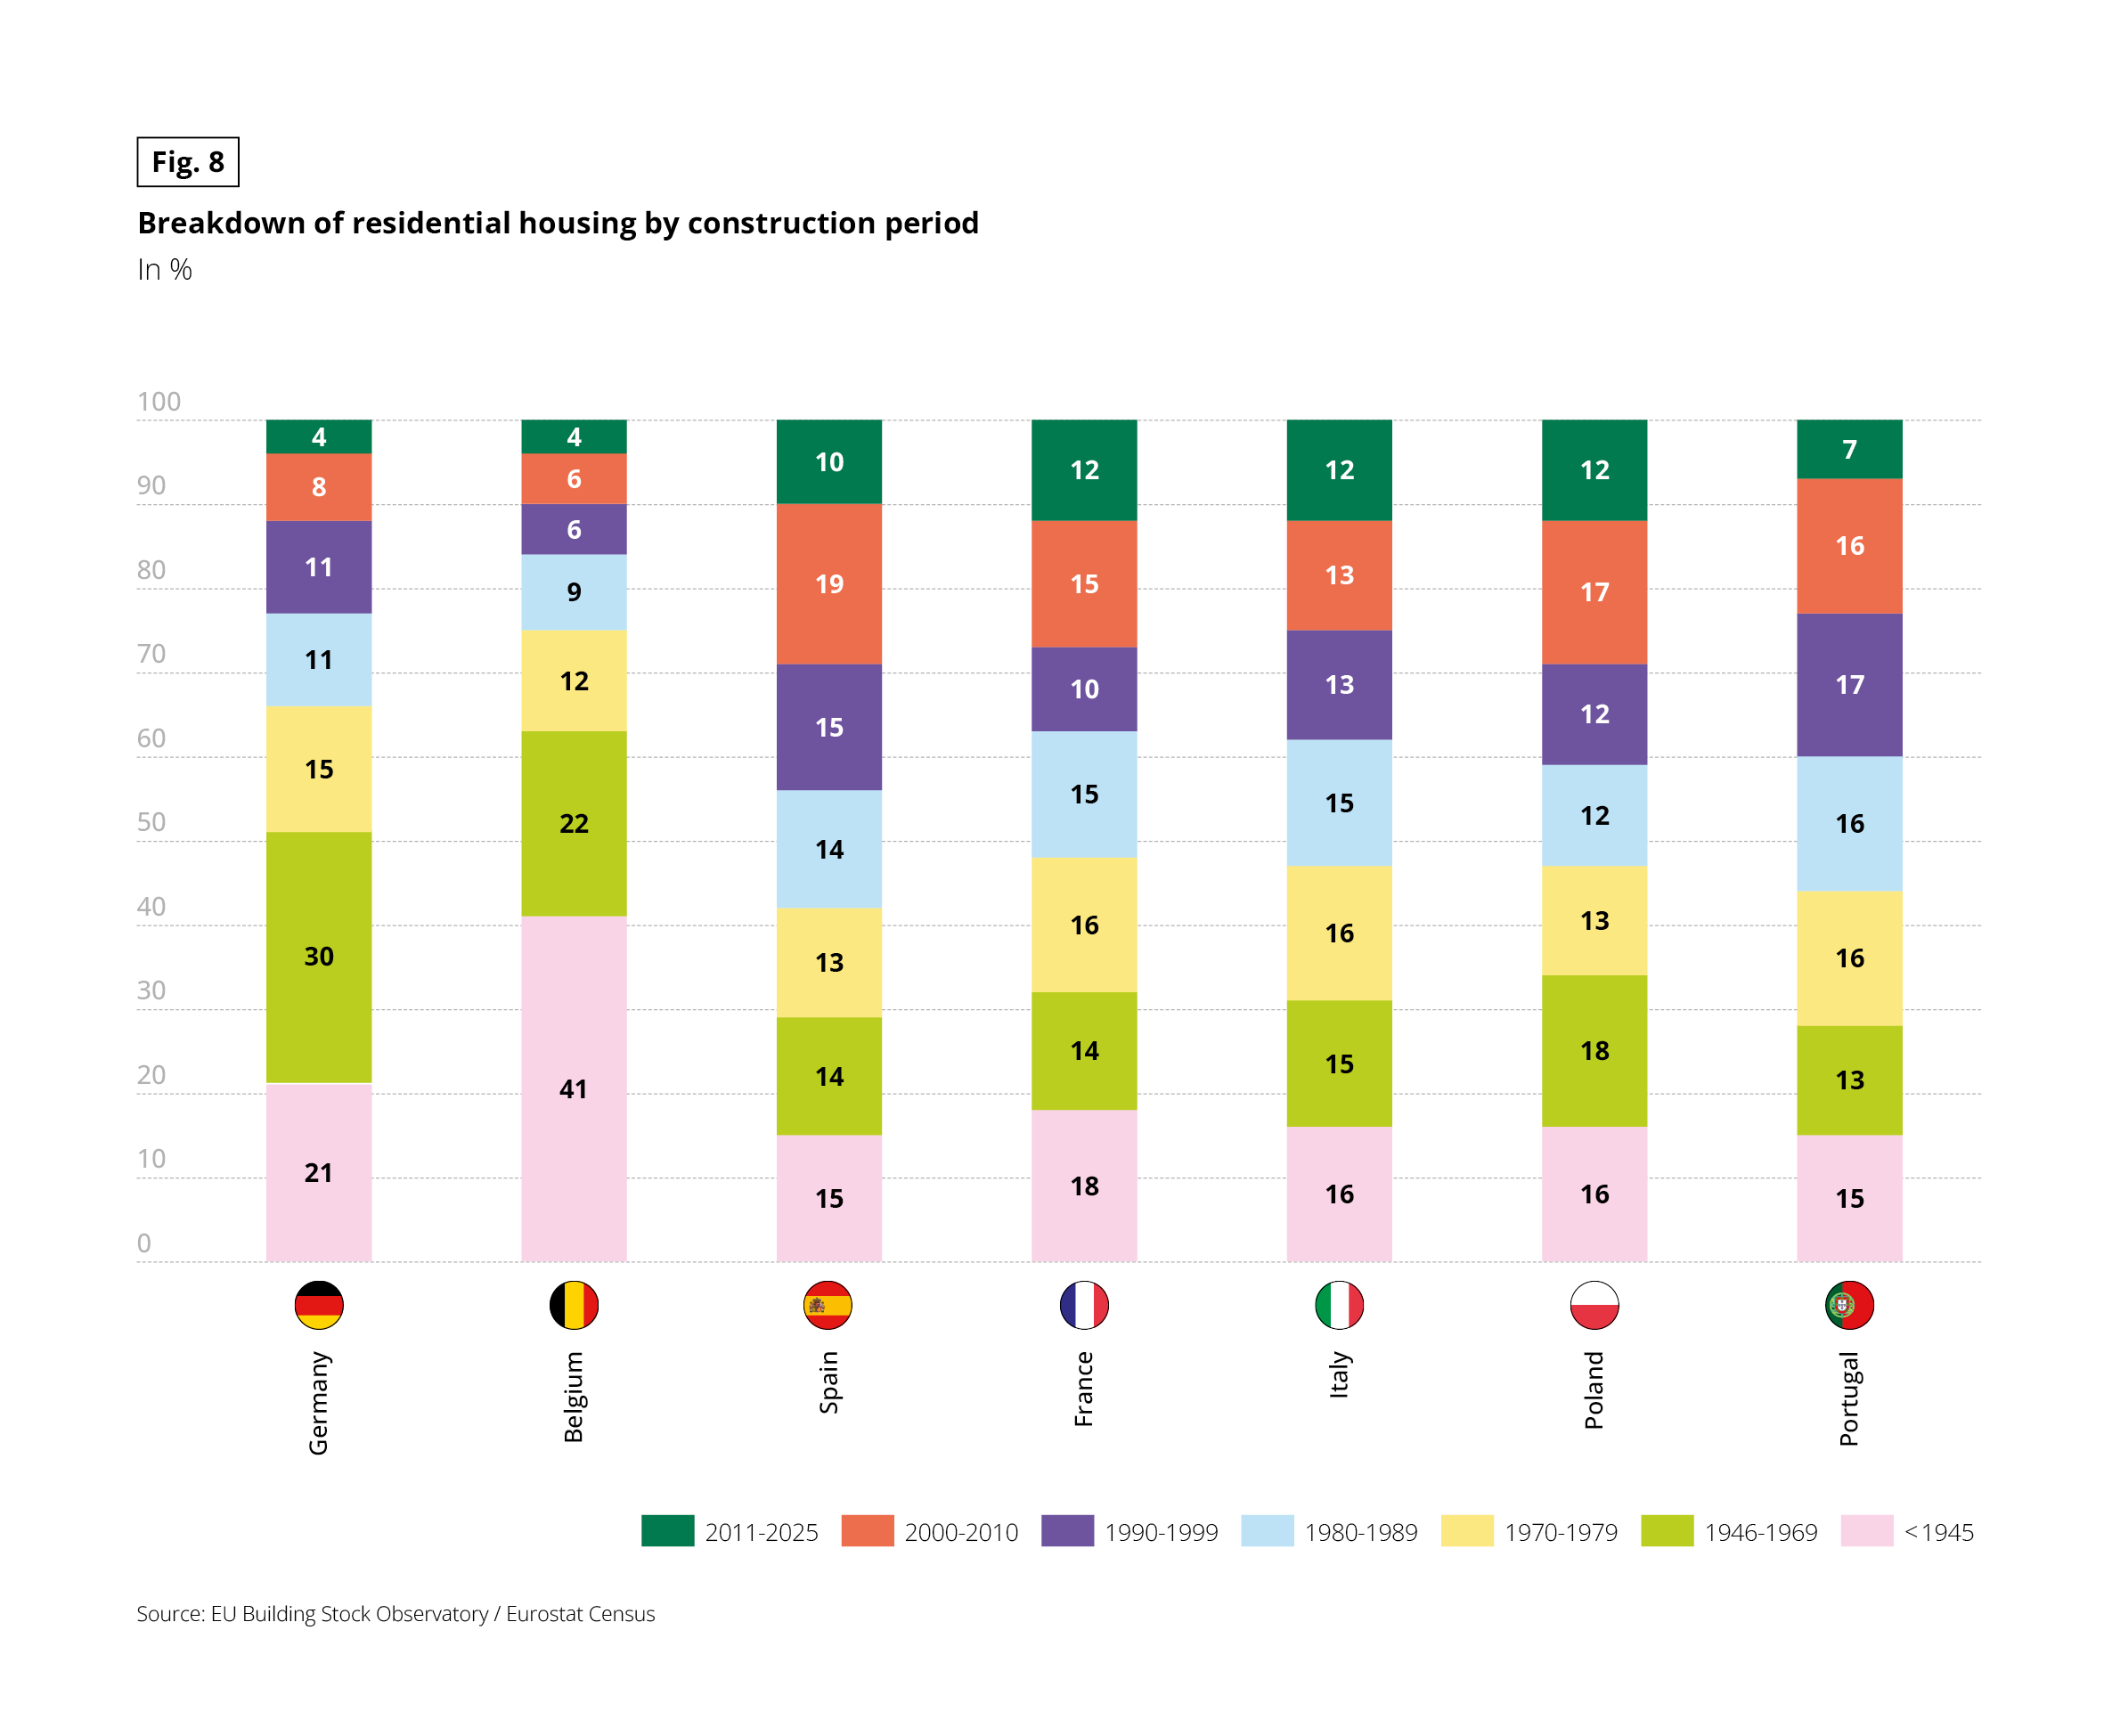 Stacked vertical bar chart. Unit: %. Seven construction periods: before 1945, 1946–1969, 1970–1979, 1980–1989, 1990–1999, 2000–2010 and 2011–2025. Source: EU Building Stock Observatory / Eurostat Census.
Data in the form <1945 / 1946–1969 / 1970–1979 / 1980–1989 / 1990–1999 / 2000–2010 / 2011–2025:
• Germany: 21 / 30 / 15 / 11 / 11 / 8 / 4
• Belgium: 41 / 22 / 12 / 9 / 6 / 6 / 4
• Spain: 15 / 14 / 13 / 14 / 15 / 19 / 10
• France: 18 / 14 / 16 / 15 / 10 / 15 / 12
• Italy: 16 / 15 / 16 / 15 / 13 / 13 / 12
• Poland: 16 / 18 / 13 / 12 / 12 / 17 / 12
• Portugal: 15 / 13 / 16 / 16 / 17 / 16 / 7
Belgium has the oldest housing stock, with 63% built before 1970. Germany follows with 51%. Spain, France, Italy and Poland have the largest shares of recent construction since 2011 (10 to 12%). Germany and Belgium have the smallest (4% each).
Residential comfort thus hinges primarily on three factors: an adequate dwelling size relative to occupancy, local climate and building age, with seasonal extremes exposing the structural vulnerabilities of both the housing stock and tenant status.
SINGLE-FAMILY HOMES AND SUBURBAN LOCATION DRIVE HIGHER SATISFACTION
In 2026, 9 in 10 Europeans say they are satisfied with their home, including 40% who are “completely satisfied”, a level that has remained stable since 2024.
Fig. 9 – Satisfaction with one’s home, overall and by profile
Download this infographic for your presentations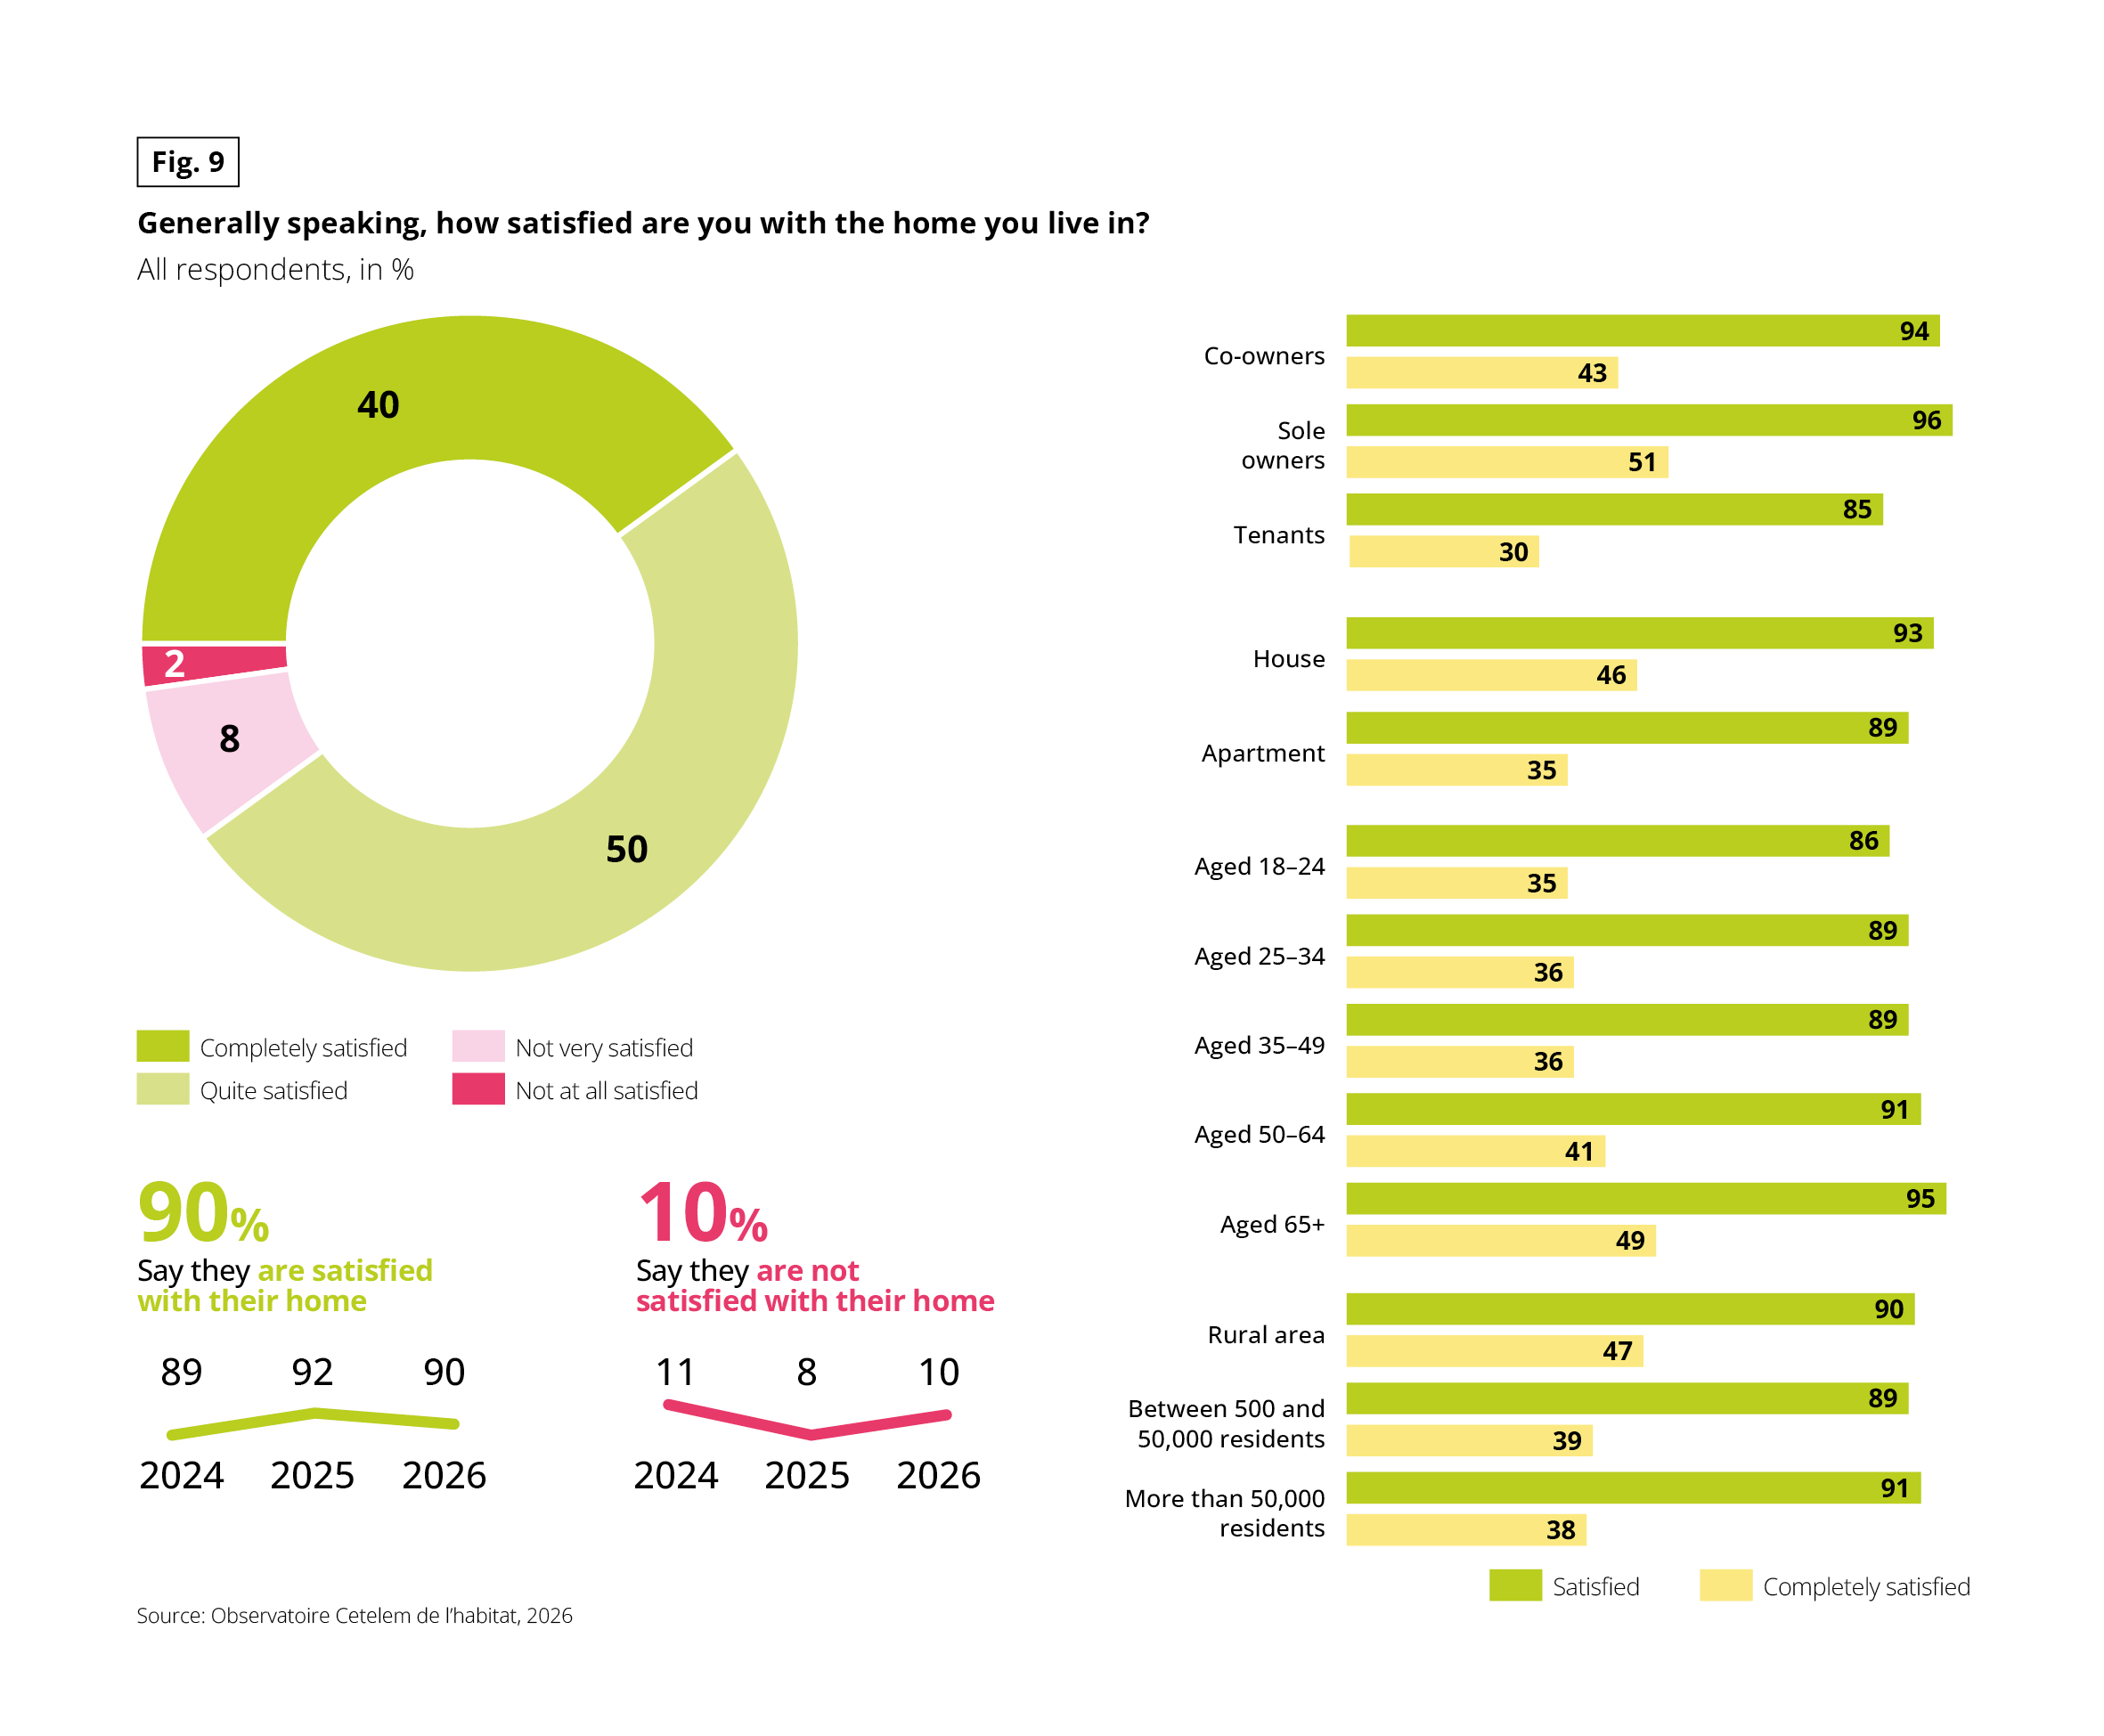 Combined chart with a donut, a three-year trend and bar charts. Question: “Generally speaking, how satisfied are you with the home you live in?” Base: all respondents, in %. Source: Observatoire Cetelem de l’habitat, 2026.
Overall result (donut): completely satisfied 40%, quite satisfied 50%, not very satisfied 8%, not at all satisfied 2%. In total, 90% are satisfied and 10% are not.
Trend 2024 / 2025 / 2026:
• Satisfied: 89% / 92% / 90%
• Not satisfied: 11% / 8% / 10%
Bar charts by profile, with two series: “Satisfied” and “Completely satisfied”. Each “Satisfied” figure is consistent with a subtotal that includes “completely satisfied”. Data in the form satisfied / completely satisfied:
• Co-owners: 94 / 43
• Sole owners: 96 / 51
• Tenants: 85 / 30
• House: 93 / 46
• Apartment: 89 / 35
• Aged 18–24: 86 / 35
• Aged 25–34: 89 / 36
• Aged 35–49: 89 / 36
• Aged 50–64: 91 / 41
• Aged 65+: 95 / 49
• Rural area: 90 / 47
• Between 500 and 50,000 residents: 89 / 39
• More than 50,000 residents: 91 / 38
Satisfaction is highest among sole owners (96%) and people aged 65 and over (95%). It is lowest among 18–24-year-olds (86%) and tenants (85%).
Satisfaction and comfort are intimately linked, with the same socio-economic profiles responding consistently across both dimensions. The owner–tenant gap re-emerges almost identically here. Single-family houses outpace apartments, while satisfaction climbs steadily with age, rising from 86% among 18–24-year-olds to 95% among those over 65, as housing situations stabilise over time. The only surprise lies in the intensity of satisfaction: rural areas boast the highest satisfaction levels, with 47% reporting they are “completely satisfied”, roughly 10 percentage points higher than in major cities, as rural residents face far fewer pressures from density, land scarcity and high property prices. Across countries, satisfaction levels are remarkably homogeneous, spanning just 6 percentage points, from 88% in the United Kingdom to 94% in Portugal. Crucially, satisfaction does not track the physical composition of the housing stock.
France, where single-family homes dominate (64% of properties), ranks among the lowest for overall satisfaction (89%). Conversely, Portugal, where apartments account for half the housing stock, leads the ranking (94%). Meanwhile, Spain and Germany, which have the highest shares of multi-family housing, both stand at 91%. At the national level, housing type is therefore not the driving factor behind satisfaction: disparities are shaped far more by household profiles than by geography.
Fig. 10 – Households by housing type, 2024
Download this infographic for your presentations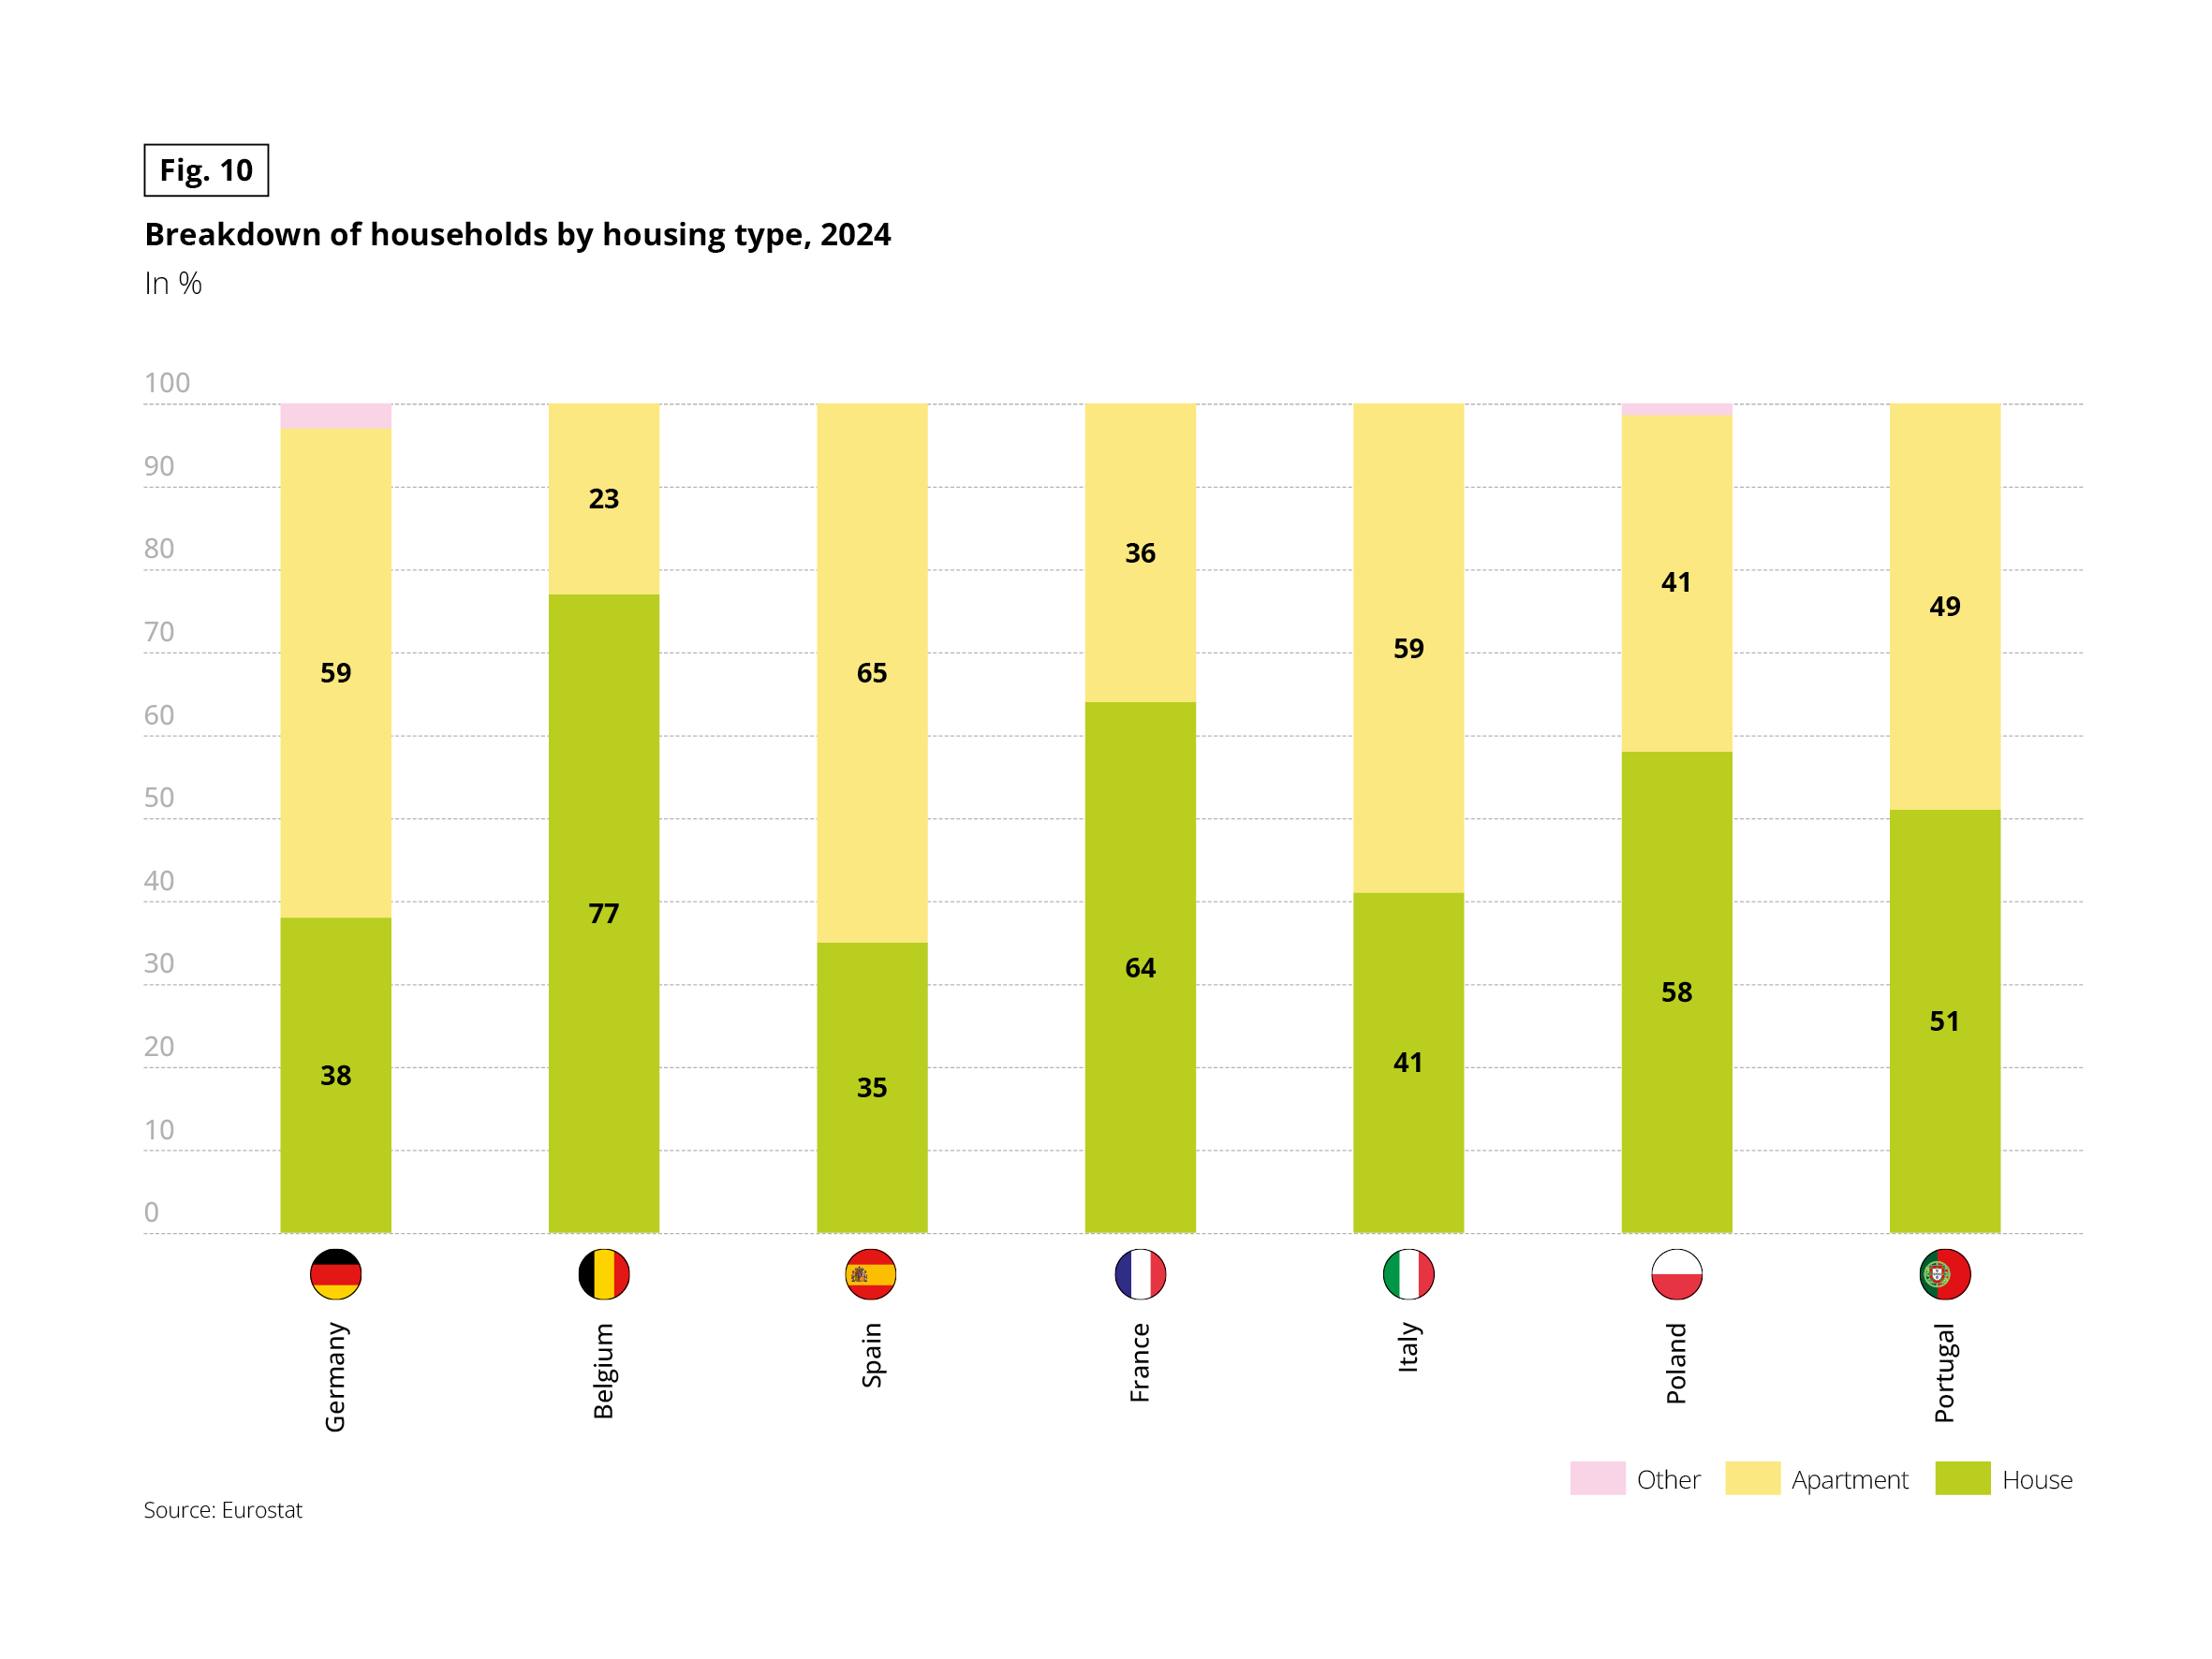 Stacked vertical bar chart. Unit: % of households. Three categories: house, apartment and other. The “Other” category is not labelled; its values below are calculated by difference. Source: Eurostat.
Data in the form house / apartment:
• Germany: 38 / 59 (other about 3)
• Belgium: 77 / 23
• Spain: 35 / 65
• France: 64 / 36
• Italy: 41 / 59
• Poland: 58 / 41 (other about 1)
• Portugal: 51 / 49
Belgium and France have a majority of households in houses (77% and 64%). Spain, Germany and Italy have a majority in apartments (65%, 59% and 59%). Portugal is almost evenly split.
EUROPEANS MORE SATISFIED WITH THEIR LIVING ENVIRONMENT THAN THEIR DWELLING, WHERE ENERGY PERFORMANCE IS A FREQUENT POINT OF FRICTION
Satisfaction varies depending on the aspect assessed, and grouping these into thematic clusters reveals a clear pattern. The living environment—surroundings, location and proximity to shops—ranks highest, with nearly 1 in 2 respondents reporting they are fully satisfied. The physical attributes of the property come next, led by living space. At the bottom of the spectrum lie technical and energy-related aspects: energy efficiency, utility bills and energy equipment. Overall satisfaction is thus high when it comes to living environment, but drops sharply when addressing the building and energy costs.
Fig. 11 – Satisfaction with 20 aspects of housing
Download this infographic for your presentations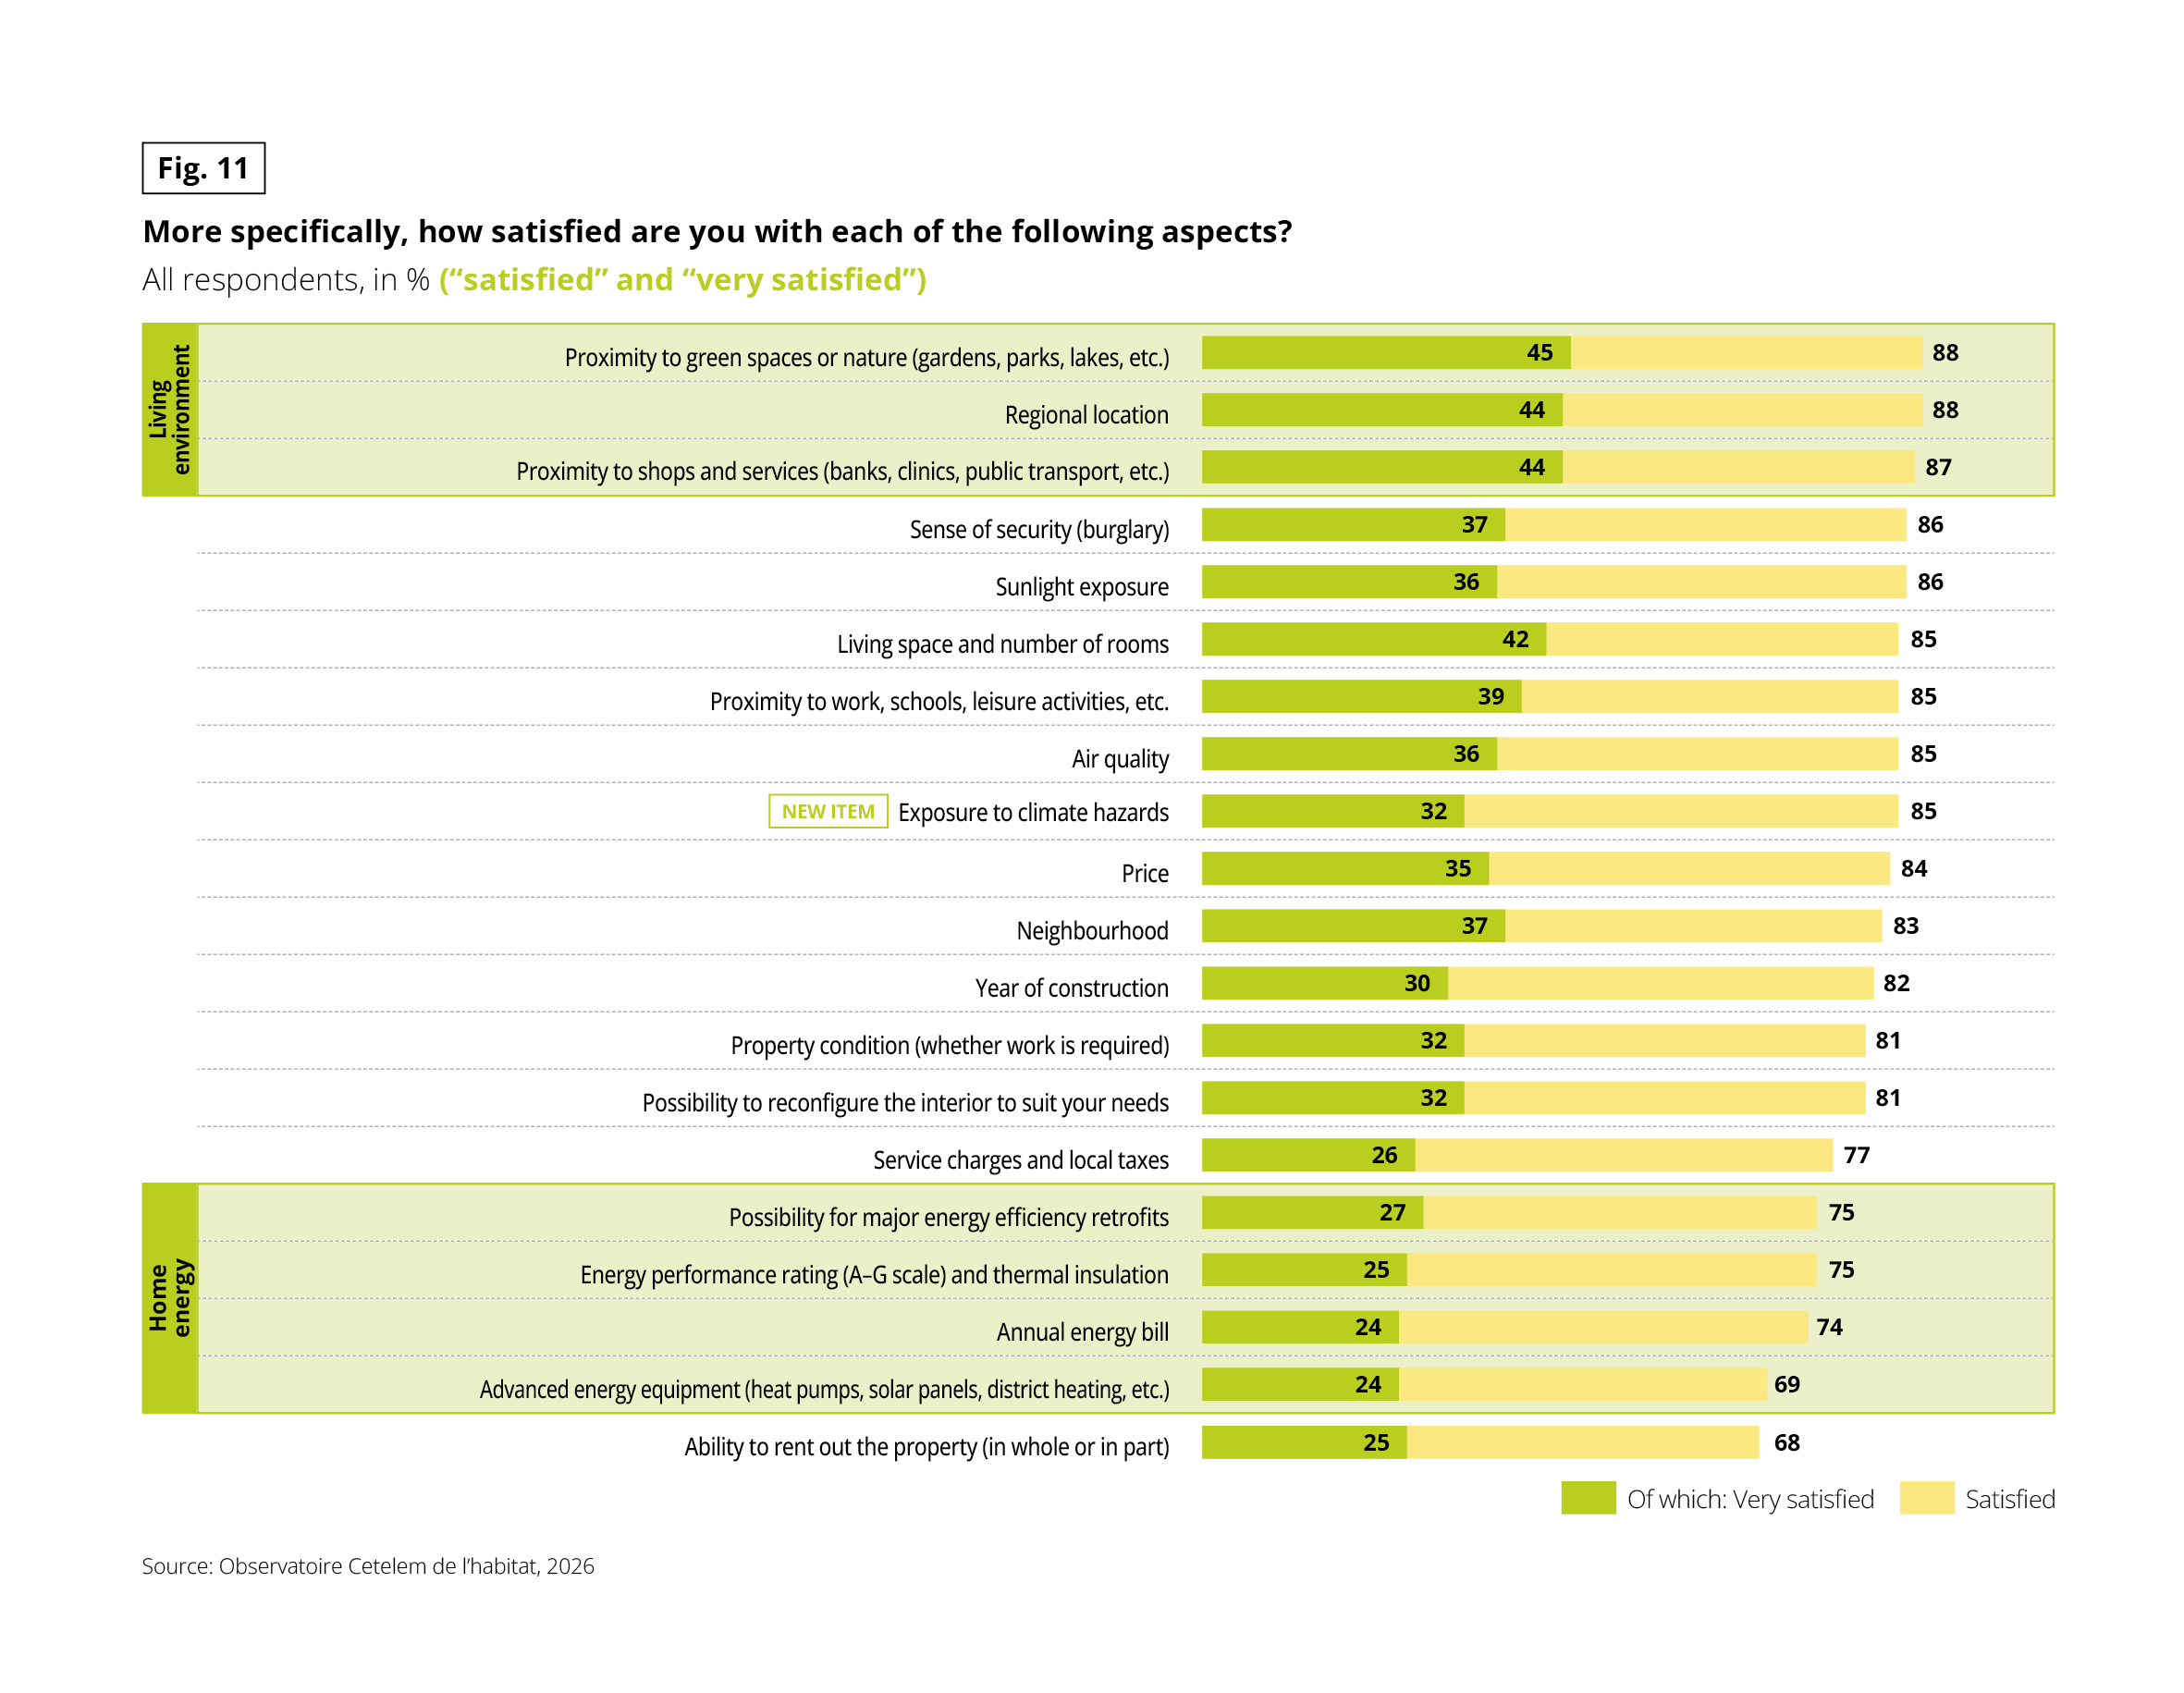 Horizontal bar chart. Question: “More specifically, how satisfied are you with each of the following aspects?” Base: all respondents, in % “satisfied” plus “very satisfied”. Two figures per item: the share “of which very satisfied”, then the total satisfied. Items are grouped in two highlighted blocks, “Living environment” and “Home energy”. Source: Observatoire Cetelem de l’habitat, 2026.
Data in the form of which very satisfied / total satisfied:
Living environment block:
• Proximity to green spaces or nature (gardens, parks, lakes, etc.): 45 / 88
• Regional location: 44 / 88
• Proximity to shops and services (banks, clinics, public transport, etc.): 44 / 87
Other items:
• Sense of security (burglary): 37 / 86
• Sunlight exposure: 36 / 86
• Living space and number of rooms: 42 / 85
• Proximity to work, schools, leisure activities, etc.: 39 / 85
• Air quality: 36 / 85
• Exposure to climate hazards (new item): 32 / 85
• Price: 35 / 84
• Neighbourhood: 37 / 83
• Year of construction: 30 / 82
• Property condition (whether work is required): 32 / 81
• Possibility to reconfigure the interior to suit your needs: 32 / 81
• Service charges and local taxes: 26 / 77
Home energy block:
• Possibility for major energy efficiency retrofits: 27 / 75
• Energy performance rating (A–G scale) and thermal insulation: 25 / 75
• Annual energy bill: 24 / 74
• Advanced energy equipment (heat pumps, solar panels, district heating, etc.): 24 / 69
Last item, outside the blocks:
• Ability to rent out the property (in whole or in part): 25 / 68
Living environment aspects are rated highest (87 to 88%). Energy-related aspects and service charges are rated lowest (68 to 77%).
Housing is thus a solid anchor, but its experience varies markedly depending on tenure, age and property type. What remains is to measure what it truly costs those who live in it.