
Housing budgets under strain, with energy on the front line


 8 min
reading time
It is on household budgets that this economic equation takes its heaviest toll. Housing remains the largest expenditure item for European households, and the one where financial pressure is felt most acutely. We now turn to how Europeans are experiencing this strain and where its burden falls heaviest.
Fig. 12.1 – Total housing costs as a share of household consumption, 2012–2025
Download this infographic for your presentations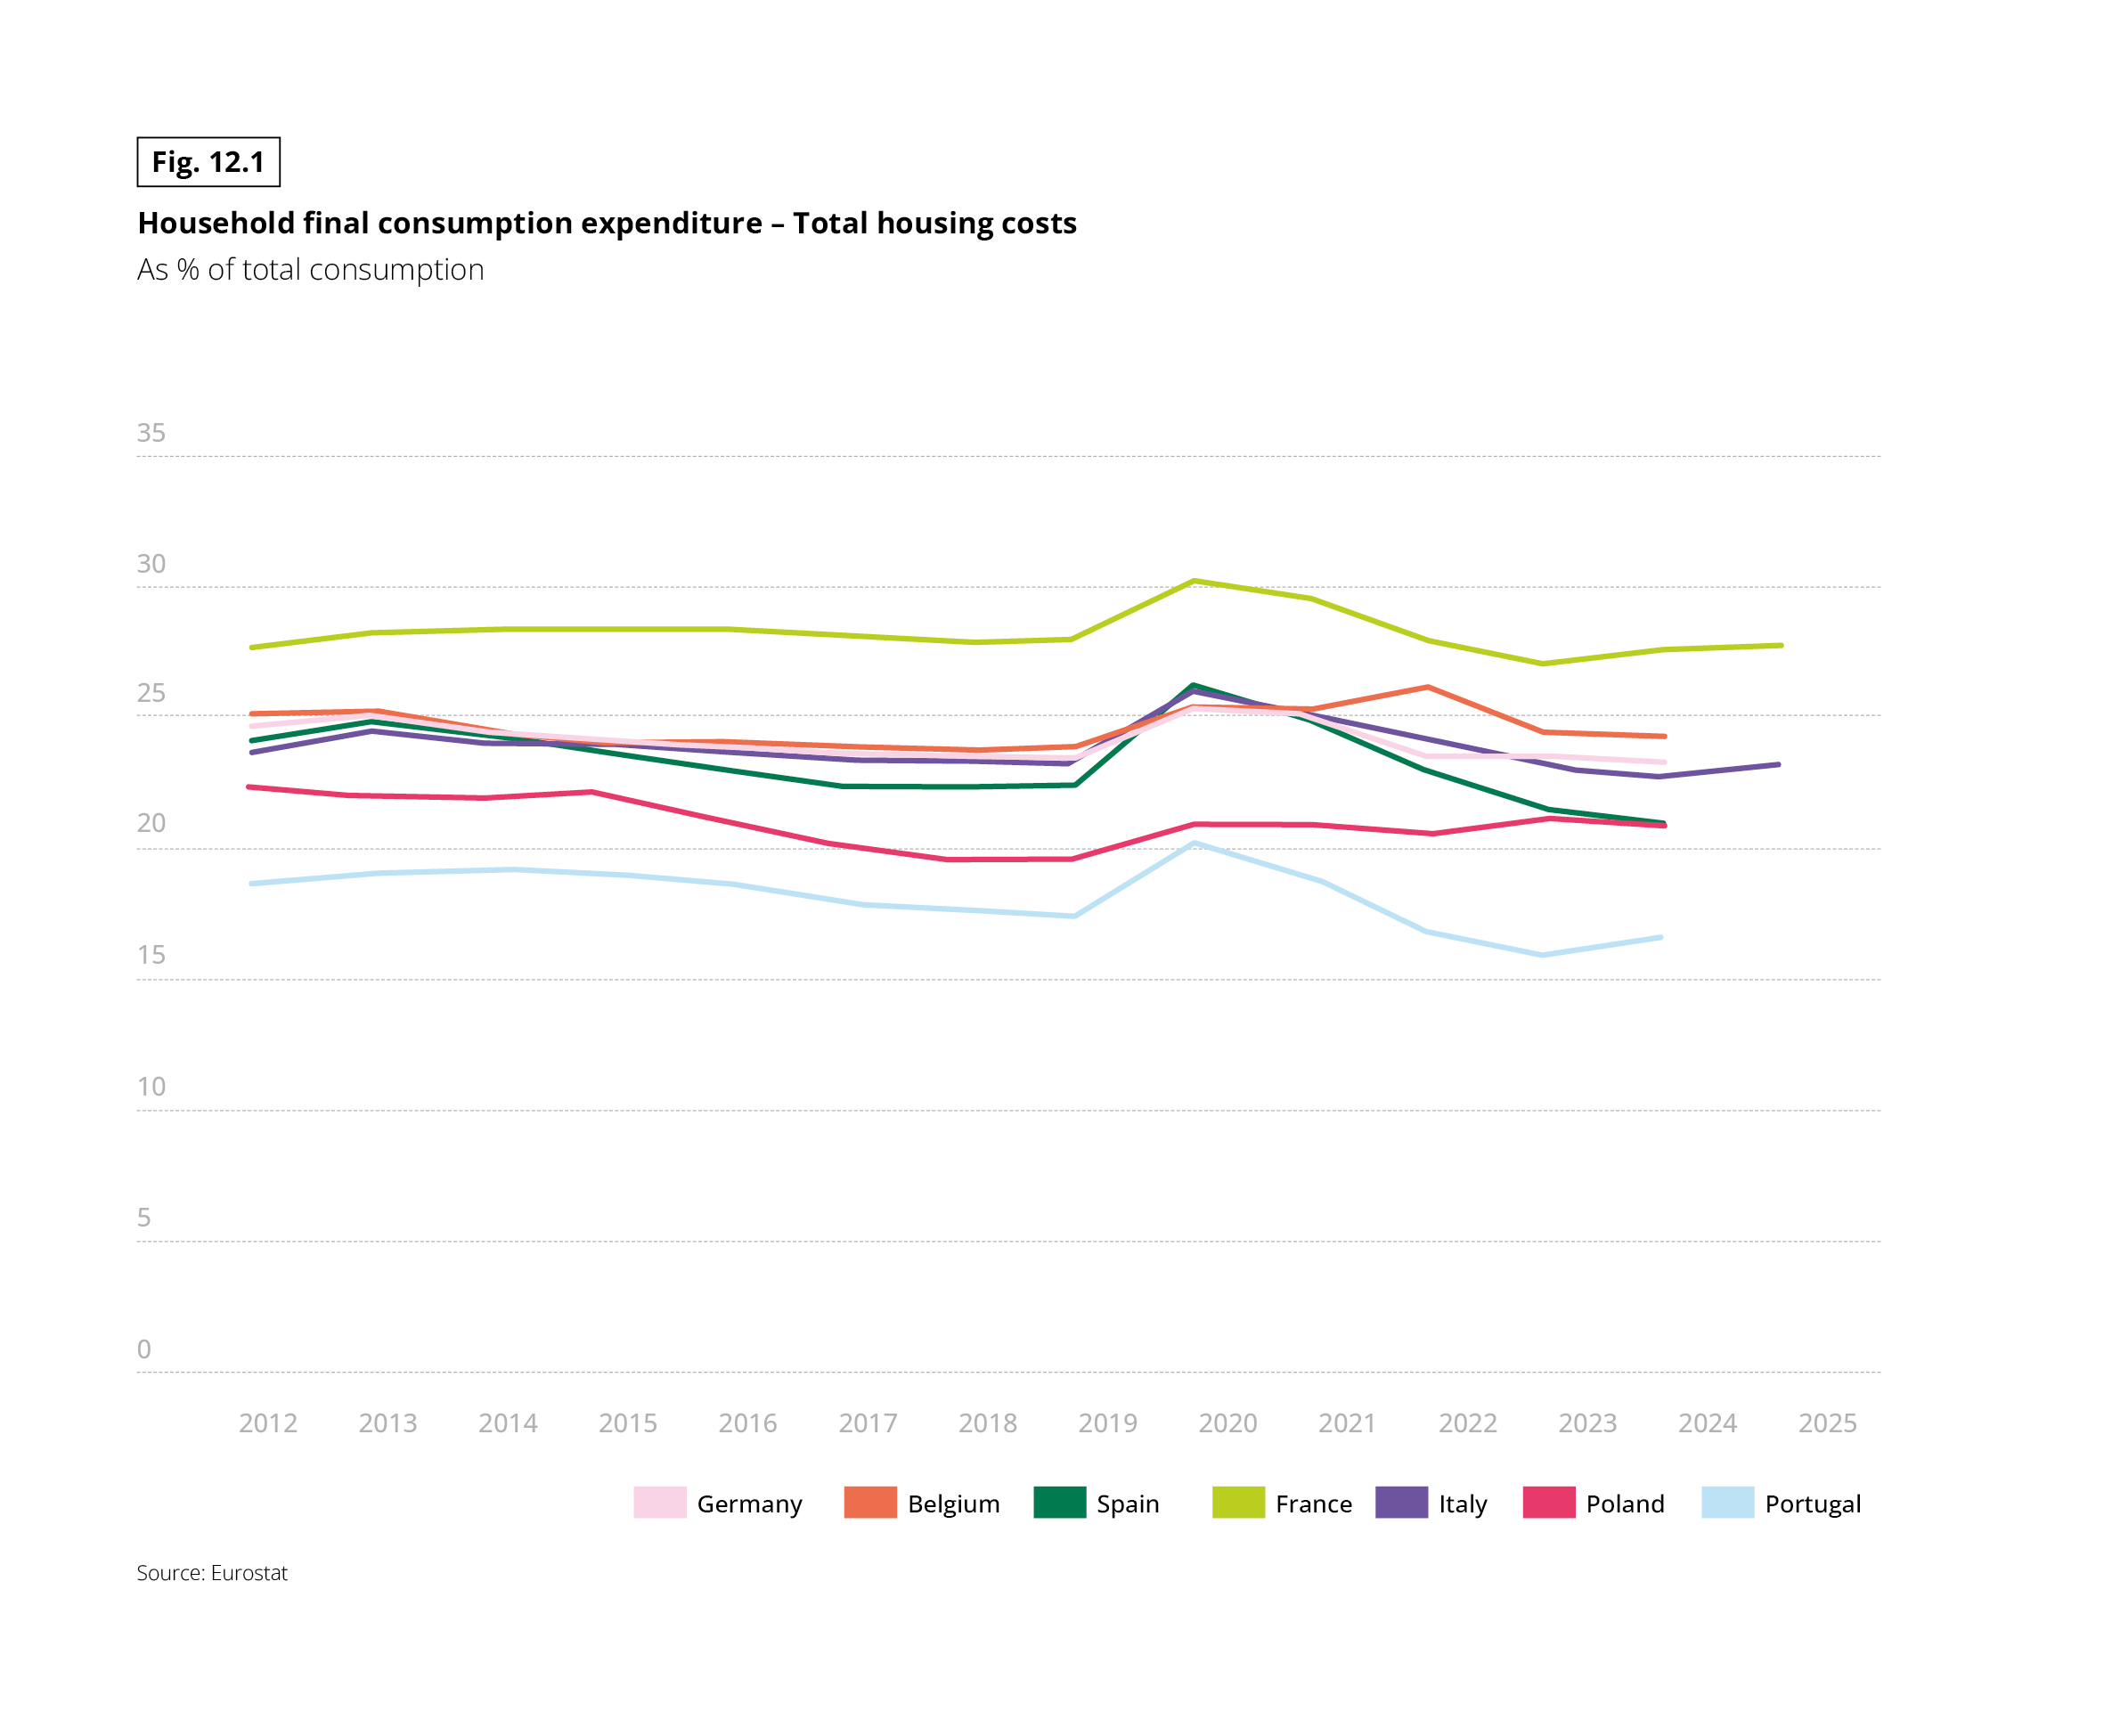 Line chart with seven series, one per country: Germany, Belgium, Spain, France, Italy, Poland and Portugal. Unit: % of total household final consumption expenditure. Years 2012 to 2025. Series for France and Italy extend to 2025; the others stop in 2024. Source: Eurostat.
Approximate values read from the chart, in the form 2012 / 2020 / latest year:
• France: 28 / 30 / 28
• Belgium: 25 / 25 / 24
• Germany: 25 / 25 / 23
• Italy: 24 / 26 / 23
• Spain: 24 / 26 / 21
• Poland: 22 / 21 / 21
• Portugal: 19 / 20 / 17
France has the highest share every year and Portugal the lowest. Shares are stable until 2019, rise in 2020 in most countries, then fall back. Spain shows the largest decline since 2020 (about 5 points).
Fig. 12.2 – Breakdown of housing costs as a share of household consumption, 2024
Download this infographic for your presentations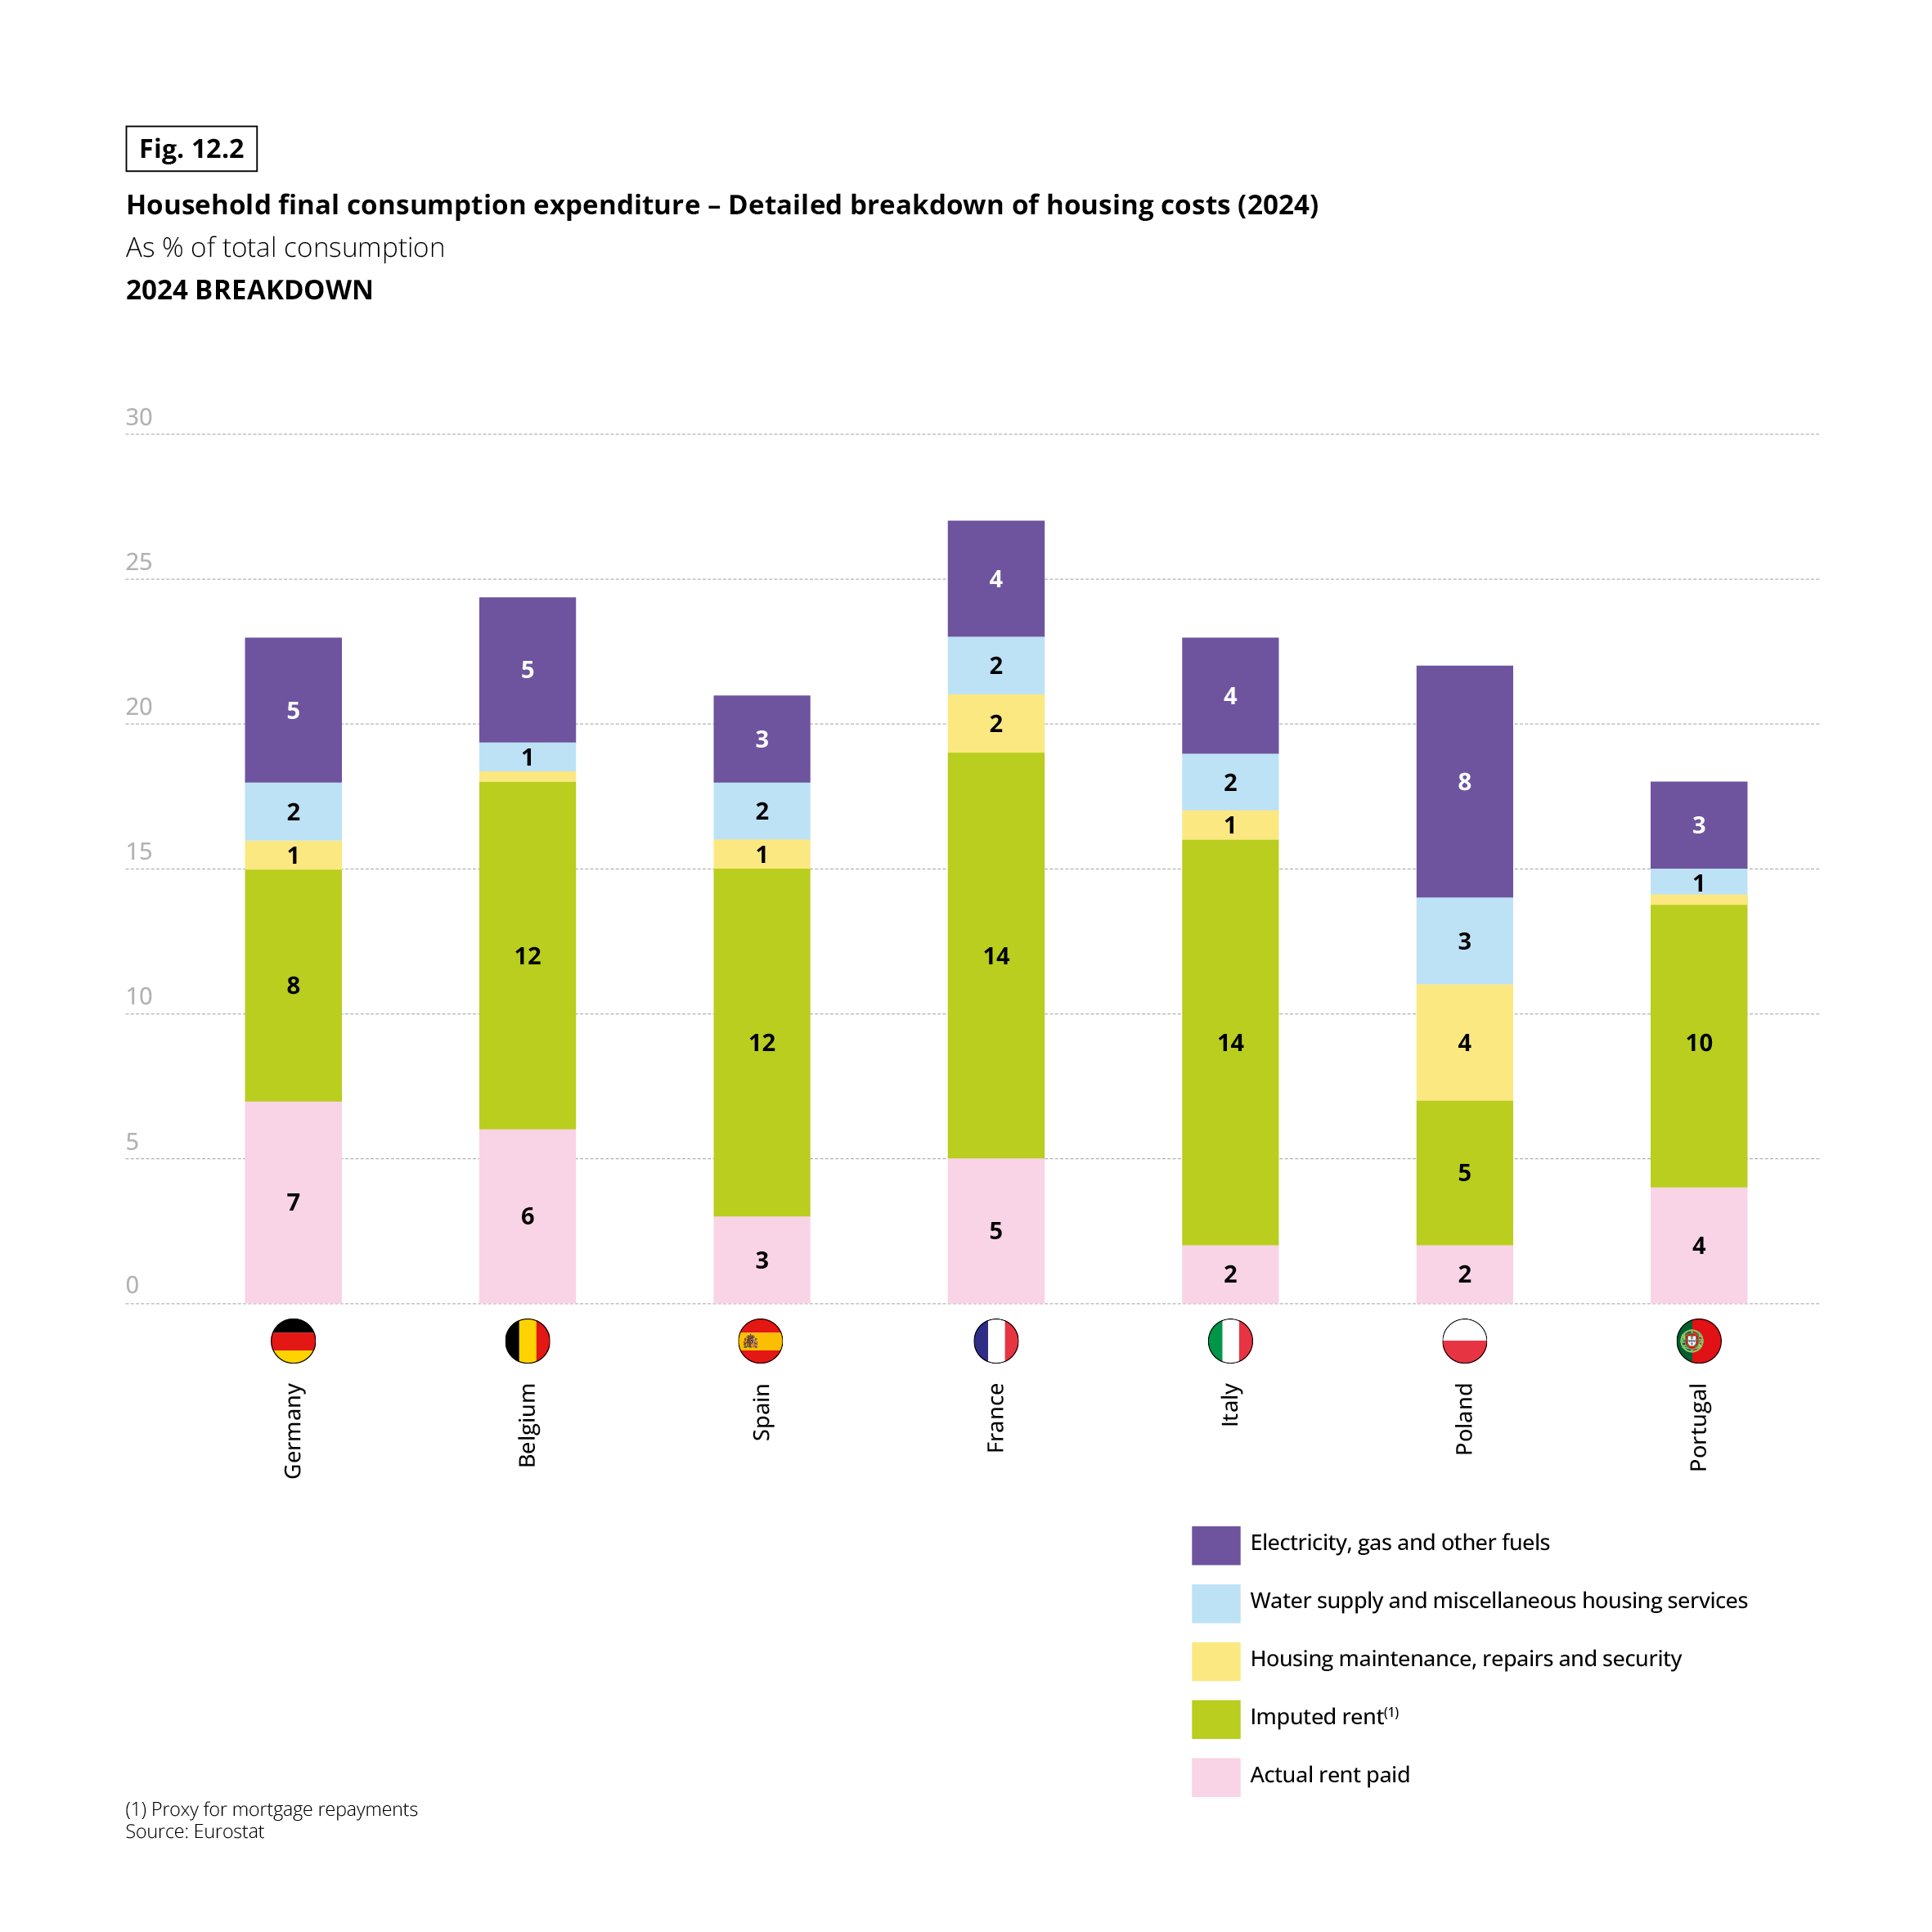 Stacked vertical bar chart. Unit: % of total household consumption, 2024. Five components: actual rent paid; imputed rent (proxy for mortgage repayments); housing maintenance, repairs and security; water supply and miscellaneous housing services; electricity, gas and other fuels. Totals are sums of the rounded labels, calculated for this description. Thin segments without a label are below 1%. Source: Eurostat.
Data in the form actual rent / imputed rent / maintenance, repairs and security / water and services / electricity, gas and fuels (total):
• Germany: 7 / 8 / 1 / 2 / 5 (about 23)
• Belgium: 6 / 12 / under 1 / 1 / 5 (about 24)
• Spain: 3 / 12 / 1 / 2 / 3 (about 21)
• France: 5 / 14 / 2 / 2 / 4 (about 27)
• Italy: 2 / 14 / 1 / 2 / 4 (about 23)
• Poland: 2 / 5 / 4 / 3 / 8 (about 22)
• Portugal: 4 / 10 / under 1 / 1 / 3 (about 18)
Imputed rent is the largest component in all countries except Poland. Poland is the country where electricity, gas and other fuels weigh the most (8%) and where imputed rent weighs the least (5%). France has the highest total and Portugal the lowest.
RISING ENERGY PRICES ARE SLOWING, BUT REMAIN THE PRIMARY BUDGETARY PRESSURE ON HOUSING
More than 8 in 10 Europeans report an increase in their electricity, gas and heating oil bills over the past 12 months, with nearly a third describing the rise as substantial. This surge is cited far more frequently than increases in service charges, home insurance or maintenance expenses. By contrast, rent and monthly mortgage payments emerge as the most stable expenditure items.
These perceptions reflect the ongoing aftershocks of the 2022–2023 crisis, when housing and energy inflation jumped by more than 30 percentage points in France relative to 2015 and nearly doubled in Poland in the absence of a tariff shield. However, the perceived rise in energy prices remains less acute than it was two years ago.
Fig. 13 – Change in the housing budget share over the past 12 months, by category
Download this infographic for your presentations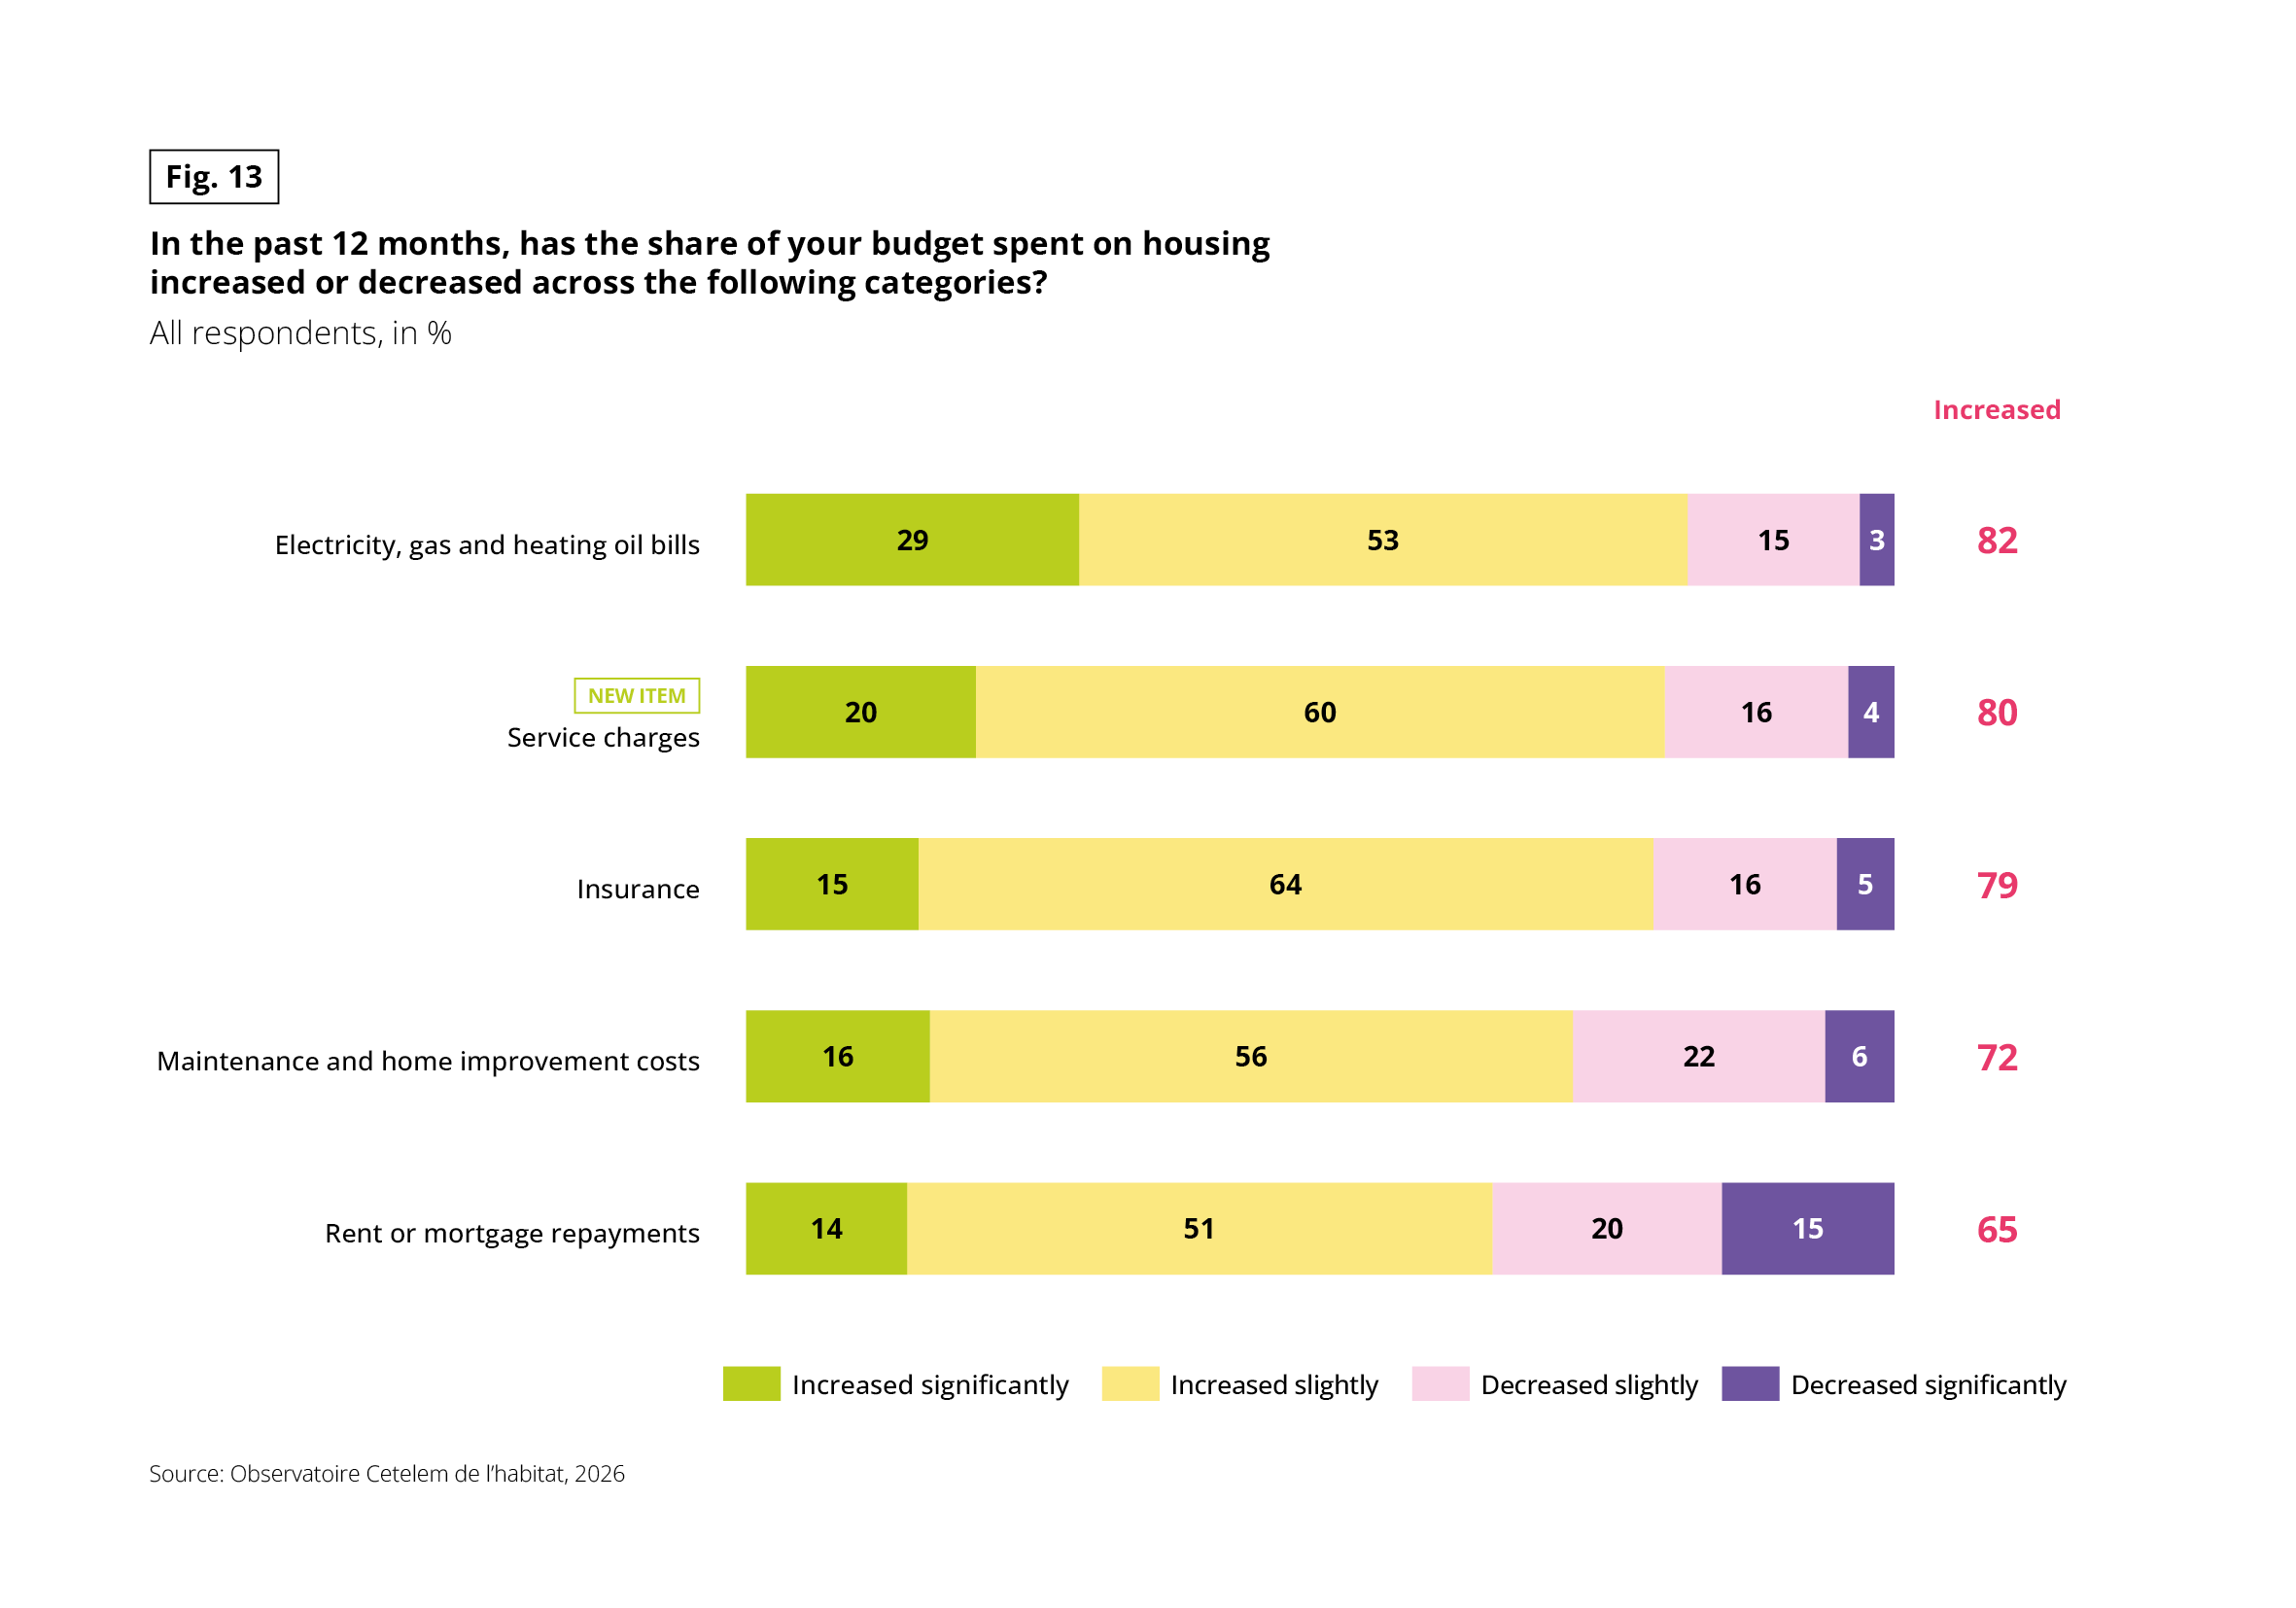 Stacked horizontal bar chart. Question: “In the past 12 months, has the share of your budget spent on housing increased or decreased across the following categories?” Base: all respondents, in %. Four answers: increased significantly, increased slightly, decreased slightly, decreased significantly. The “Increased” subtotal is shown to the right of each bar. Source: Observatoire Cetelem de l’habitat, 2026.
Data in the form increased significantly / increased slightly / decreased slightly / decreased significantly (increased subtotal):
• Electricity, gas and heating oil bills: 29 / 53 / 15 / 3 (82)
• Service charges (new item): 20 / 60 / 16 / 4 (80)
• Insurance: 15 / 64 / 16 / 5 (79)
• Maintenance and home improvement costs: 16 / 56 / 22 / 6 (72)
• Rent or mortgage repayments: 14 / 51 / 20 / 15 (65)
Energy bills are the most frequently reported increase and also the most often “significant” (29%). Rent or mortgage repayments show the lowest share of increases (65%) and the highest share of significant decreases (15%).
Fig. 14 – Consumer price index for housing energy, 2012–2025
Download this infographic for your presentations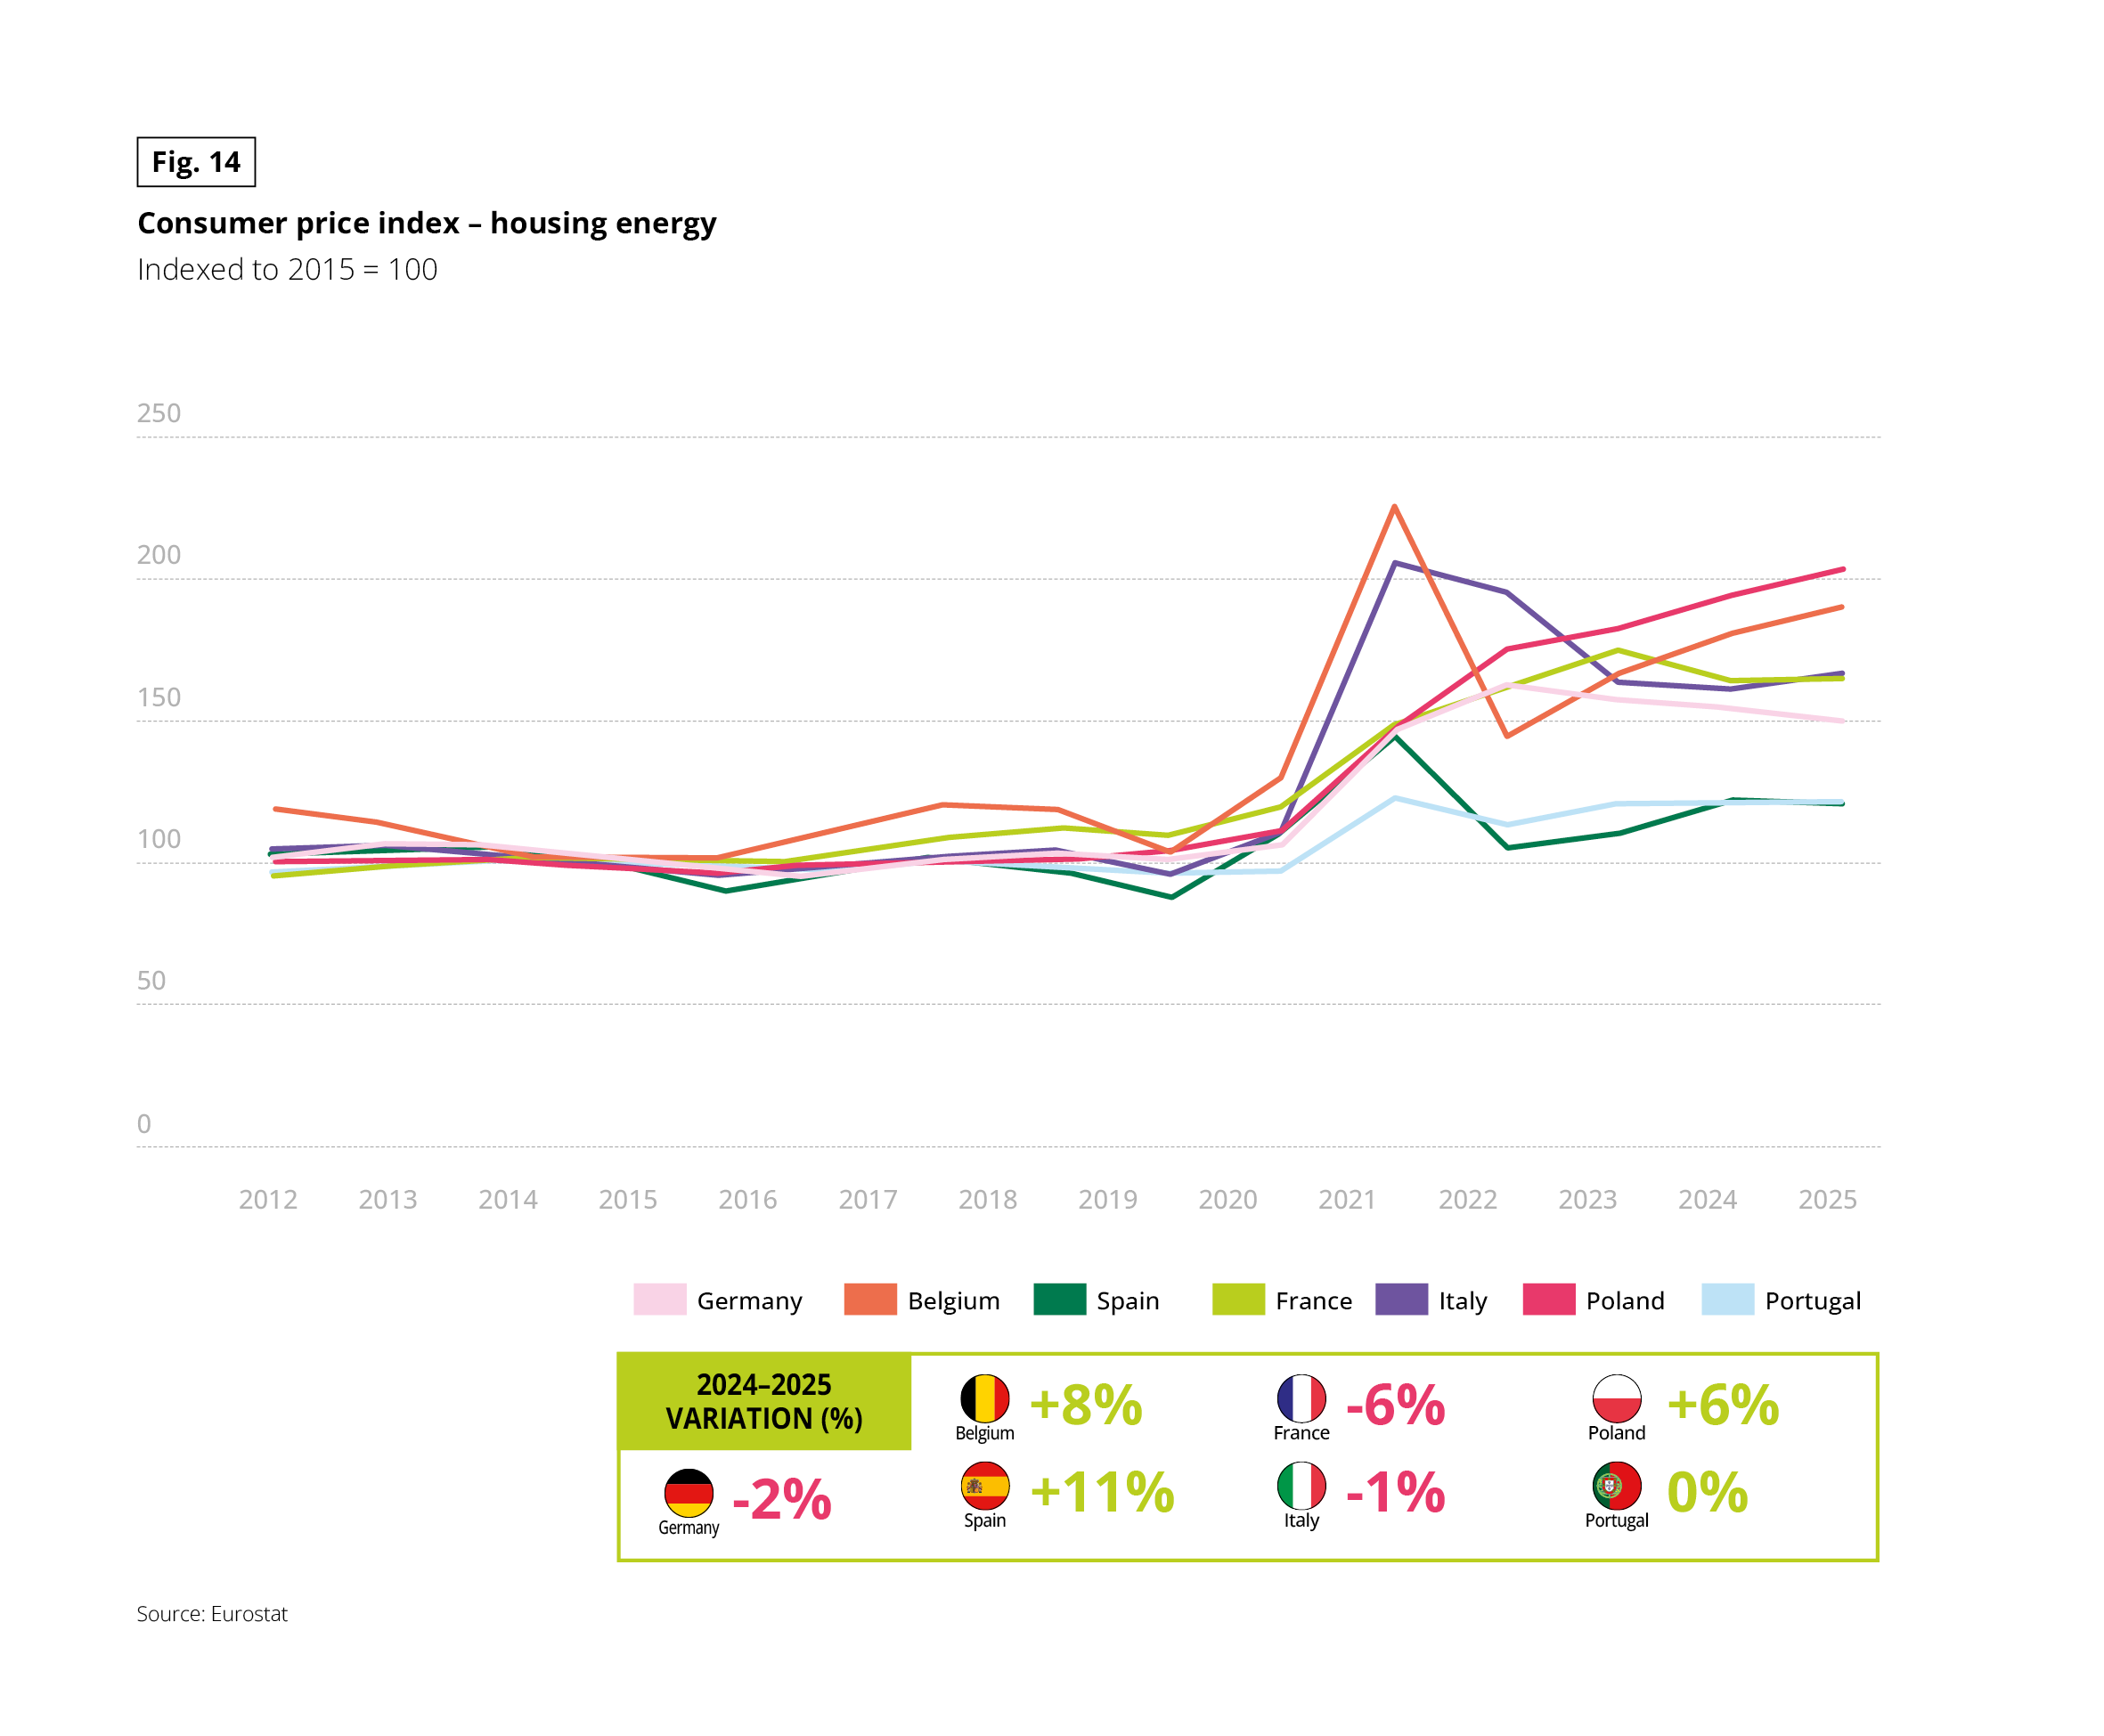 Line chart with seven series: Germany, Belgium, Spain, France, Italy, Poland and Portugal. Unit: index, 2015 = 100. Years 2012 to 2025. A box gives the 2024–2025 variation for each country. Source: Eurostat.
2024–2025 variation: Belgium +8%, Spain +11%, Poland +6%, Portugal 0%, Germany −2%, Italy −1%, France −6%.
Trend (approximate values read from the chart): all countries stay close to 100 (between about 90 and 120) until 2020. All then surge around 2021–2022. Belgium peaks at about 225 and Italy at about 205, while Spain and Portugal peak lower, at about 145 and 120. After the peak, trajectories diverge. In 2025, Poland (about 200) and Belgium (about 190) are the highest. Italy, France and Germany are between about 150 and 170, and Spain and Portugal are the lowest, at about 120.
Compounding the pressure on running costs is the challenge of gaining access to housing. Long-term interest rates have reached highs not seen since 2023, and their surge has fed directly into mortgage rates: 3–4% in the euro area, 5% in the UK and as high as 7% in Poland. In practical terms, an extra percentage point on a long-term mortgage adds tens of thousands of euros to the total cost of buying a home, or reduces borrowing capacity by an equivalent amount.
These shifts risk pricing out some first-time buyers and stalling home-purchase plans. Financial pressure is thus shifting from the initial purchase to the ongoing cost of occupancy, particularly in the panel’s most developed economies. Their housing stock, both larger and older due to earlier economic development, now appears to have reached a degree of saturation compared to other countries. It is in the Iberian Peninsula that this catch-up is currently progressing fastest.
Fig. 15 – Residential mortgage interest rates, 2012–2025
Download this infographic for your presentations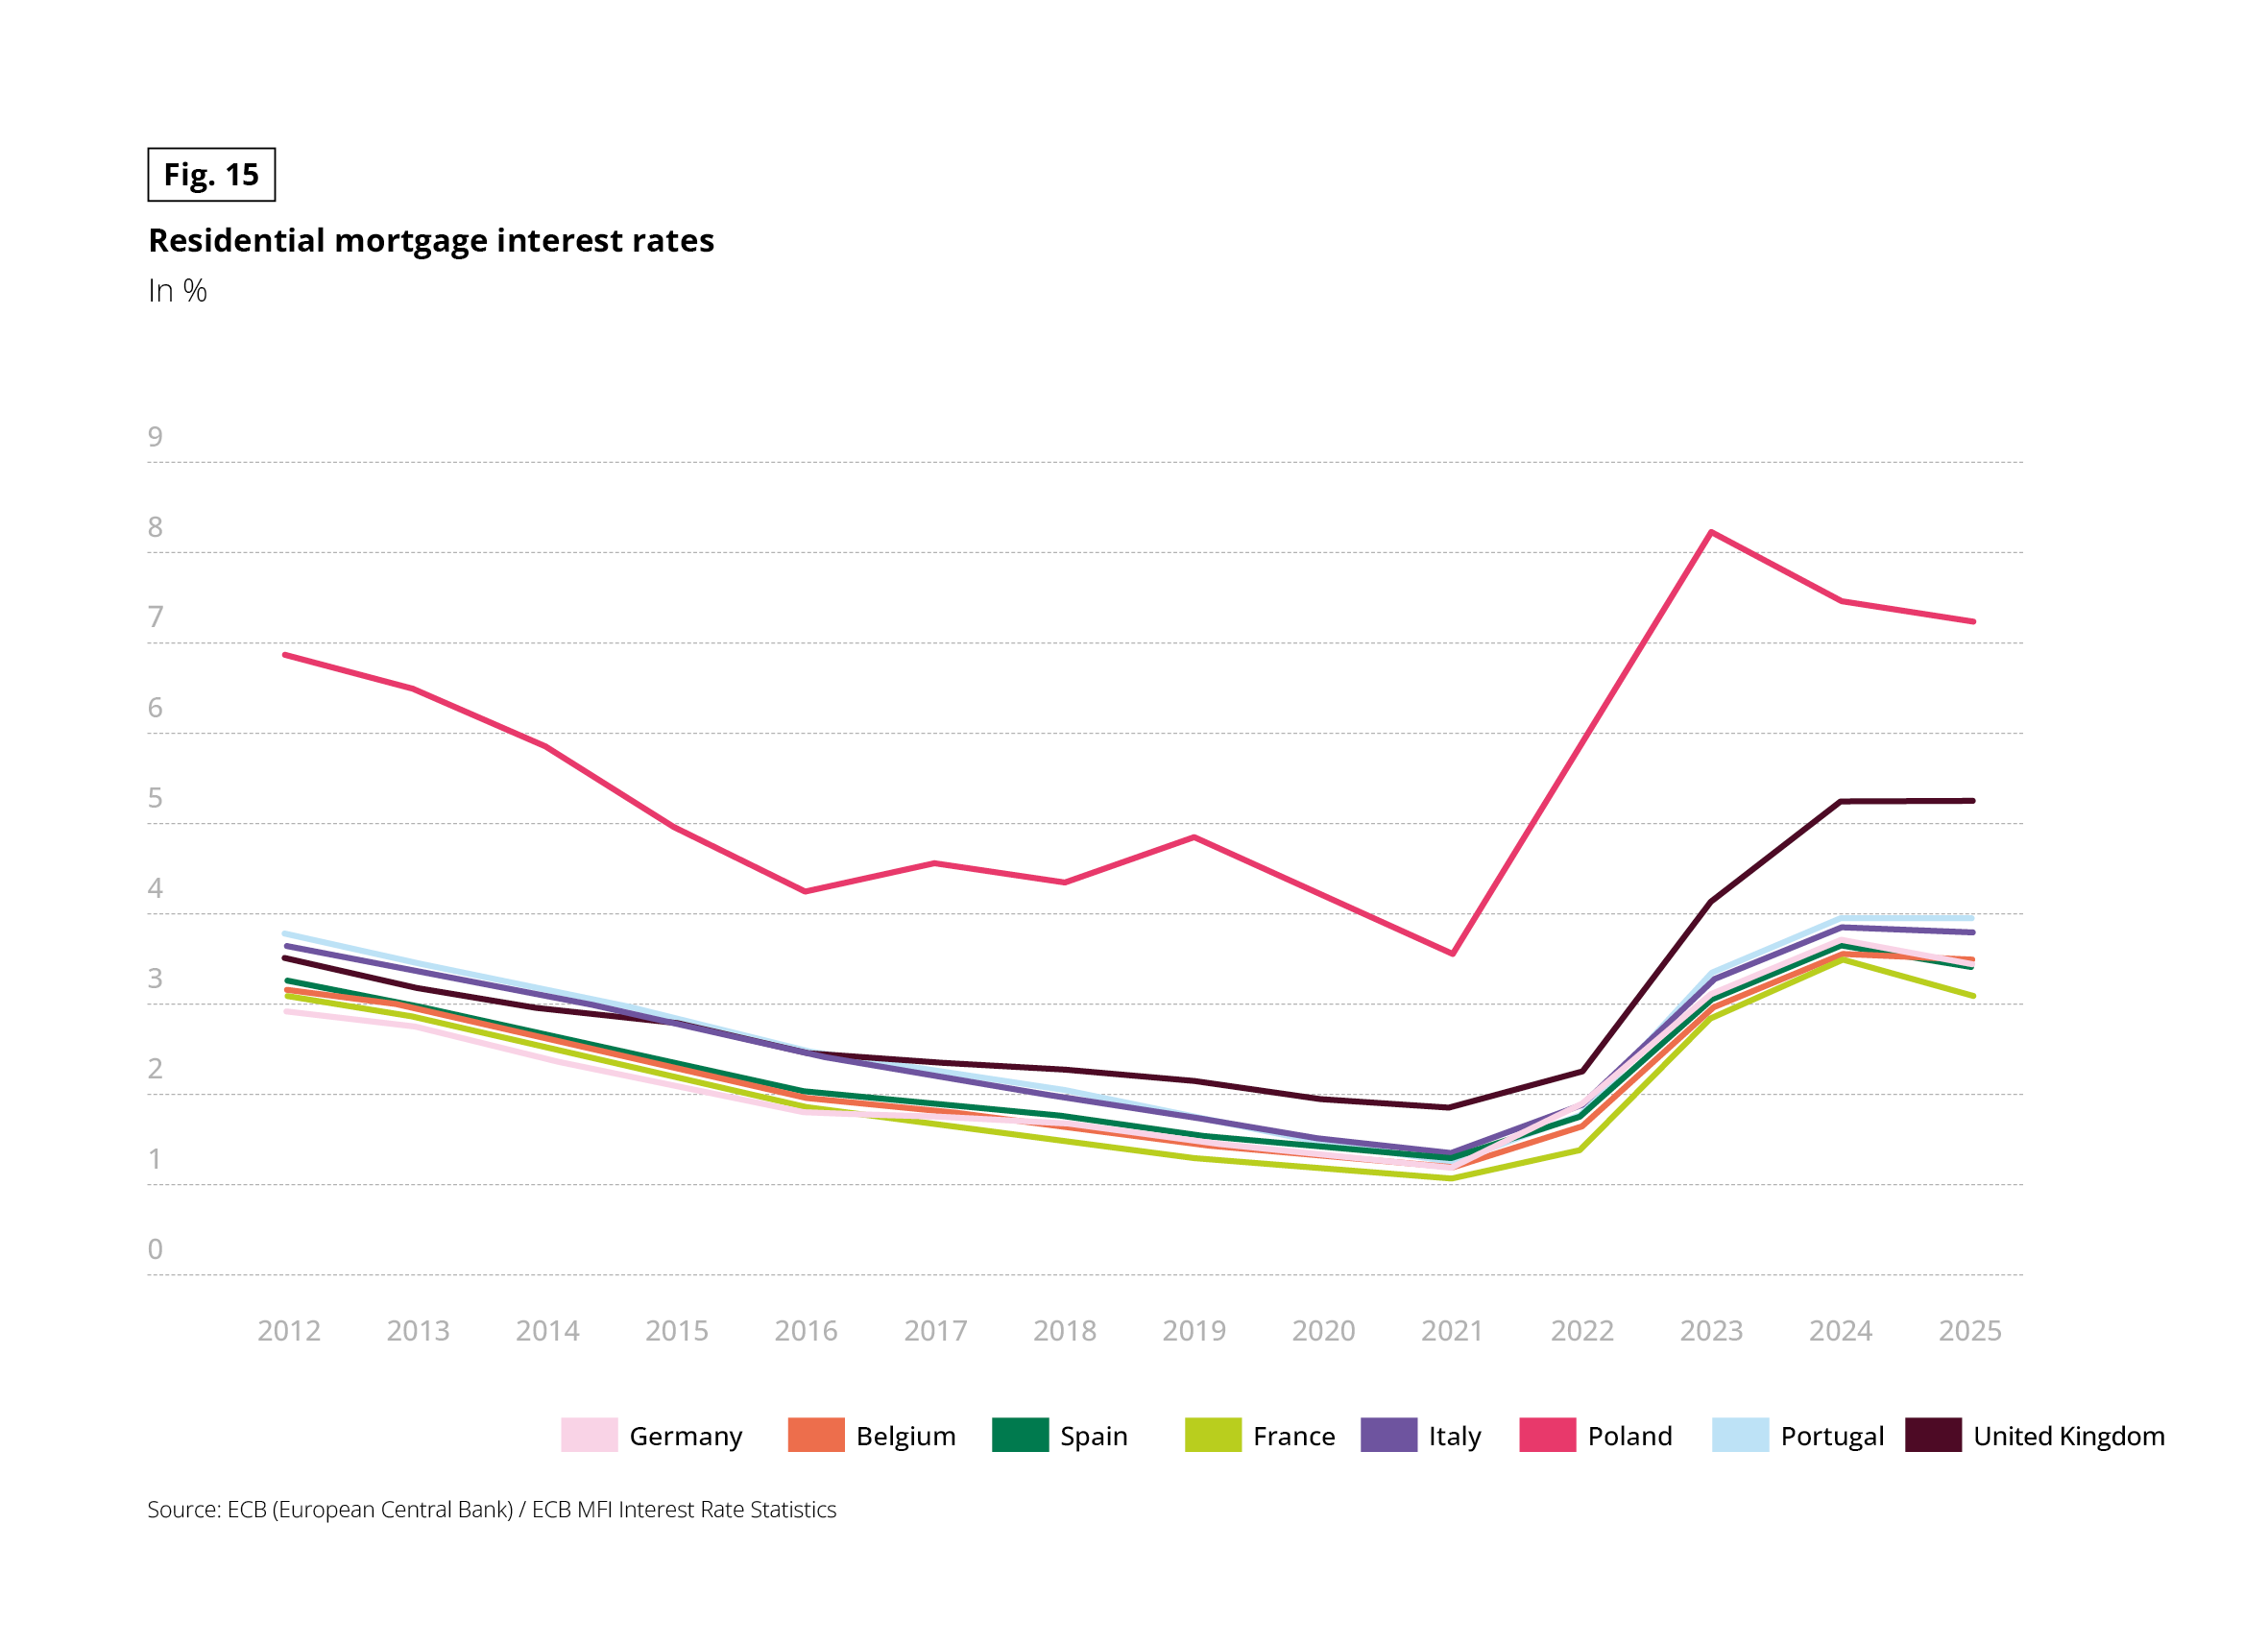 Line chart with eight series: Germany, Belgium, Spain, France, Italy, Poland, Portugal and United Kingdom. Unit: %. Years 2012 to 2025. Source: ECB (European Central Bank) / ECB MFI Interest Rate Statistics.
Approximate values read from the chart, in the form 2012 / 2025:
• Poland: 6.9 / 7.2 (peak about 8.2 in 2023)
• United Kingdom: 3.5 / 5.3
• Portugal: 3.8 / 4.0
• Italy: 3.6 / 3.8
• Germany: 2.9 / 3.5
• Belgium: 3.2 / 3.5
• Spain: 3.3 / 3.4
• France: 3.1 / 3.1
Rates fall in all countries until 2021 (about 1 to 2%, and about 3.6% in Poland). They then rise sharply until 2023–2024. Poland is the highest throughout. The United Kingdom is second highest after 2023. The other countries are grouped between about 3 and 4% in 2025.
Yet European perceptions do not neatly align with the reality of energy prices today. Two distinct patterns emerge across the panel:
- The lingering memory of the crisis: in Italy and Portugal, perceived price increases remain the highest in the survey, even though energy prices there have been flat over the past year. Consumer sentiment remains anchored to the cumulative shock felt since 2022, unmoored from recent trends.
- Psychological acclimation: Spain presents the opposite dynamic, with perceived increases easing despite energy expenditure rising faster there than anywhere else between 2024 and 2025. After years of elevated prices, households have become accustomed to the strain, even as their bills continue to climb. France fits neither pattern, with prices and perceptions falling in tandem and no disconnect to explain.
What differentiates these cases is less the current level of prices than each economy’s capacity to absorb the past shock. In Italy, where purchasing power growth remains sluggish, households struggle to absorb even stabilised prices; every bill remains a stretch, keeping sentiment on edge. Portugal, meanwhile, experienced the panel’s sharpest surge in overall housing costs in recent years (+49% between 2021 and 2025); the recent levelling-off in energy costs has not yet been enough to erase the trauma of that initial spike. By contrast, Spain combines robust GDP growth with strong gains in real income. This financial cushion allows households to absorb ongoing energy price increases without a further deterioration in sentiment.
Attributing overall housing pressure solely to energy, however, oversimplifies the picture: costs are rising across all expenditure items, albeit to varying degrees. Four in five Europeans report increases in service charges, hardly surprising given that communal building maintenance incorporates shared energy bills.
Home insurance premiums are also rising and now outpace headline inflation. Having lagged during the 2021–2023 inflationary surge, they caught up and overtook broader price growth from 2024 onwards. The driver is spiralling industry costs: soaring rebuild expenses (materials and labour) alongside a surge in extreme weather events. Rather than a steady drift, these increases take effect in steps: premiums are typically adjusted once a year, usually in January, with each step-up growing steeper as underlying liabilities accumulate. Belgium offers the clearest example, with property cover indexed to the ABEX construction cost index, which is updated every six months.(1)
This trend varies widely across borders. It is particularly pronounced in countries hit by climate-related claims where policy mechanisms pass on costs quickly: Belgium was hit by the Wallonia floods in 2021; France saw its “natural disaster” surcharge(2) jump from 12% to 20% on 1 January 2025; and Spain was struck by the Valencia DANA floods in 2024. In Poland, high headline inflation is driving up property insurance costs. Germany stands out as the main exception, with index figures dropping below 2017 levels. Germany has the lowest homeownership rate in the panel, with the owner-occupier share falling by roughly 4 percentage points between 2017 and 2025. However, the “home insurance” line item in German data primarily measures contents insurance taken out by tenants, a competitive market with flat pricing. Building insurance, which has indeed surged, is borne by landlords and passed on to tenants through service charges, where it is accounted for separately. Consequently, German home insurance figures remain structurally lower than elsewhere in Europe.
(1) The ABEX index (Association belge des experts) measures construction cost trends in Belgium. Published biannually, it serves as the benchmark for indexing fire and home insurance premiums. (2) “Natural disaster” surcharge (Cat Nat): a mandatory state levy built directly into home insurance premiums.
Fig. 16.1 – Insurance prices compared with euro area inflation, 2015–2026
Download this infographic for your presentations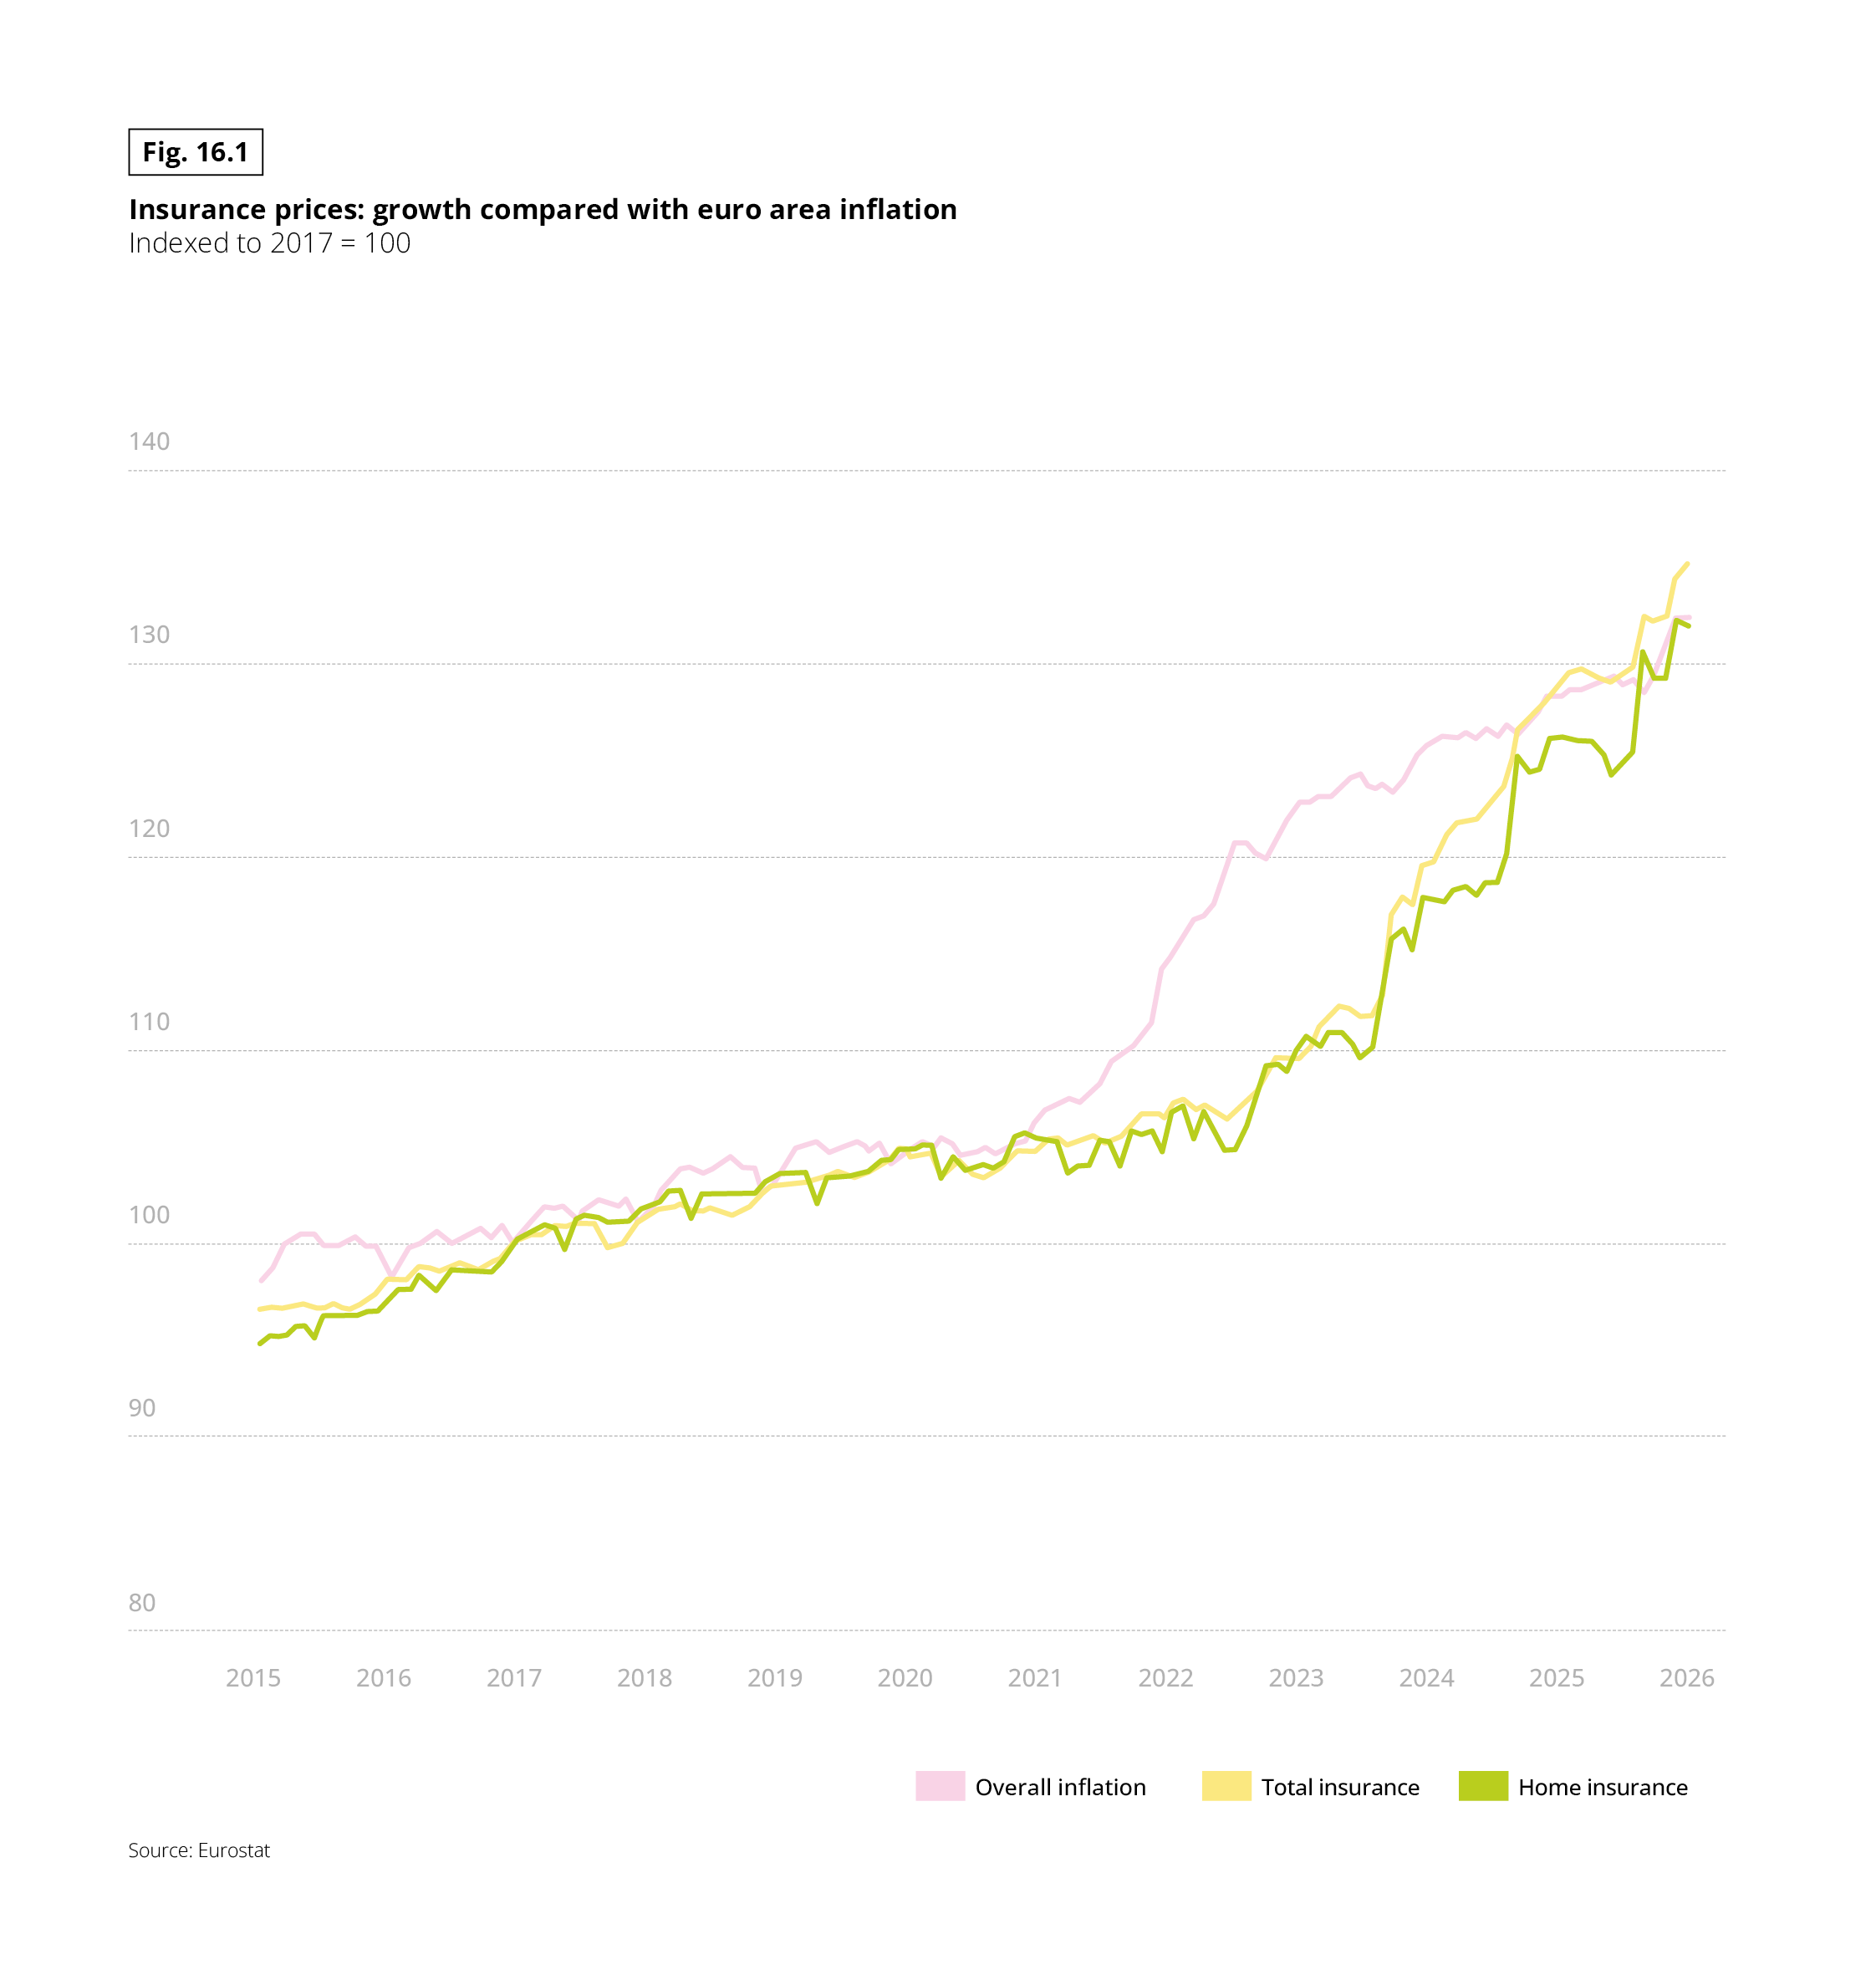 Line chart with three monthly series: overall inflation, total insurance and home insurance. Unit: index, 2017 = 100. From 2015 to 2026. Source: Eurostat.
Approximate values read from the chart:
• Overall inflation: about 98 in 2015, 105 in 2019 to 2021, about 120 at the end of 2022, about 126 in 2024, about 132 in 2026.
• Total insurance: about 96 in 2015, close to inflation until 2021, then about 110 in 2023, about 129 in 2025 and about 135 in 2026.
• Home insurance: about 95 in 2015, similar to total insurance until 2023, a sharp jump in 2024 to about 125, and about 132 in 2026.
Insurance prices rose more slowly than inflation in 2022–2023, then caught up in 2024–2025. In 2026, total insurance is slightly above inflation and home insurance is at about the same level.
Fig. 16.2 – Home insurance prices by country, 2015–2026
Download this infographic for your presentations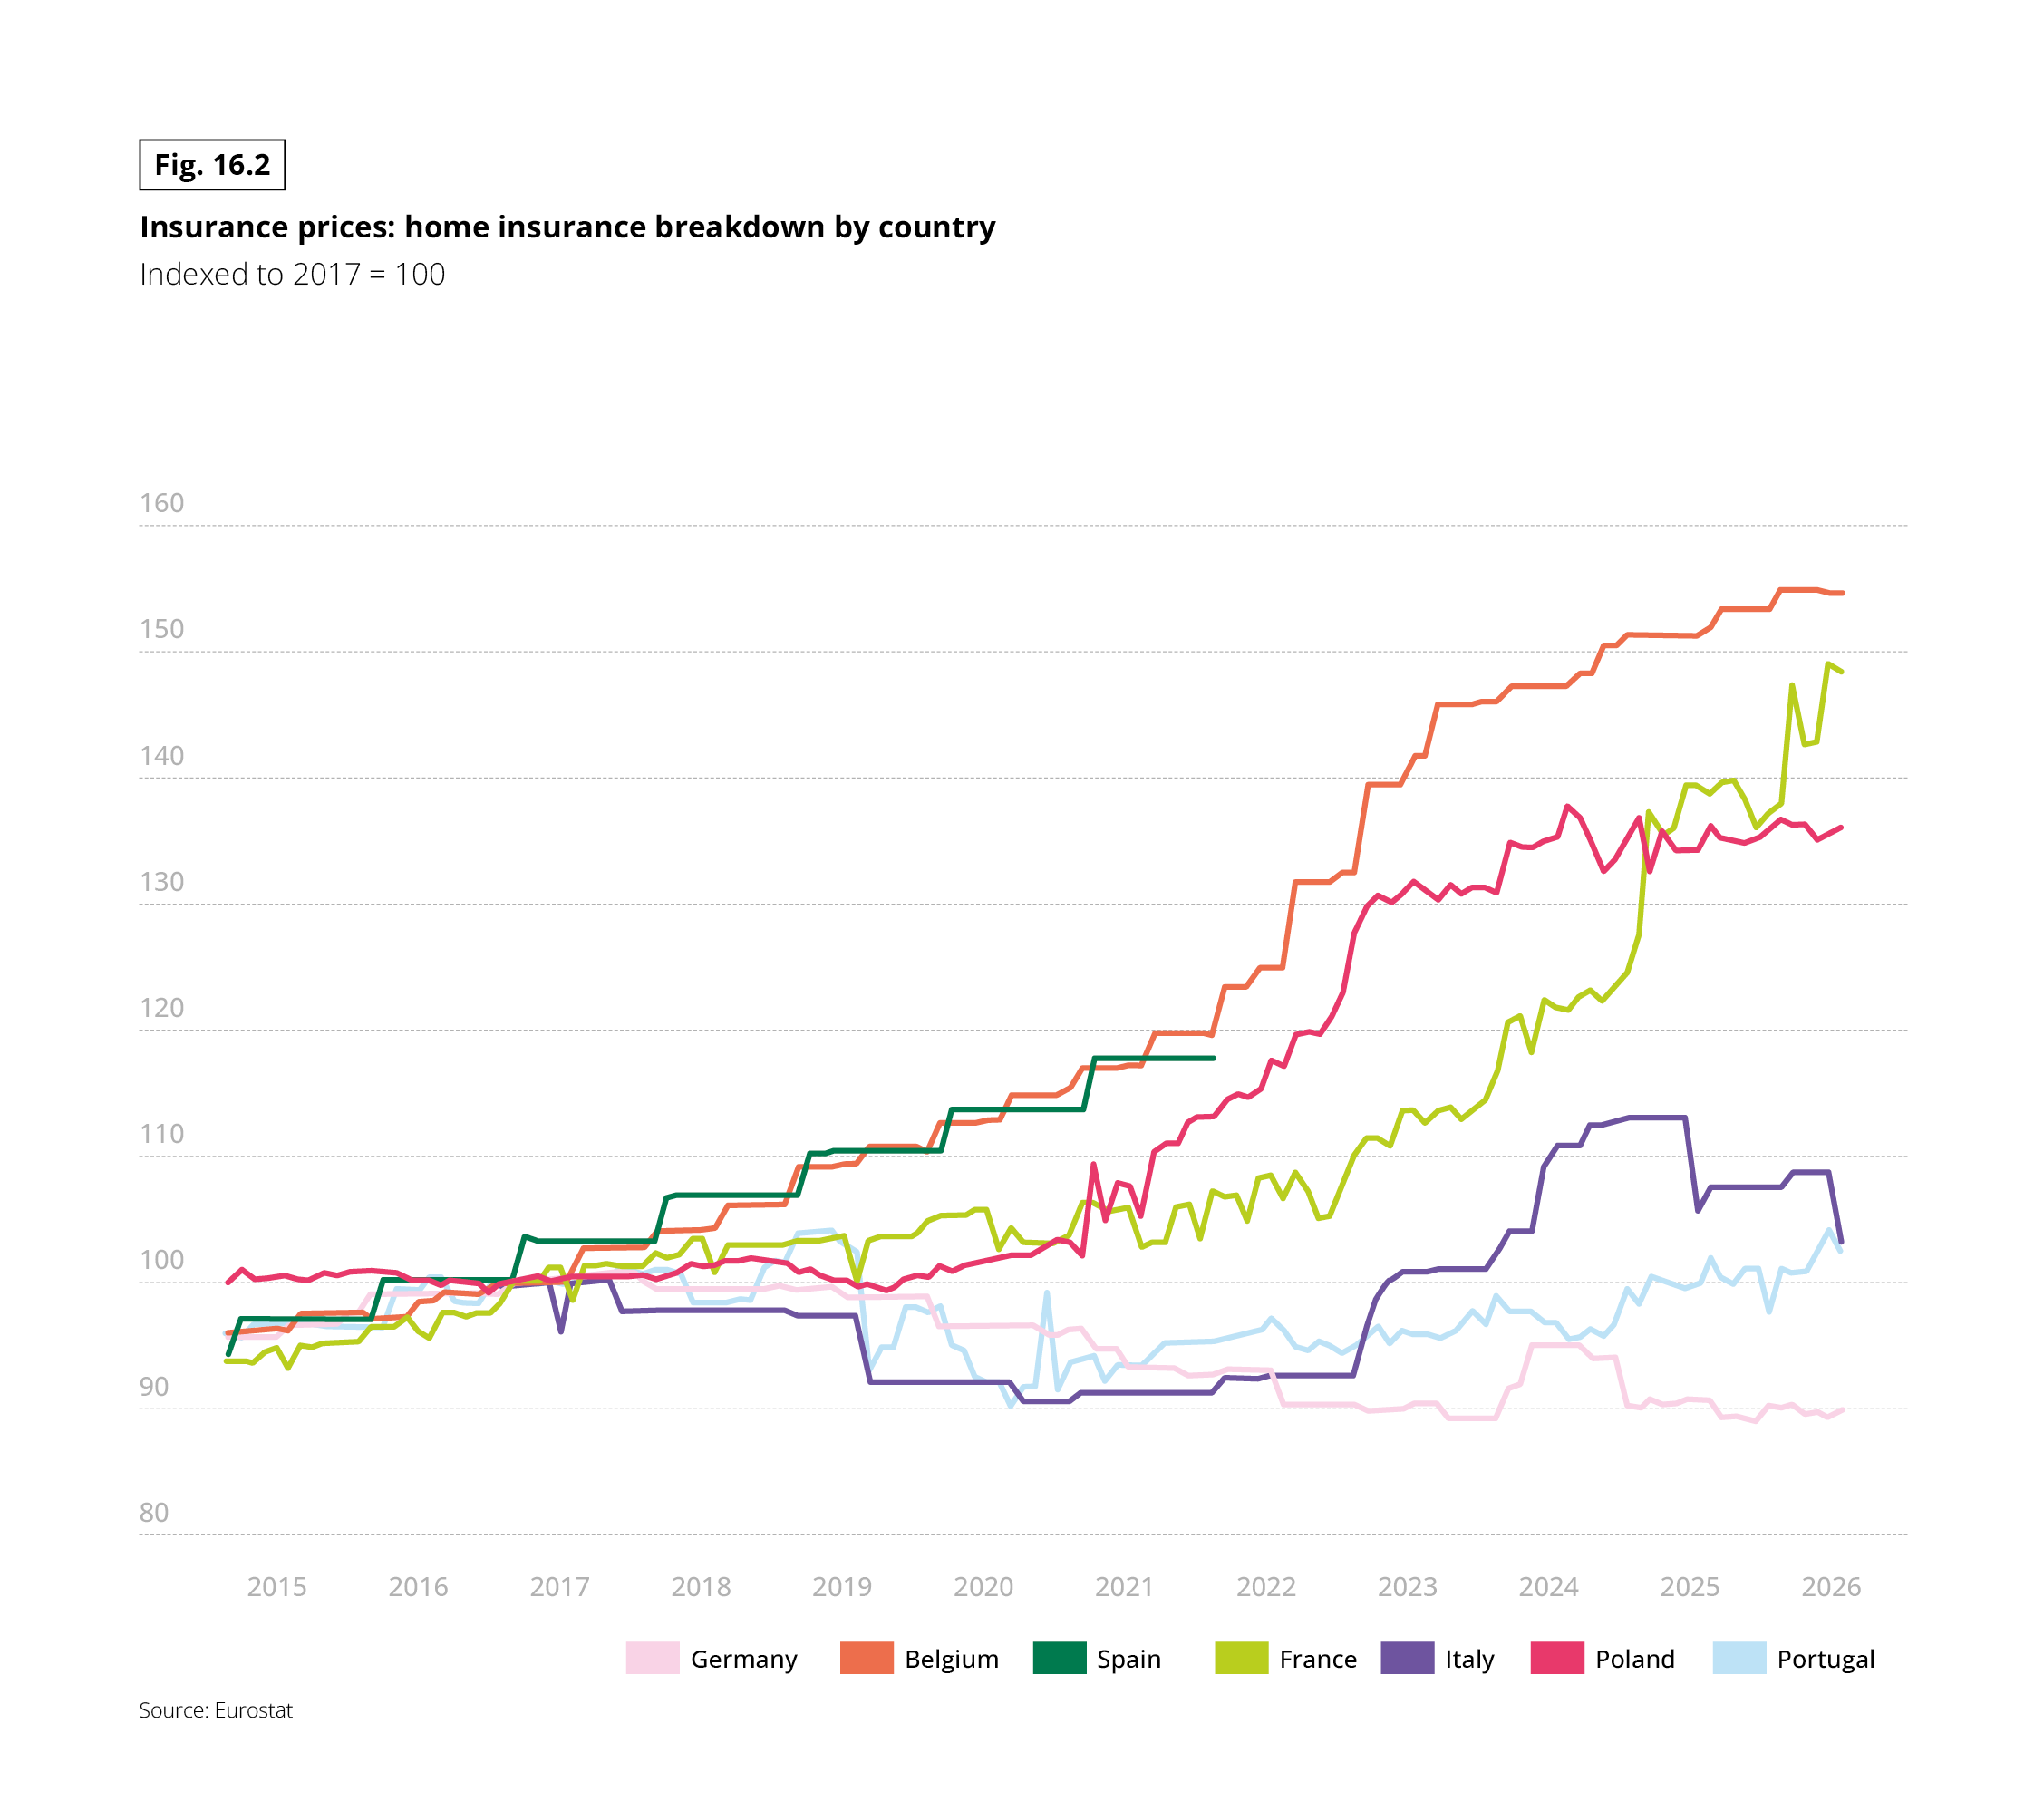 Line chart with seven monthly series: Germany, Belgium, Spain, France, Italy, Poland and Portugal. Unit: index, 2017 = 100. From 2015 to 2026. The Spain series stops around 2021–2022. Source: Eurostat.
Approximate values read from the chart, at the end of each series:
• Belgium: about 155, a steady rise in steps from 100 in 2017
• France: about 148, close to 100 until 2020, about 137 in 2024–2025
• Poland: about 136, rising mainly from 2020
• Spain: about 118, when the series stops
• Italy: about 103, after a rise from about 91 in 2020–2022 to about 113 in 2024
• Portugal: about 102, fluctuating between about 90 and 104
• Germany: about 90, a gradual decline from 2017
Belgium and France show the strongest increases. Germany is the only country where home insurance prices fall steadily.
Rent and mortgage repayments are the sole exception: this is the most stable line item, and the only one where over a third of respondents report a drop, anchored by fixed rates far below today’s market levels. Herein lies the core paradox: baseline property costs, shielded by older rates and rent controls, remain frozen, while everyday occupancy costs drift steadily higher without comparable safeguards.
Taken together, these components drive up total housing costs right across Europe. This holds true even when measured in purchasing power standards (PPS), a unit that neutralises national price disparities to allow like-for-like comparison. Between 2021 and 2025, overall housing expenditure rose everywhere, albeit at starkly different speeds: kept relatively in check in Italy (+15%), Germany (+18%) and France (+19%), it gathered pace in Spain (+31%) and surged in Portugal, jumping by nearly half (+49%). Because Portugal started from one of the panel’s lowest baselines, this rapid convergence feels like a sudden shock to household budgets unequipped for the strain. Pressure is therefore no longer confined to energy: it weighs on the total housing budget, hitting Southern Europe the hardest.
Fig. 17 – Total housing costs in purchasing power standards (PPS), 2012–2025
Download this infographic for your presentations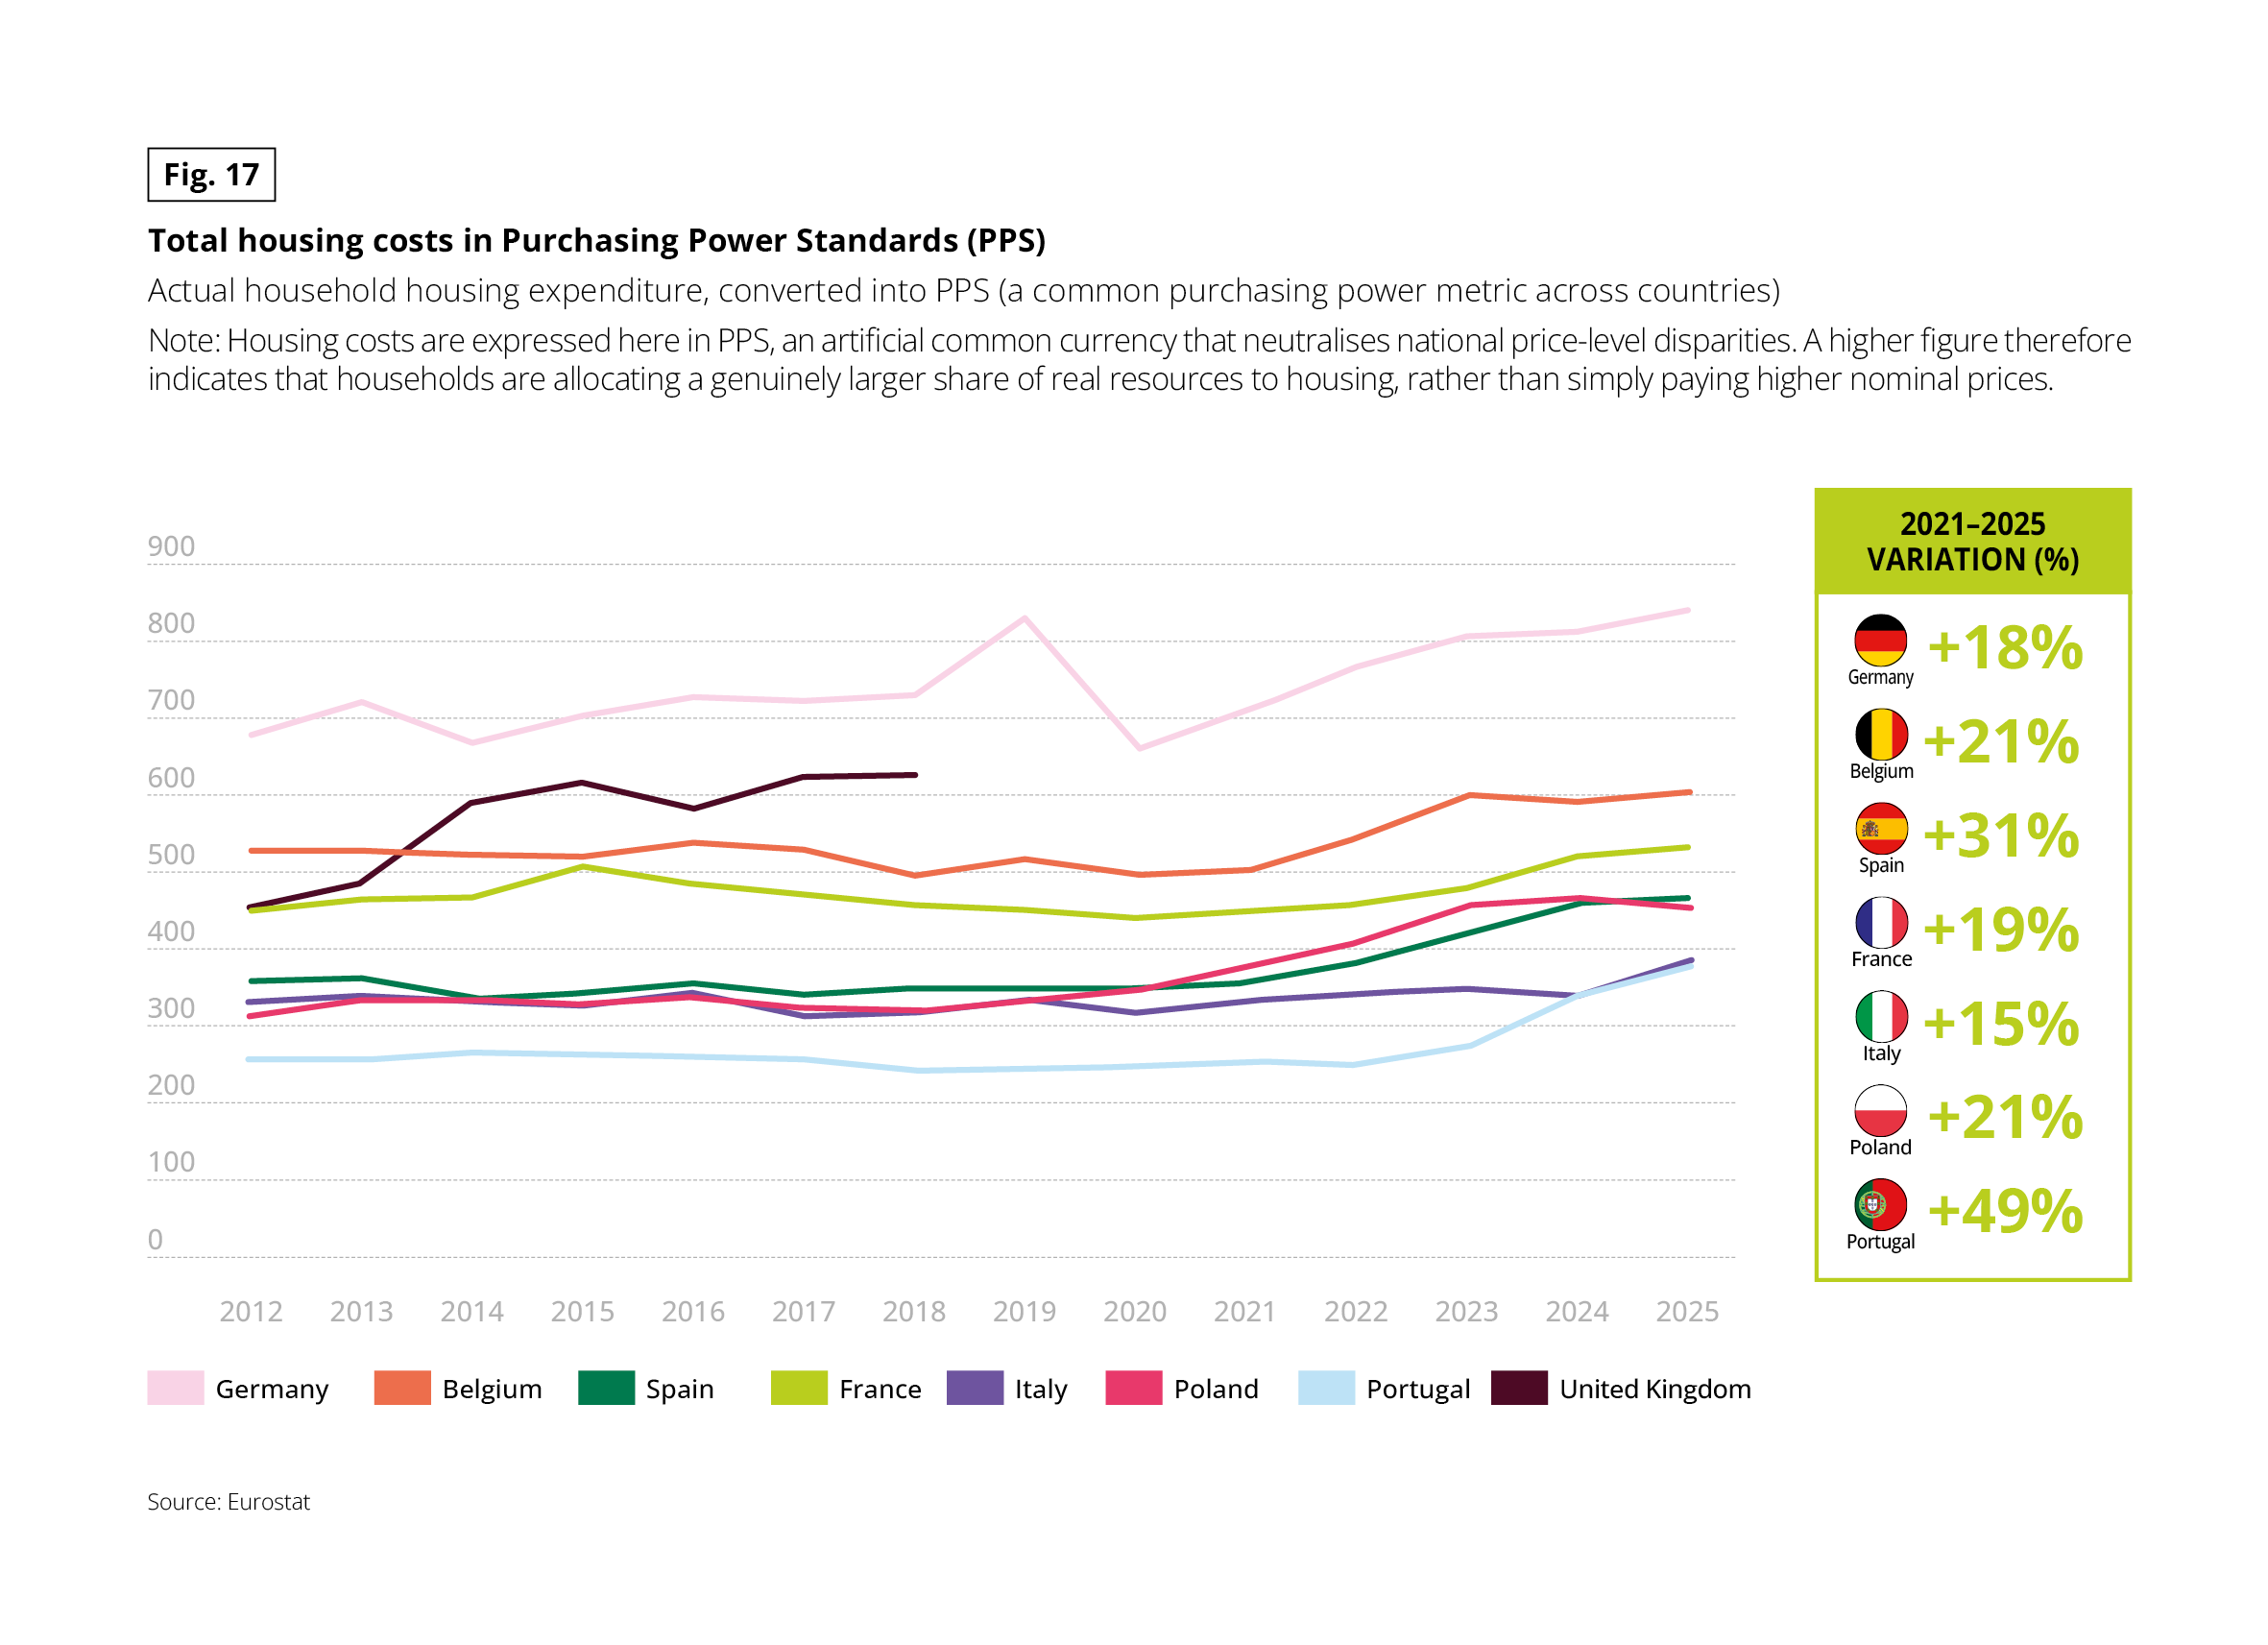 Line chart with eight series: Germany, Belgium, Spain, France, Italy, Poland, Portugal and United Kingdom. Measure: actual household housing expenditure converted into purchasing power standards (PPS), a common artificial currency that removes differences in national price levels. A higher figure therefore indicates that households allocate a genuinely larger share of real resources to housing. The unit per household or per inhabitant is not stated. The United Kingdom series stops in 2018. A box gives the 2021–2025 variation. Source: Eurostat.
2021–2025 variation: Portugal +49%, Spain +31%, Belgium +21%, Poland +21%, France +19%, Germany +18%, Italy +15%.
Approximate values read from the chart, in the form 2012 / 2021 / 2025:
• Germany: 680 / 715 / 840 (peak of about 830 in 2019, then a dip in 2020)
• Belgium: 530 / 500 / 605
• France: 450 / 445 / 530
• Spain: 360 / 355 / 465
• Poland: 310 / 375 / 455
• Italy: 330 / 335 / 385
• Portugal: 255 / 255 / 375
• United Kingdom: 455 in 2012, about 625 in 2018 (last data point)
Germany is the highest. Portugal and Italy are the lowest, but Portugal’s increase since 2021 is the largest.
This strain on household budgets also explains why energy remains the primary source of frustration dragging down housing satisfaction. As shown by the survey question “How satisfied are you with each of the following aspects?”, energy-related dimensions—energy efficiency, billing and heating equipment—rank at the very bottom, with satisfaction rates between 70% and 75%, compared with nearly 90% for living environment.
The gap is especially stark in countries where energy efficiency carries significant weight in housing decisions, such as Portugal and Italy. On an encouraging note, this is also where satisfaction is improving most rapidly: satisfaction with energy bills has gained 5 percentage points in two years as prices have receded.
TENANTS AND RURAL HOUSEHOLDS MOST EXPOSED TO BUDGETARY STRAIN
Energy costs therefore continue to exert pressure on monthly housing budgets. A third of Europeans report facing financial difficulties regarding their housing, with 6% describing their situation as very difficult.
This distribution has remained static since 2024, suggesting that the recent deceleration in price growth has yet to ease the perceived burden.
Two groups are especially vulnerable:
- Tenants, nearly half of whom struggle to settle their bills;
- Rural households, who face lower incomes, higher reliance on cars and often energy-inefficient housing.
Crucially, a fault line is opening across Europe. Beneath the overall divergence, two opposing trajectories are emerging, tightly tied to reliance on natural gas: Portugal, whose energy mix has largely moved away from gas, is holding firm; the United Kingdom, which remains heavily reliant on it, has fallen back by 11 percentage points in a single year. This decisive role played by national energy mixes will result in contrasting dynamics when it comes to energy efficiency retrofits (Part 3).
The key shifts are taking place in the middle of the ranking: in Spain and Poland, around 7 in 10 people now say they manage comfortably within their monthly budget. This progress is driven by robust economic growth, which has delivered a marked gain in purchasing power, whereas more stagnant economies have seen theirs plateau or even shrink. It is this uneven economic dynamism, rather than inflation alone, that is widening the gap between nations: where disposable income outpaces non-discretionary spending, households recover vital financial breathing room.
It is this very buffer that will later enable them to turn their plans into reality.
Fig. 18 – Ease of covering housing expenses in a typical month
Download this infographic for your presentations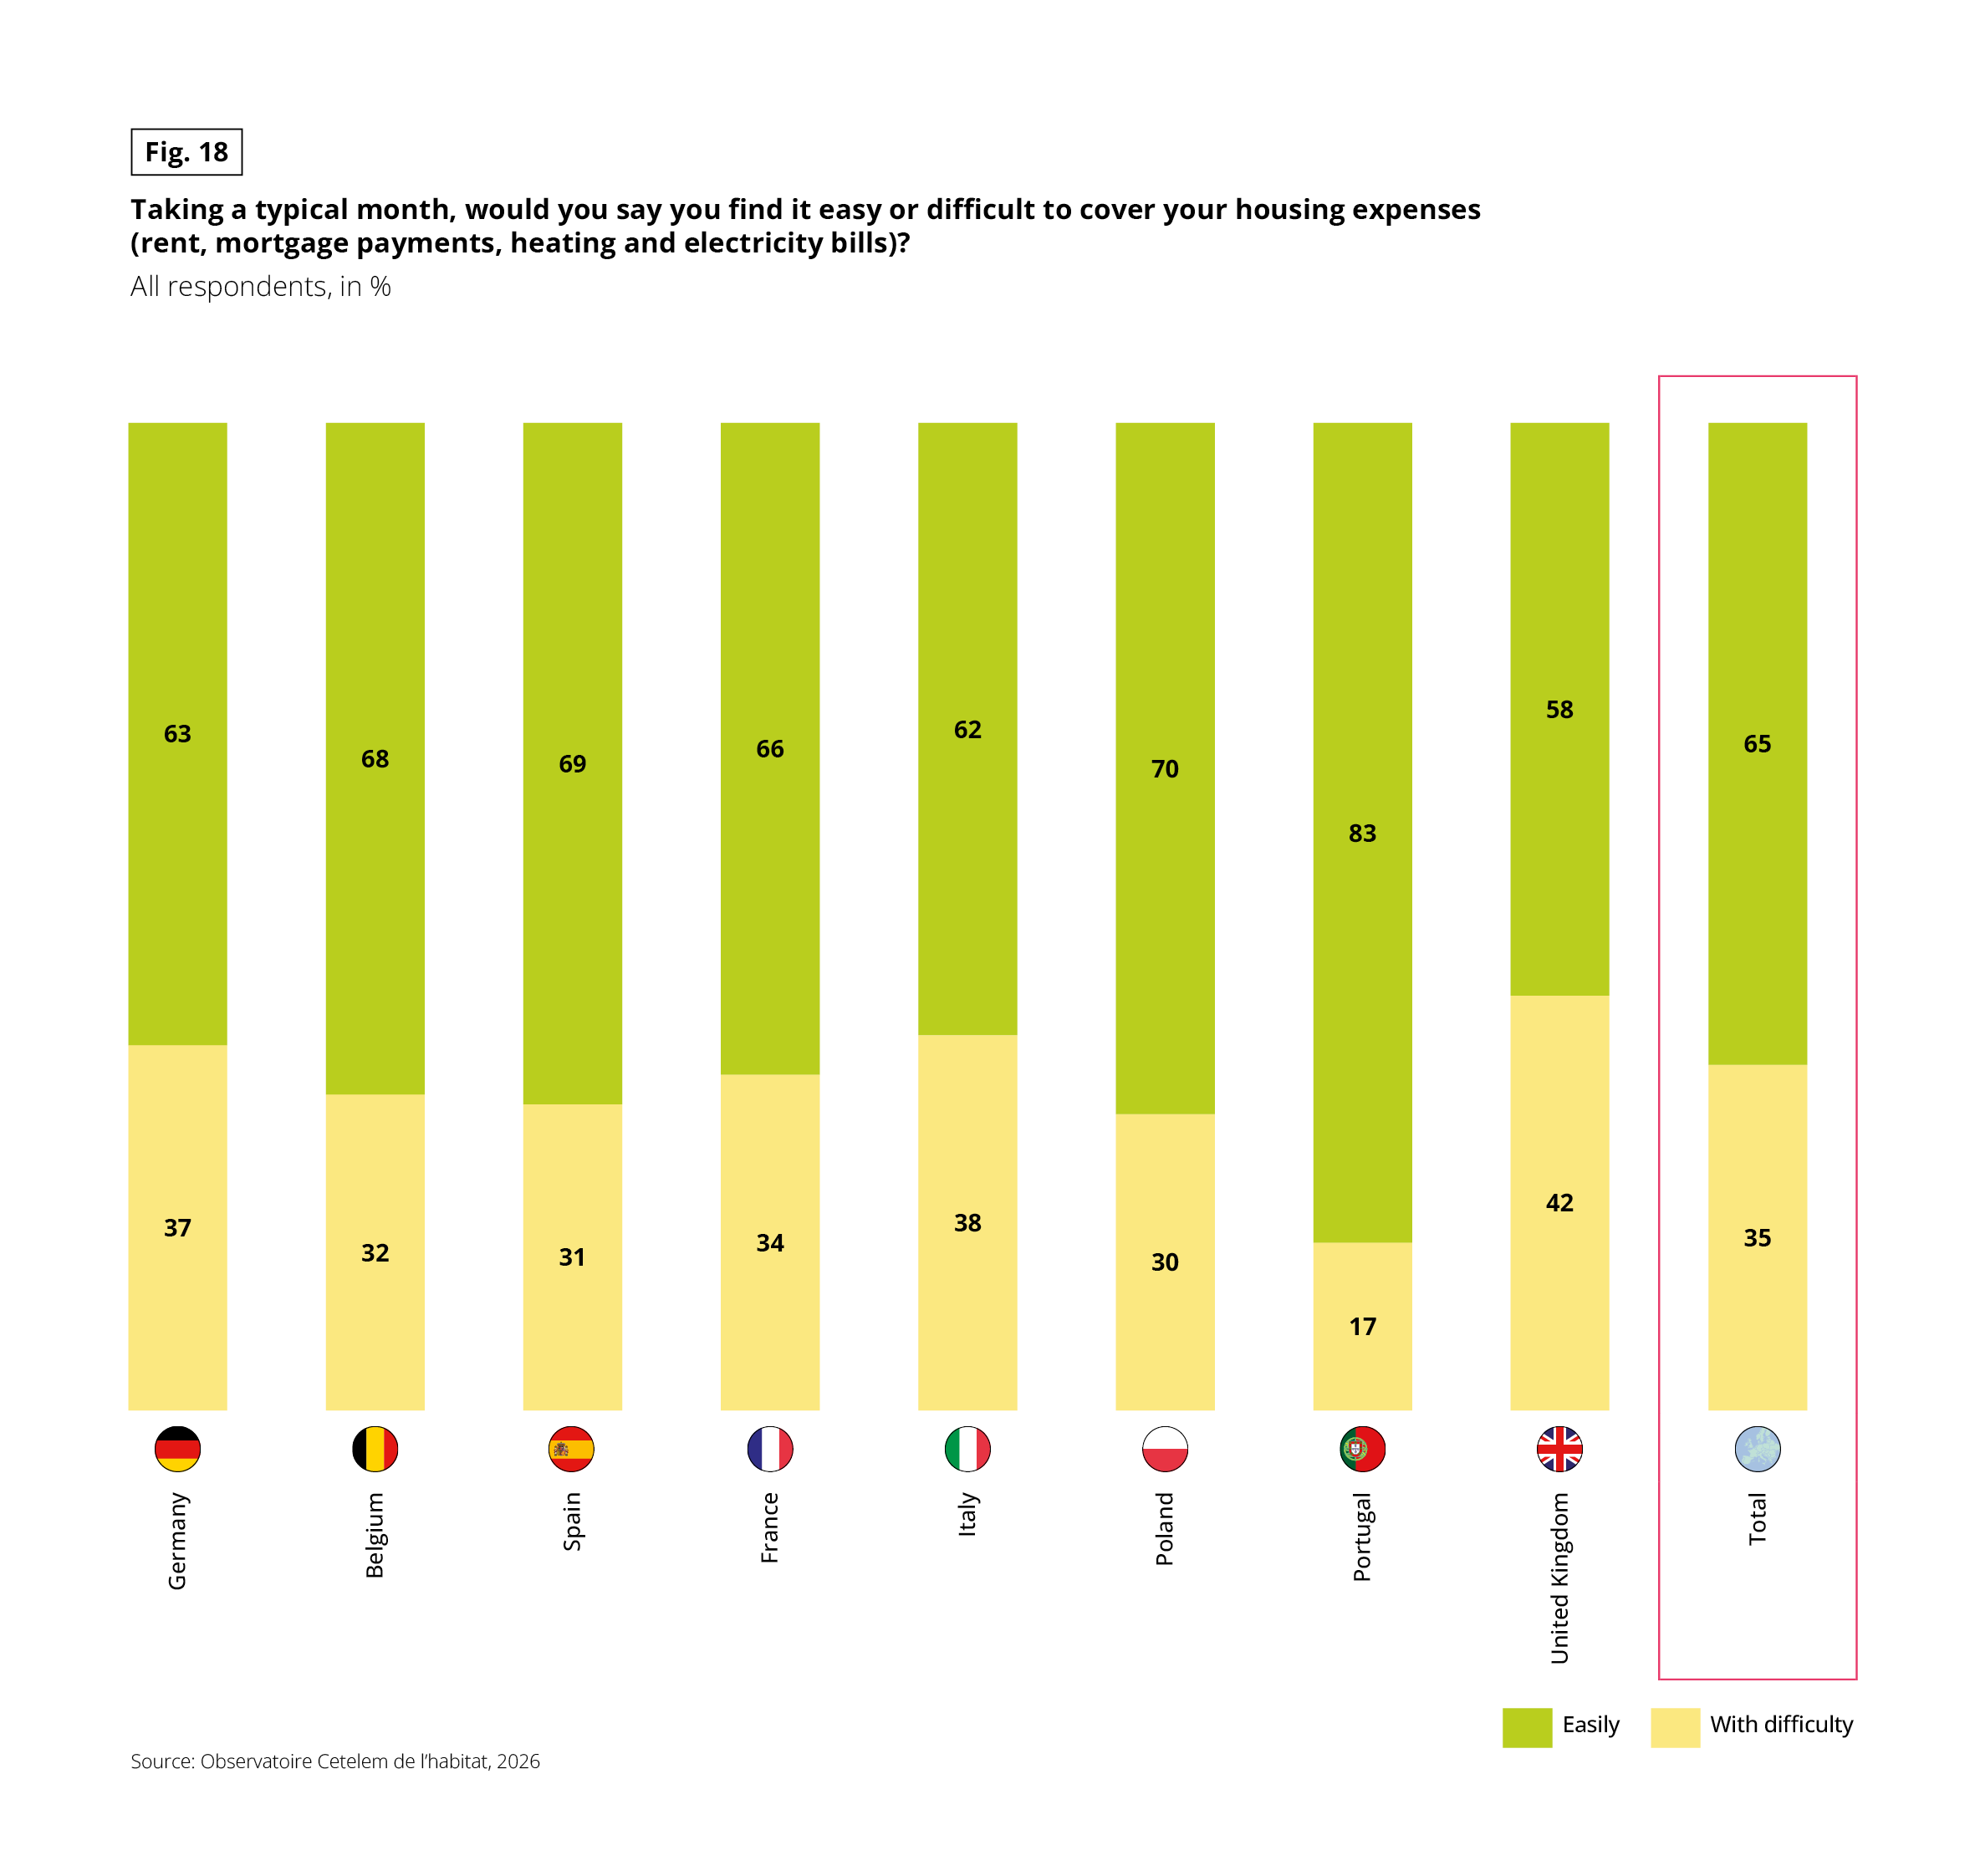 Stacked vertical bar chart. Question: “Taking a typical month, would you say you find it easy or difficult to cover your housing expenses (rent, mortgage payments, heating and electricity bills)?” Base: all respondents, in %. Two answers: “Easily” and “With difficulty”. Source: Observatoire Cetelem de l’habitat, 2026.
Data in the form easily / with difficulty:
• Germany: 63 / 37
• Belgium: 68 / 32
• Spain: 69 / 31
• France: 66 / 34
• Italy: 62 / 38
• Poland: 70 / 30
• Portugal: 83 / 17
• United Kingdom: 58 / 42
• Total: 65 / 35
Portugal stands out, with 83% finding it easy. The United Kingdom (42%) and Italy (38%) have the highest shares of respondents with difficulty.
Fig. 19 – Household purchasing power, 2012–2025 (2008 = 100)
Download this infographic for your presentations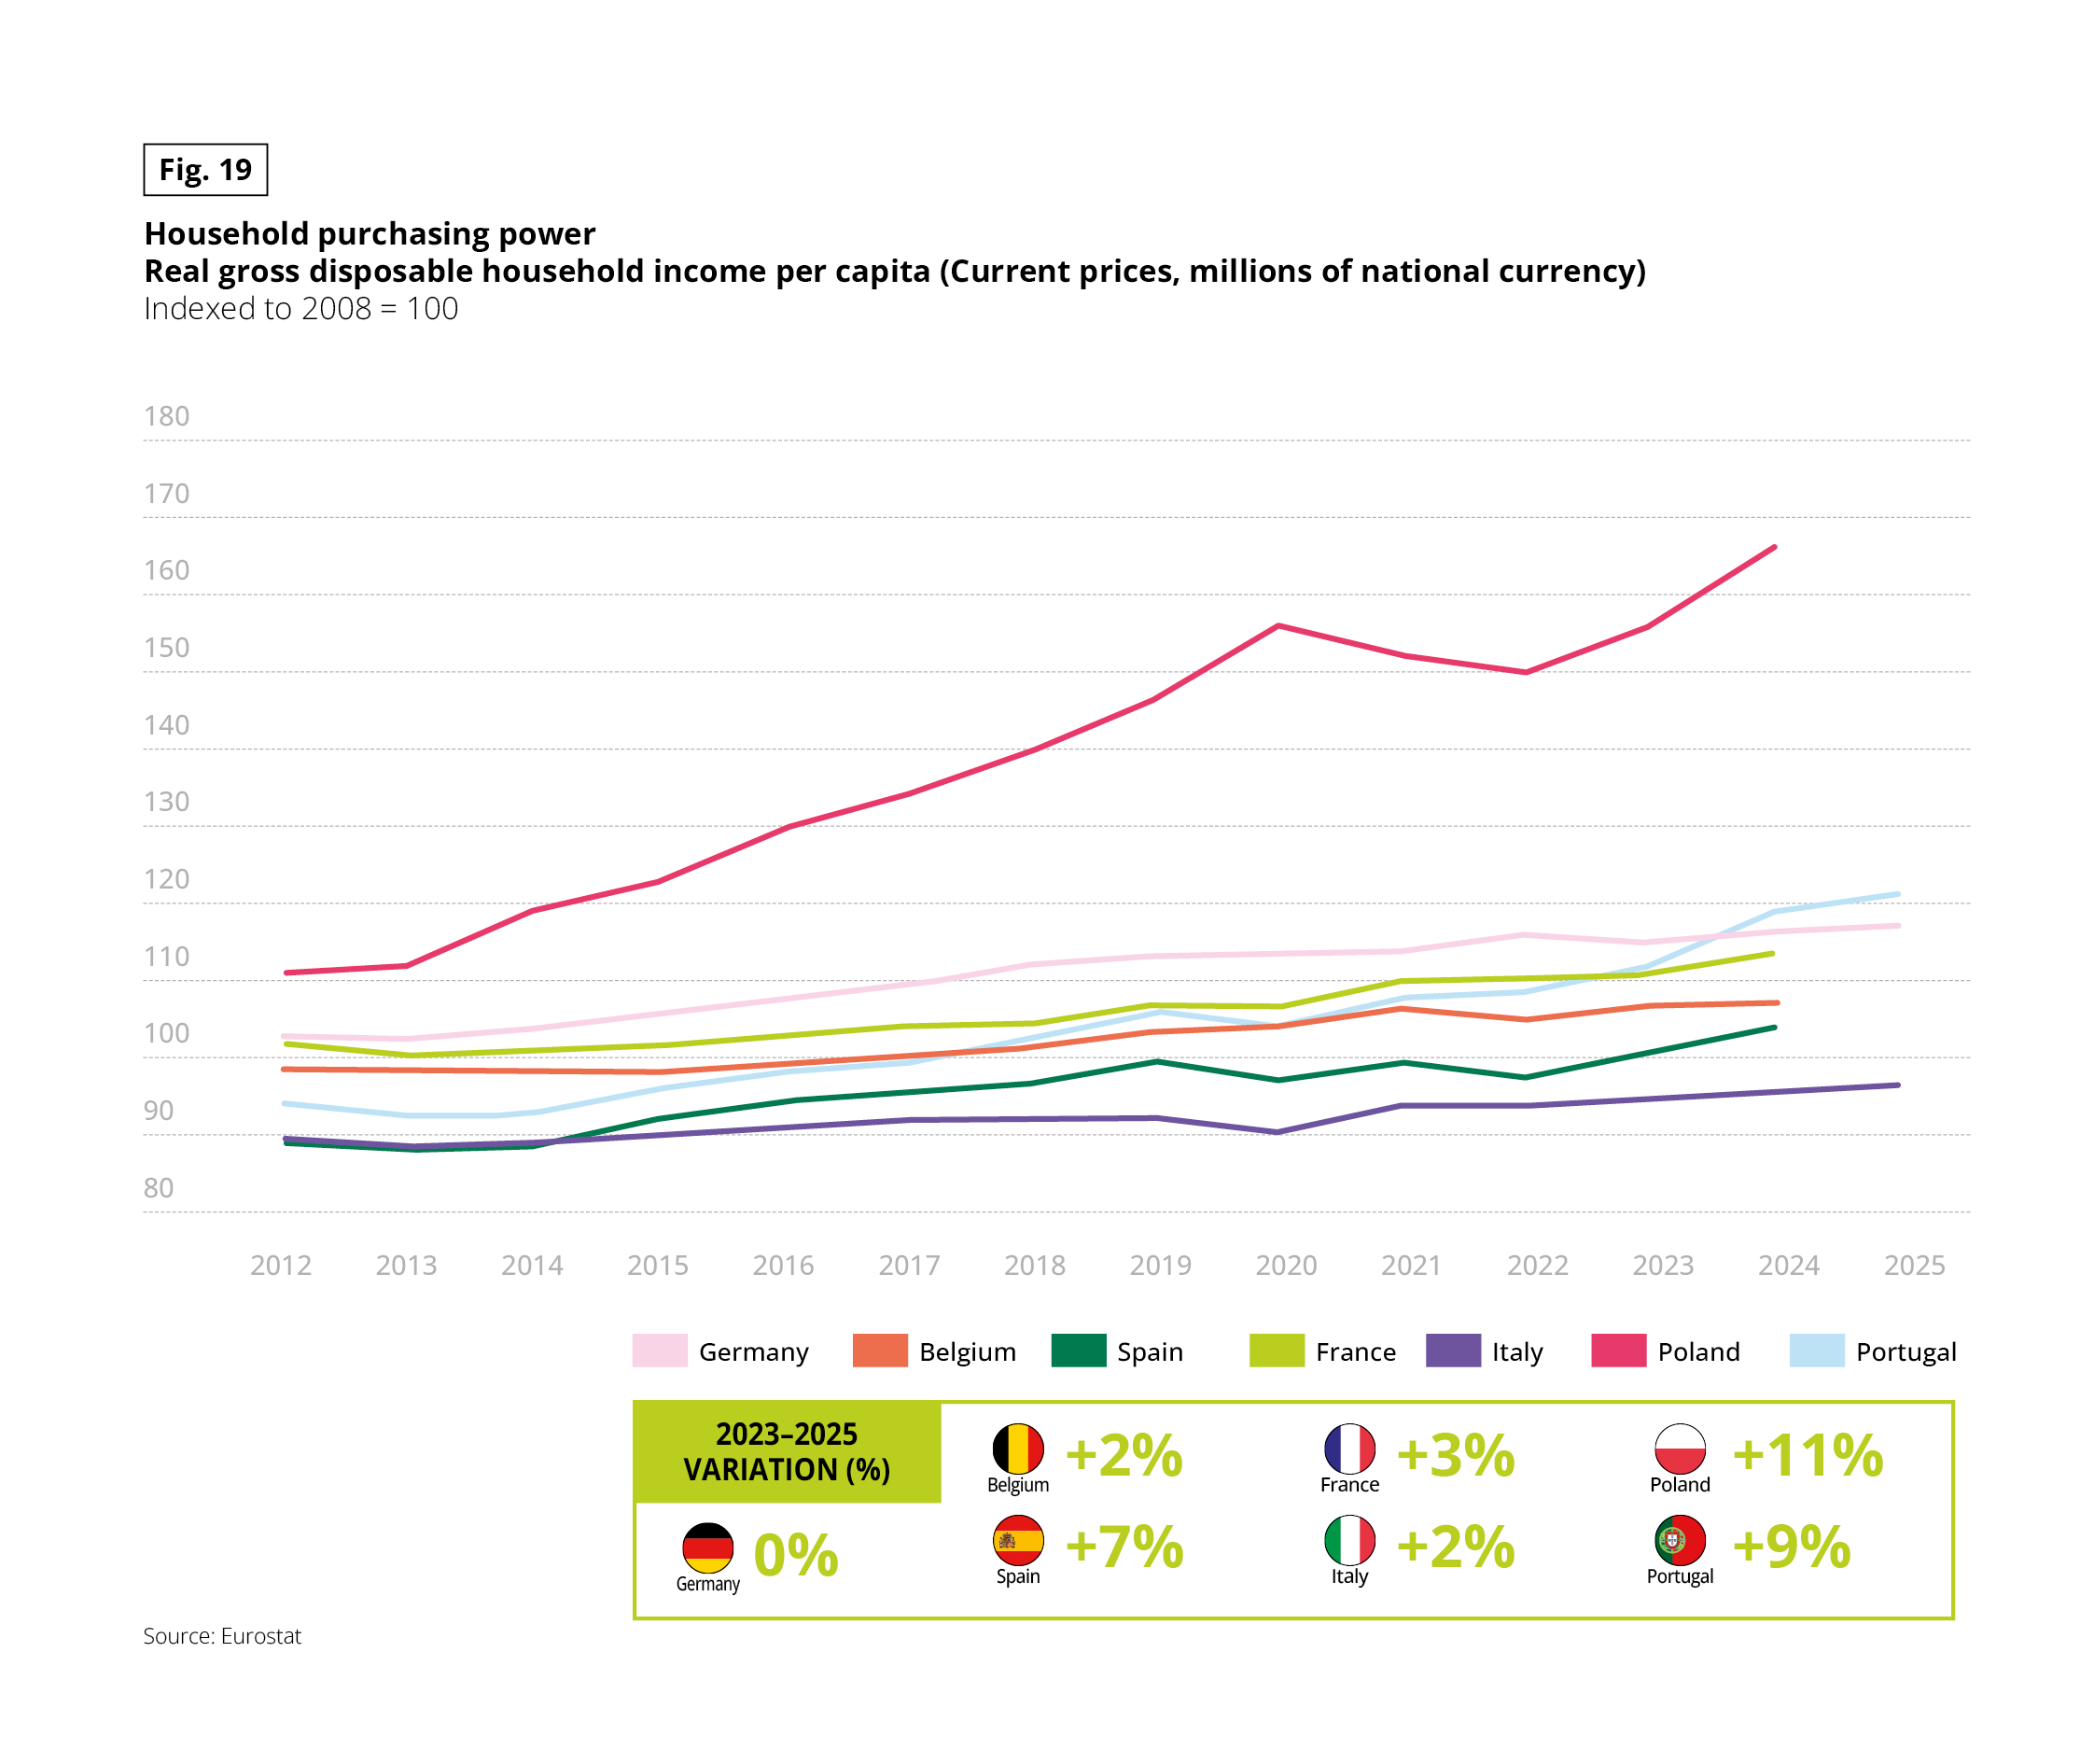 Line chart with seven series: Germany, Belgium, Spain, France, Italy, Poland and Portugal. Measure: real gross disposable household income per capita (current prices, millions of national currency), indexed to 2008 = 100. Years 2012 to 2025. Poland, Spain, France and Belgium stop in 2024. A box gives the 2023–2025 variation. Source: Eurostat.
2023–2025 variation: Poland +11%, Portugal +9%, Spain +7%, France +3%, Belgium +2%, Italy +2%, Germany 0%.
Approximate values read from the chart, in the form 2012 / latest year:
• Poland: 111 / 166 (2024)
• Portugal: 94 / 121 (2025)
• Germany: 103 / 117 (2025)
• France: 102 / 113 (2024)
• Belgium: 99 / 107 (2024)
• Spain: 89 / 104 (2024)
• Italy: 89 / 96 (2025)
Poland grows by far the most and is the only country above 130. Portugal overtakes Germany around 2024. Italy stays below 100 throughout.
Financial strain may be the primary pressure point surrounding housing, but it is not the only one: a home must also fulfil its primary role as a safe haven.