
Housing energy transition is underway, but the appetite for renovation is fading


 8 min
reading time
Following the 2022 energy crisis, Europe has regained a degree of stability: emissions are falling, energy bills are easing, and fuel poverty is declining. However, concerns over purchasing power and energy costs persist. At the same time, the momentum behind renovation is slowing down, even though older housing stock still requires widespread transformation.
This transformation hits a particular bottleneck in co-owned properties, where decision-making and financing are shared. From energy use and collective renovation through to financing, the same pattern emerges: while households support the principle, they are waiting for proof that the investment will be cost-effective and affordable. Two variables remain key: finances and the size of the building.
A RESIDENTIAL HOUSING STOCK THAT IS DECARBONISING
It’s worth starting with some good news, which remains rare in the context of climate matters: residential greenhouse gas (GHG) emissions per capita are falling across all countries surveyed. France has recorded the most dramatic reduction (down 47% since 2012, from 0.89 to 0.47 tCO₂eq per capita), driven by the decarbonisation of its energy mix and improvements in the energy efficiency of its building stock. Belgium (-32%) and Germany (-20%) are also making progress, but remain the highest emitters in the group. Residential housing, which accounts for around 16% of territorial emissions in France, therefore remains a major lever for decarbonisation and achieving climate targets.(1)
(1) Source: Citepa 2024.
Fig. 47 – Residential greenhouse gas emissions per capita, 2012 and 2023
Download this infographic for your presentations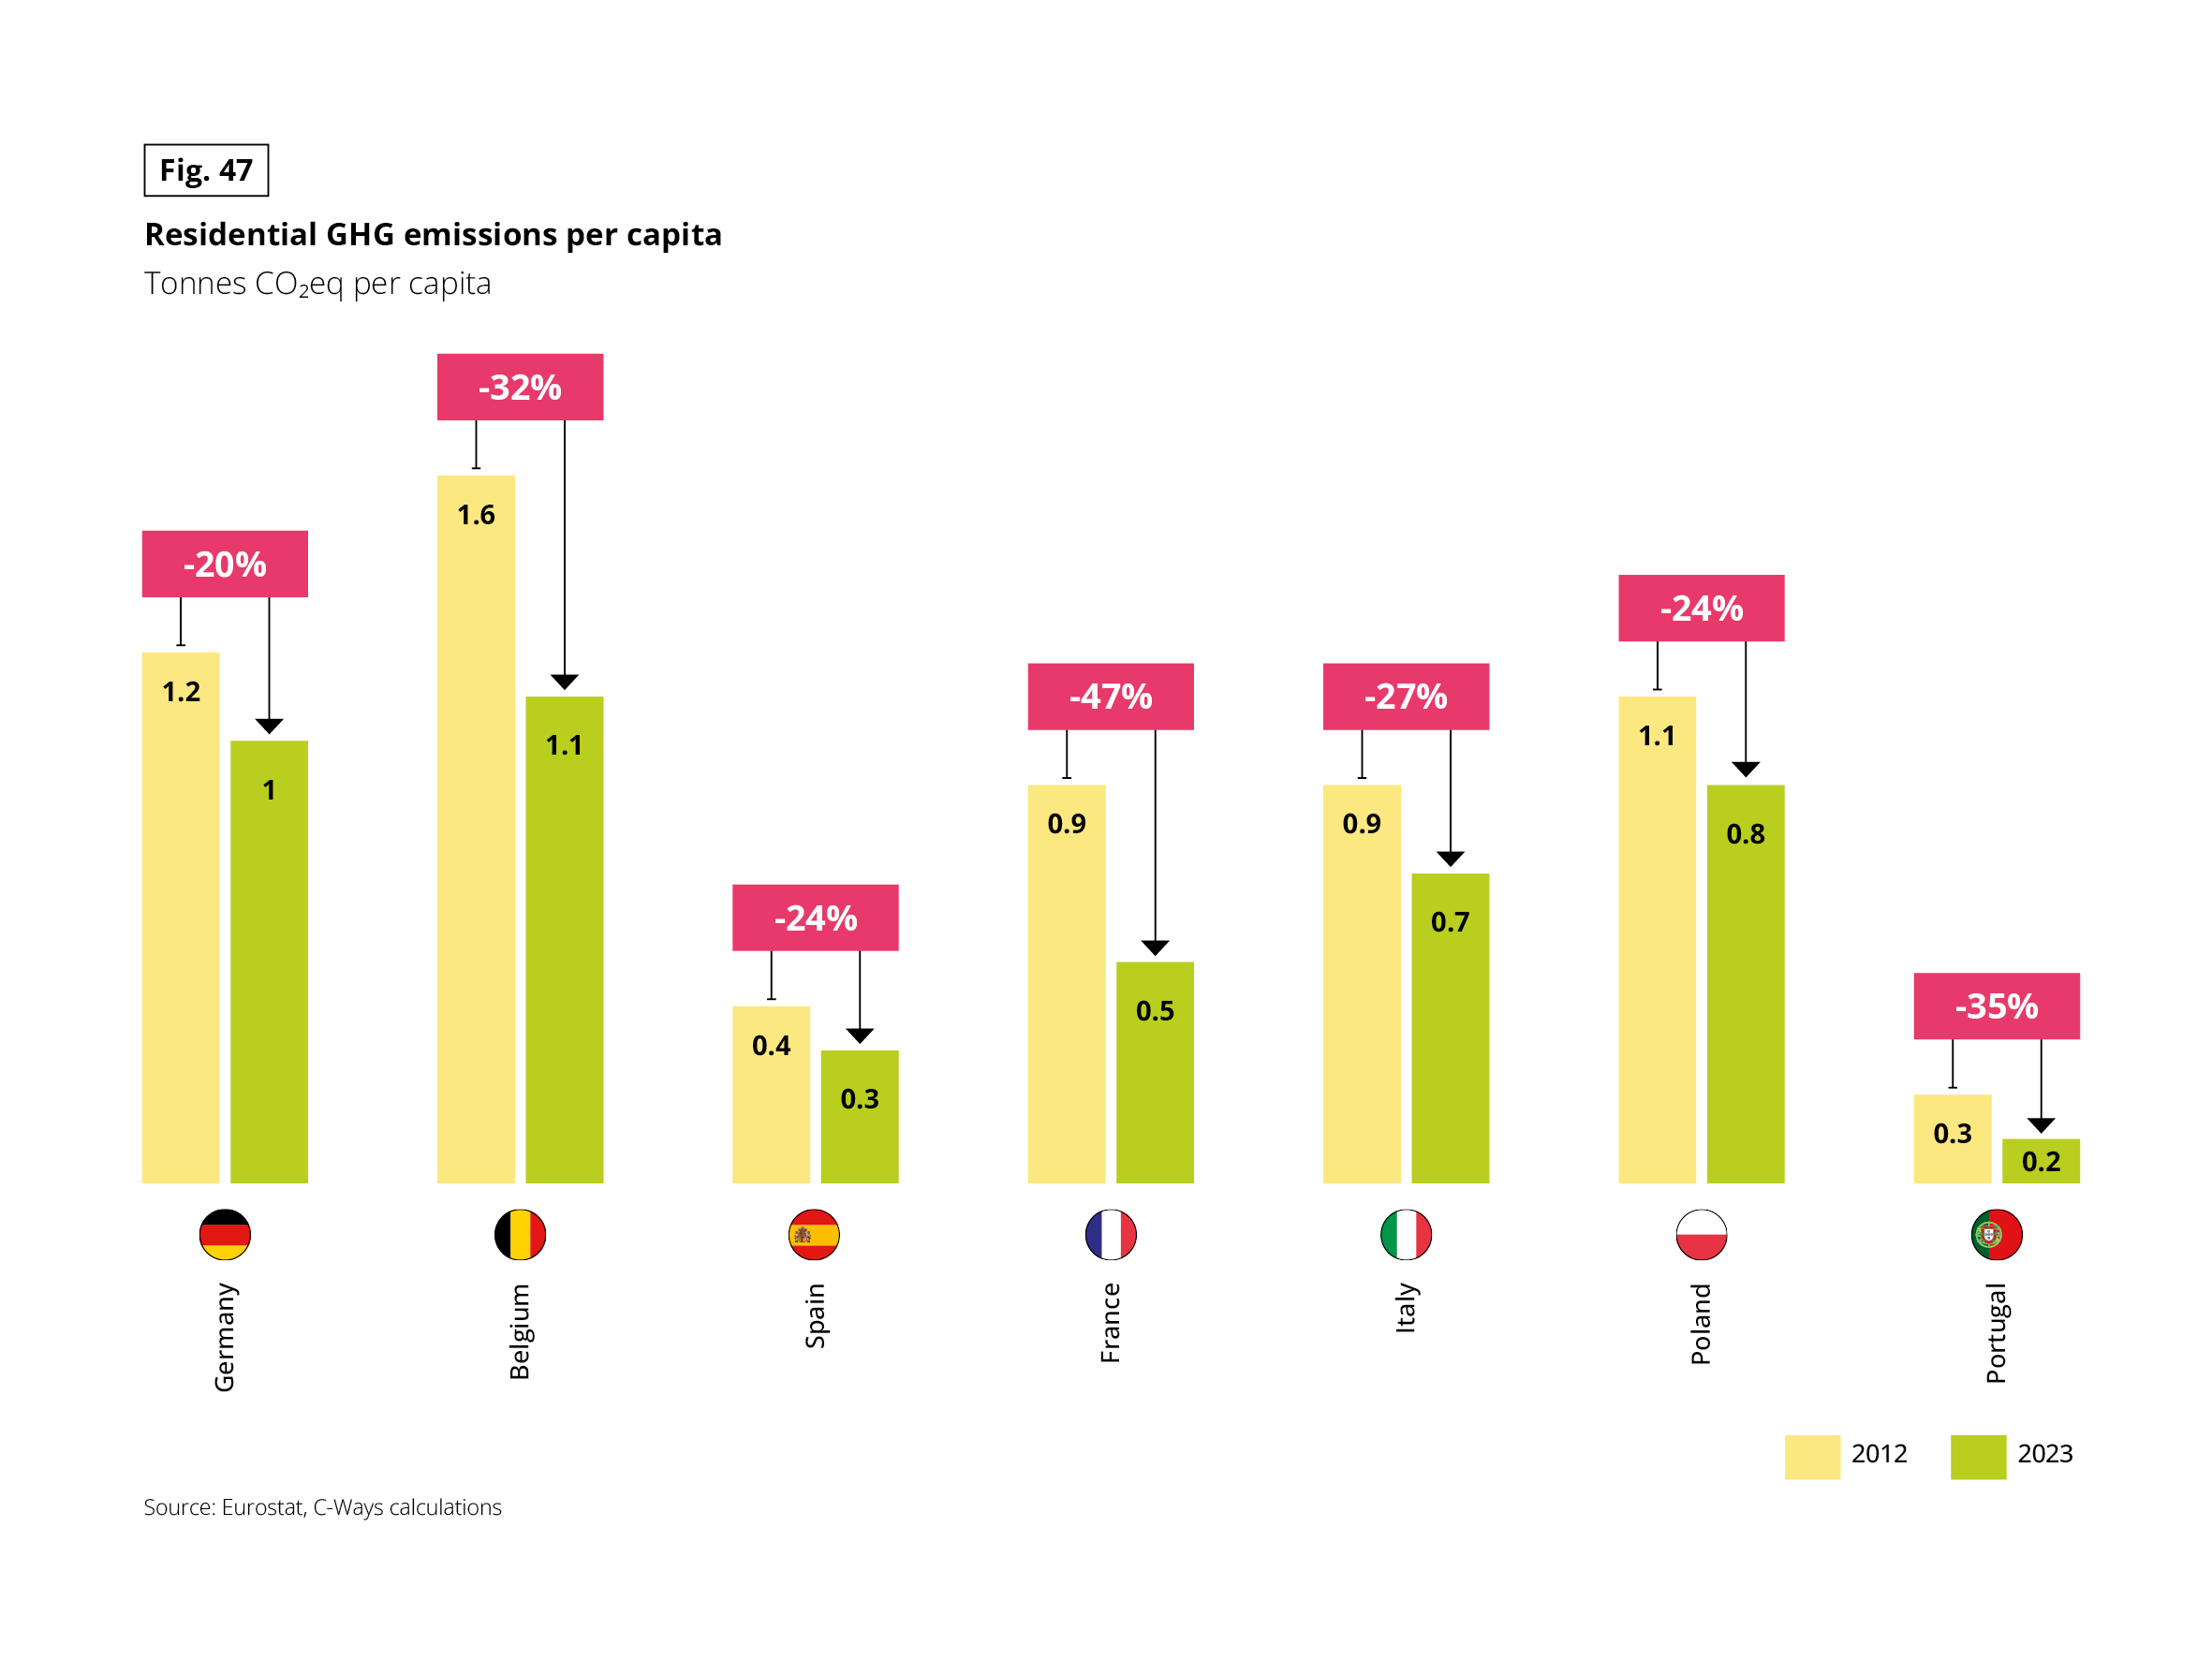 Grouped vertical bar chart. Unit: tonnes of CO₂ equivalent per capita. Two series, 2012 and 2023, with the percentage change above each pair. Source: Eurostat, C-Ways calculations.
Data in the form 2012 / 2023 (change):
• Germany: 1.2 / 1.0 (−20%)
• Belgium: 1.6 / 1.1 (−32%)
• Spain: 0.4 / 0.3 (−24%)
• France: 0.9 / 0.5 (−47%)
• Italy: 0.9 / 0.7 (−27%)
• Poland: 1.1 / 0.8 (−24%)
• Portugal: 0.3 / 0.2 (−35%)
Emissions fall in every country. France has the largest decline (−47%) and Germany the smallest (−20%). Belgium is the highest emitter in both years and Portugal the lowest.
This drop is driven by two main dynamics:
- Per capita residential energy consumption has fallen since 2012 in most countries: down 21% in France, 19% in Belgium and 13% in Germany and Italy. This decline stems from converging factors: gains in energy efficiency, higher performance in recent building developments and public renovation subsidies (such as Italy’s Superbonus scheme at 1.4% of GDP and MaPrimeRénov’ in France). However, it is also driven by the rise in energy prices since the 2022 energy crisis, which has forced households to curb their consumption.
Fig. 48 – Residential energy consumption per capita, 2012 and 2023
Download this infographic for your presentations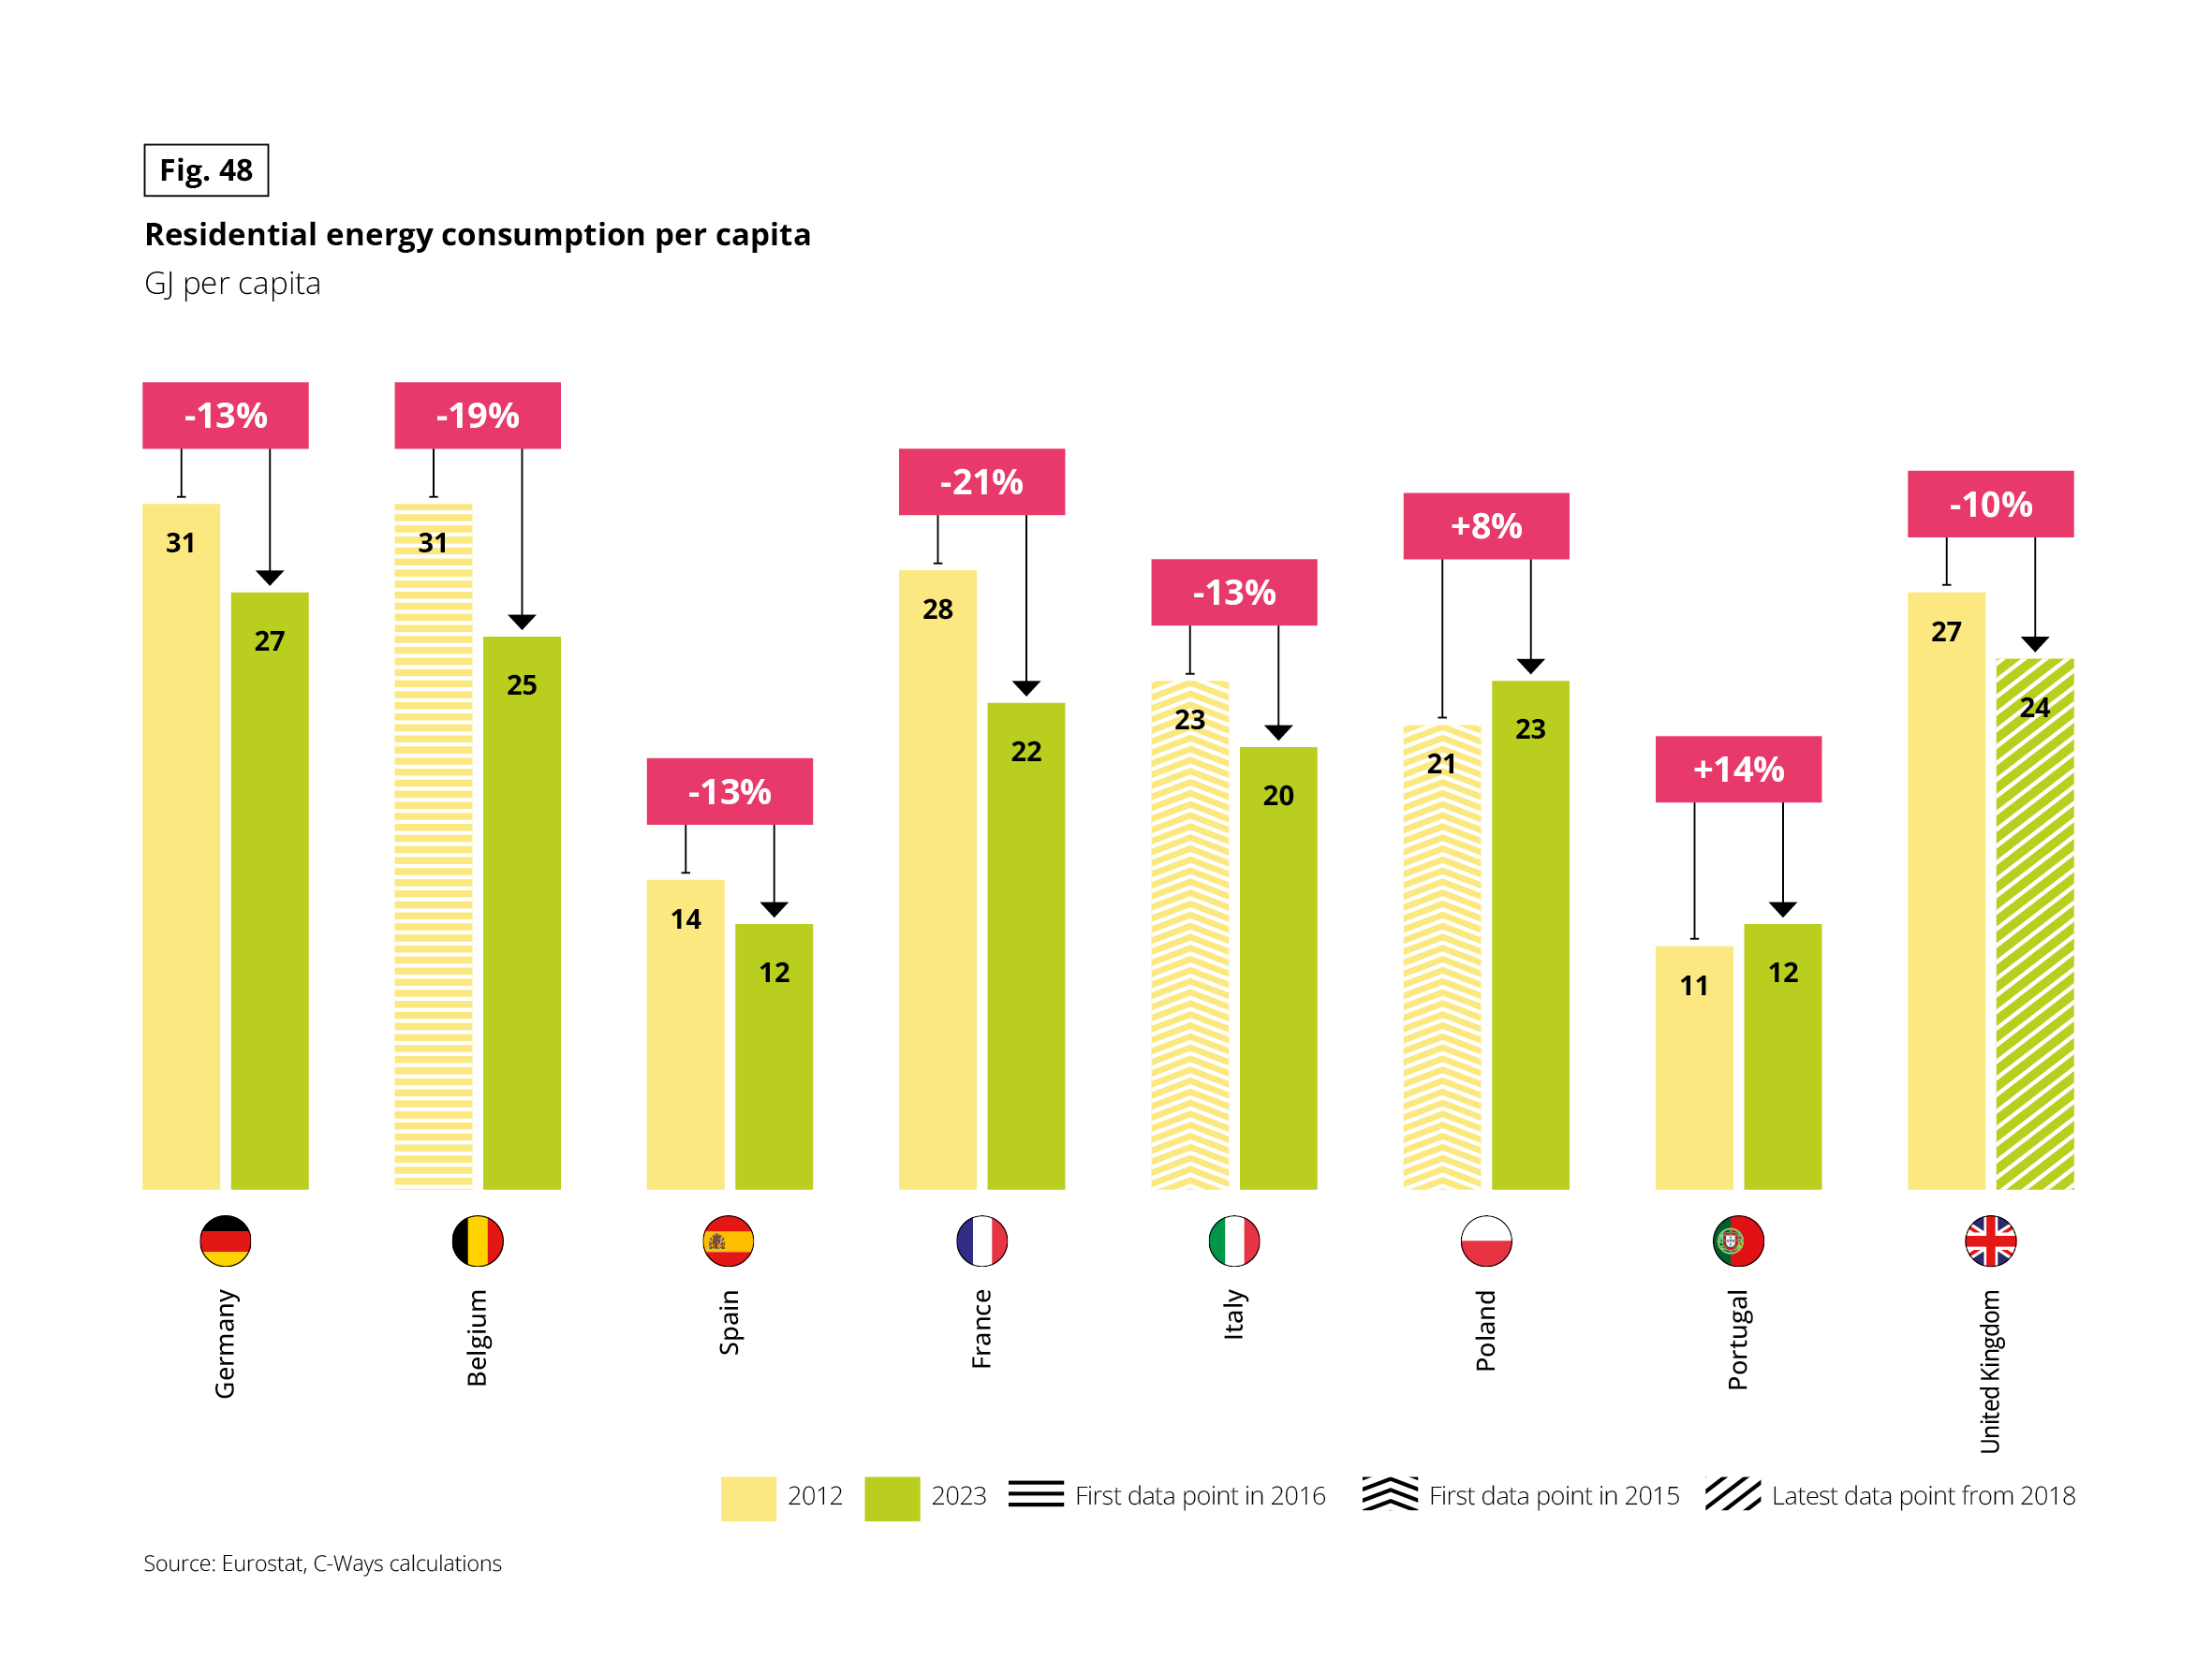 Grouped vertical bar chart. Unit: GJ per capita. Two series, 2012 and 2023, with the percentage change above each pair. Hatching marks incomplete data: for Belgium the first data point is from 2016, for Italy and Poland from 2015, and for the United Kingdom the latest data point is from 2018. Source: Eurostat, C-Ways calculations.
Data in the form 2012 / 2023 (change):
• Germany: 31 / 27 (−13%)
• Belgium: 31 (first data point 2016) / 25 (−19%)
• Spain: 14 / 12 (−13%)
• France: 28 / 22 (−21%)
• Italy: 23 (first data point 2015) / 20 (−13%)
• Poland: 21 (first data point 2015) / 23 (+8%)
• Portugal: 11 / 12 (+14%)
• United Kingdom: 27 / 24 (latest data point 2018) (−10%)
Germany and Belgium are the highest consumers in 2023 (27 and 25 GJ) and Spain and Portugal the lowest (12 each). Poland and Portugal are the only countries where consumption rises.
- The residential energy mix is becoming greener. The share of fossil fuels, namely gas and oil, is falling almost everywhere, with France and Portugal leading the way, both recording a drop of 10 to 15 percentage points since 2012. At the same time, renewables are making strong progress: Poland has nearly doubled its share, while France and Portugal have gained close to 10 percentage points. Electricity is also gaining ground, particularly in France and Spain. Finally, in Poland, the “other” category, dominated by coal and district heating, has fallen sharply, falling from over half of the residential mix in 2012 to just over a third in 2024.
Fig. 49 – Residential energy mix by country, 2012 and 2024
Download this infographic for your presentations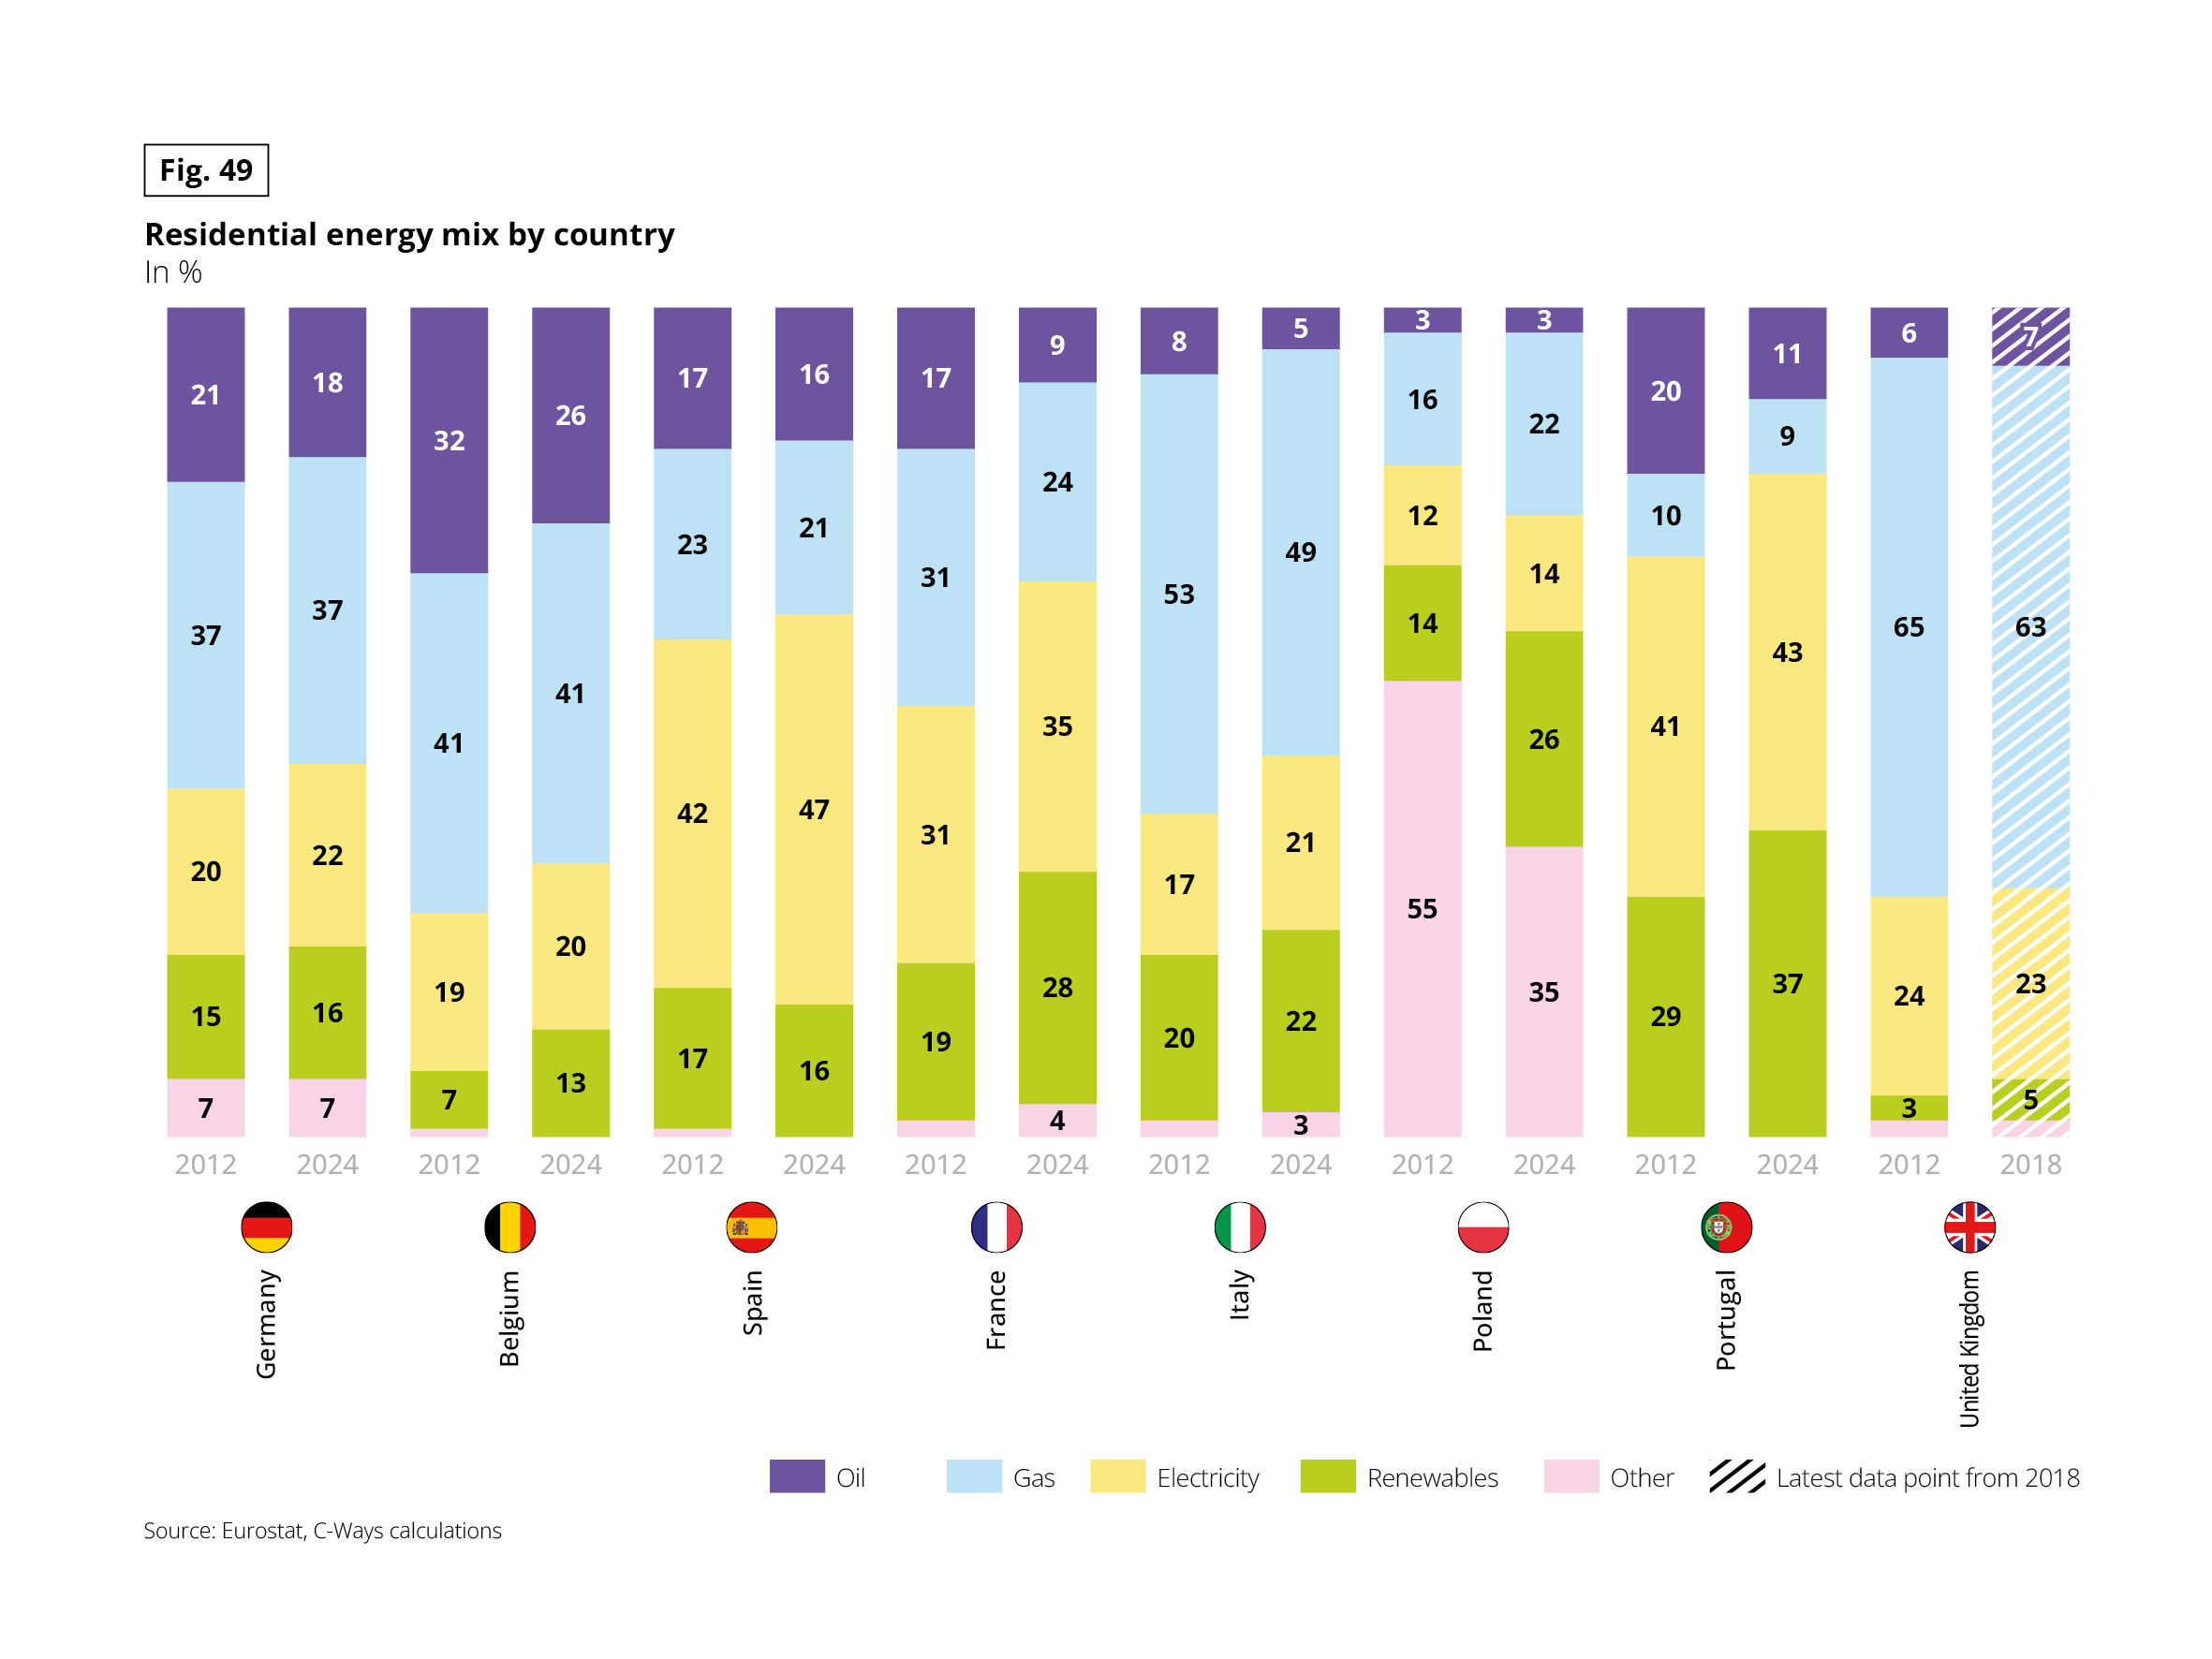 Stacked vertical bar chart. Unit: %. Each country has two columns, 2012 and 2024, split into oil, gas, electricity, renewables and other. For the United Kingdom, the second column is from 2018 (hatched). Segments without a label are below 3%. Source: Eurostat, C-Ways calculations.
Data in the form oil / gas / electricity / renewables / other:
• Germany 2012: 21 / 37 / 20 / 15 / 7. Germany 2024: 18 / 37 / 22 / 16 / 7.
• Belgium 2012: 32 / 41 / 19 / 7 / under 3. Belgium 2024: 26 / 41 / 20 / 13 / under 3.
• Spain 2012: 17 / 23 / 42 / 17 / under 3. Spain 2024: 16 / 21 / 47 / 16 / under 3.
• France 2012: 17 / 31 / 31 / 19 / under 3. France 2024: 9 / 24 / 35 / 28 / 4.
• Italy 2012: 8 / 53 / 17 / 20 / under 3. Italy 2024: 5 / 49 / 21 / 22 / 3.
• Poland 2012: 3 / 16 / 12 / 14 / 55. Poland 2024: 3 / 22 / 14 / 26 / 35.
• Portugal 2012: 20 / 10 / 41 / 29 / under 3. Portugal 2024: 11 / 9 / 43 / 37 / under 3.
• United Kingdom 2012: 6 / 65 / 24 / 3 / under 3. United Kingdom 2018: 7 / 63 / 23 / 5 / under 3.
Oil declines in most countries, notably in France (17% to 9%) and Portugal (20% to 11%). Renewables rise everywhere except Spain, where they are stable at 16–17%, and Poland and France show the largest increases. Gas remains the main fuel in Italy (49%), the United Kingdom (63%), Belgium (41%) and Germany (37%). Poland’s “other” category falls from 55% to 35%.
The blind spot remains: older housing stock. Homes built before 1970 consume up to three times more energy than recent builds,(1) and this energy-inefficient housing stock weighs heavily, accounting for anywhere between one third and nearly two thirds of total housing depending on the country. As a reminder, Germany (52%) and especially Belgium (63%) are the most heavily affected, with the highest share of older homes needing renovation.(2) Retrofitting older housing is therefore a critical challenge.
(1) Source: Gevorgian A. et al., European Building Stock Analysis, Eurac Research / TU Wien, 2021. (2) Source: EU Building Stock Observatory / Eurostat Census.
THE ENERGY BILL EASES ITS GRIP
In 2025, energy remains structurally expensive.(1) Across the board, electricity and gas prices are sitting well above pre-crisis levels. France shows the sharpest increases in the panel over the past decade: up 91% for electricity and 104% for gas since 2012. Since the peak in 2022, several countries have admittedly seen their bills fall, in some cases significantly. Gas prices have dropped by nearly half in Spain and a third in Belgium, while electricity has fallen by more than 40% in Poland. However, this downturn has not reached France or Germany, where prices have remained at record highs.
Yet these high prices have not prevented the pressure from easing. Fuel poverty, defined as the inability to keep a home adequately warm, fell almost everywhere between 2023 and 2025, following the peak of the crisis. The decline is marked in Spain and Portugal, which have both dropped by nearly 5 percentage points, and is also visible, though more subtle, in Germany and Belgium. While national figures still vary widely, the overall trend is clear: Europe has absorbed the 2022 gas crisis in the housing sector.
There is, however, one exception: France. Starting from a very low baseline, its fuel poverty rate more than doubled during the crisis and remains at around 11.5% in 2025, showing almost no sign of falling even as its neighbours improve. This respite must nevertheless be interpreted with caution. Collected before or at the very start of the new gas crisis sparked in early 2026 by Middle Eastern tensions, these data and survey responses do not yet reflect its impact, which could redraw the landscape this year.
(1) Source: Eurostat
Fig. 50 – Fuel poverty: inability to keep the home adequately warm, 2023 and 2025
Download this infographic for your presentations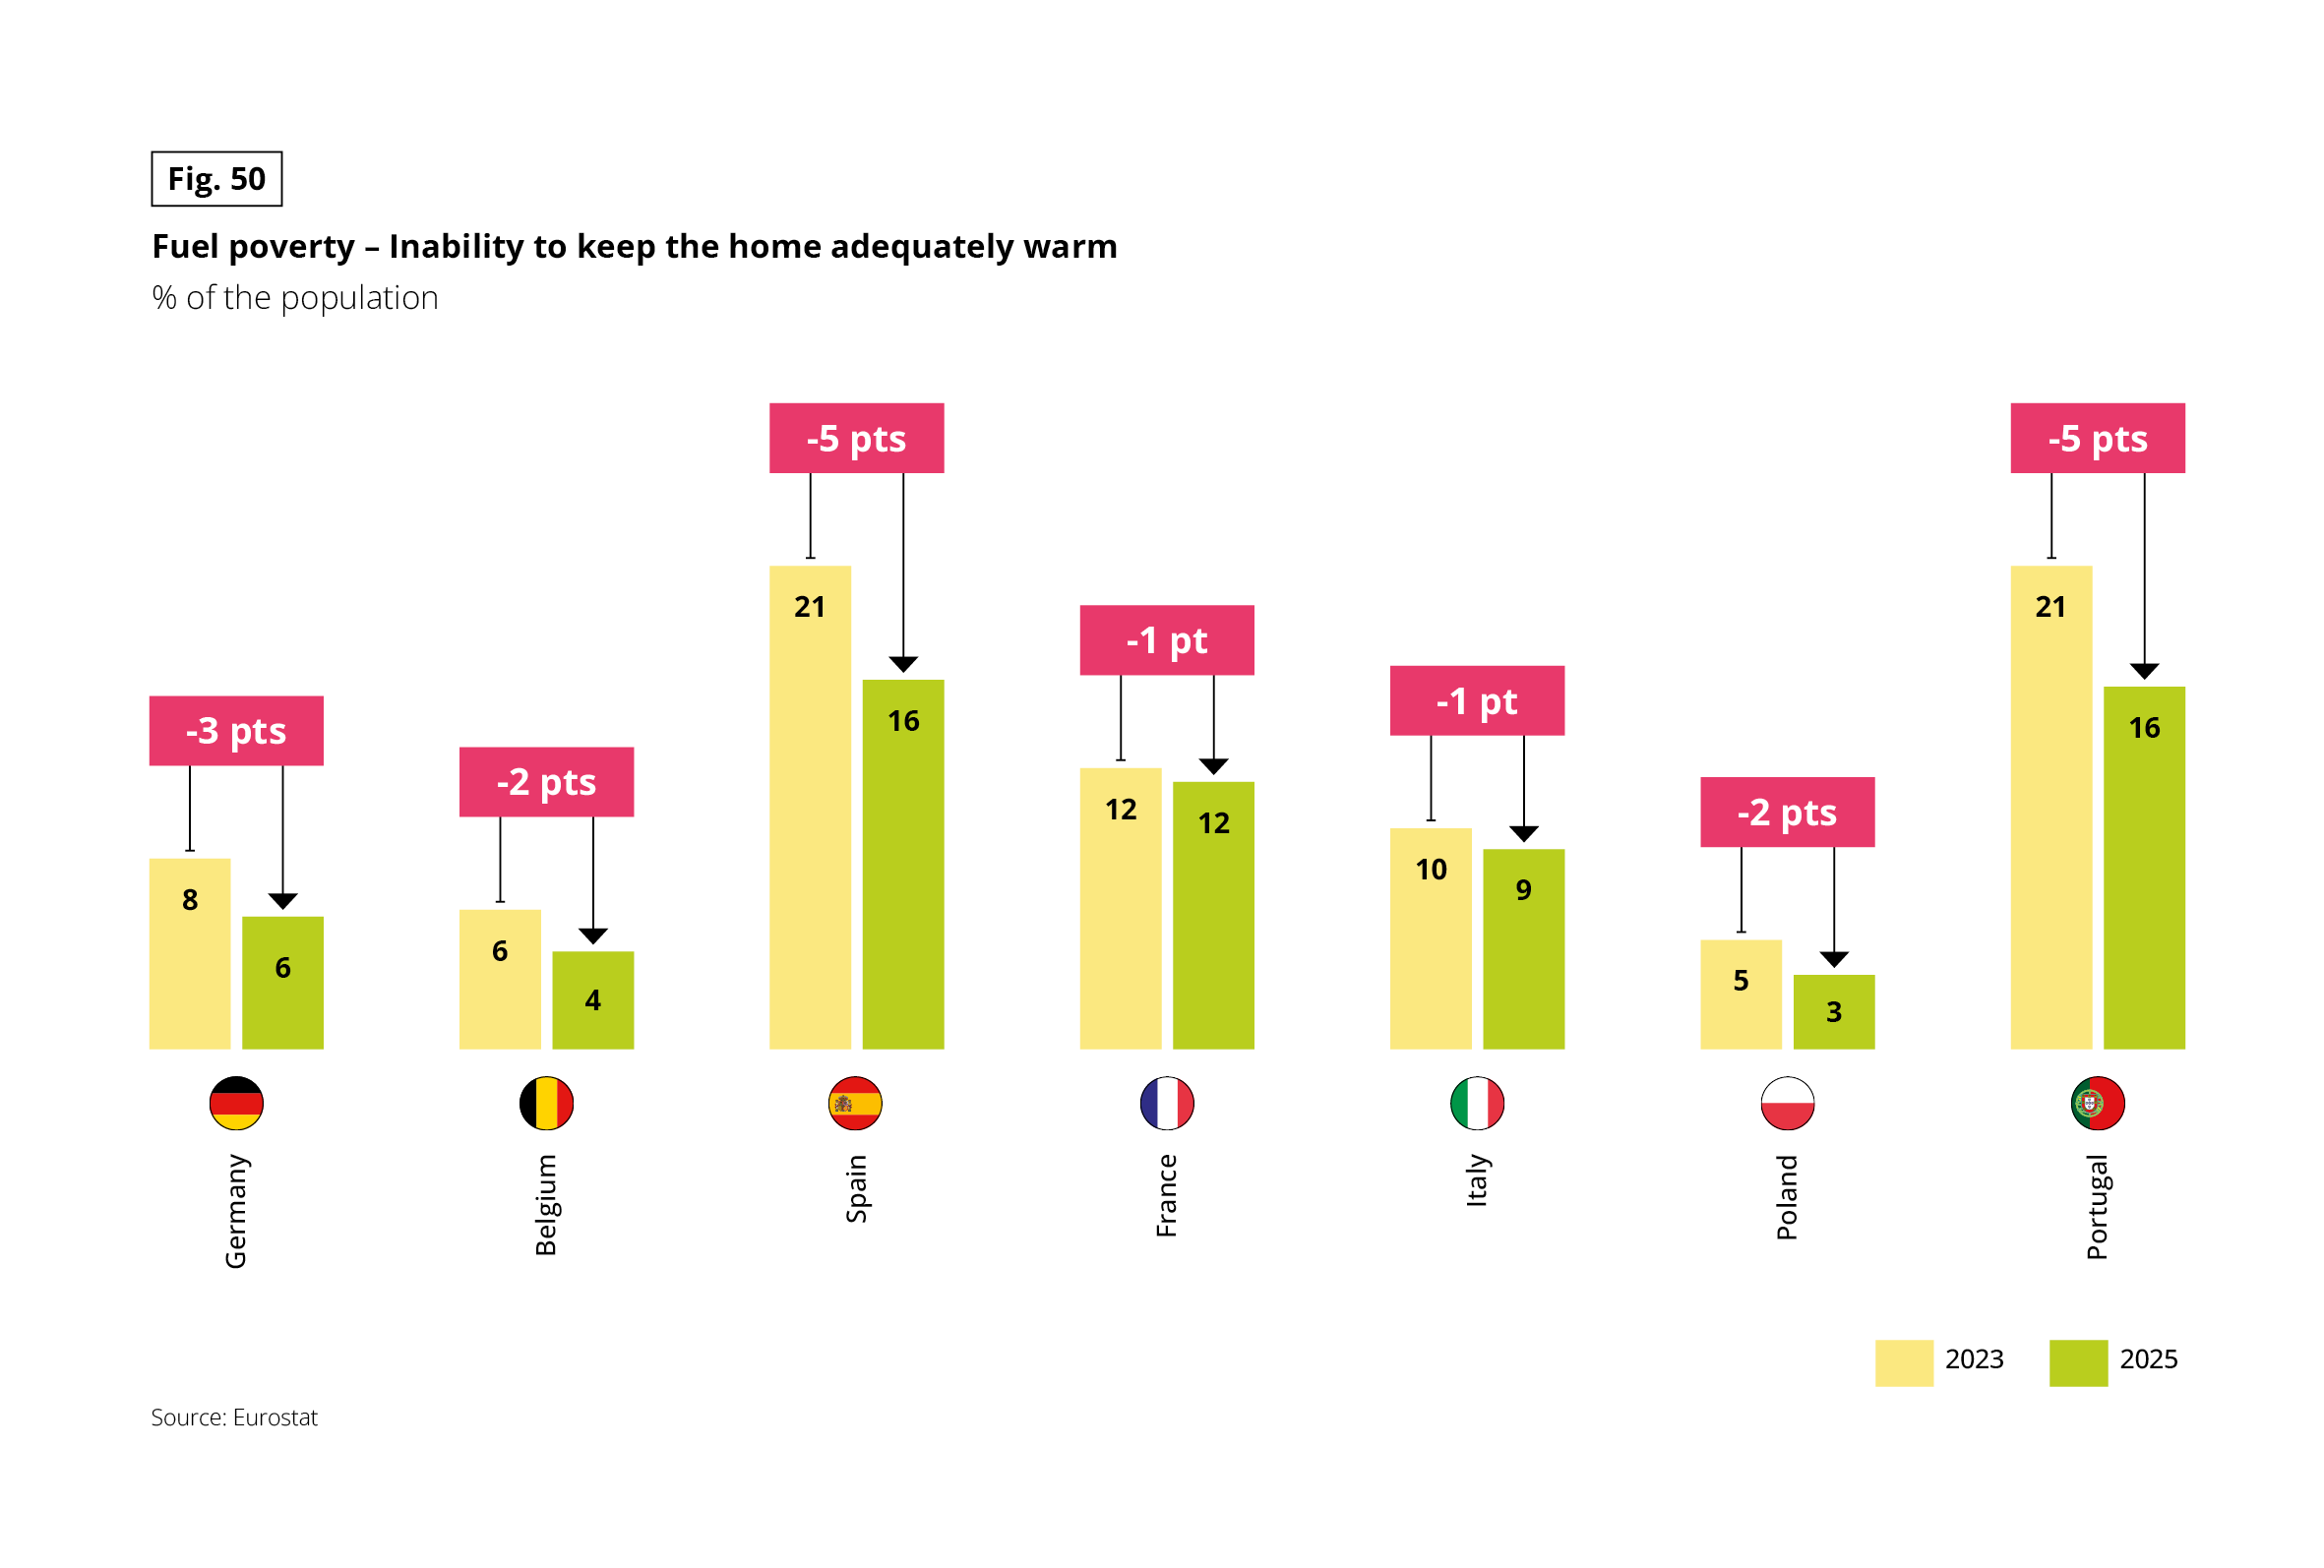 Grouped vertical bar chart. Unit: % of the population. Two series, 2023 and 2025, with the change in percentage points above each pair. Source: Eurostat.
Data in the form 2023 / 2025 (change):
• Germany: 8 / 6 (−3 pts)
• Belgium: 6 / 4 (−2 pts)
• Spain: 21 / 16 (−5 pts)
• France: 12 / 12 (−1 pt)
• Italy: 10 / 9 (−1 pt)
• Poland: 5 / 3 (−2 pts)
• Portugal: 21 / 16 (−5 pts)
Fuel poverty declines in every country. Spain and Portugal remain the highest (16%) despite the sharpest falls (−5 pts). France is the only country where the displayed values are unchanged (12%), and Poland has the lowest rate (3%). The change labels are as printed on the chart, which rounds some figures (for example Germany, 8 to 6, is shown as −3 pts).
The easing of energy pressure is also reflected in how households perceive their budgets. Between 2024 and 2026, the feeling of having an excessive energy budget fell by 7 percentage points: it now concerns just 31% of Europeans, while 69% now view their budget as reasonable or low.
This easing is widespread, and the gap between countries has narrowed significantly, from 32 down to 19 percentage points. Finally, one last divide runs across the whole of Europe and will thread through the rest of this section: tenants (36%) feel their energy budget is a heavier burden than homeowners do (29%).
Fig. 51 – Share of respondents who consider their energy budget excessive, 2024 and 2026
Download this infographic for your presentations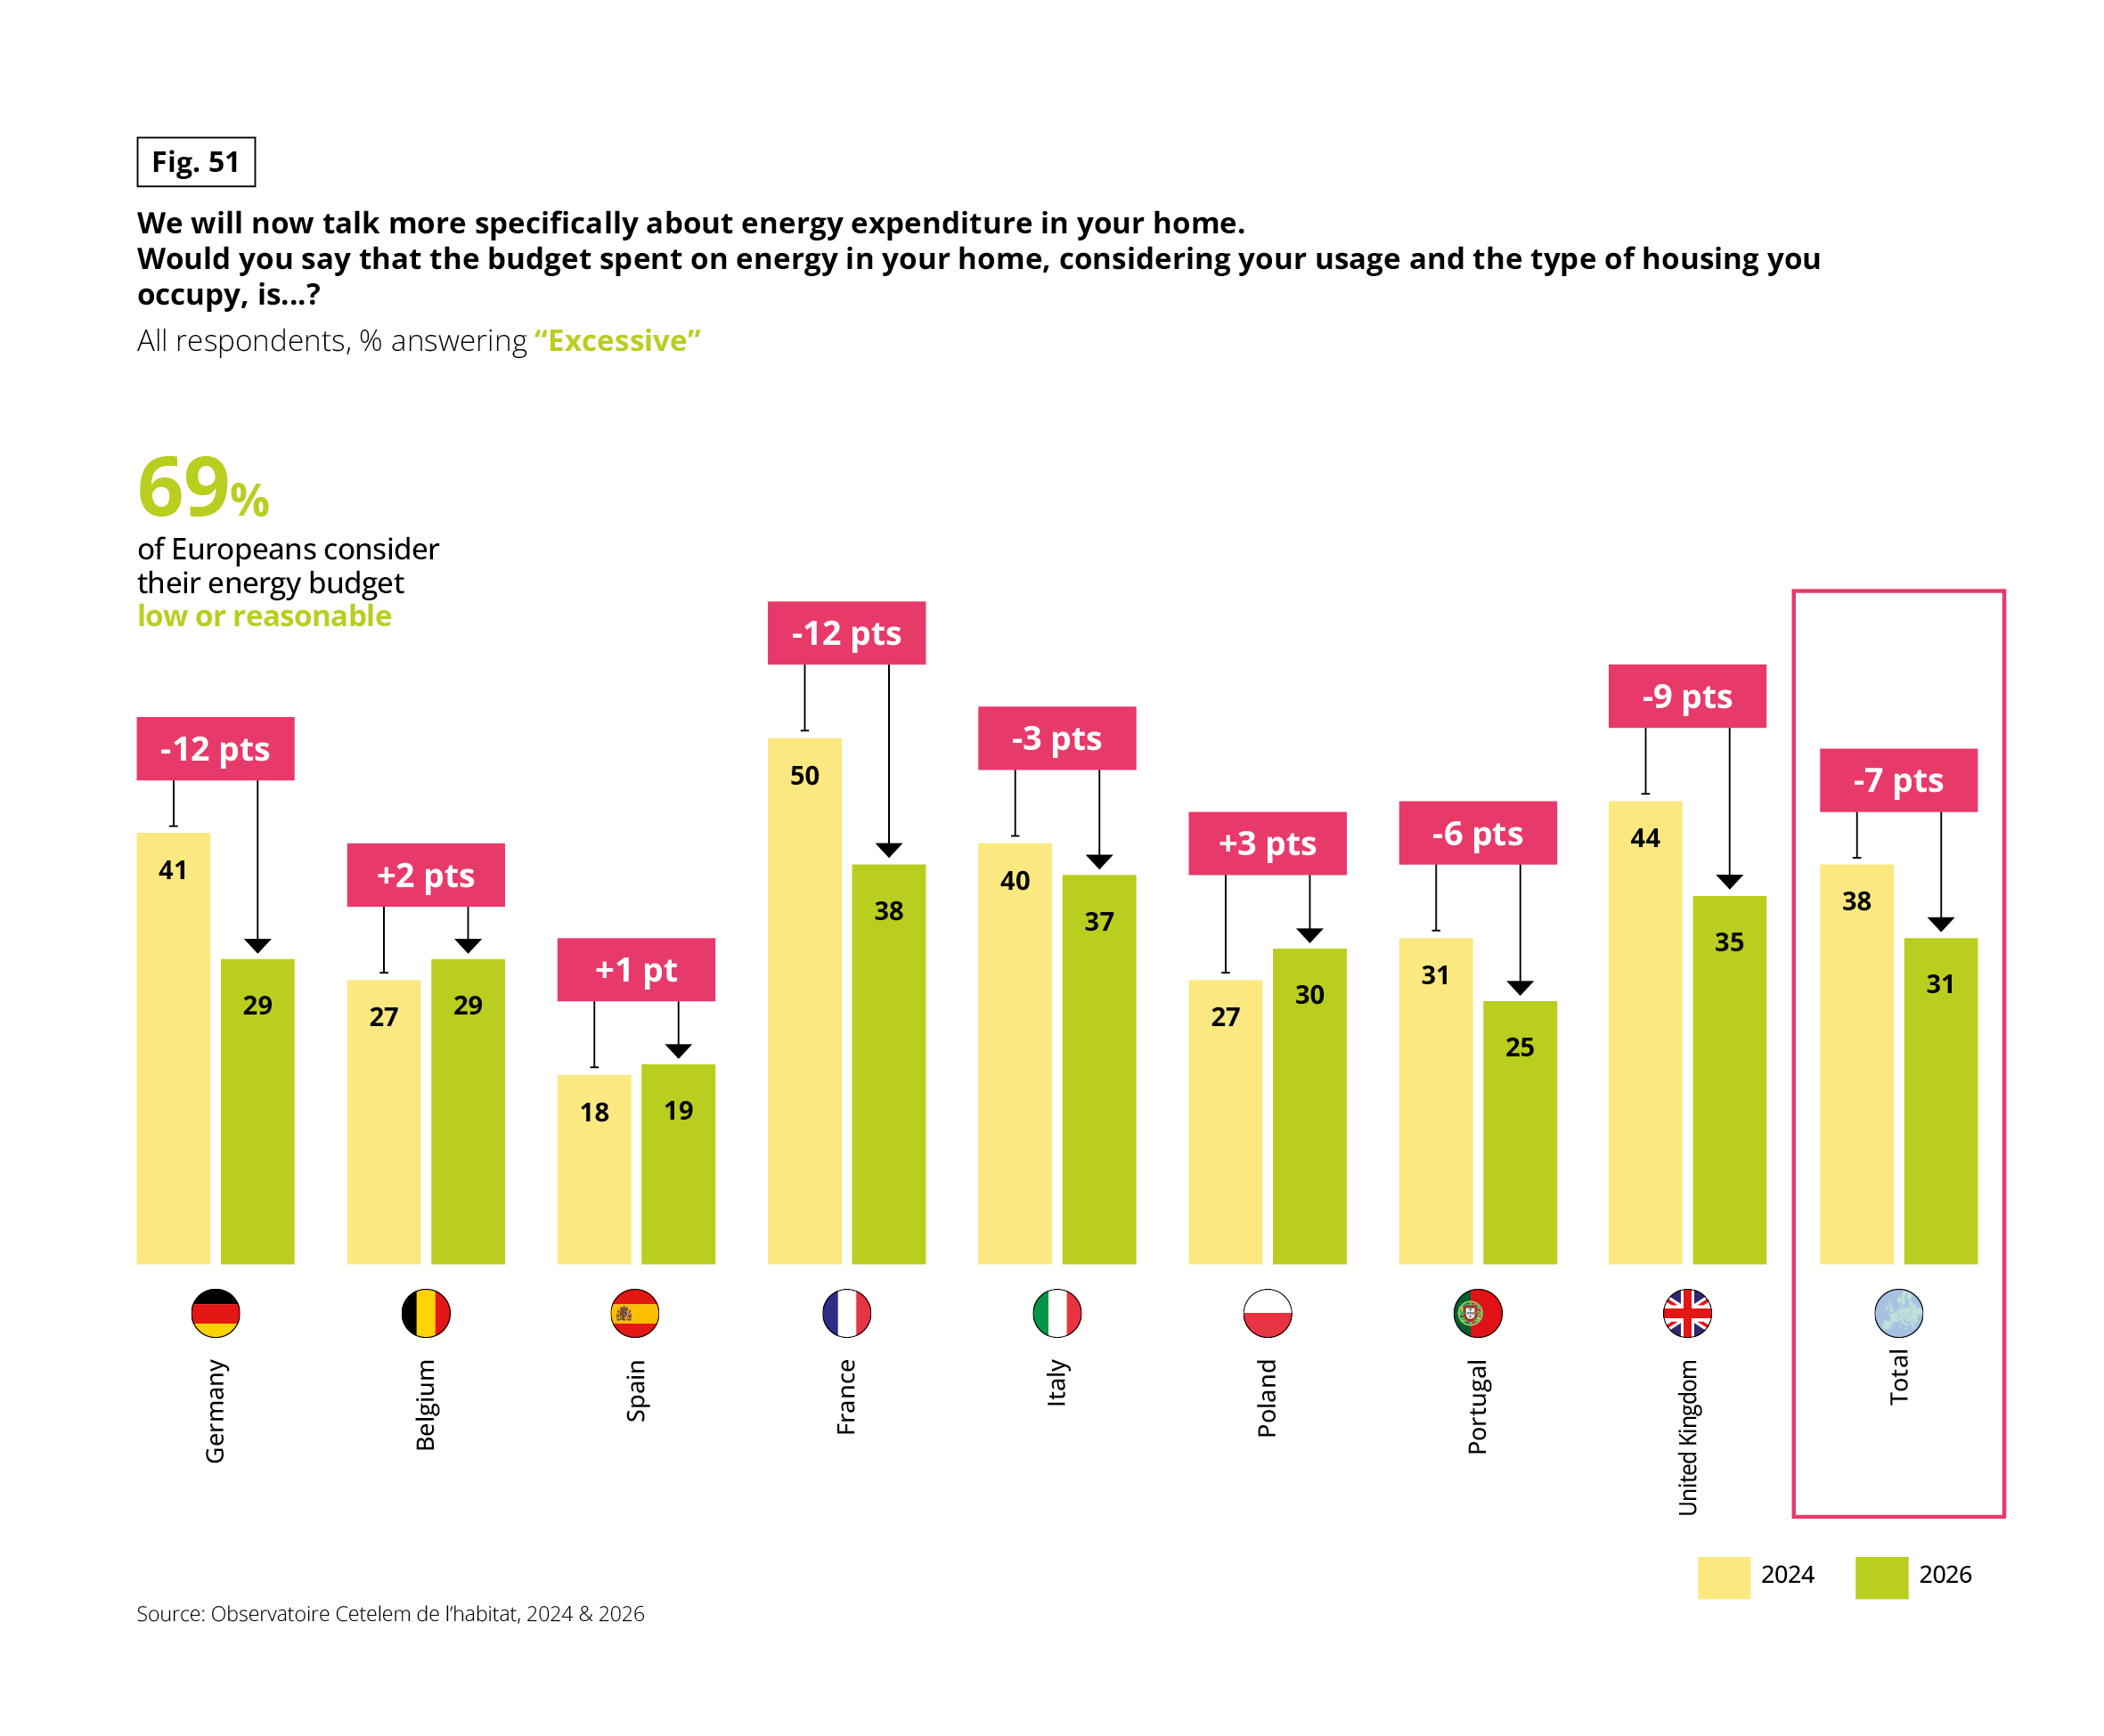 Grouped vertical bar chart. Question: “Would you say that the budget spent on energy in your home, considering your usage and the type of housing you occupy, is…?” Base: all respondents, in % answering “Excessive”. Two series, 2024 and 2026, with the change in points above each pair. A highlighted message states that 69% of Europeans consider their energy budget low or reasonable. Source: Observatoire Cetelem de l’habitat, 2024 and 2026.
Data in the form 2024 / 2026 (change):
• Germany: 41 / 29 (−12 pts)
• Belgium: 27 / 29 (+2 pts)
• Spain: 18 / 19 (+1 pt)
• France: 50 / 38 (−12 pts)
• Italy: 40 / 37 (−3 pts)
• Poland: 27 / 30 (+3 pts)
• Portugal: 31 / 25 (−6 pts)
• United Kingdom: 44 / 35 (−9 pts)
• Total: 38 / 31 (−7 pts)
The perception of an excessive energy budget falls in most countries, most sharply in Germany and France (−12 pts each). It rises slightly in Belgium, Spain and Poland. France (38%) and Italy (37%) are the highest in 2026, and Spain (19%) the lowest.
ENERGY SOBRIETY TAKES HOLD, AS RENOVATION APPETITE WANES
The respite from high energy bills has not erased the habits it established. Between 2024 and 2026, the pursuit of energy savings remains near-universal, embraced by 85% of Europeans and dipping only slightly (down 2 percentage points), while the gap between countries continues to narrow (from 15 down to 12 percentage points). Energy sobriety has established itself as the norm: less a political statement than a common-sense financial habit inherited from the 2022 crisis. It persists even as price pressure eases, driven by ongoing anxieties about the future. Once formed, the habit survives the calm.
Fig. 52 – Efforts to reduce energy consumption at home
Download this infographic for your presentations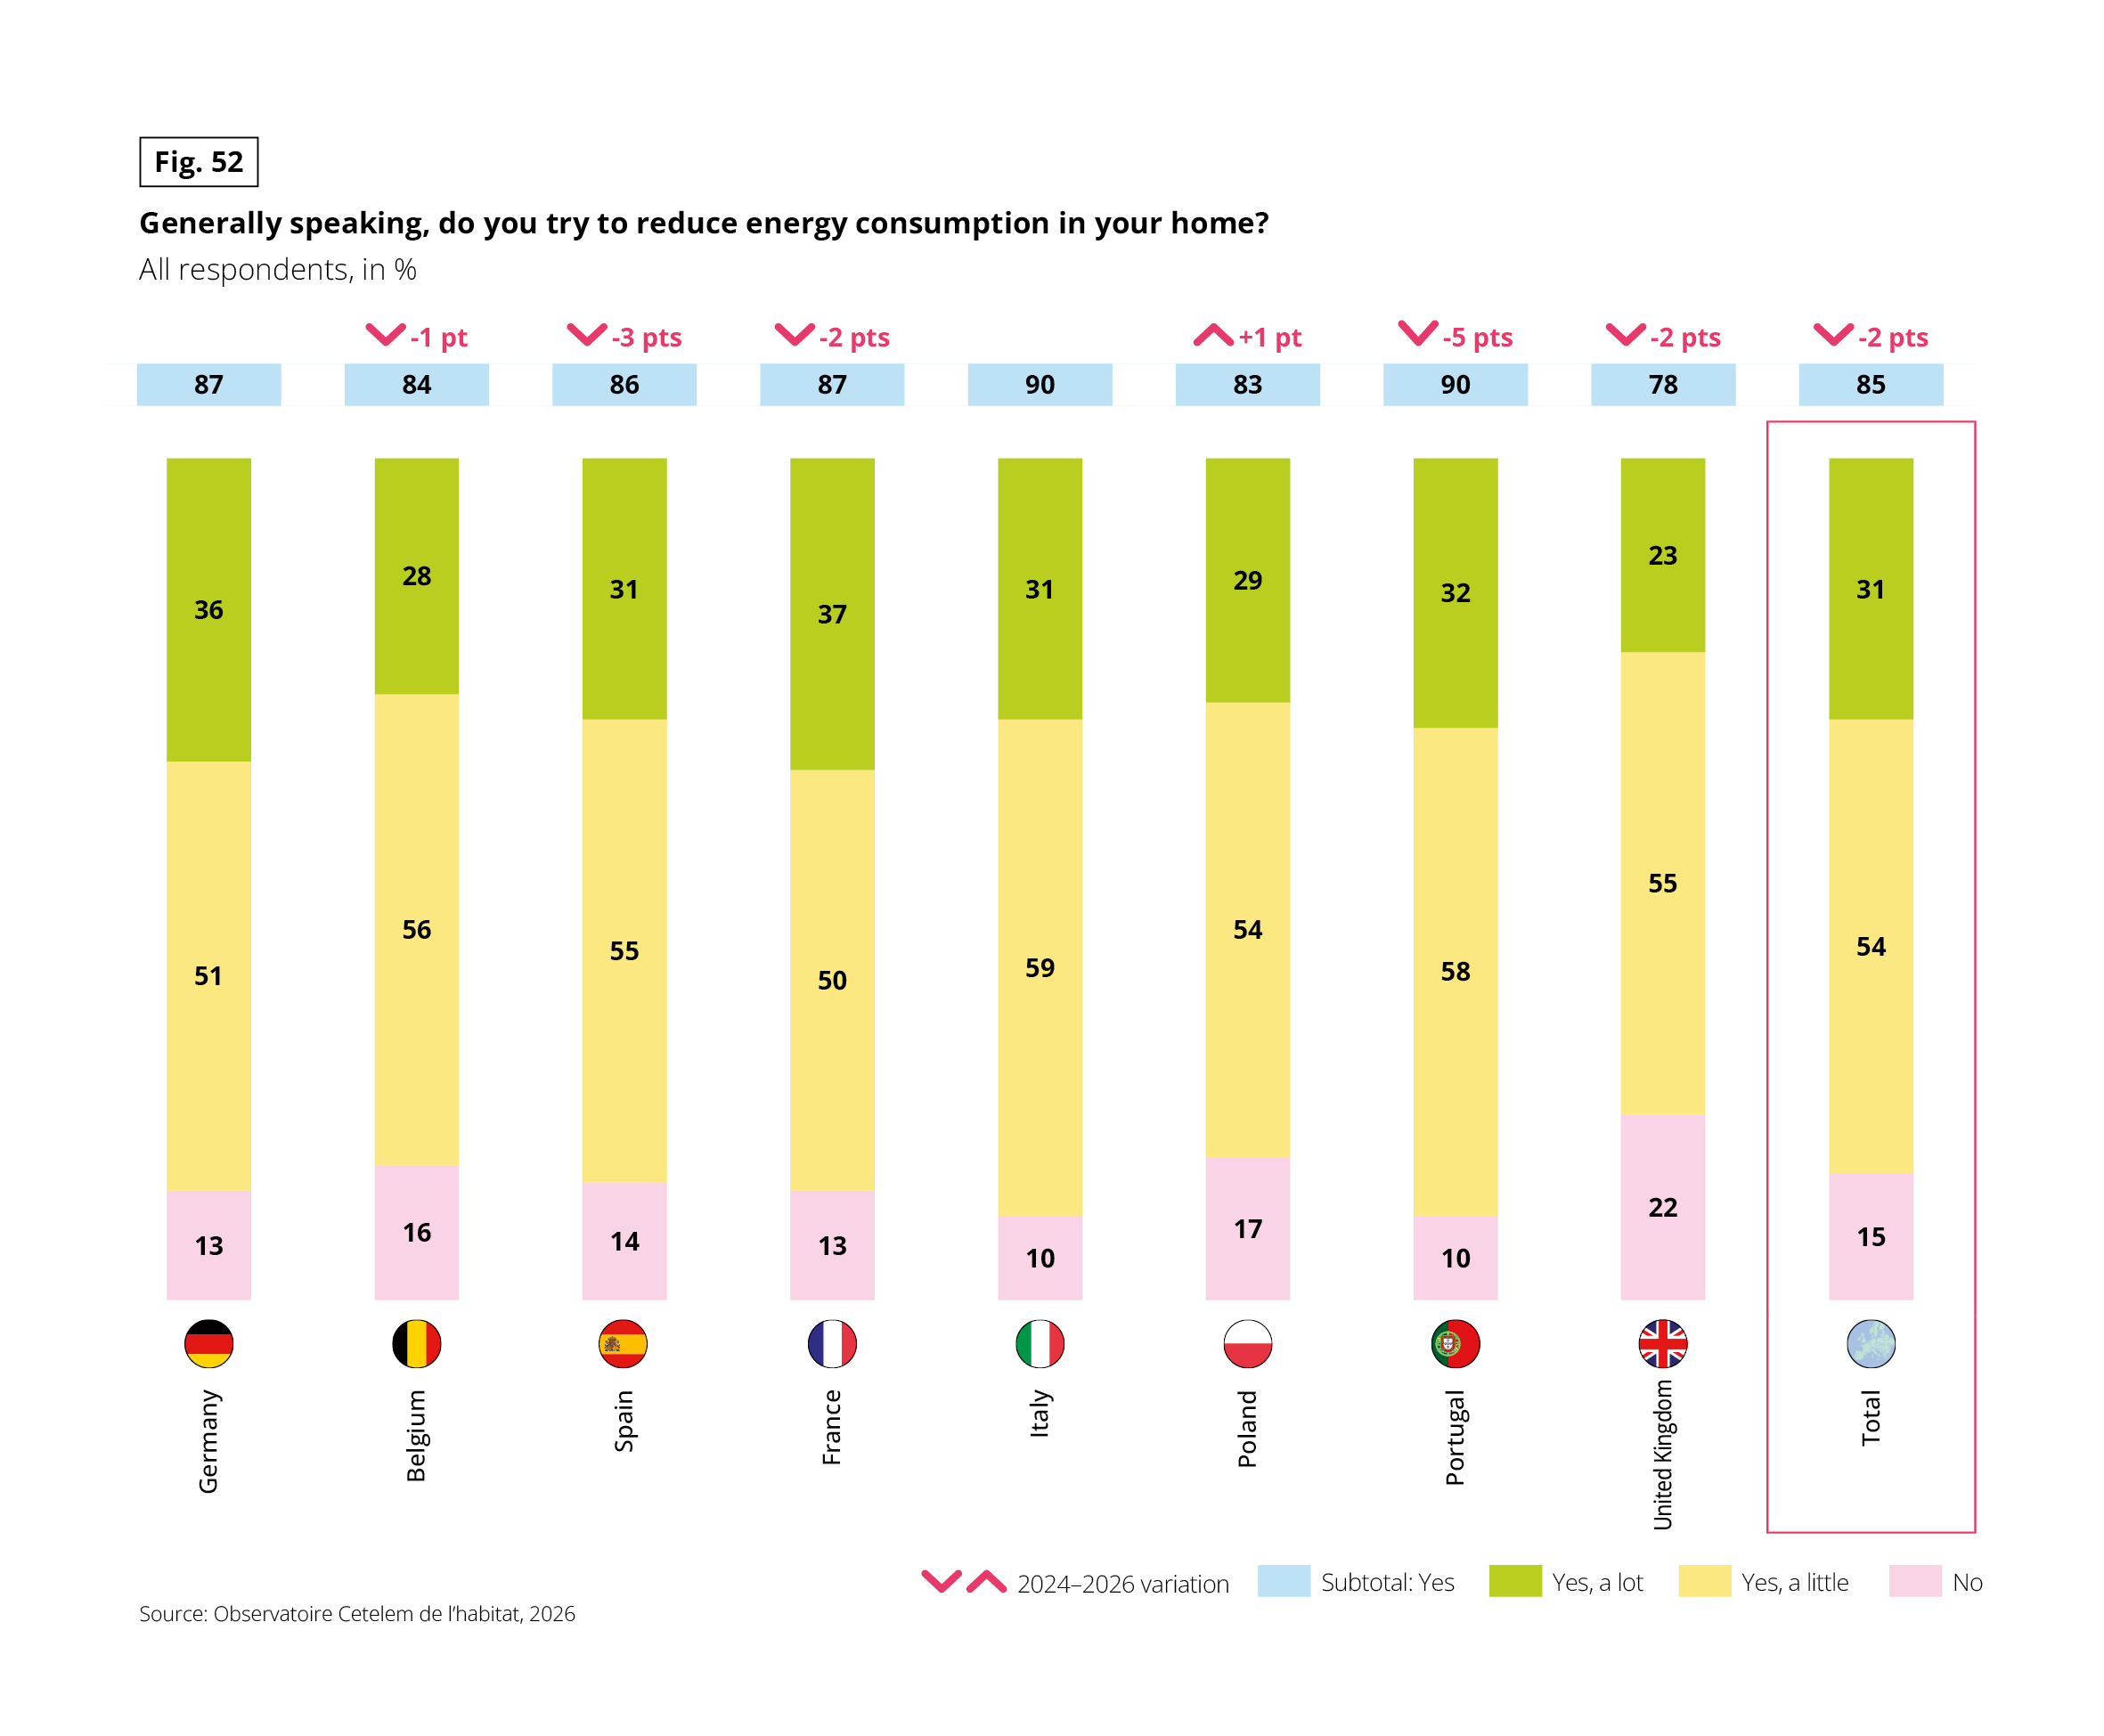 Stacked vertical bar chart. Question: “Generally speaking, do you try to reduce energy consumption in your home?” Base: all respondents, in %. Three answers: yes a lot, yes a little, no. The subtotal “Yes” is shown above each column, with the 2024–2026 change in points where available. Source: Observatoire Cetelem de l’habitat, 2026.
Data in the form yes a lot / yes a little / no (yes subtotal, 2024–2026 change):
• Germany: 36 / 51 / 13 (87, no change shown)
• Belgium: 28 / 56 / 16 (84, −1 pt)
• Spain: 31 / 55 / 14 (86, −3 pts)
• France: 37 / 50 / 13 (87, −2 pts)
• Italy: 31 / 59 / 10 (90, no change shown)
• Poland: 29 / 54 / 17 (83, +1 pt)
• Portugal: 32 / 58 / 10 (90, −5 pts)
• United Kingdom: 23 / 55 / 22 (78, −2 pts)
• Total: 31 / 54 / 15 (85, −2 pts)
France (37%) and Germany (36%) have the highest shares trying “a lot”. The United Kingdom is lowest on both measures (23% a lot, 78% overall). Efforts fall slightly overall since 2024 (−2 pts), most sharply in Portugal (−5 pts).
Attitudes towards renovation, meanwhile, are shifting in subtle ways. For instance, 6 in 10 Europeans still believe that building works could improve the energy efficiency of their home, homeowners (62%) more so than tenants (57%), but this sentiment declined across all countries between 2025 and 2026.
This retreat can be interpreted in two ways:
- As energy bills weigh slightly less heavily on day-to-day budgets, the perceived urgency to act is waning. At the same time, the progress already achieved, such as the decarbonisation of the housing stock and lower consumption levels highlighted above, reduces the perceived need for some households.
- Yet the objective need remains completely unchanged: an ageing housing stock, predominantly built before 1970, that consumes up to three times more energy than new builds. Herein lies the paradox: the perceived pressure is easing faster than the underlying problem is being solved. The question now is how households and local authorities will tackle this challenge.
Fig. 53 – Belief that energy efficiency works could be carried out at home, 2025 and 2026
Download this infographic for your presentations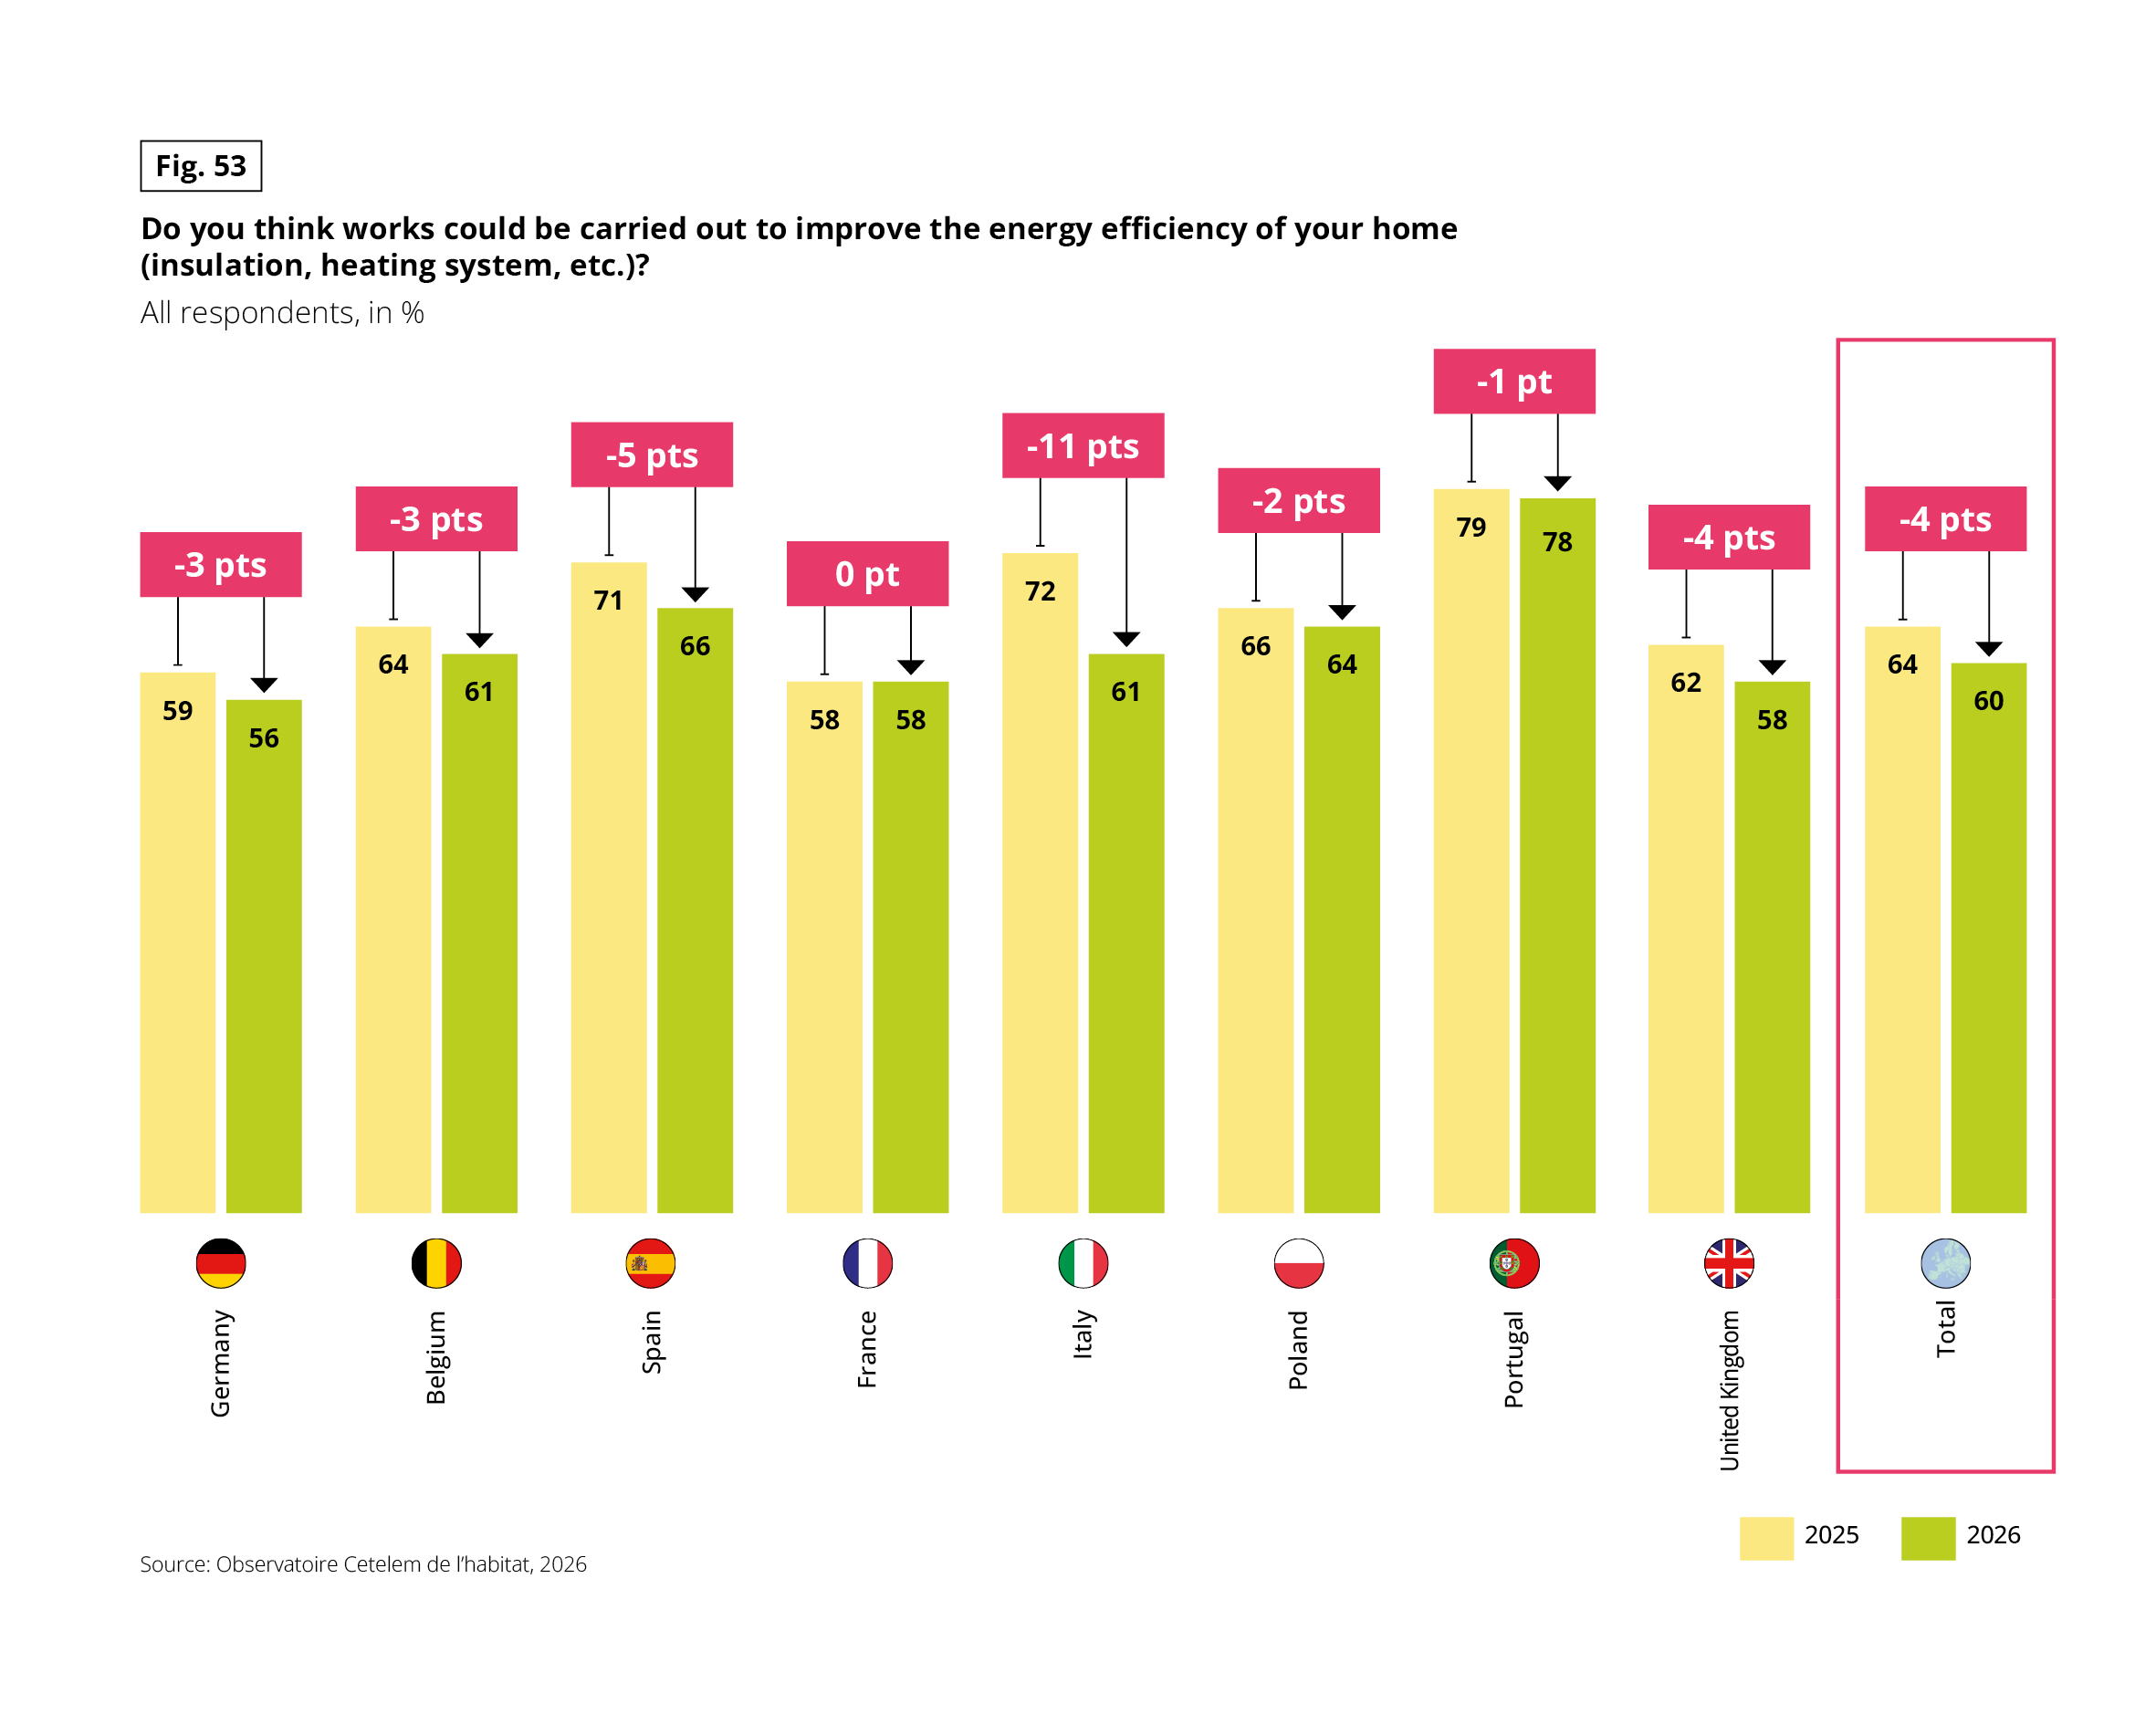 Grouped vertical bar chart. Question: “Do you think works could be carried out to improve the energy efficiency of your home (insulation, heating system, etc.)?” Base: all respondents, in %. Two series, 2025 and 2026, with the change in points above each pair. Source: Observatoire Cetelem de l’habitat, 2026.
Data in the form 2025 / 2026 (change):
• Germany: 59 / 56 (−3 pts)
• Belgium: 64 / 61 (−3 pts)
• Spain: 71 / 66 (−5 pts)
• France: 58 / 58 (0 pt)
• Italy: 72 / 61 (−11 pts)
• Poland: 66 / 64 (−2 pts)
• Portugal: 79 / 78 (−1 pt)
• United Kingdom: 62 / 58 (−4 pts)
• Total: 64 / 60 (−4 pts)
Belief in possible works falls almost everywhere. Italy has the sharpest fall (−11 pts). France is stable. Portugal is the highest in both years (78% in 2026).
ENERGY SOBRIETY PROJECTS, DRIVEN BY THE CURRENT MOMENTUM OF LOCAL REGIONS
Projects for the year ahead build on this energy sobriety that has become second nature. However, the more costly or demanding a project is, the fewer Europeans plan to undertake it. A majority intend first and foremost to adjust their consumption habits, the simplest step.
As soon as investment is required, intentions fall away: 1 in 2 plans to buy more efficient equipment, 46% intend to carry out adaptation works, and only 28% consider moving house, an option that half categorically rule out. Over a two-year period construction work and relocations have increased modestly, indicating a slow market recovery.
Fig. 54 – Plans for the next 12 months: energy habits, equipment, works and moving
Download this infographic for your presentations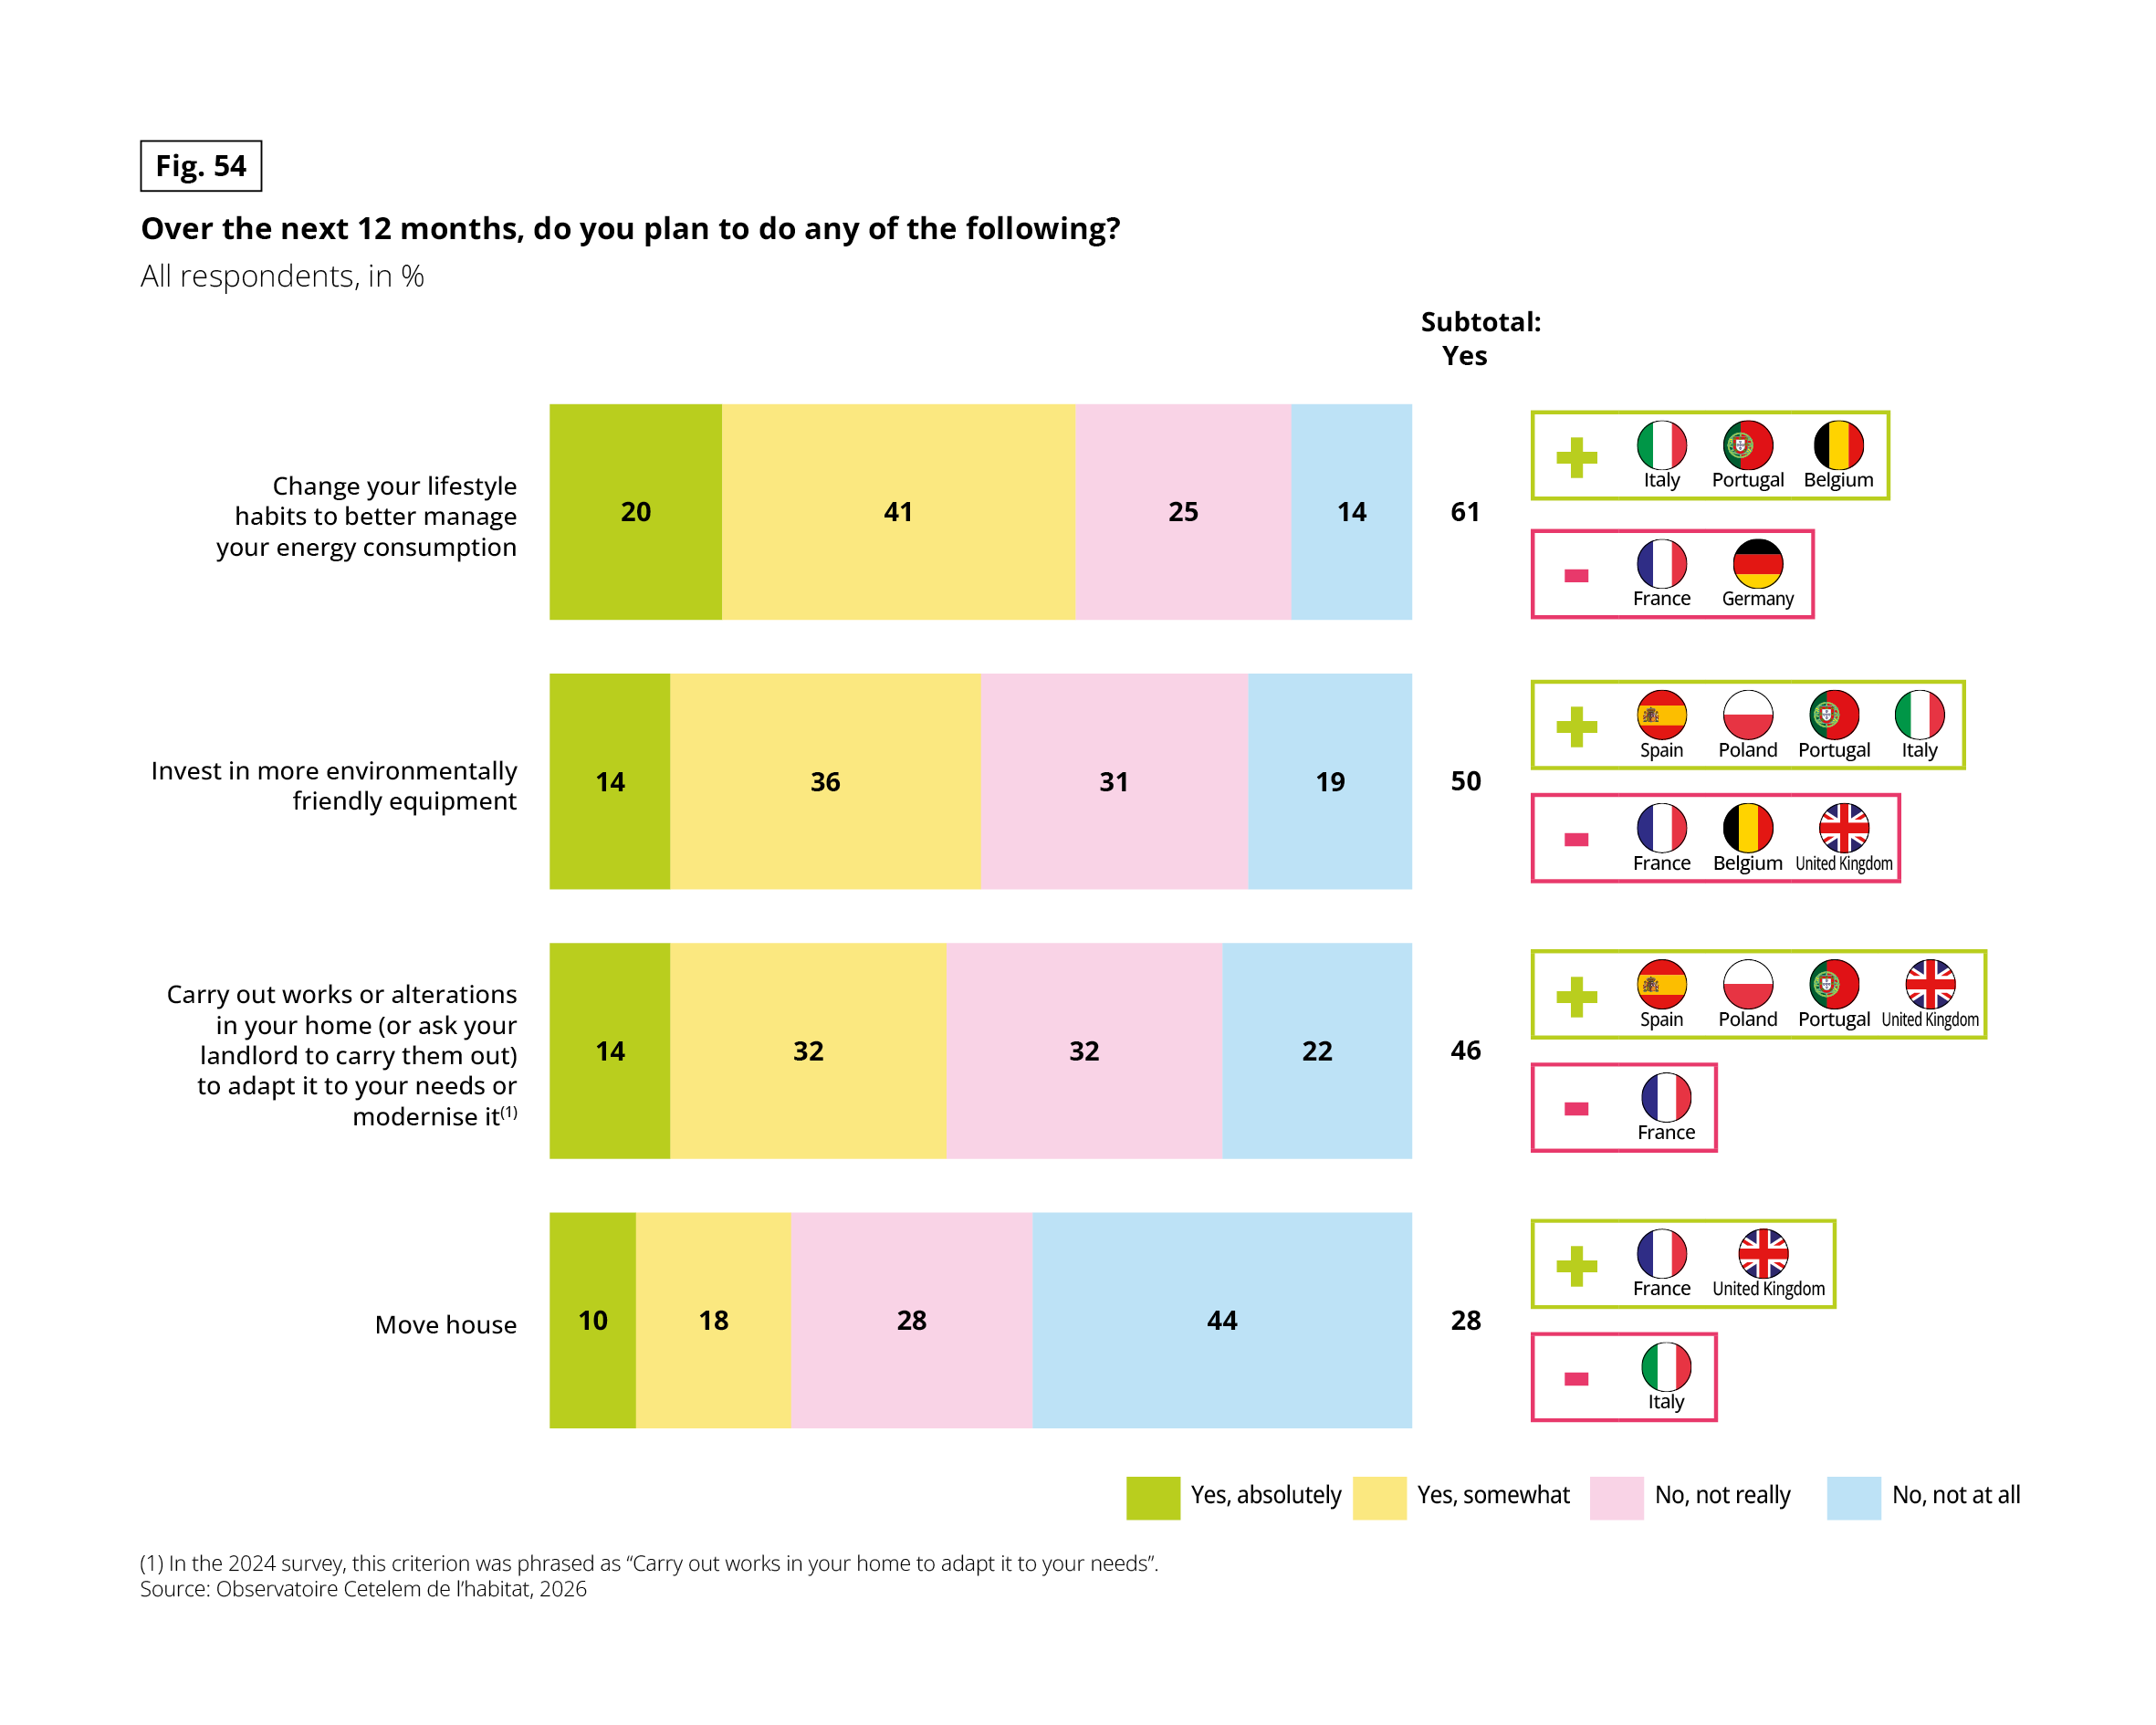 Stacked horizontal bar chart. Question: “Over the next 12 months, do you plan to do any of the following?” Base: all respondents, in %. Four answers: yes absolutely, yes somewhat, no not really, no not at all. The subtotal “Yes” is shown to the right, with boxes listing the countries above (+) and below (−) the total. Source: Observatoire Cetelem de l’habitat, 2026.
Data in the form yes absolutely / yes somewhat / no not really / no not at all (yes subtotal):
• Change your lifestyle habits to better manage your energy consumption: 20 / 41 / 25 / 14 (61). Above the total: Italy, Portugal, Belgium. Below: France, Germany.
• Invest in more environmentally friendly equipment: 14 / 36 / 31 / 19 (50). Above: Spain, Poland, Portugal, Italy. Below: France, Belgium, United Kingdom.
• Carry out works or alterations in your home (or ask your landlord to carry them out) to adapt it to your needs or modernise it: 14 / 32 / 32 / 22 (46). Above: Spain, Poland, Portugal, United Kingdom. Below: France.
• Move house: 10 / 18 / 28 / 44 (28). Above: France, United Kingdom. Below: Italy.
Note: in the 2024 survey, the works item was phrased “Carry out works in your home to adapt it to your needs”.
Changing habits is the most common plan, and moving house the least. France is below the total on the first three items.
The geographical pattern of taking action mirrors the findings on household budgets in Part 1.
It is the most economically dynamic countries—Portugal, Spain and Poland—that show the strongest desire to act. Conversely, Germany and France are taking a more cautious approach, adopting a wait-and-see stance. The motivation to act therefore appears to be driven less by fear than by the resources available.
Households take action when their financial situation allows it. Yet today, that is not the case for everyone.
HOUSEHOLD CONCERNS RISE EVEN AS INFLATION FALLS
And yet, anxiety persists, as though following its own logic, detached from the momentum to take action.
It is fuelled primarily by energy and purchasing power, which were already central to the budget analysis.
The most striking aspect lies elsewhere: these concerns have grown over a two-year period, even as prices have adjusted following previous inflationary peaks, suggesting that consumers confidence is rebuilding much more slowly than inflation is easing.
Crucially, the map of anxieties does not overlap with the map of projects. Concern peaks in Poland and Italy, but fades in Germany and Spain. Spain, however, is taking significant action while remaining calm, whereas France harbours high levels of anxiety yet moves very little.
The takeaway is clear: whether it comes to buying more efficient equipment, undertaking renovation works or moving to a more energy-efficient home, taking action stems not from fear, but from having the means to do so.
Anxiety raises awareness, but only financial capacity truly enables action.
Fig. 55 – Worries about difficulties over the coming year: energy, purchasing power and retrofits
Download this infographic for your presentations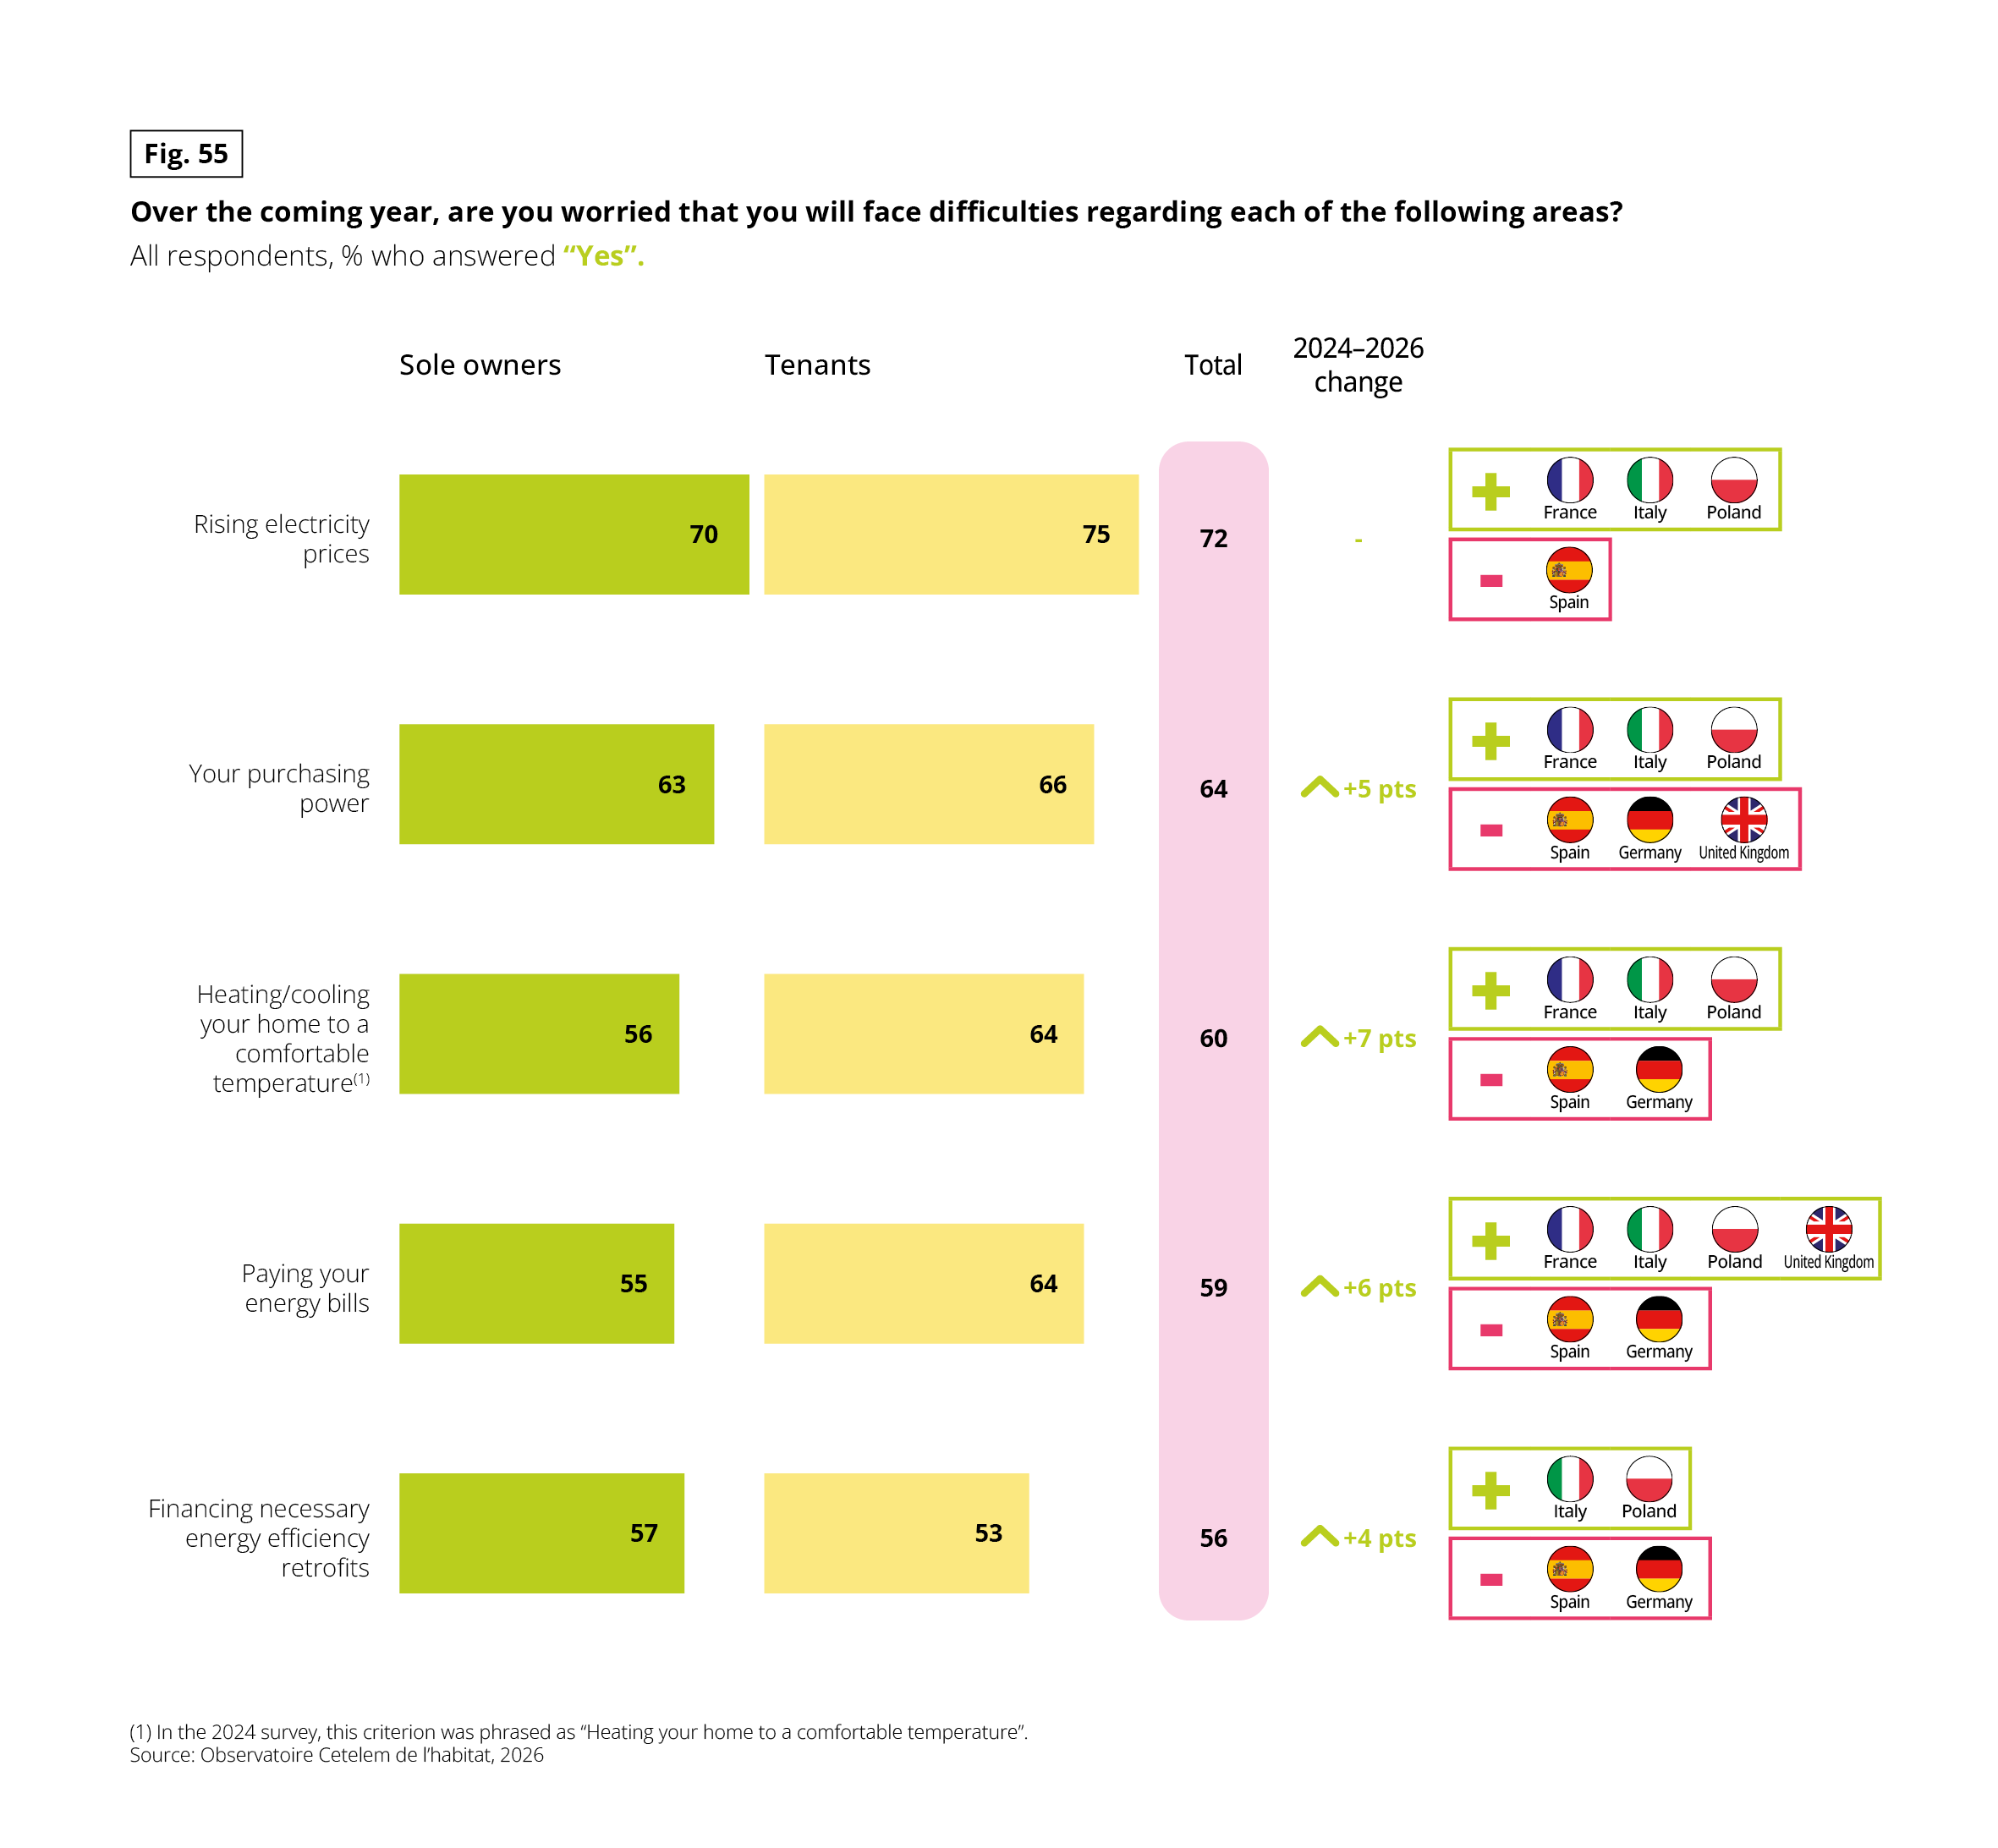 Bar chart with two series (sole owners and tenants), a total column and the 2024–2026 change. Question: “Over the coming year, are you worried that you will face difficulties regarding each of the following areas?” Base: all respondents, % answering “Yes”. Boxes list the countries where worry rose (+) or fell (−) compared with 2024. Source: Observatoire Cetelem de l’habitat, 2026.
Data in the form sole owners / tenants (total, 2024–2026 change):
• Rising electricity prices: 70 / 75 (72, no change shown). Up: France, Italy, Poland. Down: Spain.
• Your purchasing power: 63 / 66 (64, +5 pts). Up: France, Italy, Poland. Down: Spain, Germany, United Kingdom.
• Heating/cooling your home to a comfortable temperature: 56 / 64 (60, +7 pts). Up: France, Italy, Poland. Down: Spain, Germany.
• Paying your energy bills: 55 / 64 (59, +6 pts). Up: France, Italy, Poland, United Kingdom. Down: Spain, Germany.
• Financing necessary energy efficiency retrofits: 57 / 53 (56, +4 pts). Up: Italy, Poland. Down: Spain, Germany.
Note: in the 2024 survey, the third item was phrased “Heating your home to a comfortable temperature”.
Tenants are more worried than sole owners on every item except retrofit financing, where owners are more worried (57% against 53%). Worry increased overall since 2024 on four of the five items.
This finding dictates the remainder of this section: if taking action depends far more on financial capacity than on anxiety, then energy efficiency retrofits will founder less on buy-in than on collective decision-making and funding, two hurdles that are particularly high in co-owned properties.