
Shared living: a workable trade-off


 5 min
reading time
Part 1 demonstrated that housing remains a safe haven under economic strain, with lived experiences defined by tenure status, age and property type. This second section shifts the focus: from the home one owns to the spaces one shares. Living in a co-owned property means navigating shared control: you are sovereign behind your own front door, yet reliant on neighbours to repair the roof, restore the facade or approve a budget.
This section draws first on data across all eight surveyed countries to evaluate attitudes towards collective living, before focusing on four key markets where co-ownership is particularly prevalent.
COLLECTIVE DECISION-MAKING: SOUND IN PRINCIPLE
In theory, the principle of collective decision-making offers reassurance rather than concern. Over three quarters of Europeans feel comfortable with the idea of making joint decisions in the interest of their building or neighbourhood, compared with just a quarter who view it with mistrust. This comfort grows with experience: apartment co-owners are the most serene (84%), ahead of sole homeowners (77%) and tenants (71%).
In other words, joint decision-making is least feared by those who practise it, and most by those who observe it from afar. From one country to another, the findings are remarkably consistent. Comfort levels remain high across all surveyed nations, ranging between two thirds and four fifths of respondents depending on the region, with no sharp geographical divide. What distinguishes Europeans above all is their tenure status: when it comes to collective decision-making, the experience of co-ownership matters far more than country of residence.
Fig. 35 – Comfort with collective decision-making in one’s building or neighbourhood
Download this infographic for your presentations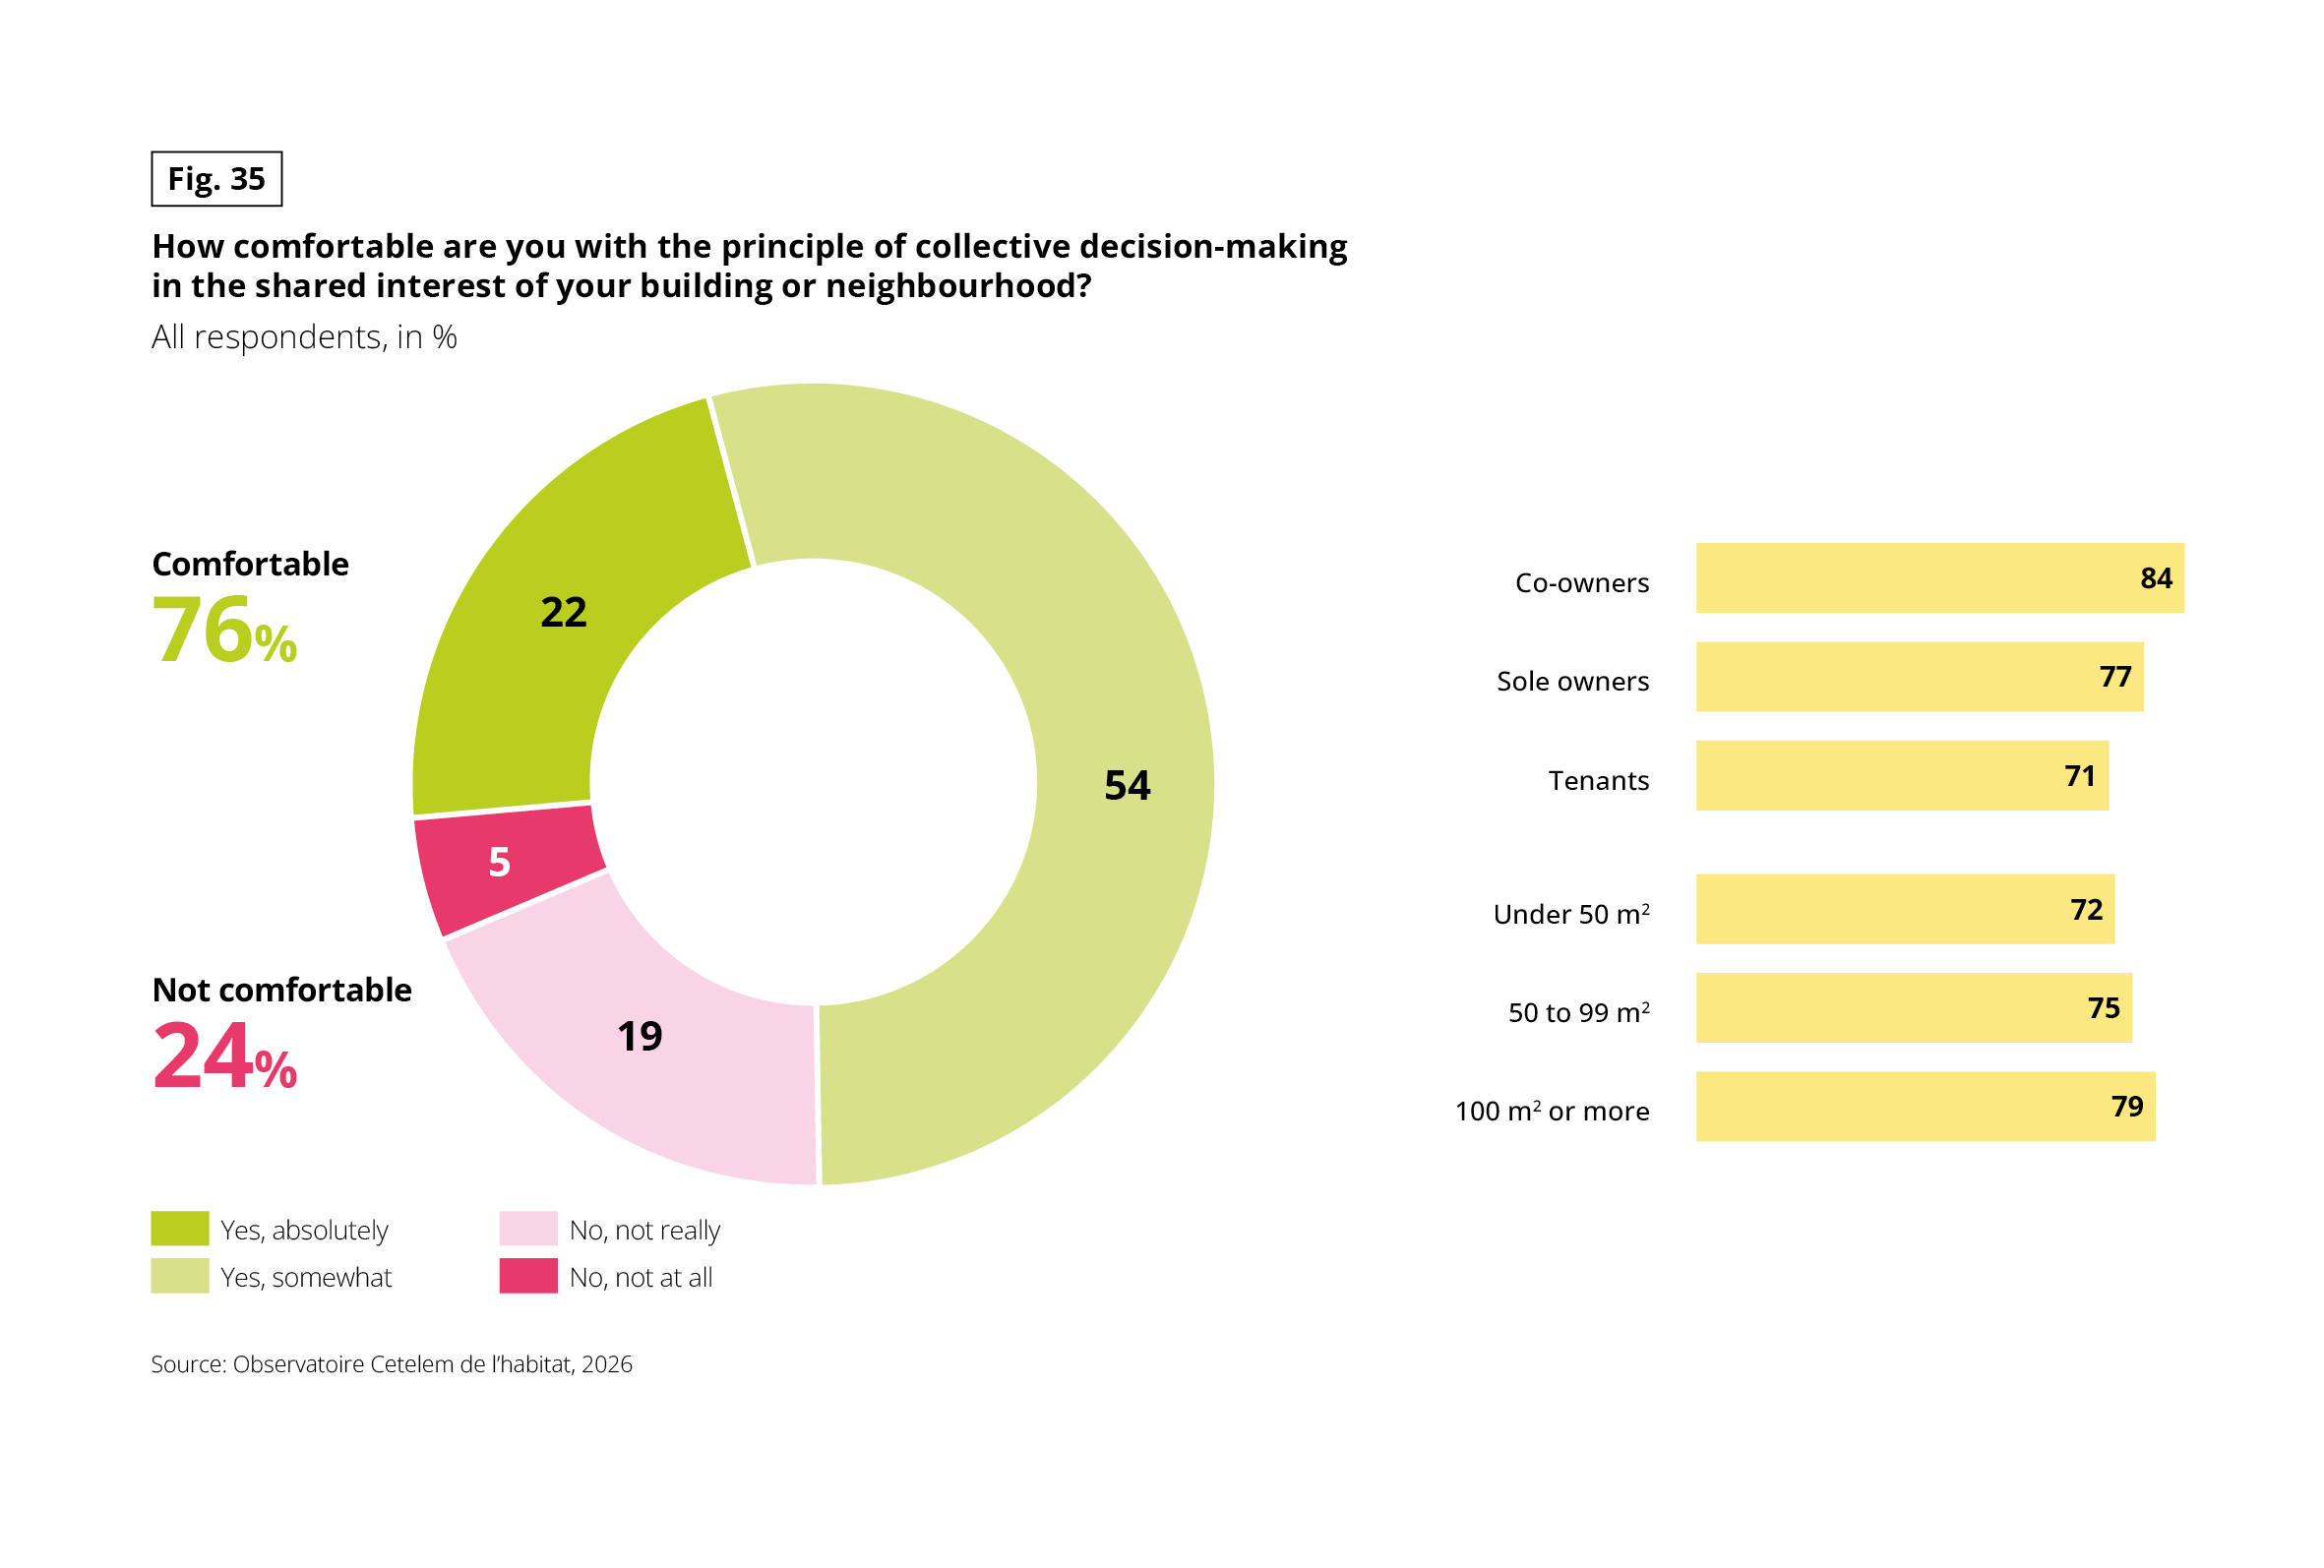 Donut chart with bar charts. Question: “How comfortable are you with the principle of collective decision-making in the shared interest of your building or neighbourhood?” Base: all respondents, in %. Source: Observatoire Cetelem de l’habitat, 2026.
Overall result: yes, absolutely 22%; yes, somewhat 54%; no, not really 19%; no, not at all 5%. In total, 76% are comfortable and 24% are not.
Share comfortable by profile:
• Co-owners: 84%
• Sole owners: 77%
• Tenants: 71%
• Under 50 m²: 72%
• 50 to 99 m²: 75%
• 100 m² or more: 79%
Comfort rises with housing size and is highest among co-owners.
CO-OWNERSHIP IS SEEN AS AN ASSET, BUT DECISION-MAKING REMAINS A FRICTION POINT
This theoretical comfort does not mean that co-ownership is considered preferable to single-family housing. Compared with standalone homes, its primary appeal lies in the burdens it removes. Routine maintenance and administrative management top the list of cited benefits, at around 45%, ahead of energy efficiency retrofits and property improvements. The logic is straightforward: co-ownership is valued first and foremost for sharing costs and tasks, in short, for everything it saves owners from managing alone.
Shared living turns back into a burden, however, as soon as collective decisions must be made. This is the sole item where opinion splits almost evenly between an asset and a drawback: making decisions alongside others is viewed as an advantage by 37% of respondents, but as a disadvantage by 35%. Peace of mind at home follows the same dynamic. People value co-ownership for what it allows them to share, but resent it for what it forces them to negotiate.
Once again, lived experience alters perspectives: co-owners are more likely than average to view co-ownership as a net benefit, demonstrating that practical reality tempers theoretical reluctance. Cross-country variations remain modest: across Europe, the same tension persists between the service provided and the friction of joint decision-making.
Fig. 36 – Co-owned building compared with single-family housing: asset or drawback
Download this infographic for your presentations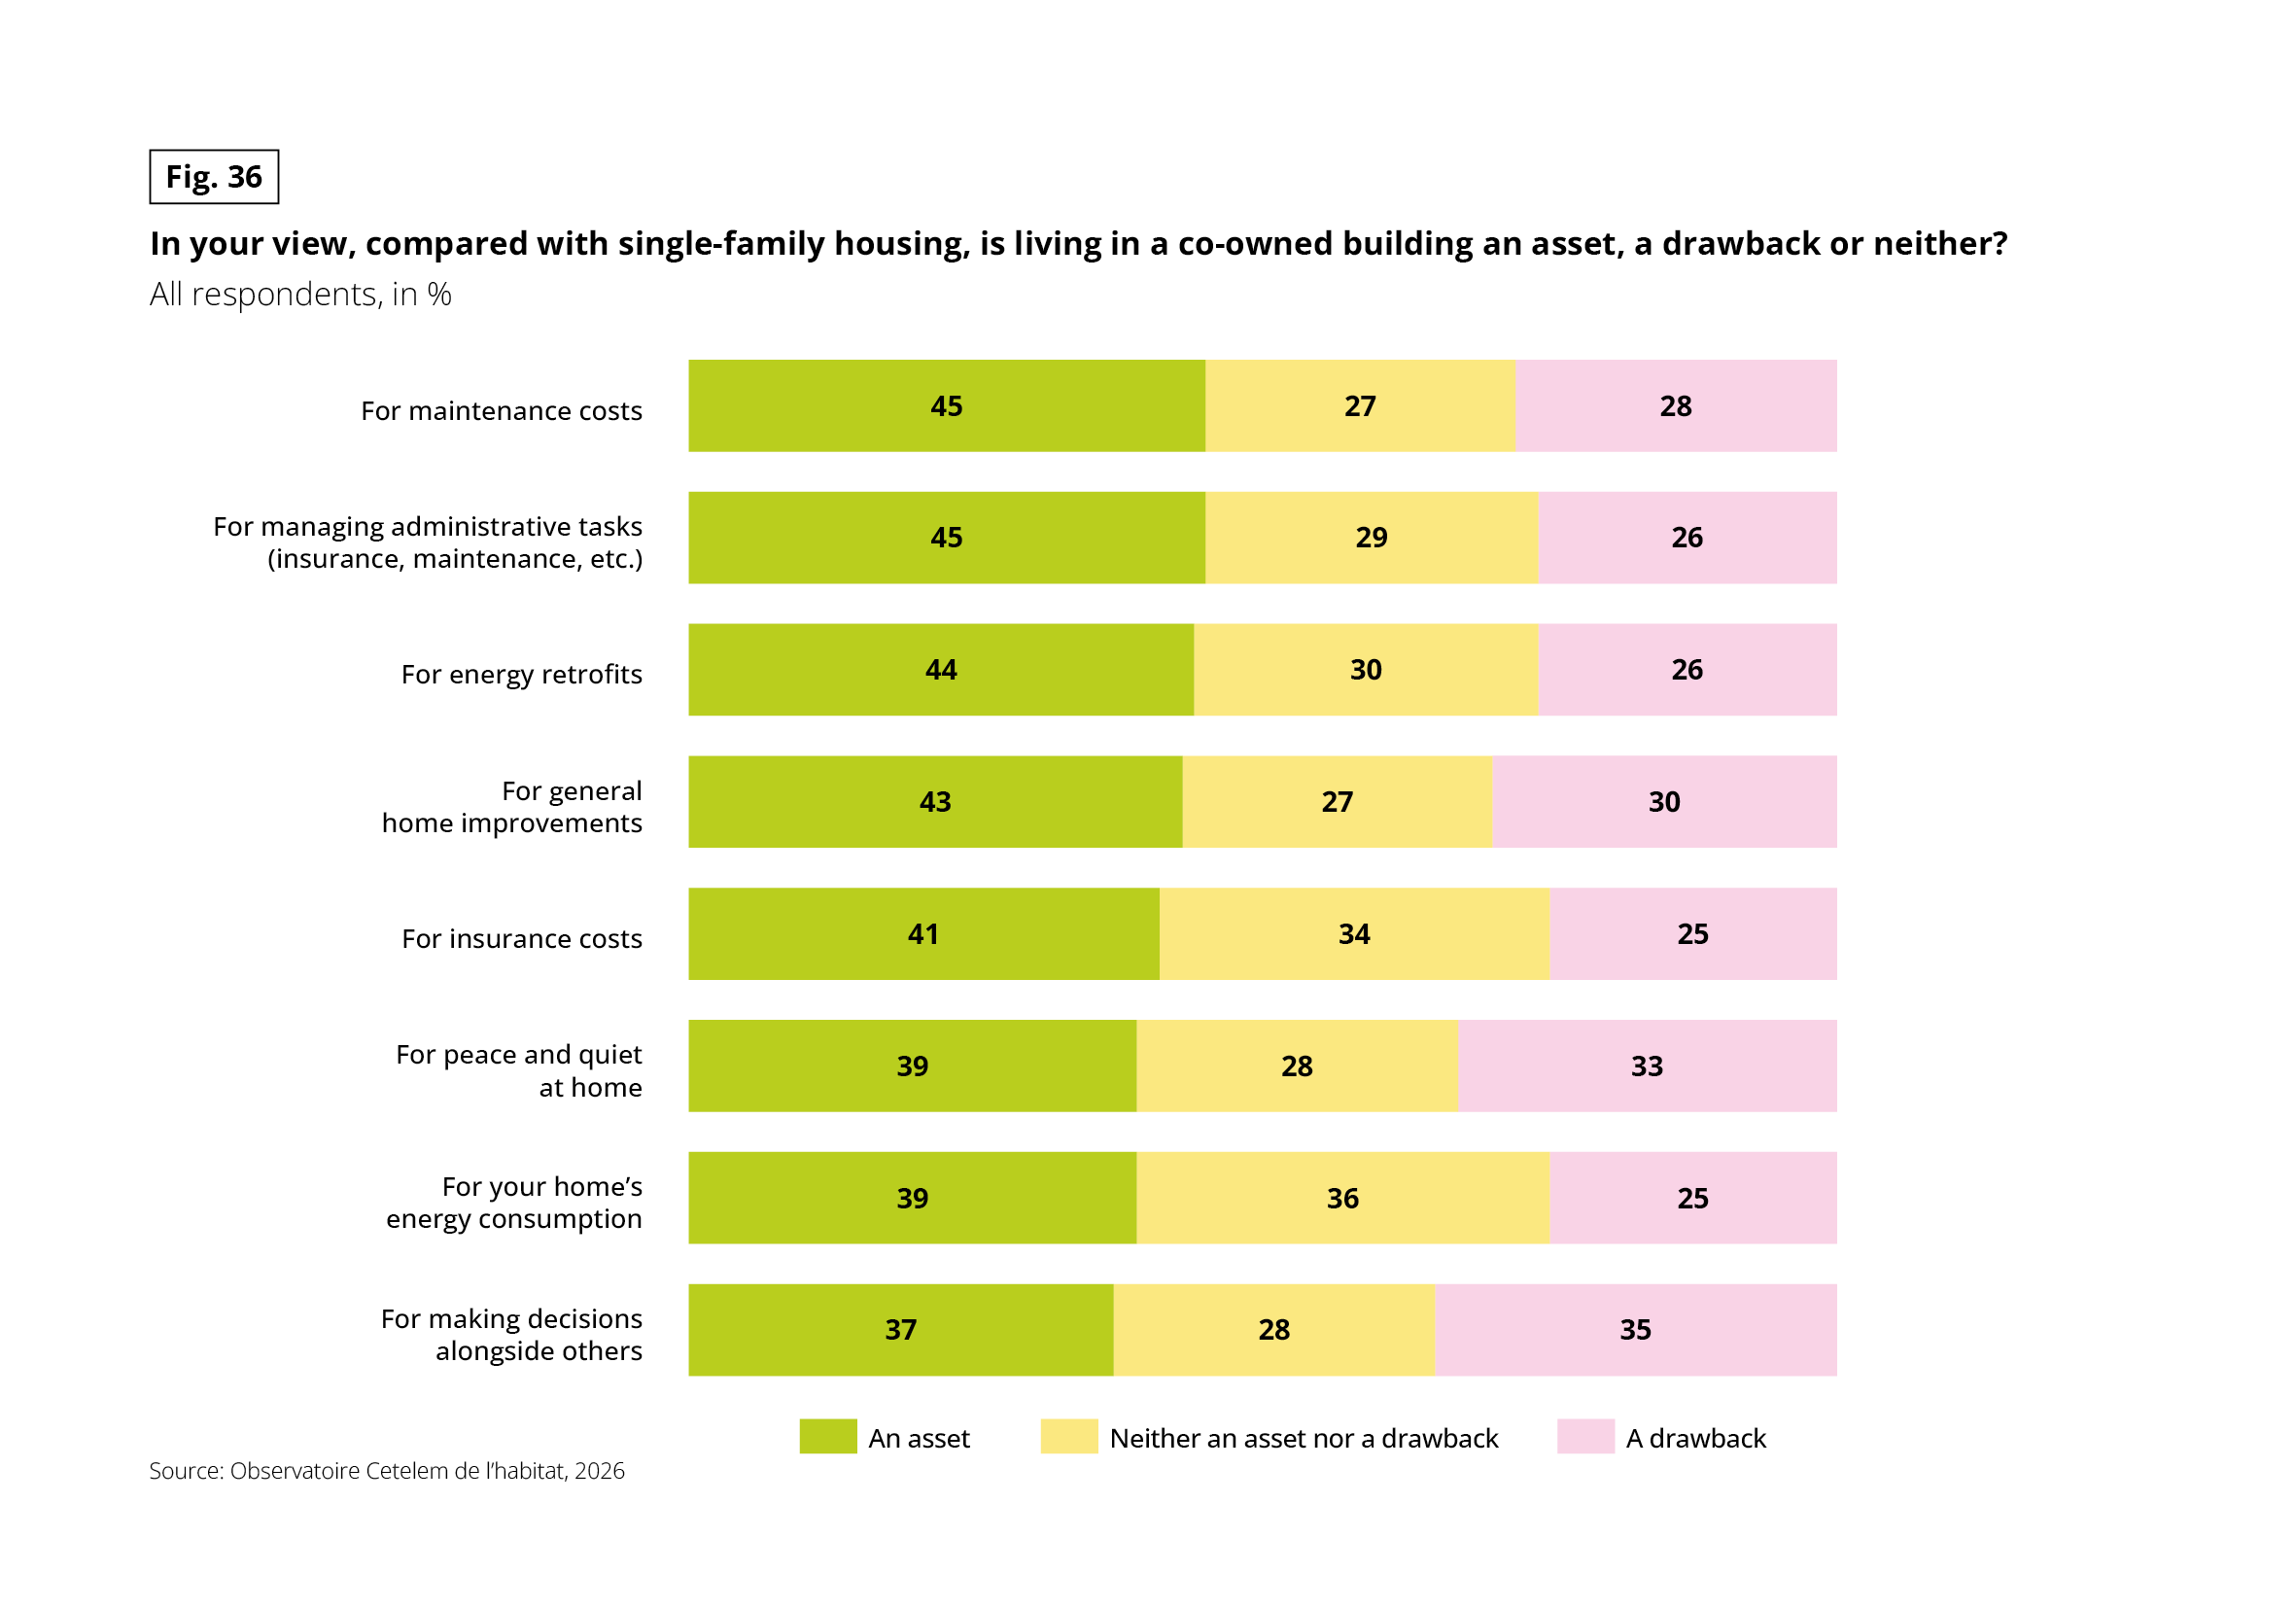 Stacked horizontal bar chart. Question: “In your view, compared with single-family housing, is living in a co-owned building an asset, a drawback or neither?” Base: all respondents, in %. Three answers per item. Source: Observatoire Cetelem de l’habitat, 2026.
Data in the form an asset / neither an asset nor a drawback / a drawback:
• For maintenance costs: 45 / 27 / 28
• For managing administrative tasks (insurance, maintenance, etc.): 45 / 29 / 26
• For energy retrofits: 44 / 30 / 26
• For general home improvements: 43 / 27 / 30
• For insurance costs: 41 / 34 / 25
• For peace and quiet at home: 39 / 28 / 33
• For your home’s energy consumption: 39 / 36 / 25
• For making decisions alongside others: 37 / 28 / 35
An asset is the most frequent answer on every item. Making decisions with others (35%) and peace and quiet (33%) have the highest shares of “a drawback”, and the lowest margins in favour of co-ownership.
KEEPING A SAY REMAINS A PRIORITY FOR MOST EUROPEANS
If the principle of joint decision-making raises a degree of hesitation, it is also because Europeans want to retain a decisive voice in matters that directly affect them. Asked who should hold decision-making authority—individuals themselves or public authorities (prefectures, municipalities or state agencies)—a clear majority of Europeans lean towards individual choice. This preference commands around 65% support for energy matters and 63% for housing decisions. The desire for individual agency strengthens with age, rising from younger cohorts, who are more willing to delegate (around half), to senior citizens, who are far more intent on making their voices heard (exceeding 70%). Crucially, a slight North–South gradient emerges across the continent. Mediterranean nations appear somewhat more open to letting public authorities decide: Italy, Spain and Portugal report the lowest preference for individual choice in housing, at around 60%. Conversely, Northern and Western Europe remain more committed to individual expression, stretching from the UK and Belgium to Germany and Poland, where support reaches 66% to 68%. France aligns closely with the European average.
Fig. 37 – Individual say or decisions by public authorities, on energy and housing
Download this infographic for your presentations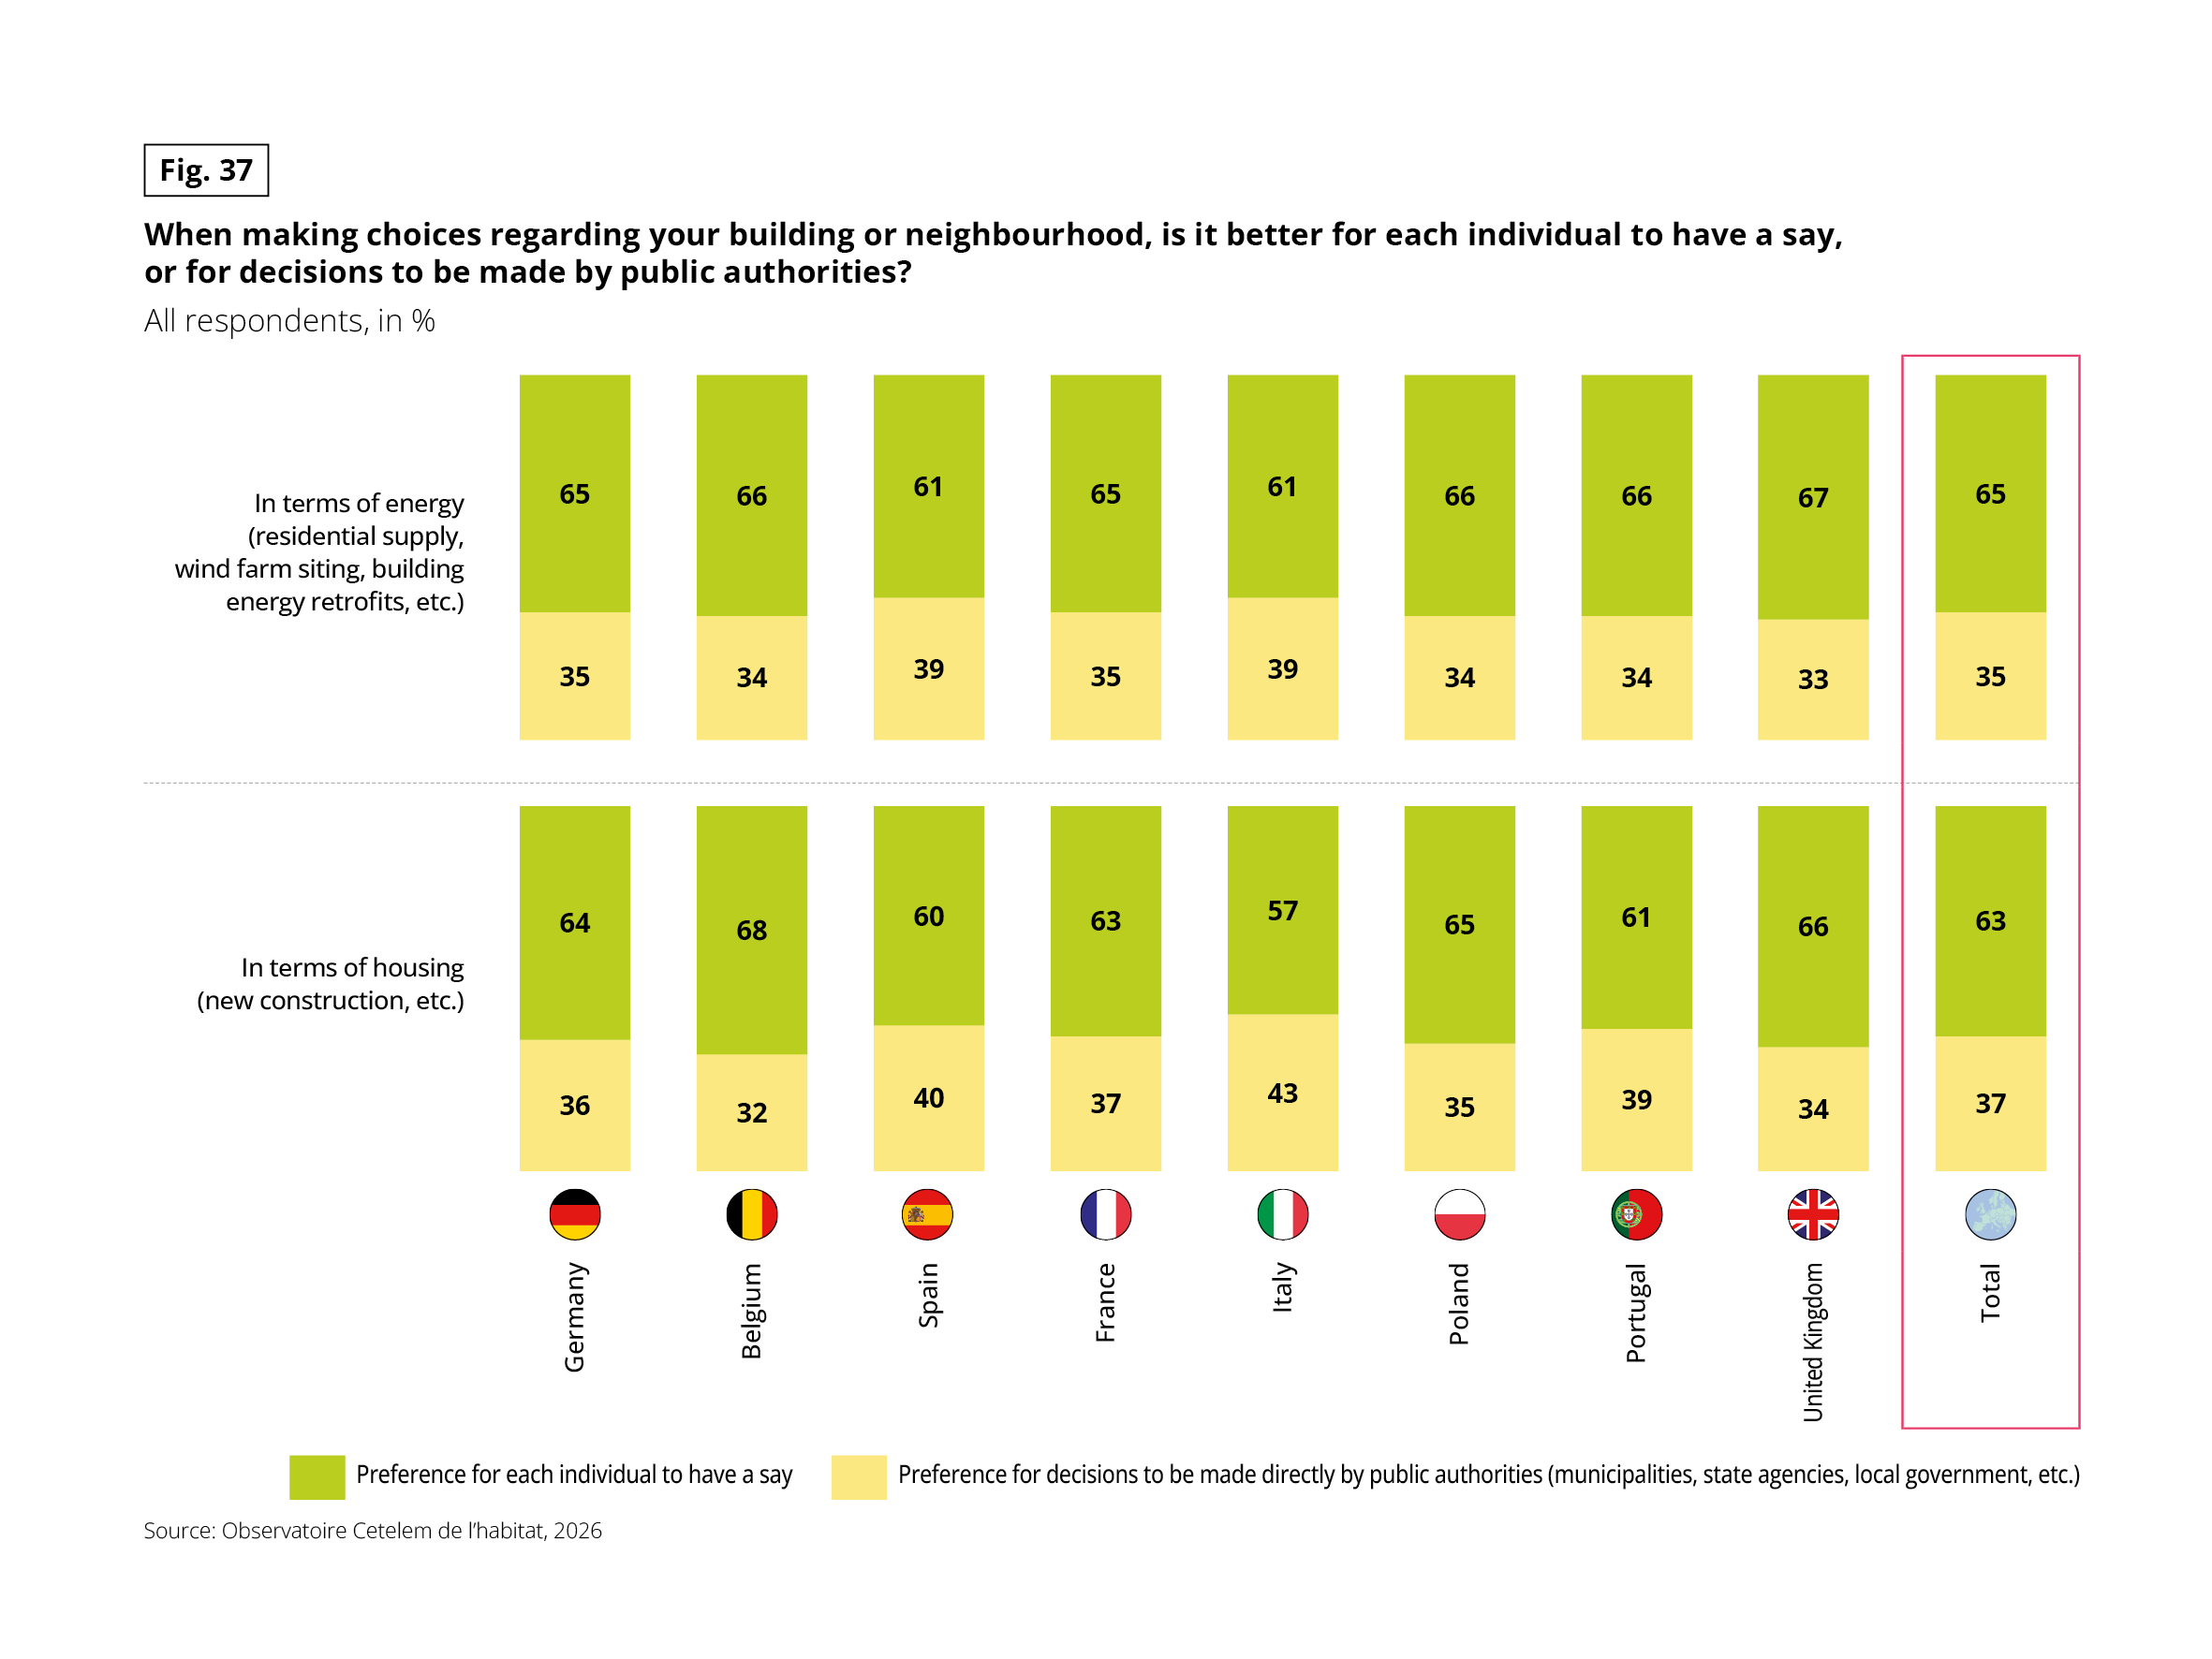 Stacked vertical bar chart, in two blocks. Question: “When making choices regarding your building or neighbourhood, is it better for each individual to have a say, or for decisions to be made by public authorities?” Base: all respondents, in %. Two answers: preference for each individual to have a say, and preference for decisions made directly by public authorities (municipalities, state agencies, local government, etc.). Source: Observatoire Cetelem de l’habitat, 2026.
Data in the form individual say / public authorities.
In terms of energy (residential supply, wind farm siting, building energy retrofits, etc.):
• Germany: 65 / 35
• Belgium: 66 / 34
• Spain: 61 / 39
• France: 65 / 35
• Italy: 61 / 39
• Poland: 66 / 34
• Portugal: 66 / 34
• United Kingdom: 67 / 33
• Total: 65 / 35
In terms of housing (new construction, etc.):
• Germany: 64 / 36
• Belgium: 68 / 32
• Spain: 60 / 40
• France: 63 / 37
• Italy: 57 / 43
• Poland: 65 / 35
• Portugal: 61 / 39
• United Kingdom: 66 / 34
• Total: 63 / 37
About two thirds of respondents want individuals to have a say. Italy and Spain have the highest preference for public authorities. Italy reaches 43% on housing.
This North–South divide coincides with the broader geography of co-ownership: in Southern Europe, where nearly half of all households live in co-owned buildings, compared with a fifth to a third in the North-West, delegating authority appears to come more naturally.
This reading remains an interpretation, however: the survey measures a preference, not its underlying causes.
Fig. 38 – Estimated share of co-owner households, 2012 and 2025
Download this infographic for your presentations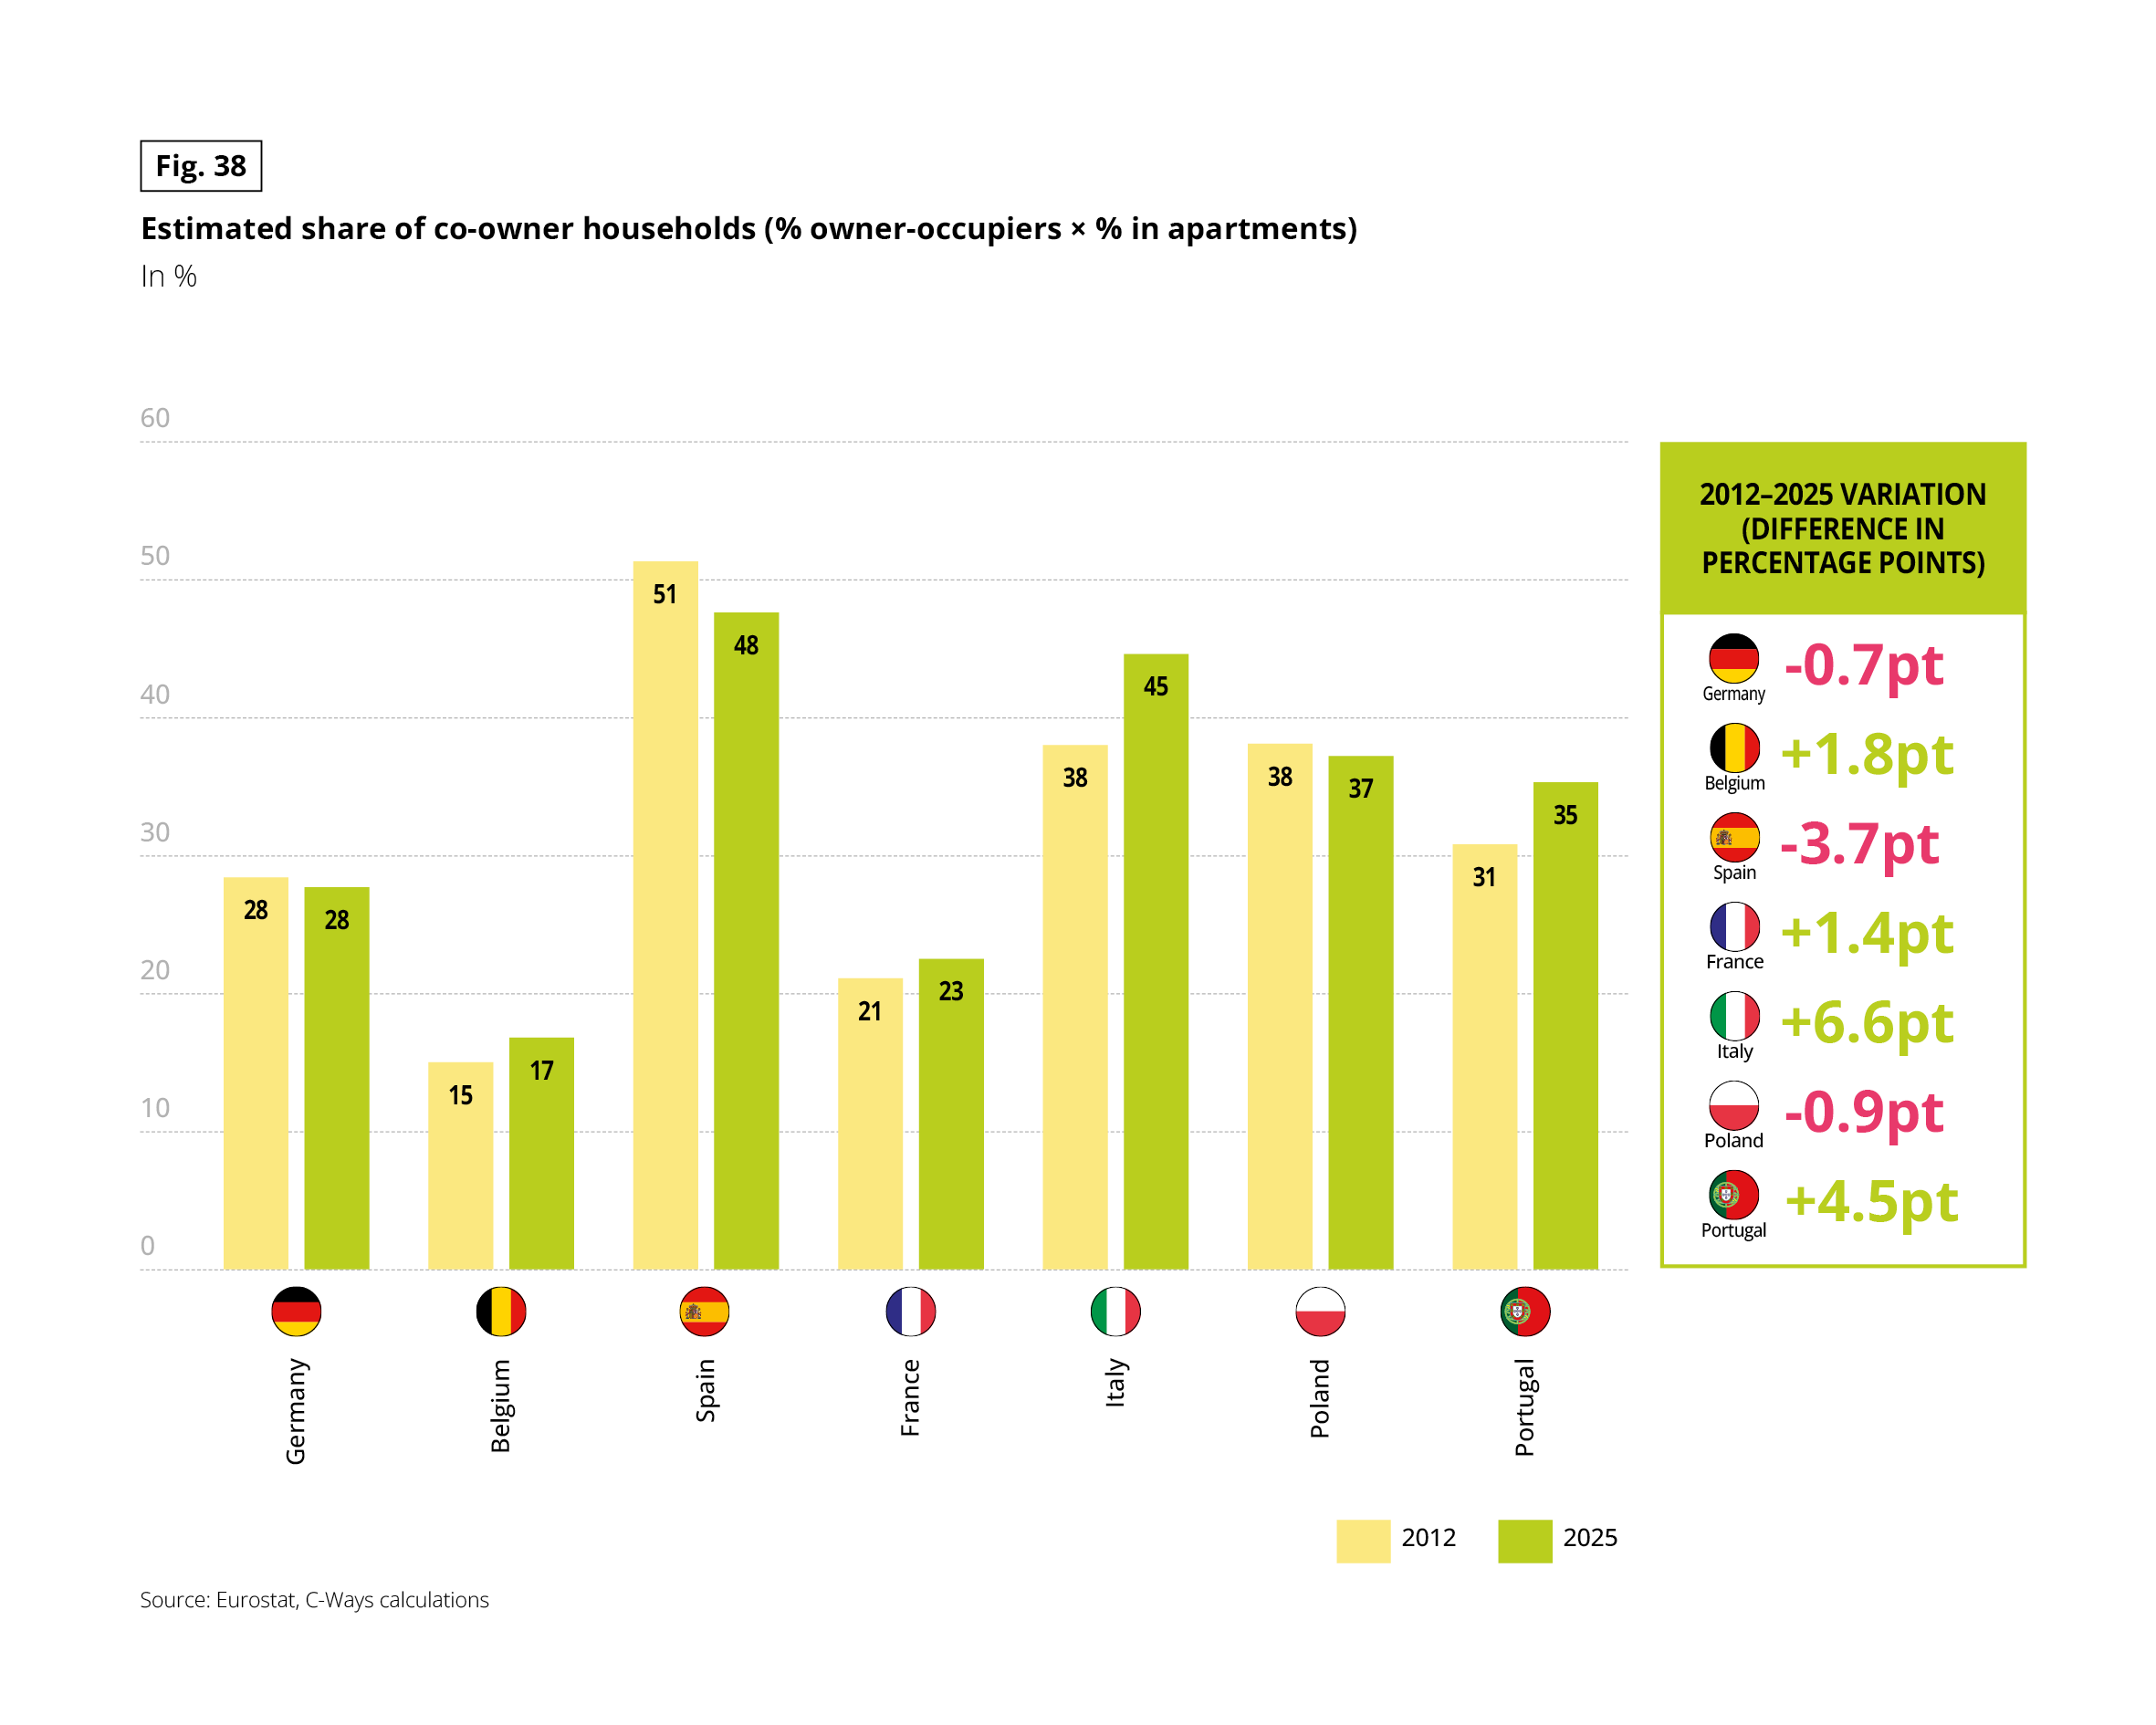 Grouped vertical bar chart. Measure: estimated share of co-owner households, calculated as the percentage of owner-occupiers multiplied by the percentage living in apartments. Unit: %. Two series, 2012 and 2025, with a box giving the 2012–2025 change in percentage points. Source: Eurostat, C-Ways calculations.
Data in the form 2012 / 2025 (change):
• Germany: 28 / 28 (−0.7 pt)
• Belgium: 15 / 17 (+1.8 pt)
• Spain: 51 / 48 (−3.7 pt)
• France: 21 / 23 (+1.4 pt)
• Italy: 38 / 45 (+6.6 pt)
• Poland: 38 / 37 (−0.9 pt)
• Portugal: 31 / 35 (+4.5 pt)
Spain and Italy have the highest shares in 2025. Italy shows the largest increase and Spain the largest decrease. Belgium has the lowest share.
This strikes at the central tension of co-ownership: everyone wants a say, but no one enjoys negotiating to get it.
OVERALL SUPPORT FOR COLLECTIVE DECISIONS REMAINS HIGH
The real test is whether decisions, once made, win broad buy-in. On the whole, they clearly do: roughly three quarters of respondents say they agree with the choices made where they live, regarding both housing policy and energy strategy. Here again, co-owners show higher levels of approval than tenants, a clear sign that active participation in decision-making fosters acceptance of the outcome.
Cross-country variations remain minor, yet they map a clear geography of trust in collective decision-making. Portugal and Poland display the strongest endorsement, reaching 77% in Poland for housing decisions, whereas Germany appears somewhat more reserved. The overall picture is thus one of a European who endorses the collective principle and generally accepts its decisions, yet remains reluctant to delegate their own voice. The central challenge therefore lies in the transition from principle to practice: in the lived experience of co-ownership.
Fig. 39 – Agreement with decisions made where respondents live, on energy and housing policy
Download this infographic for your presentations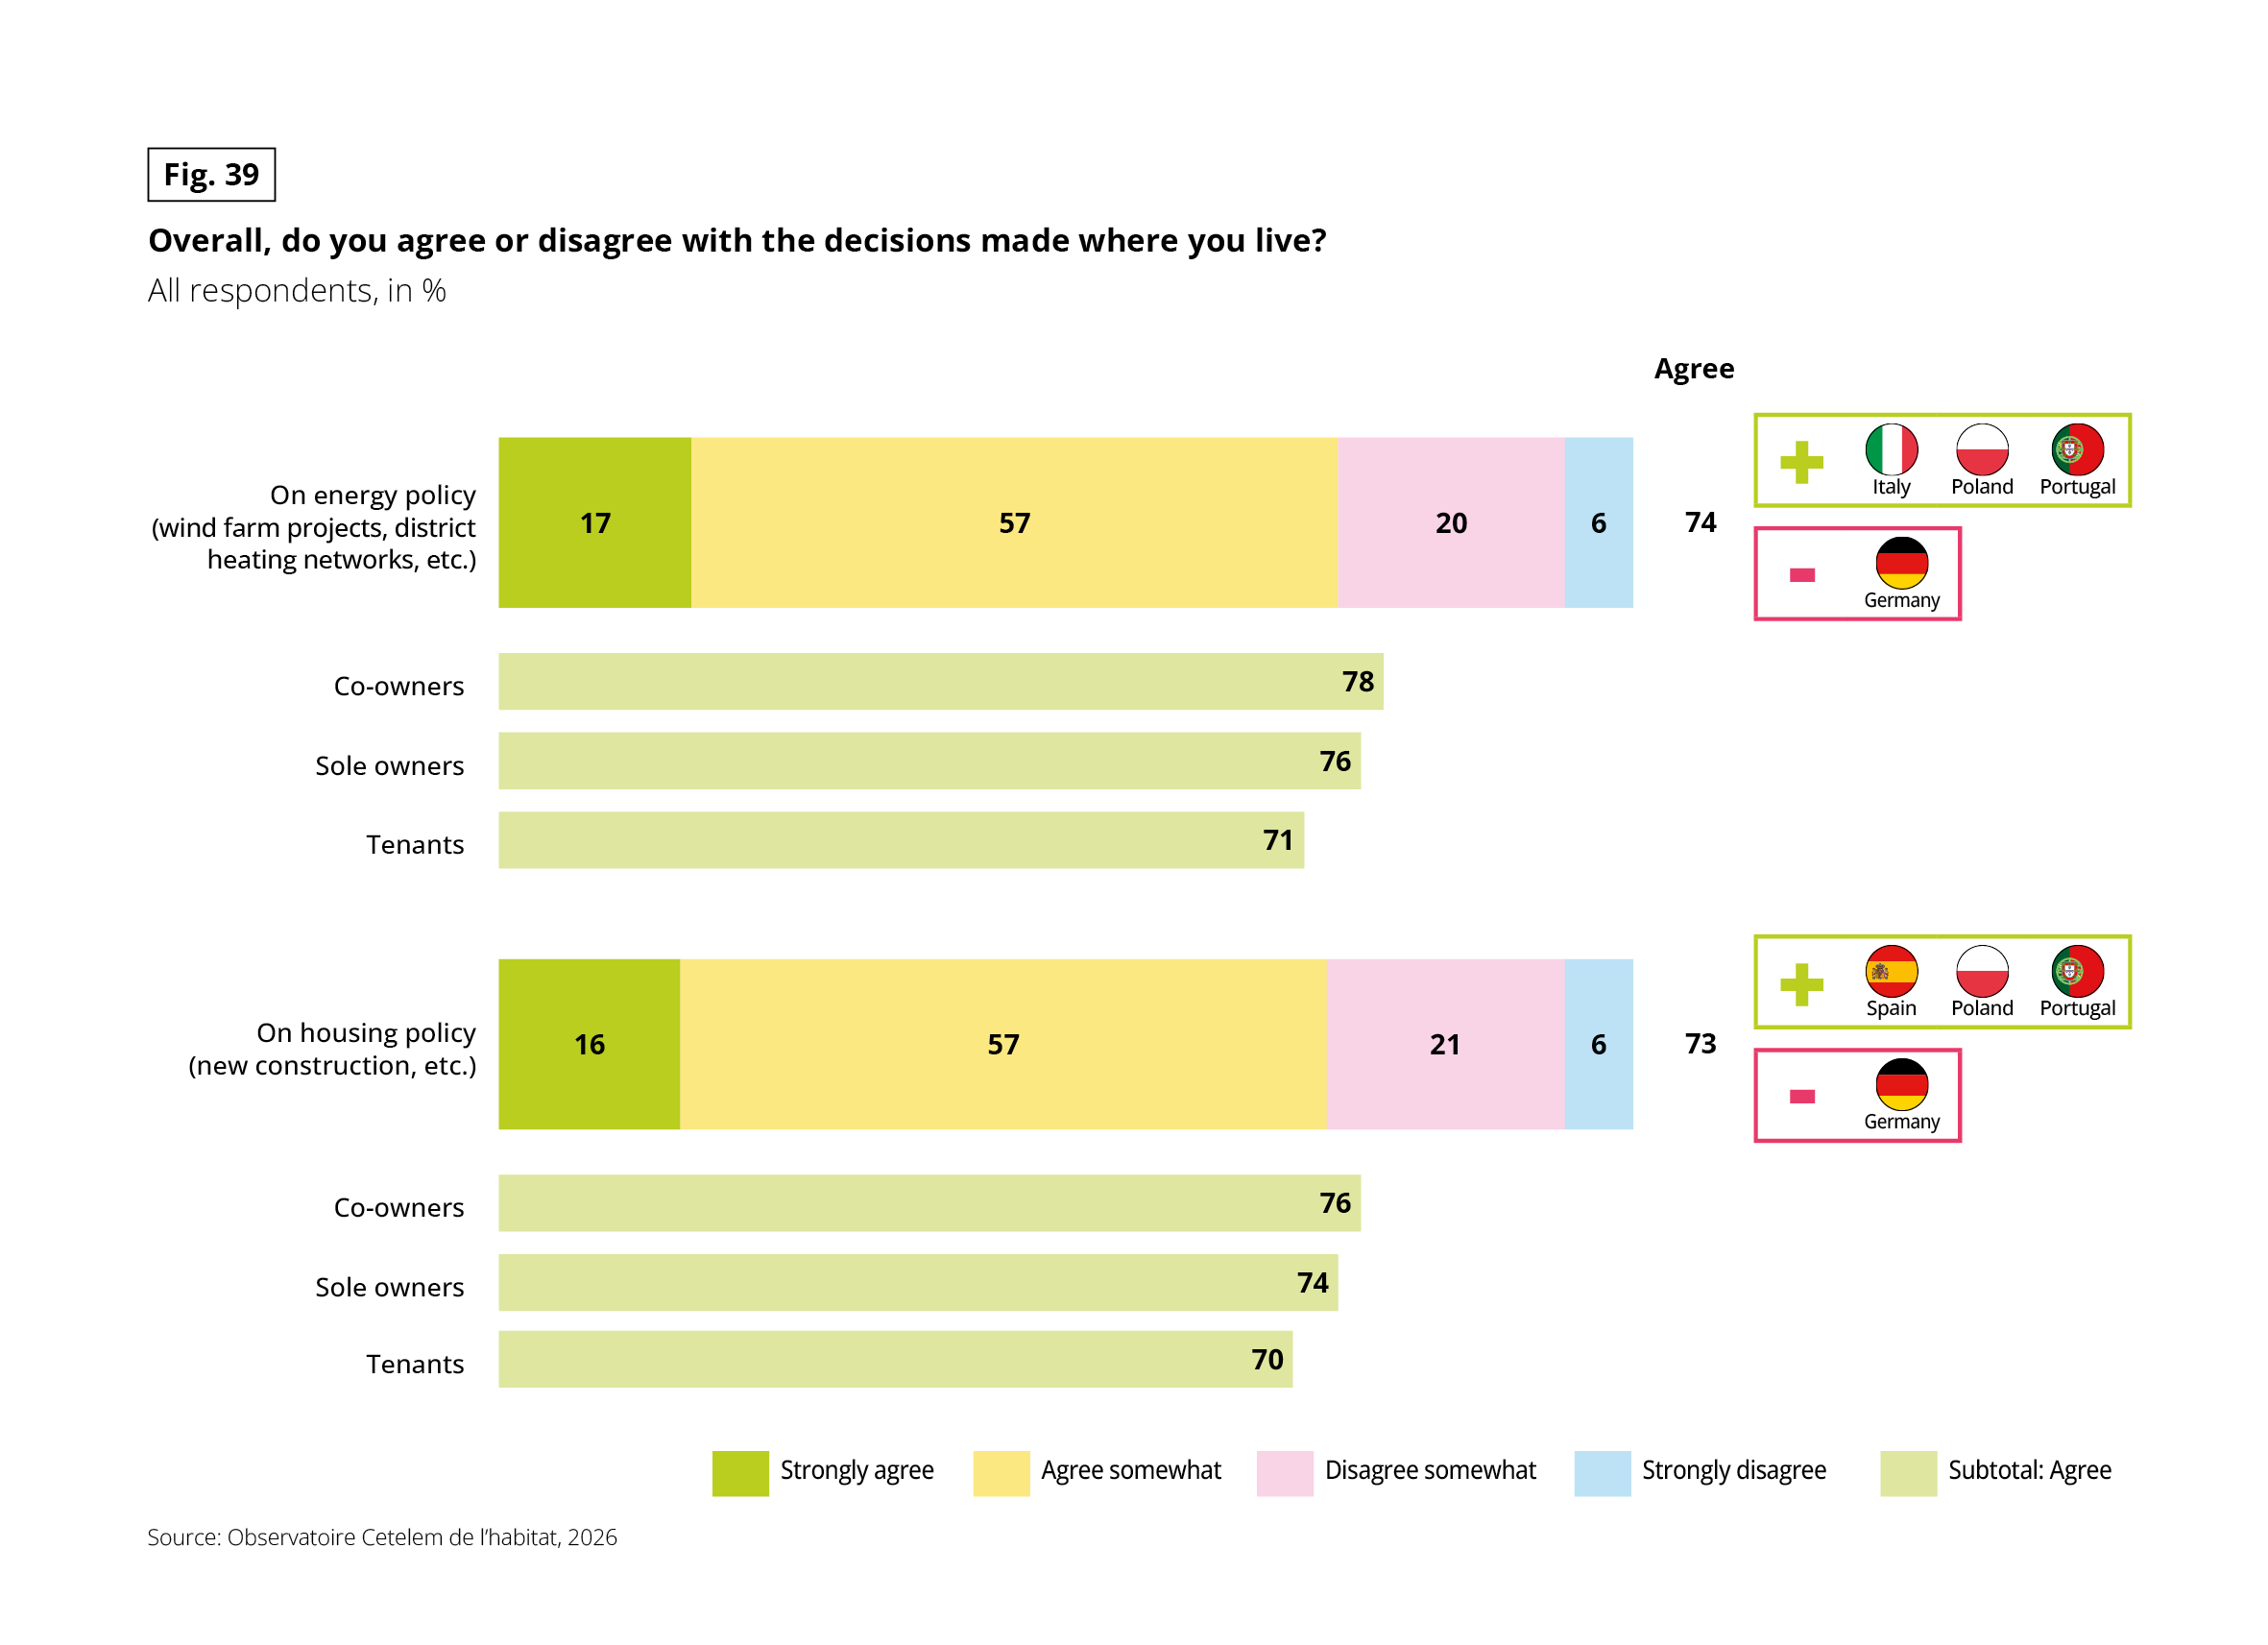 Stacked horizontal bars with subgroup bars. Question: “Overall, do you agree or disagree with the decisions made where you live?” Base: all respondents, in %. Four answers: strongly agree, agree somewhat, disagree somewhat, strongly disagree. The subtotal “Agree” is shown to the right. Boxes list the countries above and below the total (marked + and −). Source: Observatoire Cetelem de l’habitat, 2026.
On energy policy (wind farm projects, district heating networks, etc.): strongly agree 17%, agree somewhat 57%, disagree somewhat 20%, strongly disagree 6%. Subtotal agree: 74%. Subtotal agree by tenure: co-owners 78%, sole owners 76%, tenants 71%. Countries above the total: Italy, Poland, Portugal. Country below the total: Germany.
On housing policy (new construction, etc.): strongly agree 16%, agree somewhat 57%, disagree somewhat 21%, strongly disagree 6%. Subtotal agree: 73%. Subtotal agree by tenure: co-owners 76%, sole owners 74%, tenants 70%. Countries above the total: Spain, Poland, Portugal. Country below the total: Germany.
Co-owners agree most and tenants least on both topics. Germany is below the total on both.