Price, first and foremost

Too much is too much
However, although cars may be popular, they are also, above all, considered too expensive. Here again, opinions are almost unanimous. On average, 9 out of 10 people say that new car prices are too high.
If China once again stands out, it is for expressing an opinion directly opposed to that of all the other countries in the study. Just over half of residents think that cars are too expensive. Neighbouring Asian country Japan also expresses a slightly more moderate opinion than the other nations as a whole (83%).
Fig 10 – Perceived level of new car prices
Download this infographic for your presentations The chart shows the percentage of respondents who consider the average price of new cars as very high or fairly high.
Germany: 92%.
Belgium: 92%.
China: 55%.
Spain: 93%.
United States: 90%.
France: 94%.
Italy: 95%.
Japan: 83%.
Netherlands: 92%.
Poland: 91%.
Portugal: 93%.
United Kingdom: 93%.
Turkey: 95%.
Europe total: 93%.
Total all countries: 89%.
Source: Observatoire Cetelem de l’Automobile 2026.
The chart shows the percentage of respondents who consider the average price of new cars as very high or fairly high.
Germany: 92%.
Belgium: 92%.
China: 55%.
Spain: 93%.
United States: 90%.
France: 94%.
Italy: 95%.
Japan: 83%.
Netherlands: 92%.
Poland: 91%.
Portugal: 93%.
United Kingdom: 93%.
Turkey: 95%.
Europe total: 93%.
Total all countries: 89%.
Source: Observatoire Cetelem de l’Automobile 2026.
Increases are noticeable…
This perception of high prices is reinforced by the impression that car prices have done nothing but increase recently. 84% of those questioned were somewhat or totally convinced of the fact, particularly the Turks, Italians and Portuguese (94%, 92% and 92%). What about China? Only half of Chinese people think that prices have risen in recent years. Seniors are more likely to point out this price increase than younger people, as are people living in rural areas compared to those in large towns or cities.
These two categories, which often share common opinions, as observed in this study, are particularly sensitive to this increase because of the over-representation of seniors in rural areas. People on higher incomes are also more likely to notice this rise in prices. Is this a paradox? Perhaps not, when you look at the changes in price lists for top-of-the-range cars in recent years, and when you realise that these social categories are the ones who change vehicles most often, and are therefore often in a good position to notice price increases.
Fig 11 – Perceived increase in new car prices
Download this infographic for your presentations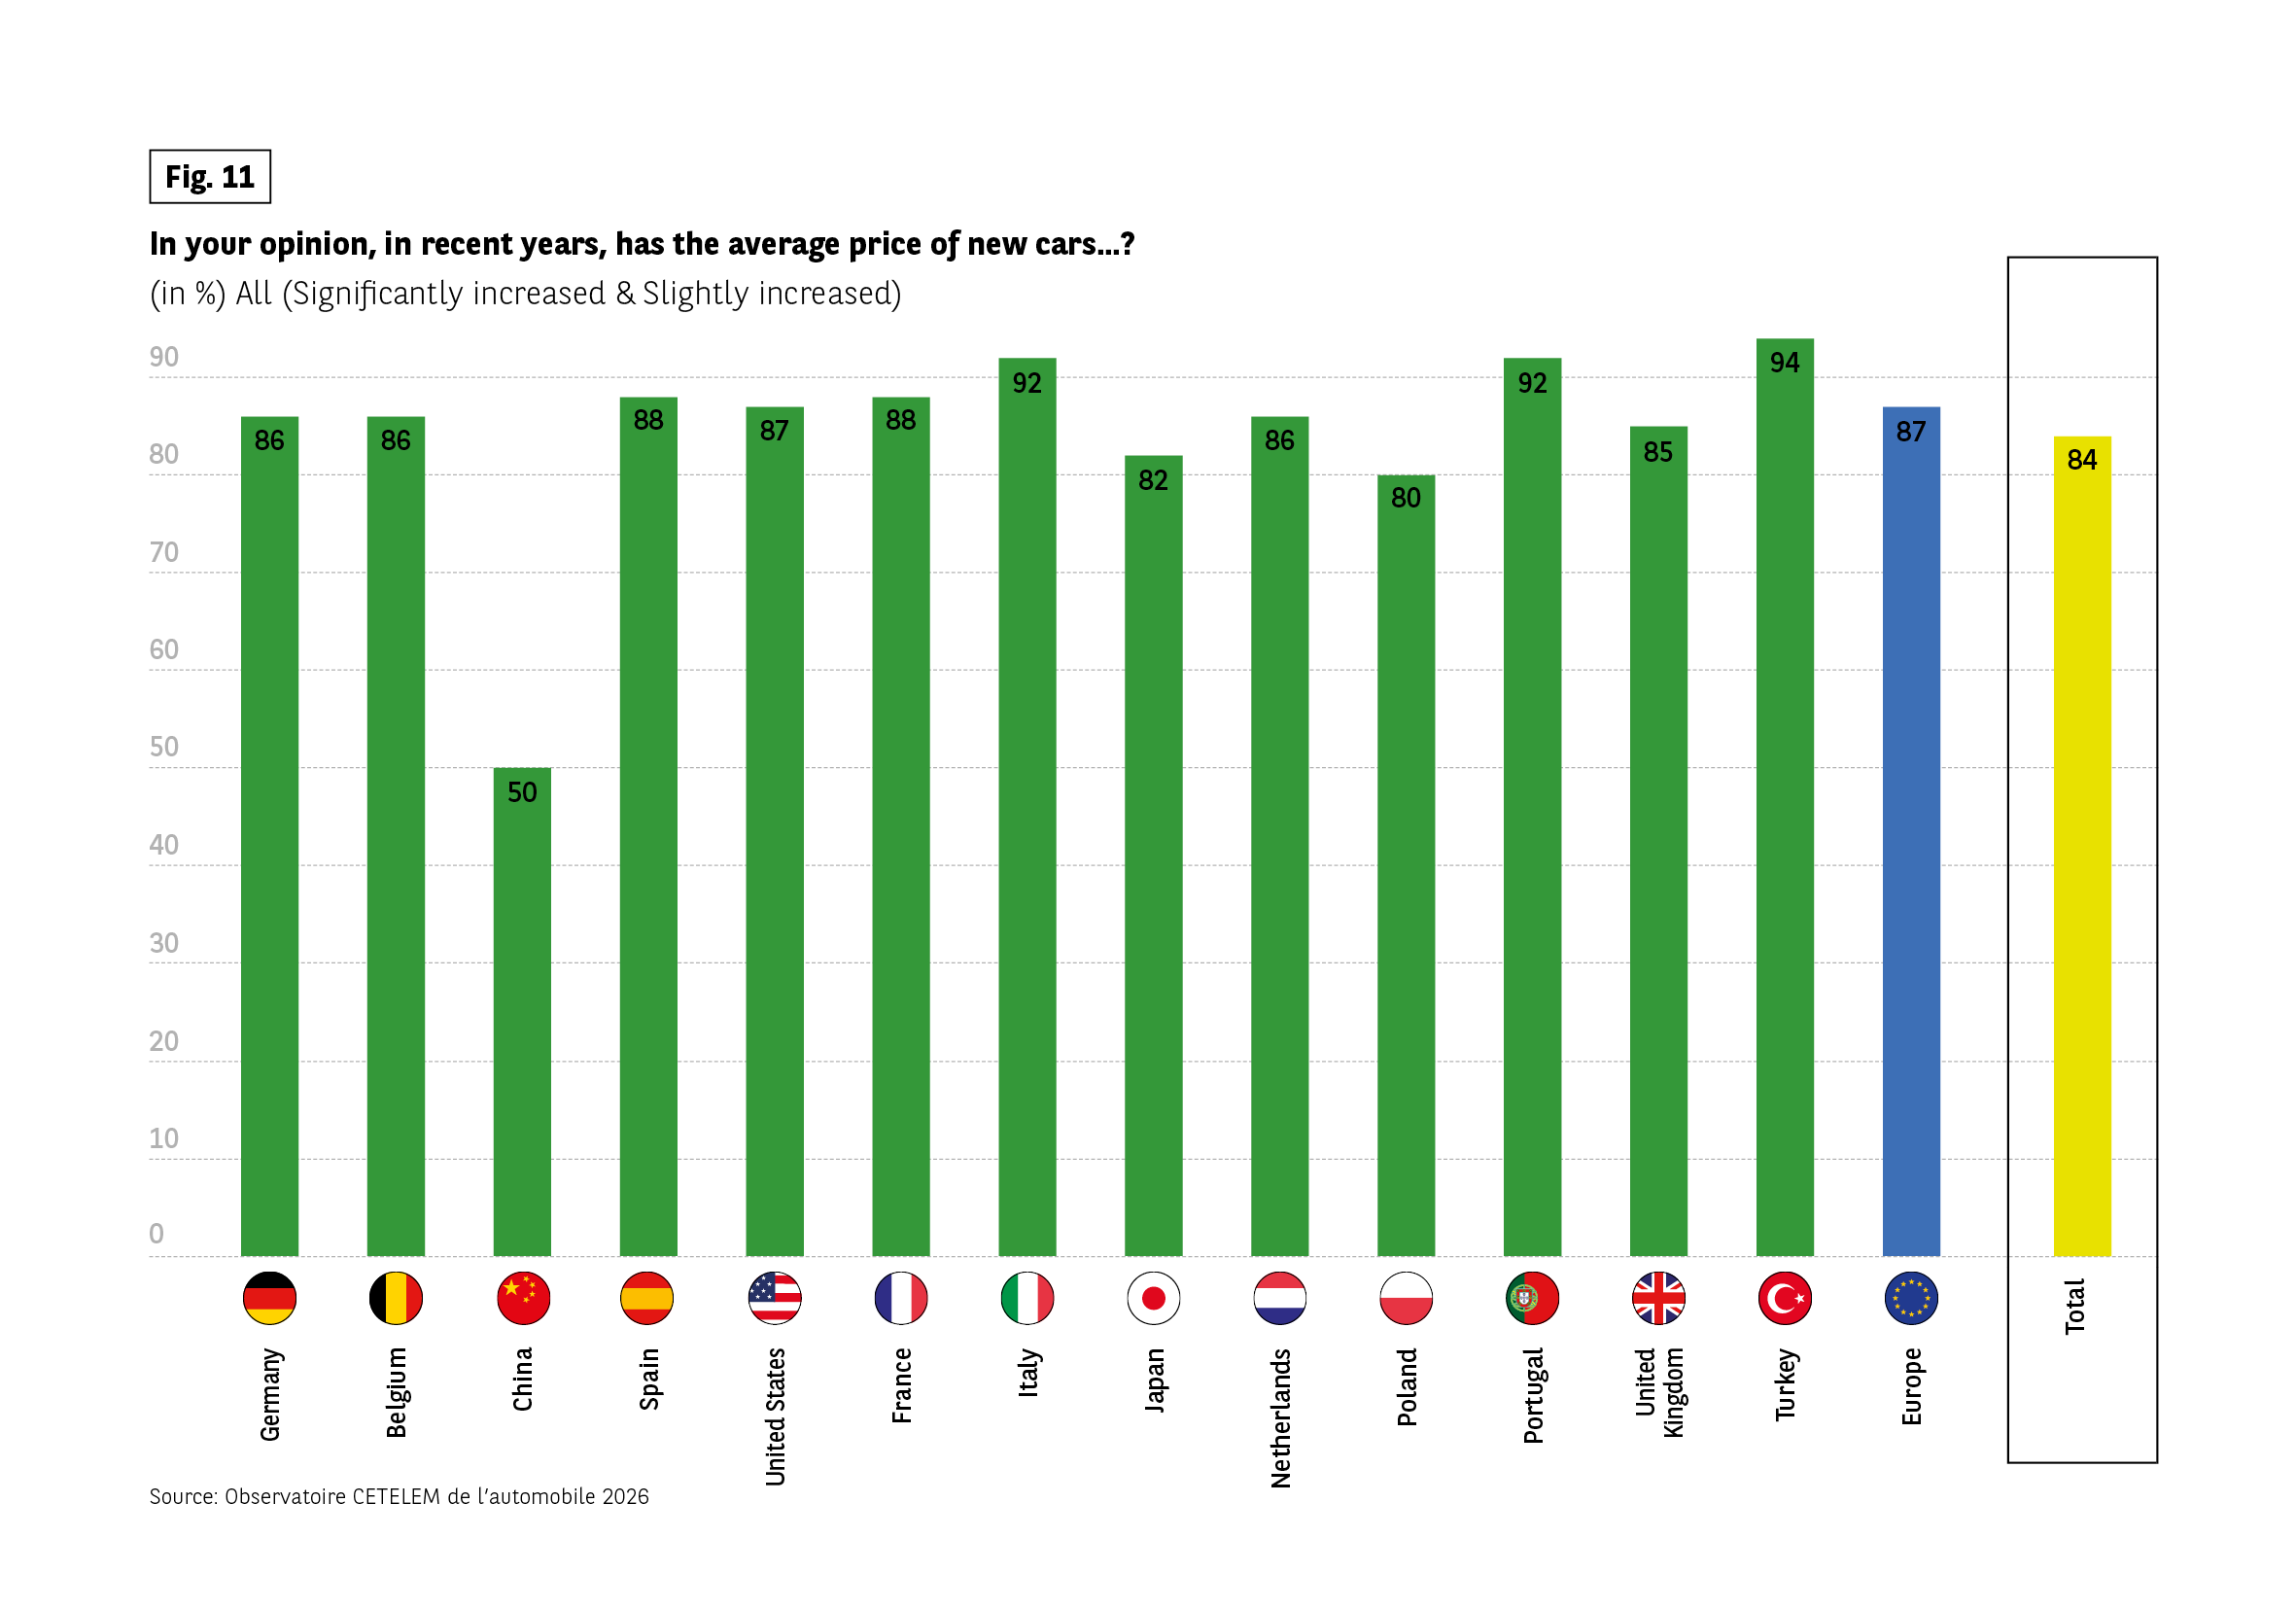 The chart shows the percentage of respondents who think that the average price of new cars has increased significantly or slightly.
Germany: 86%
Belgium: 86%
China: 50%
Spain: 88%
United States: 87%
France: 88%
Italy: 92%
Japan: 82%
Netherlands: 86%
Poland: 80%
Portugal: 92%
United Kingdom: 85%
Turkey: 94%
Europe total: 87%
Total all countries: 84%
Source: Observatoire Cetelem de l’Automobile 2026.
The chart shows the percentage of respondents who think that the average price of new cars has increased significantly or slightly.
Germany: 86%
Belgium: 86%
China: 50%
Spain: 88%
United States: 87%
France: 88%
Italy: 92%
Japan: 82%
Netherlands: 86%
Poland: 80%
Portugal: 92%
United Kingdom: 85%
Turkey: 94%
Europe total: 87%
Total all countries: 84%
Source: Observatoire Cetelem de l’Automobile 2026.
… and unjustified
For 6 out of 10 motorists, there is no justification for these increases, except in Poland and especially in China, the two countries where a majority approve (57% and 82%). They are particularly frowned upon in many European countries, especially France and Italy (71%). The under-30s stand out from all the other categories in this study in that the majority consider this price increase to be legitimate.
Fig 12 – Justification of rising new car prices
Download this infographic for your presentations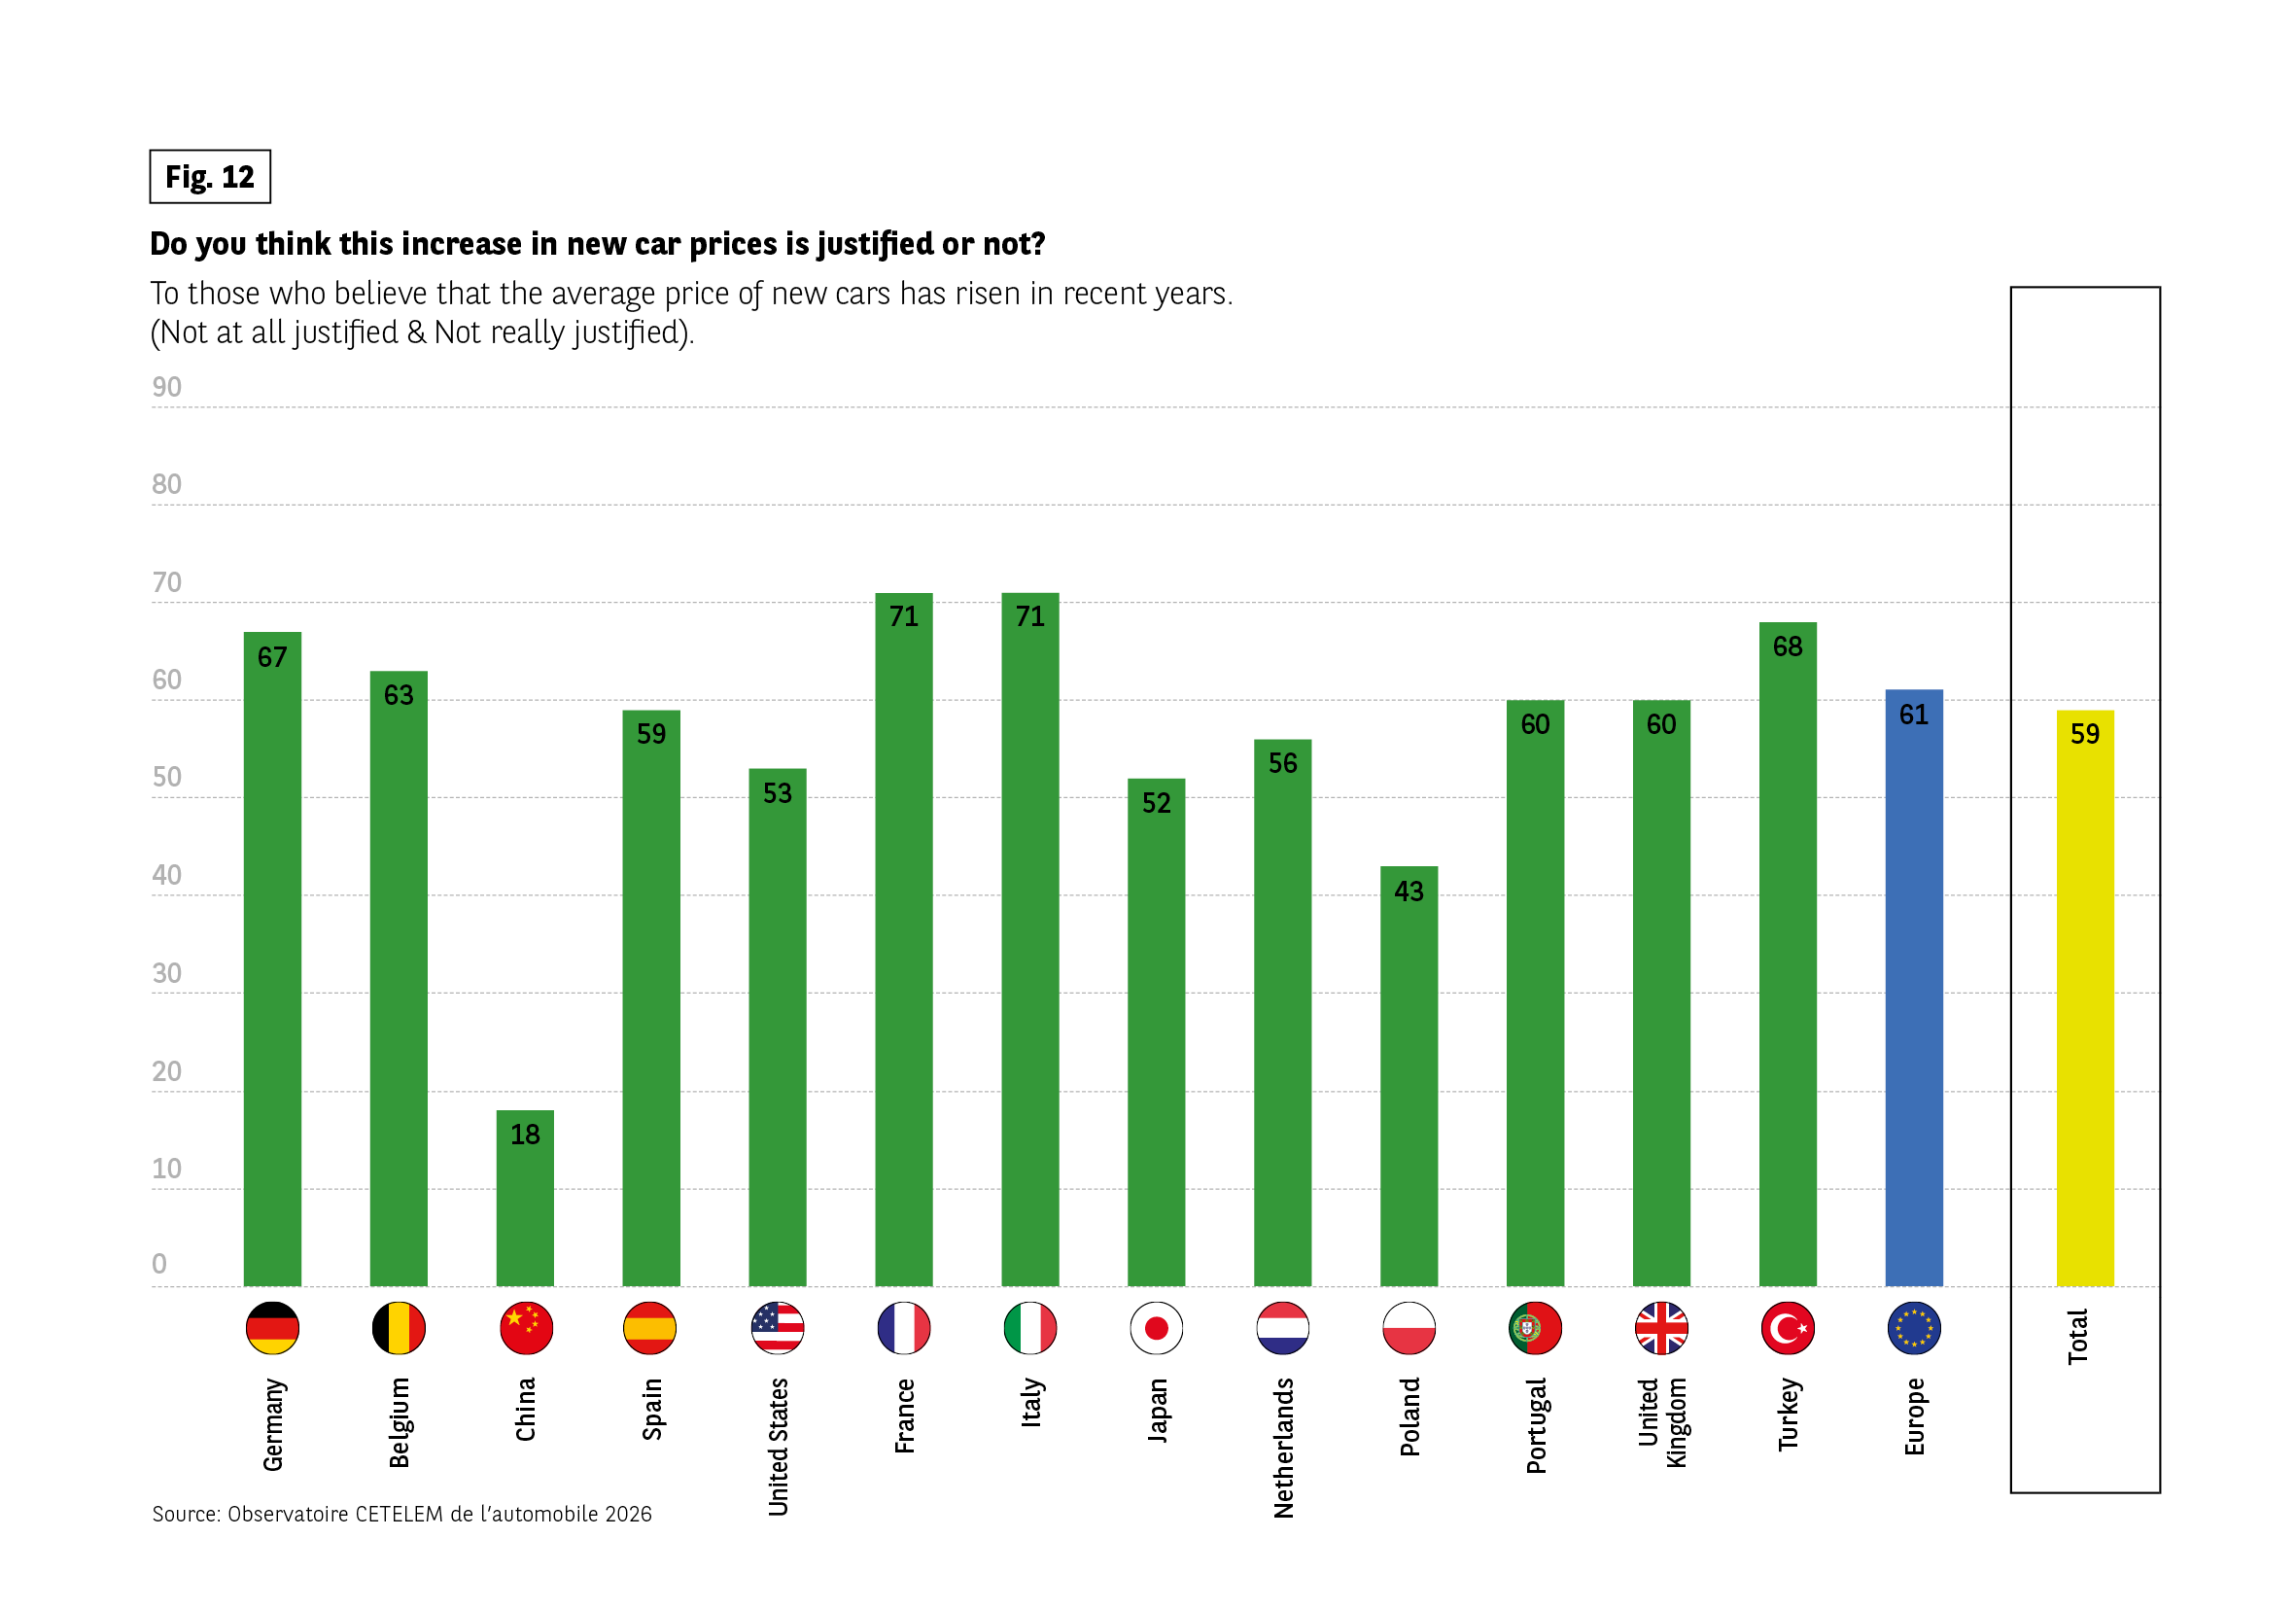 The chart shows the percentage of respondents who believe the recent increase in new car prices is not at all justified or not really justified.
Germany: 67%
Belgium: 63%
China: 18%
Spain: 59%
United States: 53%
France: 71%
Italy: 71%
Japan: 52%
Netherlands: 56%
Poland: 43%
Portugal: 60%
United Kingdom: 60%
Turkey: 68%
Europe total: 61%
Total all countries: 59%
Source: Observatoire Cetelem de l’Automobile 2026.
The chart shows the percentage of respondents who believe the recent increase in new car prices is not at all justified or not really justified.
Germany: 67%
Belgium: 63%
China: 18%
Spain: 59%
United States: 53%
France: 71%
Italy: 71%
Japan: 52%
Netherlands: 56%
Poland: 43%
Portugal: 60%
United Kingdom: 60%
Turkey: 68%
Europe total: 61%
Total all countries: 59%
Source: Observatoire Cetelem de l’Automobile 2026.
Good value for money still appreciated
New cars that are too expensive, whose price has risen in recent years, and yet…
And yet, motorists are lowering the level of their complaints and raising the level of their satisfaction with vehicles’ value for money. 6 out of 10 consider it to be good, which implicitly highlights the fact that the overall technological development of cars has been taken into account and that there has been a real improvement in quality. A group of four countries stands out for its value for money, with China and Turkey once again in the lead, followed by the United States and Japan.
When looking at Europe, we encounter much more balanced points of view. France and Germany are united in being the most sceptical, with only 49% in favour, the only below- average score. An encouraging sign for manufacturers in their efforts to retain customers is that younger people are more likely to praise cars’ good value for money than older people. High-income earners and city dwellers are on the same wavelength.
Fig 13 – Perceived value for money of new cars
Download this infographic for your presentations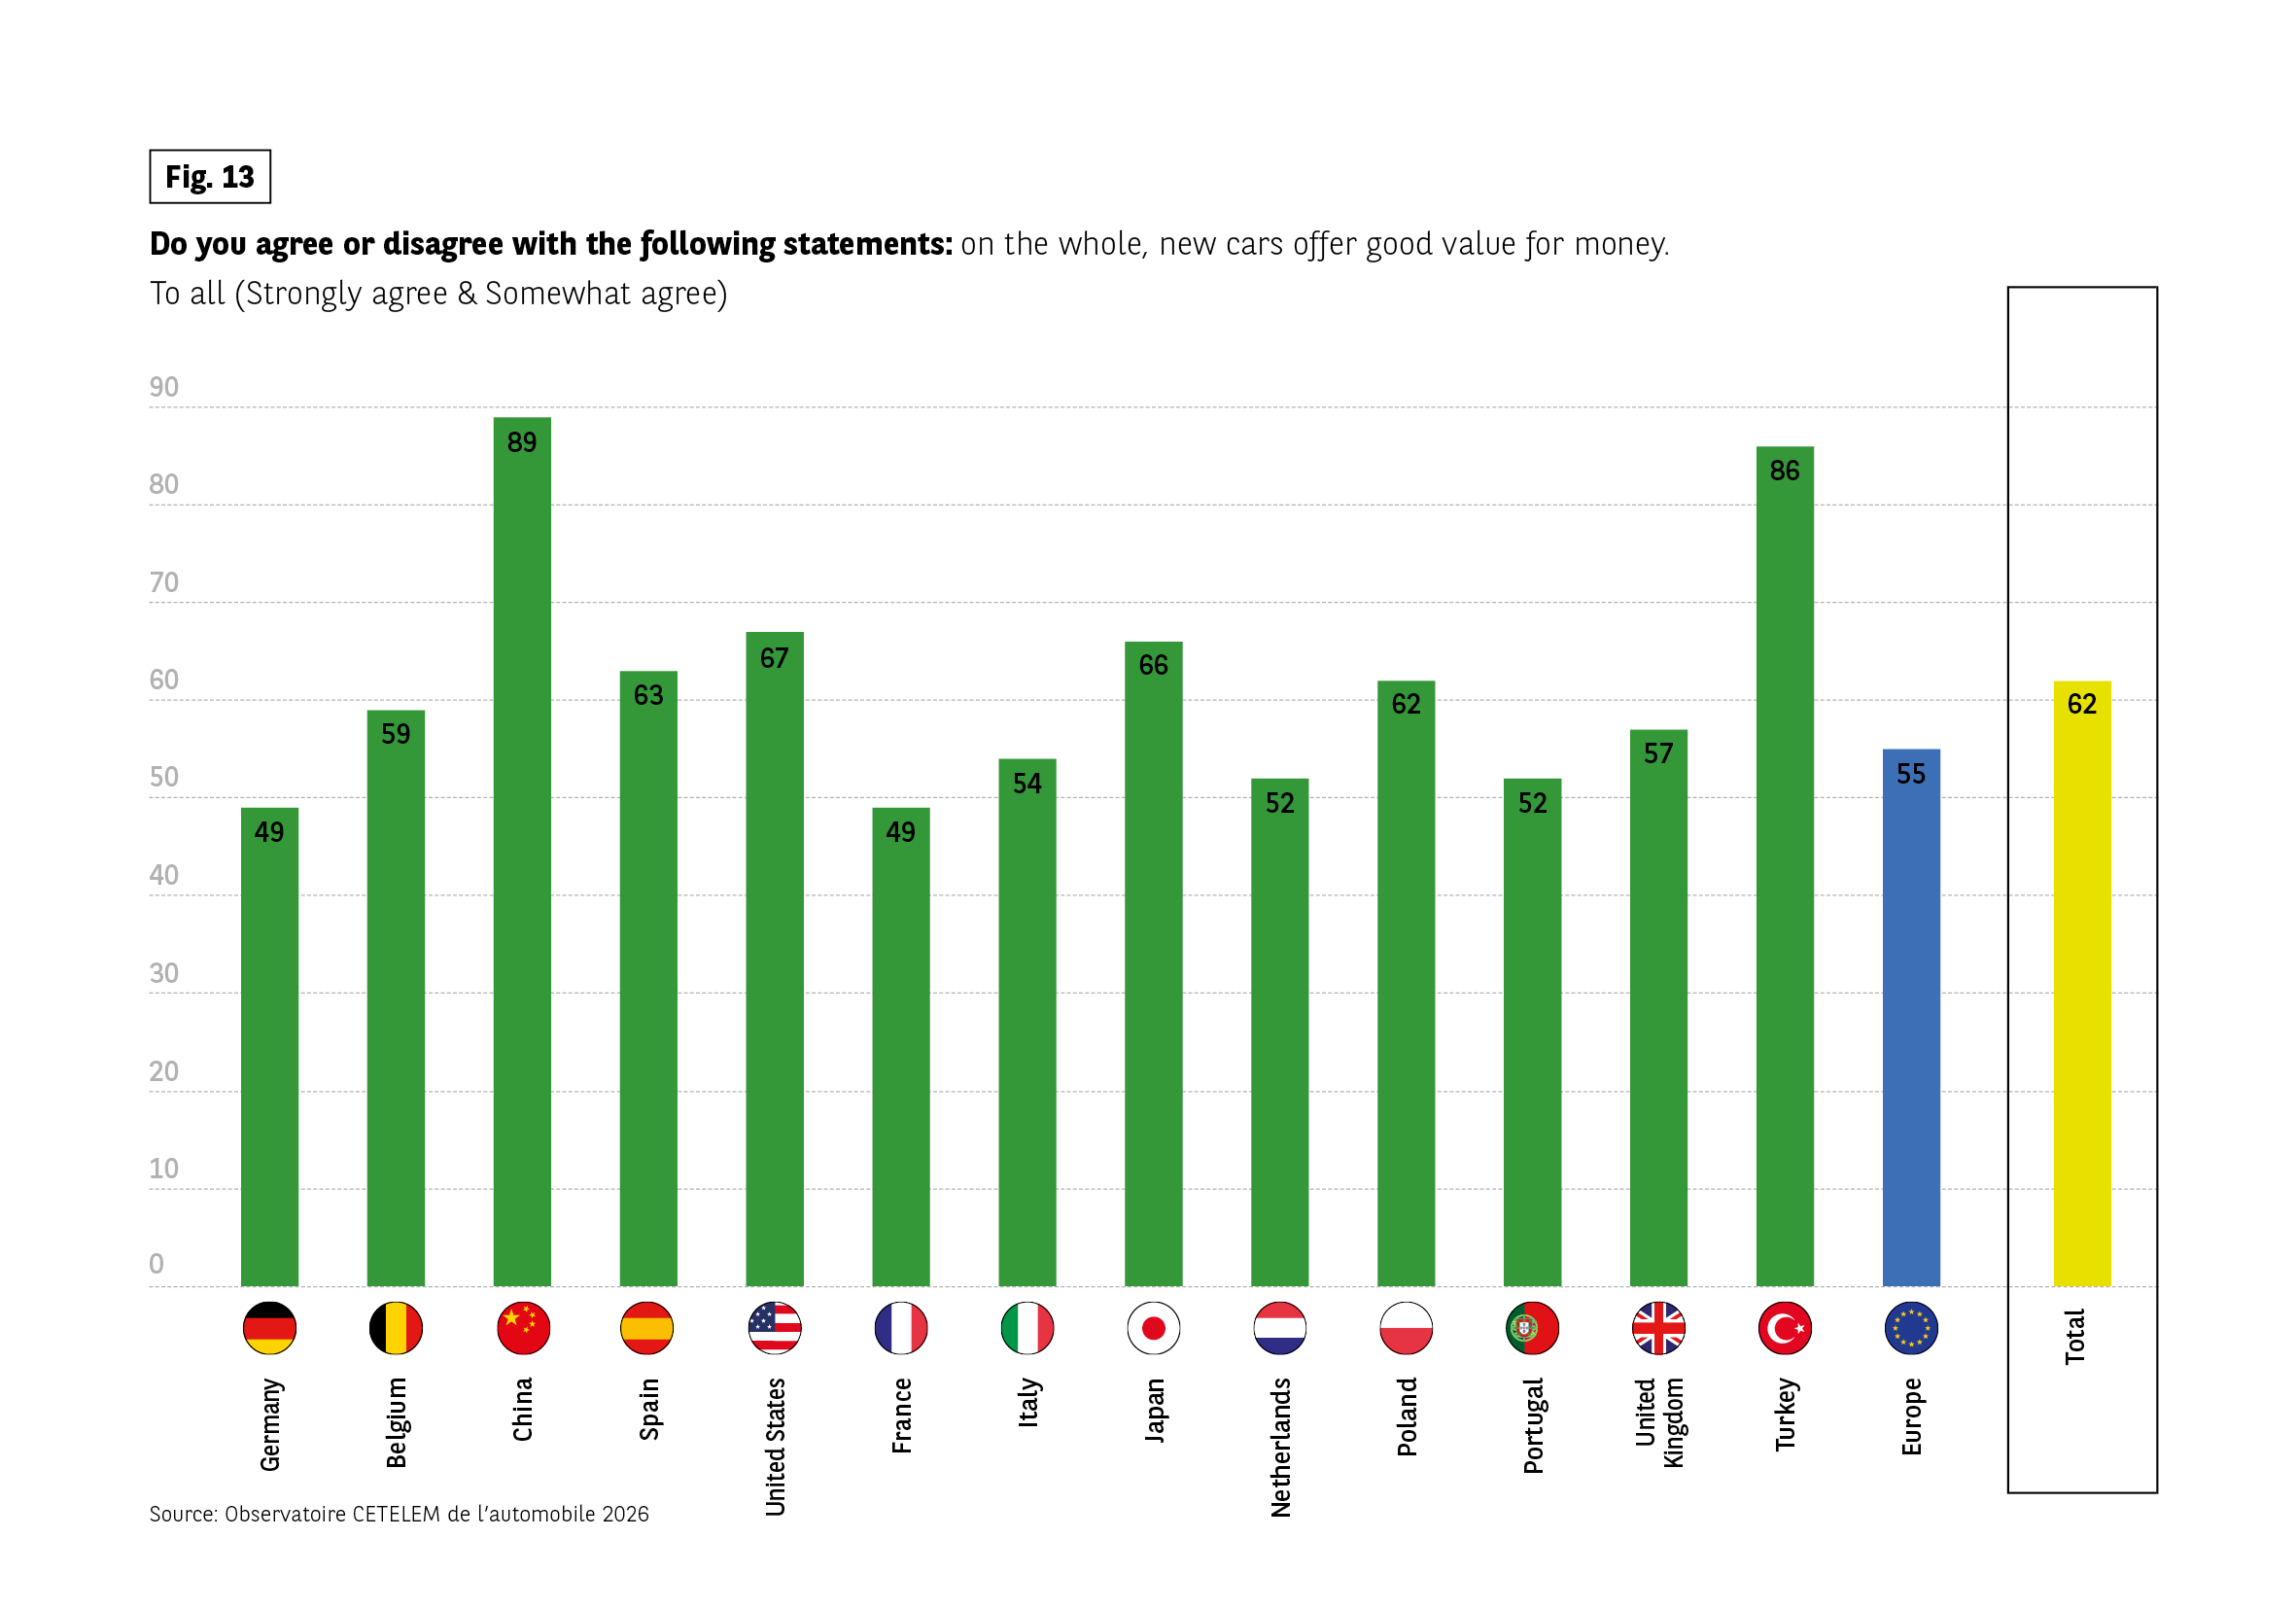 The chart shows the percentage of respondents who strongly or somewhat agree that new cars offer good value for money.
Germany: 49%
Belgium: 59%
China: 89%
Spain: 63%
United States: 67%
France: 49%
Italy: 54%
Japan: 66%
Netherlands: 52%
Poland: 62%
Portugal: 52%
United Kingdom: 57%
Turkey: 86%
Europe total: 55%
Total all countries: 62%
Source: Observatoire Cetelem de l’Automobile 2026.
The chart shows the percentage of respondents who strongly or somewhat agree that new cars offer good value for money.
Germany: 49%
Belgium: 59%
China: 89%
Spain: 63%
United States: 67%
France: 49%
Italy: 54%
Japan: 66%
Netherlands: 52%
Poland: 62%
Portugal: 52%
United Kingdom: 57%
Turkey: 86%
Europe total: 55%
Total all countries: 62%
Source: Observatoire Cetelem de l’Automobile 2026.
Purchases in the pipeline
Whether this is a coincidence or not, the score for value for money is almost the same as that indicating intentions to buy a new car in the next five years. 6 out of 10 people questioned reported this intention. However, the geographical distribution of these positive intentions is very different this time. Of course, the Chinese and Turks are enthusiastic about opening their wallets, and the Italians, Spanish and Americans are joining them in doing the same. Most wallets will remain closed in the Netherlands, Poland and Portugal, the only countries where purchasing intentions are below 50%. Slightly fewer people intend to buy a used car in the future (51%). Intentions are more similar across the various countries surveyed, with the exception of Japan, where only 27% of respondents are planning to make such a purchase. Given the economic situation, significantly more 18-29 year- olds want to buy a used vehicle (63%).
Fig 14 – Intentions to buy a car within five years
Download this infographic for your presentations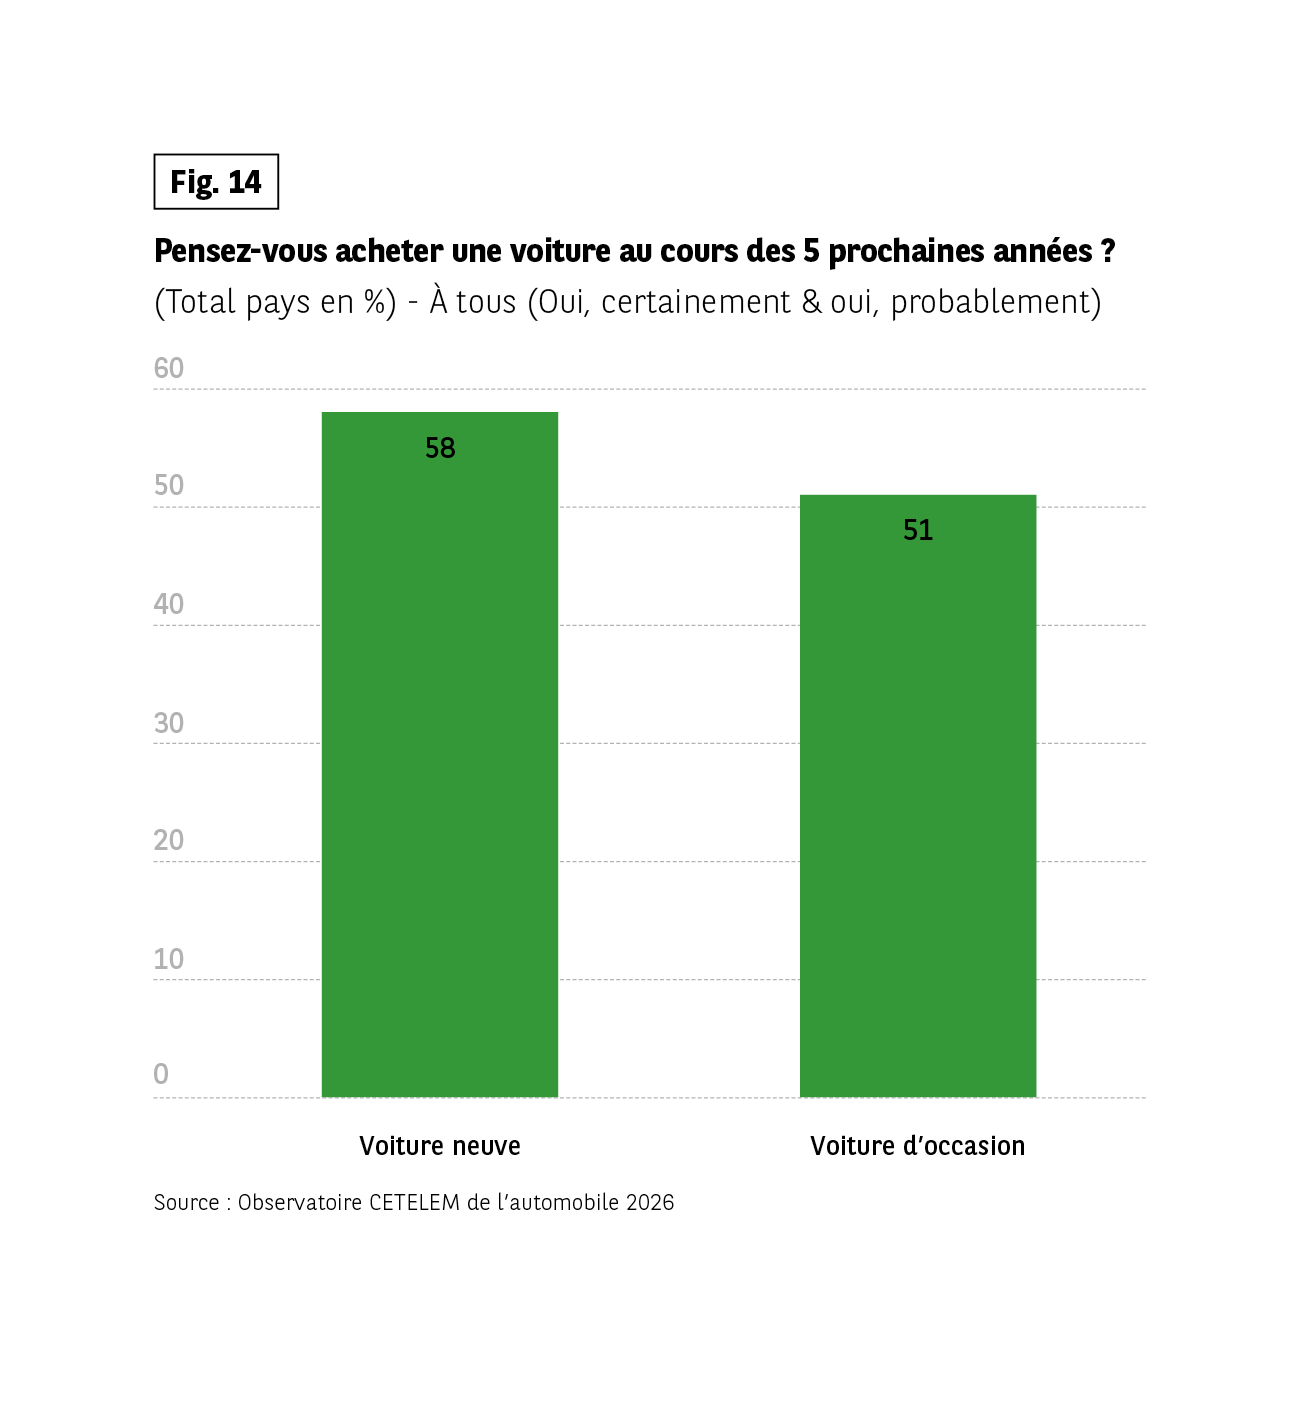 Le graphique présente la proportion de personnes déclarant envisager d’acheter une voiture au cours des cinq prochaines années (« oui, certainement » ou « oui, probablement »).
Voiture neuve : 58 %
Voiture d’occasion : 51 %
Enseignement principal : intention d’achat légèrement plus forte pour les voitures neuves.
Source : Observatoire Cetelem de l’automobile 2026
Le graphique présente la proportion de personnes déclarant envisager d’acheter une voiture au cours des cinq prochaines années (« oui, certainement » ou « oui, probablement »).
Voiture neuve : 58 %
Voiture d’occasion : 51 %
Enseignement principal : intention d’achat légèrement plus forte pour les voitures neuves.
Source : Observatoire Cetelem de l’automobile 2026
New cars: easy to resell
This positive outlook on future purchases is coupled with an even more favourable outlook in terms of resale, an argu- ment that undoubtedly plays a role in the purchase of a new car. 65% of those questioned believe that it is now easy to resell a vehicle of this type.
The Chinese, Spanish, Americans and Turks are the leading experts in this field. In contrast, only 1 in 2 Japanese people view resale at a good price in a favourable light.
Fig 15 – Ease of selling a car at a good price
Download this infographic for your presentations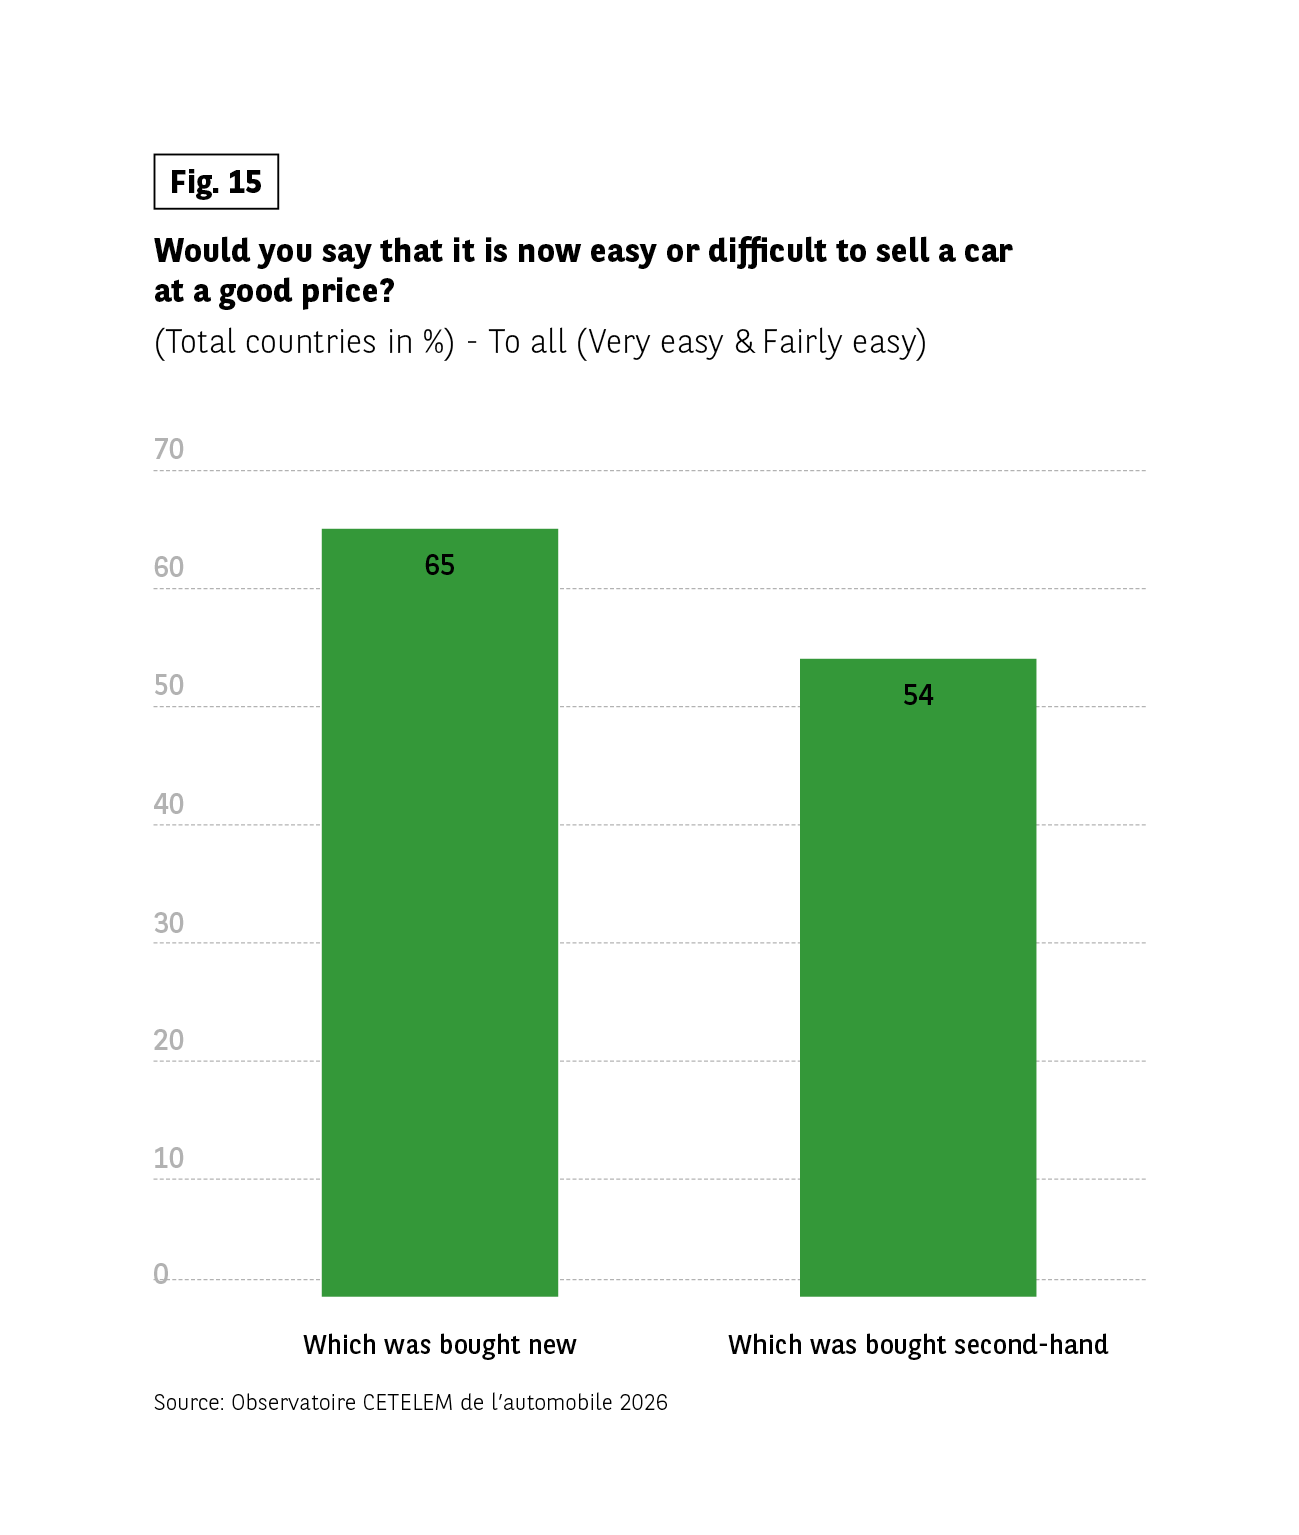 The chart shows the percentage of respondents who say it is very easy or fairly easy to sell a car at a good price.
Bought new: 65%
Bought second-hand: 54%
Source: Observatoire Cetelem de l’Automobile 2026.
The chart shows the percentage of respondents who say it is very easy or fairly easy to sell a car at a good price.
Bought new: 65%
Bought second-hand: 54%
Source: Observatoire Cetelem de l’Automobile 2026.
A car costs money every day
Since the health crisis, the financial burden of having a car has been increasingly felt in household budgets (Fig. 16) particularly in Europe. While the impact varies from country to country, it also depends on several factors:
- intensity of use, even if mileage is on the decline,
- an ageing fleet, with a sharp rise in the cost of spare parts and labour, making maintenance more expensive,
- rise then fall in energy prices,
- insurance, parking, etc.
Fig 16 – Household spending on personal vehicle use
Download this infographic for your presentations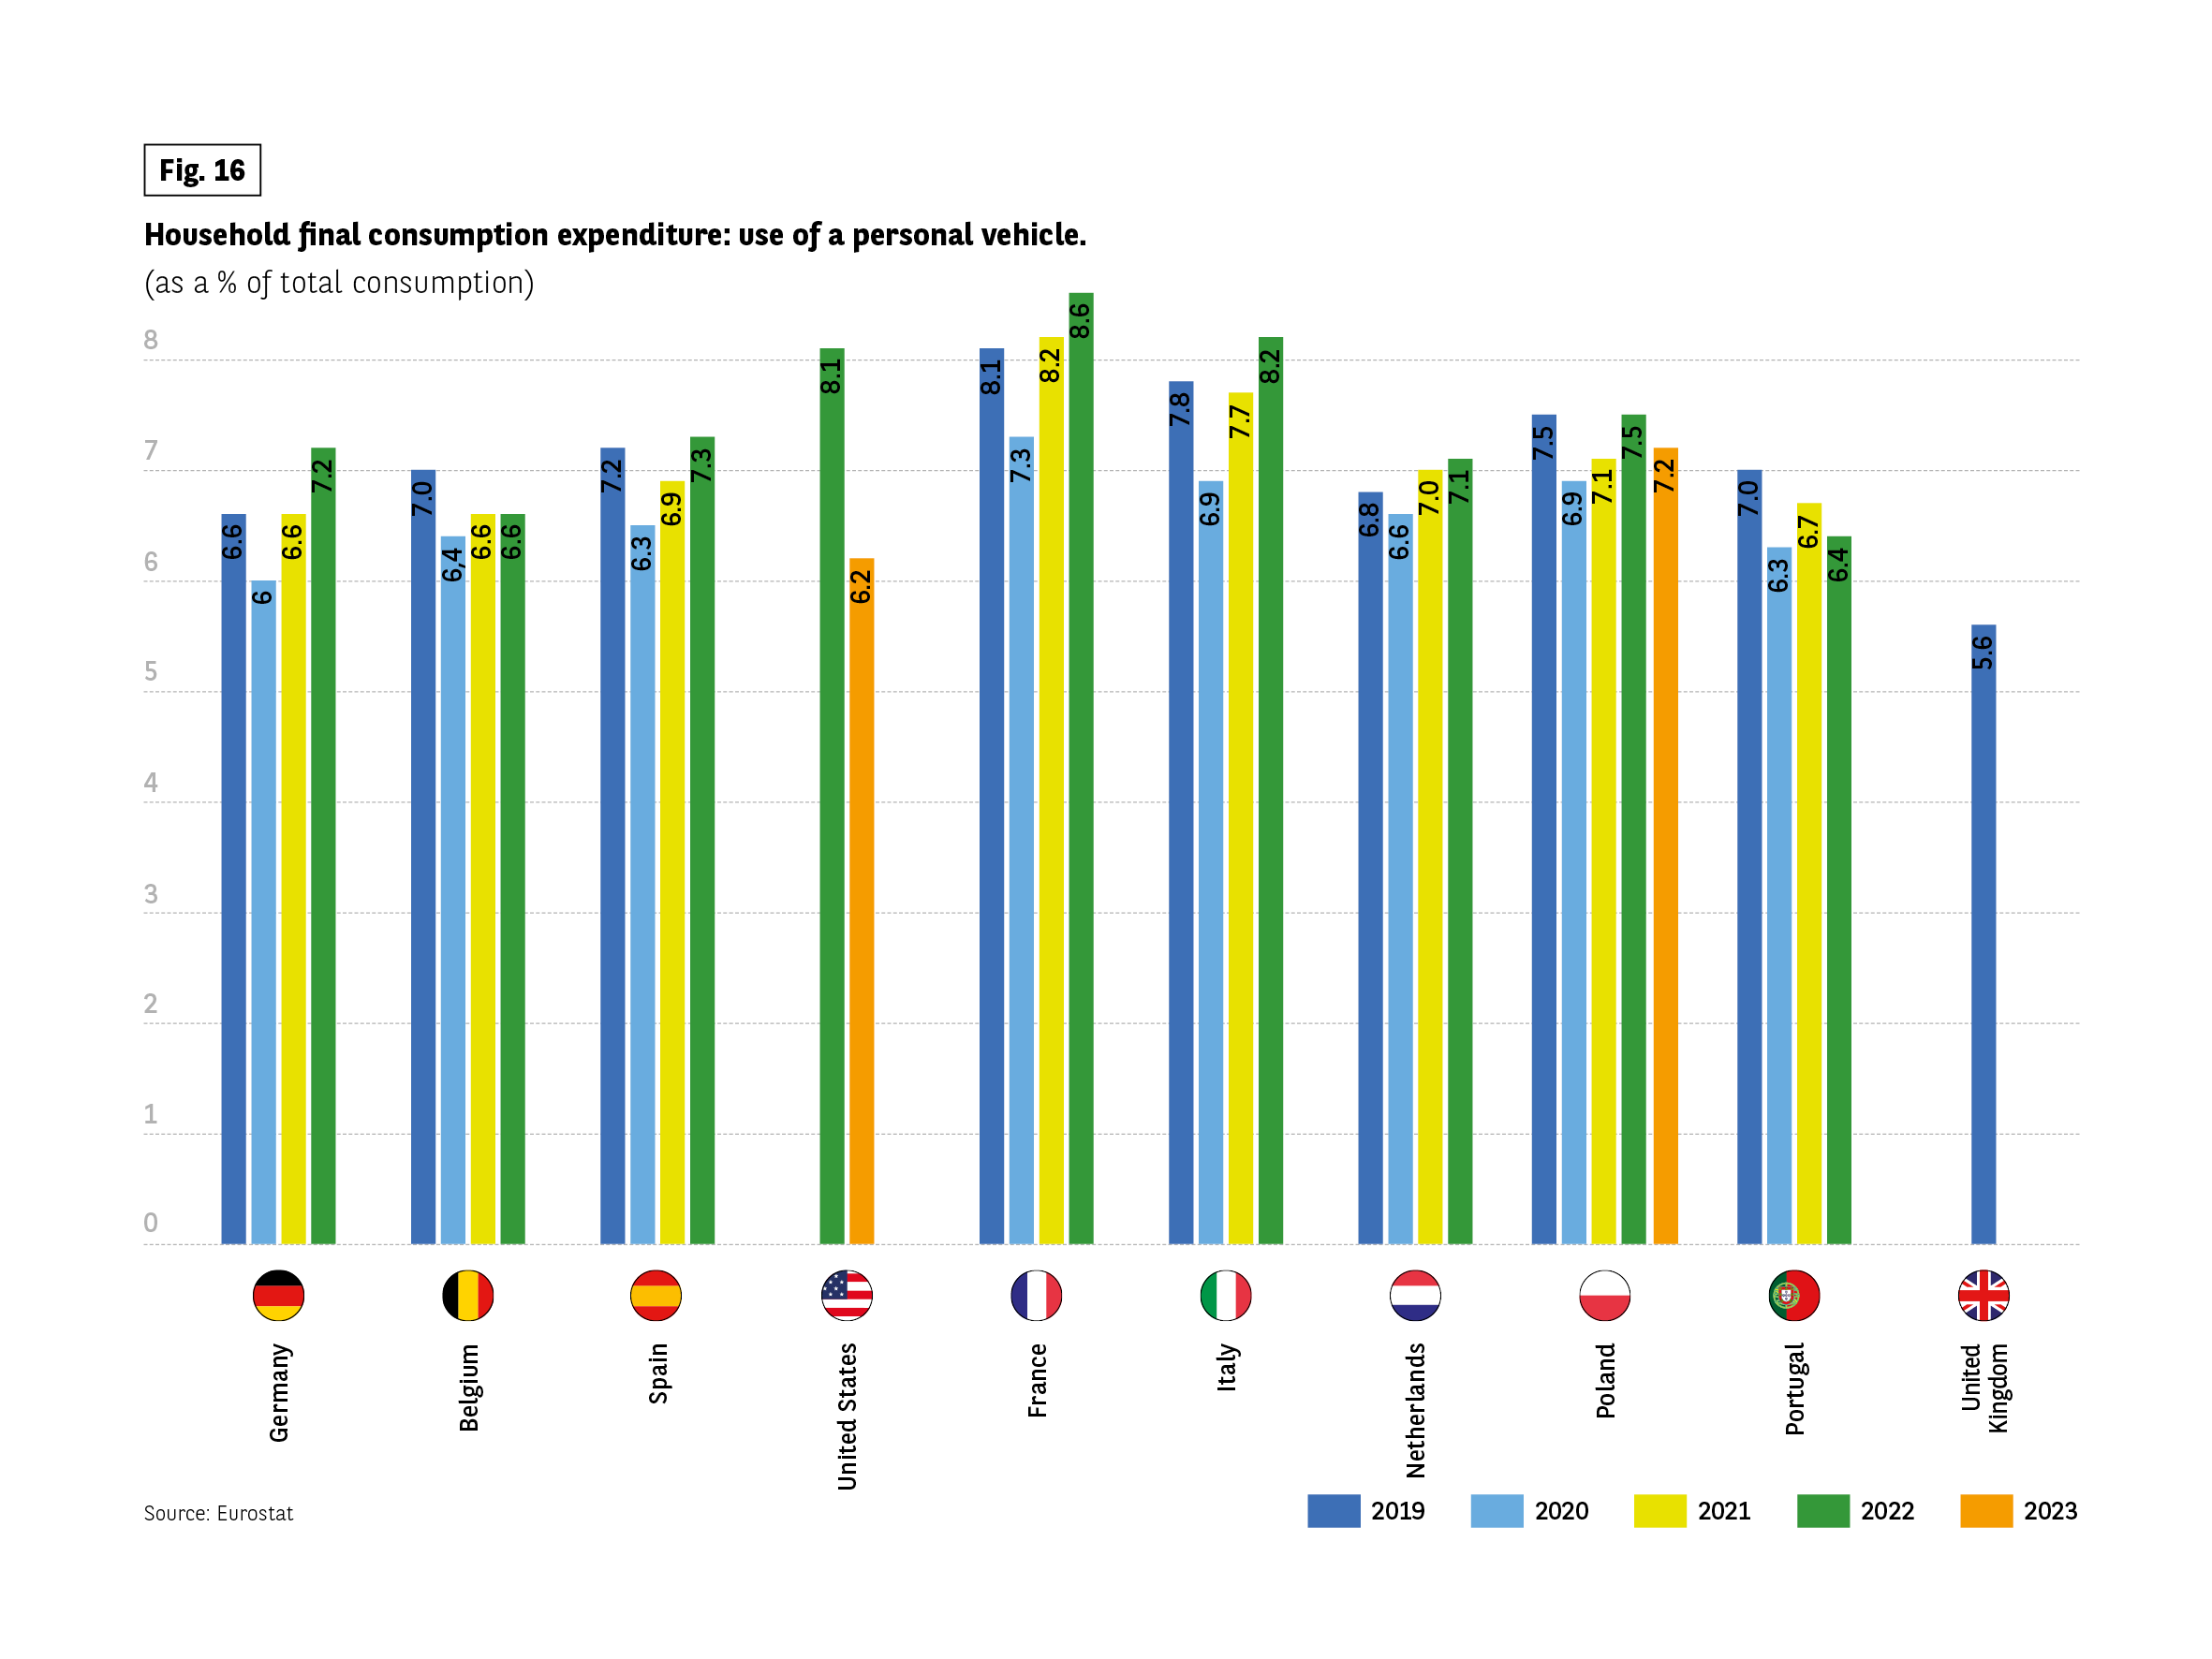 The chart shows household final consumption expenditure for personal vehicle use as a percentage of total consumption from 2019 to 2023.
Germany: 6.6% in 2019, 6.0% in 2020, 6.6% in 2021, 7.2% in 2022
Belgium: 7.0%, 6.5%, 6.6%, 6.6%
Spain: 7.2%, 6.3%, 6.9%, 7.3%
United States: 8.1% in 2022, 6.2% in 2023 [previous years not shown]
France: 8.1%, 7.3%, 8.2%, 8.6%
Italy: 7.8%, 6.9%, 7.7%, 8.2%
Netherlands: 6.8%, 6.6%, 7.0%, 7.1%
Poland: 7.5%, 6.9%, 7.1%, 7.5%, 7.2%
Portugal: 7.0%, 6.3%, 6.7%, 6.4%
United Kingdom: 5.6% in 2019 only
Source: Eurostat.
The chart shows household final consumption expenditure for personal vehicle use as a percentage of total consumption from 2019 to 2023.
Germany: 6.6% in 2019, 6.0% in 2020, 6.6% in 2021, 7.2% in 2022
Belgium: 7.0%, 6.5%, 6.6%, 6.6%
Spain: 7.2%, 6.3%, 6.9%, 7.3%
United States: 8.1% in 2022, 6.2% in 2023 [previous years not shown]
France: 8.1%, 7.3%, 8.2%, 8.6%
Italy: 7.8%, 6.9%, 7.7%, 8.2%
Netherlands: 6.8%, 6.6%, 7.0%, 7.1%
Poland: 7.5%, 6.9%, 7.1%, 7.5%, 7.2%
Portugal: 7.0%, 6.3%, 6.7%, 6.4%
United Kingdom: 5.6% in 2019 only
Source: Eurostat.
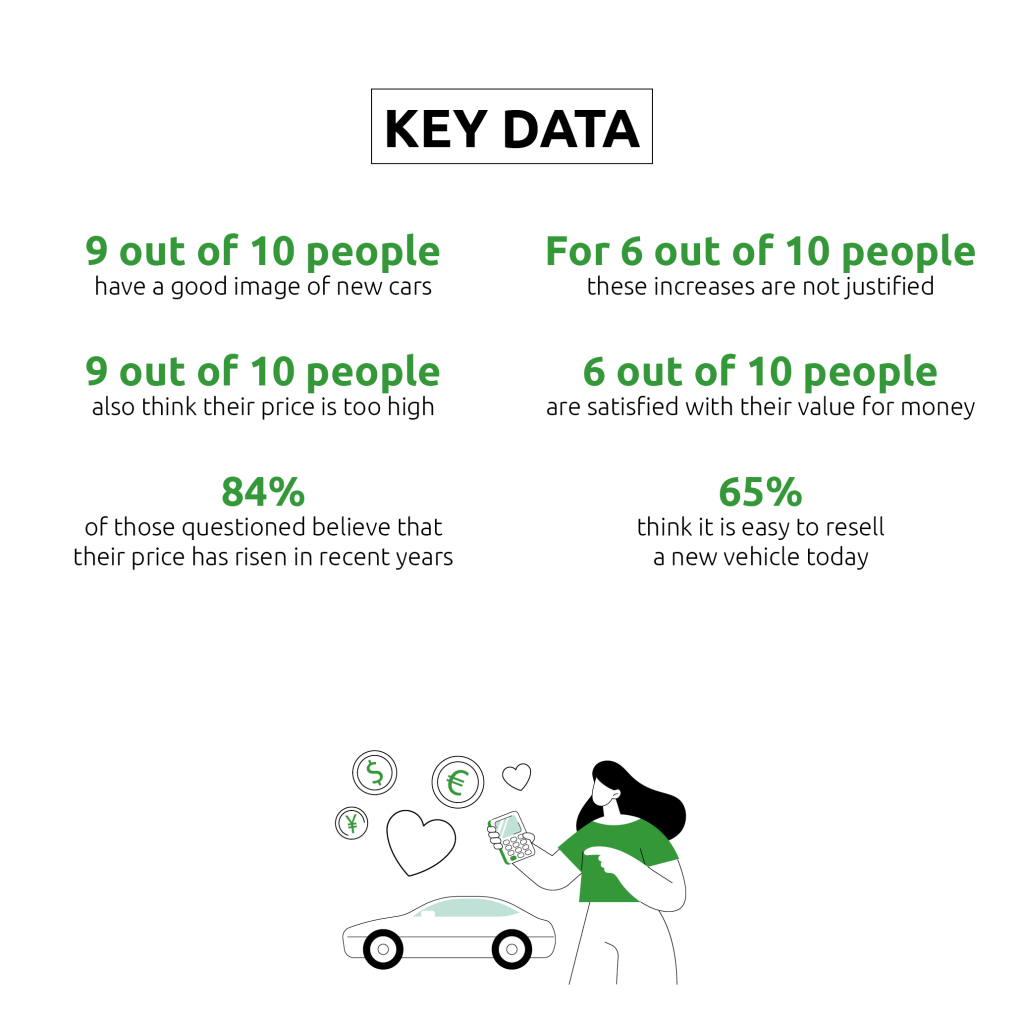 Context: The infographic presents key statistics on public perceptions of new cars, focusing on image, pricing, value for money and resale conditions.
Content:
9 out of 10 people have a good image of new cars.
9 out of 10 people think new car prices are too high.
84% believe prices have risen in recent years.
6 out of 10 people consider these increases unjustified.
6 out of 10 people are satisfied with the value for money of new cars.
65% think it is easy to resell a new vehicle today.
A simple decorative illustration appears at the bottom showing a car, coins, hearts and a person holding a calculator; this image does not convey additional data.
Source: Observatoire CETELEM de l’automobile 2026.
Context: The infographic presents key statistics on public perceptions of new cars, focusing on image, pricing, value for money and resale conditions.
Content:
9 out of 10 people have a good image of new cars.
9 out of 10 people think new car prices are too high.
84% believe prices have risen in recent years.
6 out of 10 people consider these increases unjustified.
6 out of 10 people are satisfied with the value for money of new cars.
65% think it is easy to resell a new vehicle today.
A simple decorative illustration appears at the bottom showing a car, coins, hearts and a person holding a calculator; this image does not convey additional data.
Source: Observatoire CETELEM de l’automobile 2026.