
Electric vehicles: continuous growth


 3 min
reading time
3 min
reading time
THE ELECTRIC REALITY
The second major shockwave reshaping the market has been the emergence and rapid commercial success of powertrain electrification (BEVs and PHEVs). Since 2019, global sales have expanded 14-fold, surging from 1.5 million units to 21 million in 2025 (including 14 million battery electric vehicles). Every market covered by the Observatoire Cetelem has witnessed dramatic gains, led naturally by China, the global frontrunner, which accounts for over half of all sales (13.4 million vehicles, including 8.2 million electric vehicles). While France recorded solid, mid-pack growth (rising from 45,000 units in 2019 to 340,000 in 2025), the standout growth trajectory belongs to the UK: 38,000 sales in 2019 to 340,000 in 2025.
ELECTRIC VEHICLES: CHINA’S OVERWHELMING WEIGHT
Fig. 46 – Battery Electric Passenger Car (BEV) Registrations, 2019-2025 (thousands of registrations)
Download this infographic for your presentations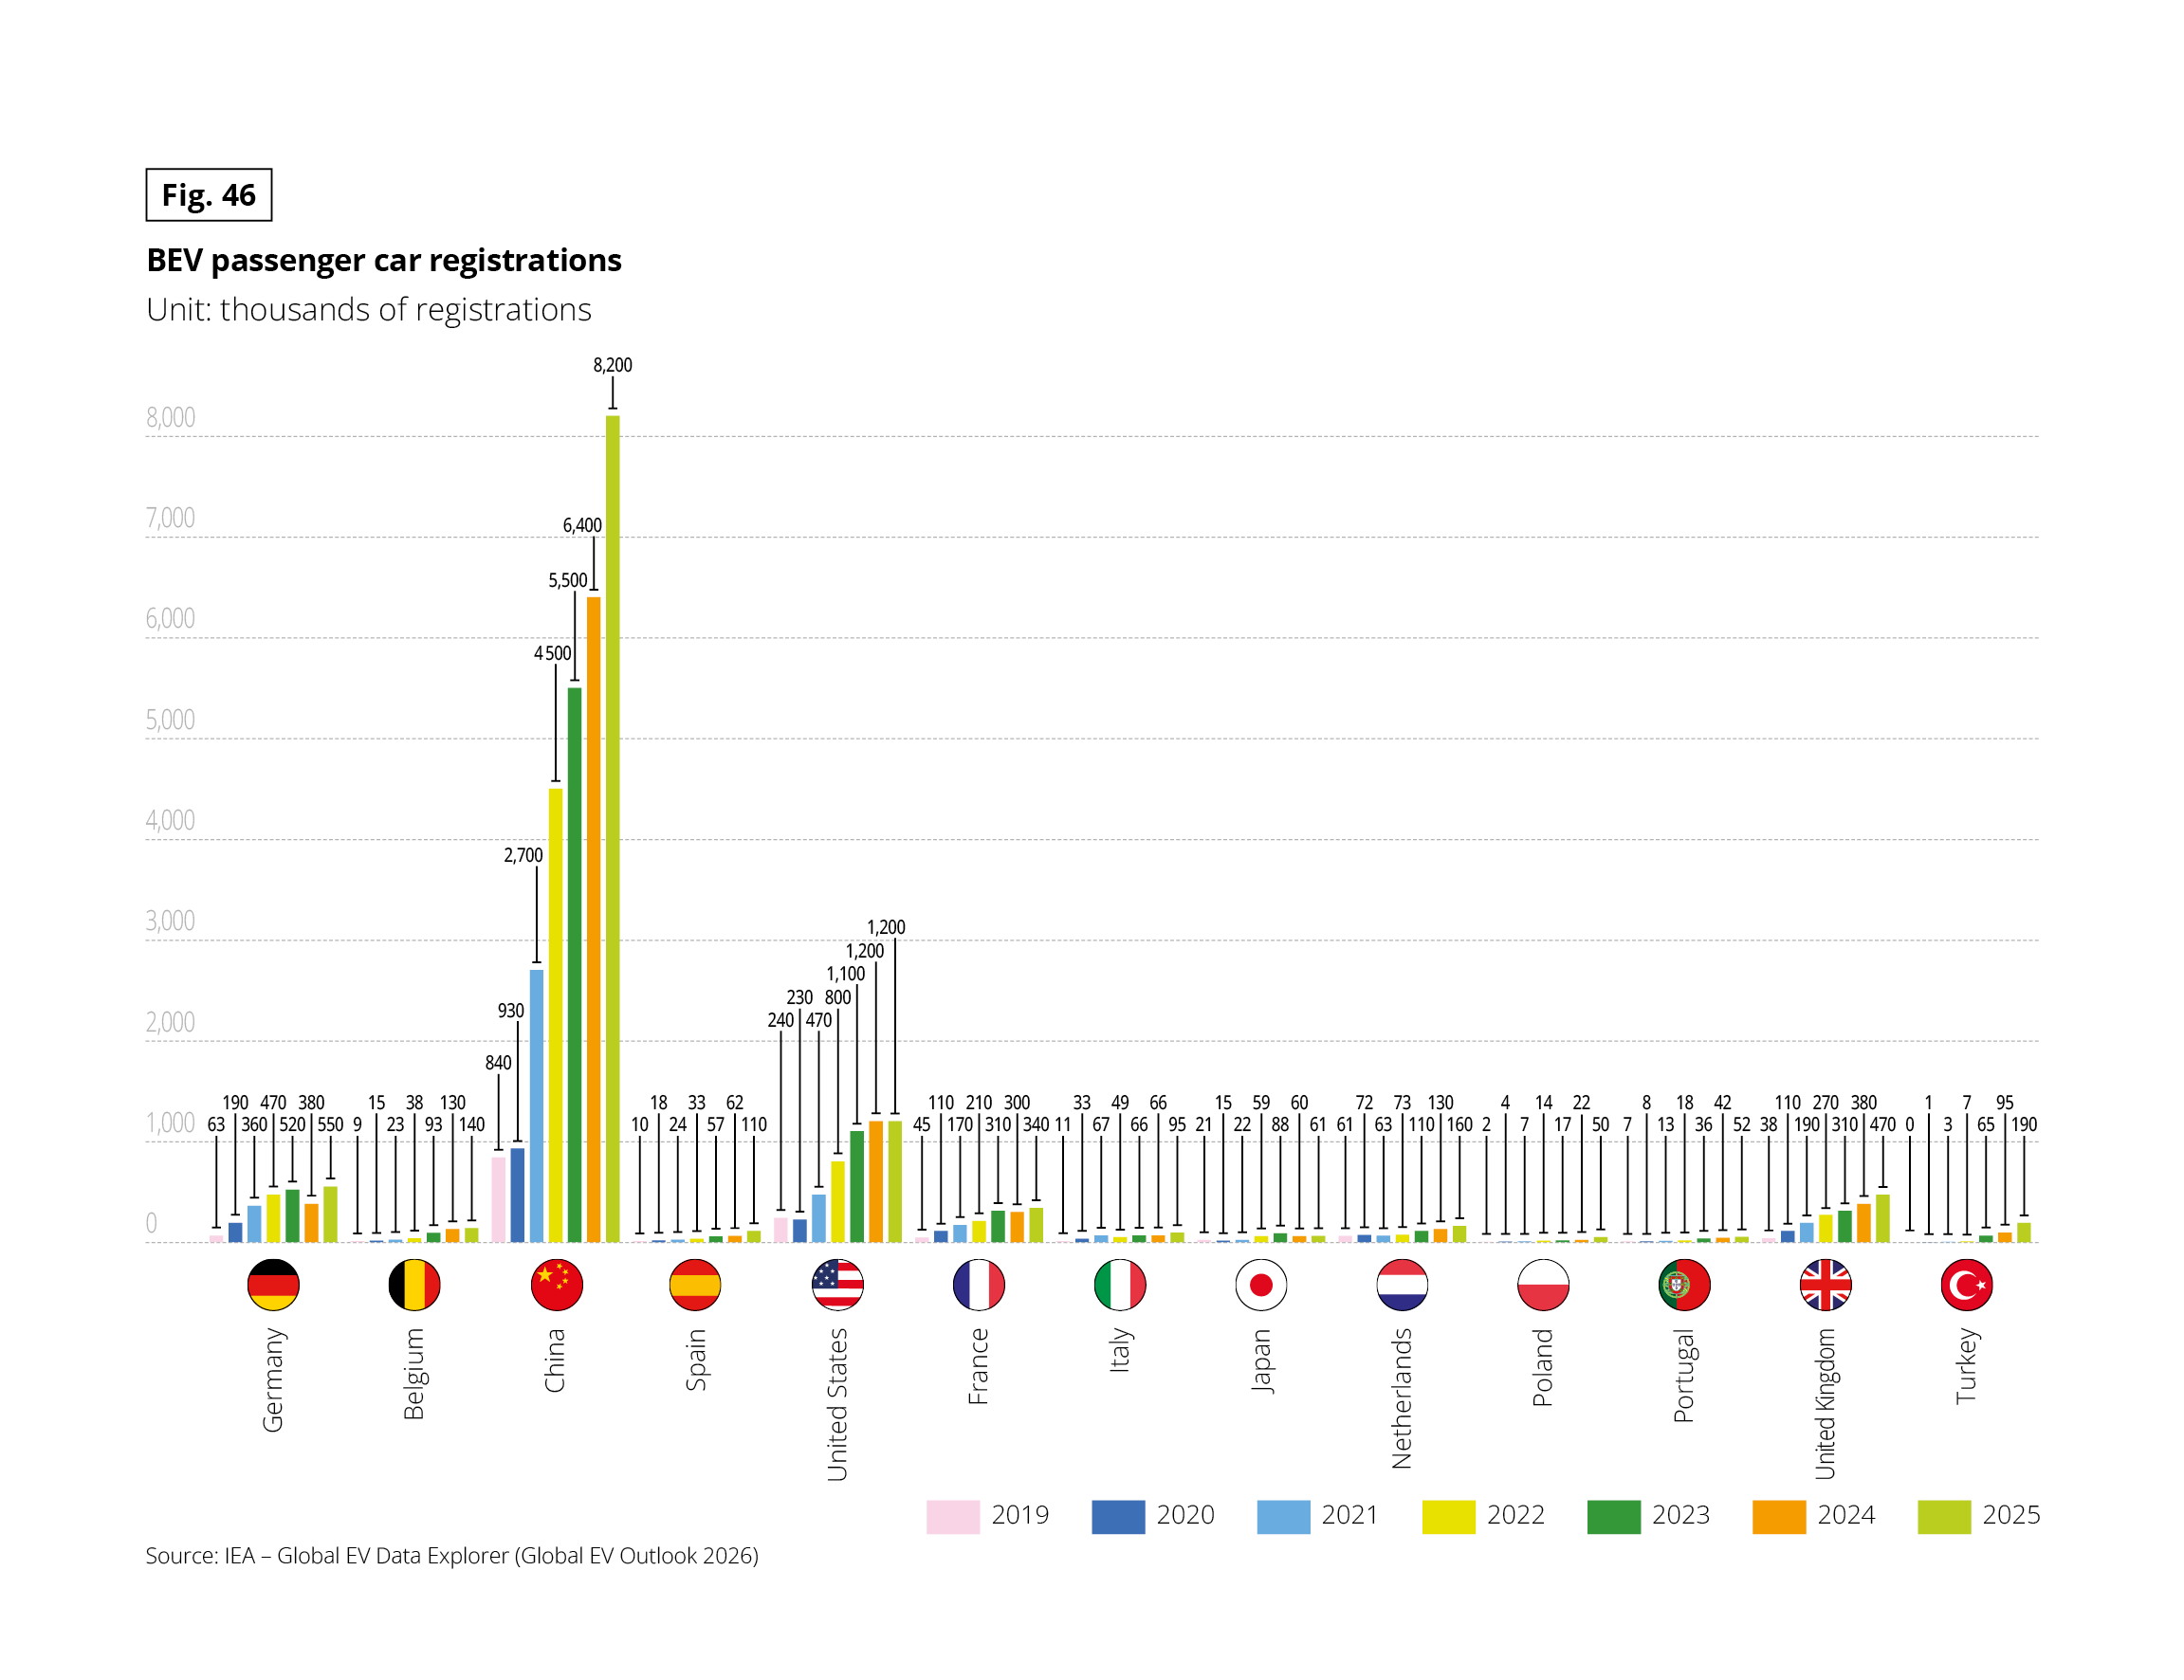 Vertical grouped bar chart. Unit: thousands of registrations of battery electric vehicle (BEV) passenger cars. Seven series, one per year from 2019 to 2025. Source: IEA, Global EV Data Explorer (Global EV Outlook 2026).
Data by country, in the form 2019 / 2020 / 2021 / 2022 / 2023 / 2024 / 2025:
• Germany: 63 / 190 / 360 / 470 / 520 / 380 / 550
• Belgium: 9 / 15 / 23 / 38 / 93 / 130 / 140
• China: 840 / 930 / 2,700 / 4,500 / 5,500 / 6,400 / 8,200
• Spain: 10 / 18 / 24 / 33 / 57 / 62 / 110
• United States: 240 / 230 / 470 / 800 / 1,100 / 1,200 / 1,200
• France: 45 / 110 / 170 / 210 / 310 / 300 / 340
• Italy: 11 / 33 / 67 / 49 / 66 / 66 / 95
• Japan: 15 / 21 / 22 / 59 / 88 / 60 / 61
• Netherlands: 61 / 72 / 63 / 73 / 110 / 130 / 160
• Poland: 2 / 4 / 7 / 14 / 17 / 22 / 50
• Portugal: 7 / 8 / 13 / 18 / 36 / 42 / 52
• United Kingdom: 38 / 110 / 190 / 270 / 310 / 380 / 470
• Turkey: 0 / 1 / 3 / 7 / 65 / 95 / 190
China dominates throughout the period, with registrations growing every year to 8,200 thousand in 2025. The United States is second in 2025 (1,200 thousand, unchanged from 2024), followed by Germany (550 thousand) and the United Kingdom (470 thousand). Germany is the only country shown, besides Italy, Japan and France, to record a decline in 2024 before rising again in 2025; Japan stays flat in 2025.
Vertical grouped bar chart. Unit: thousands of registrations of battery electric vehicle (BEV) passenger cars. Seven series, one per year from 2019 to 2025. Source: IEA, Global EV Data Explorer (Global EV Outlook 2026).
Data by country, in the form 2019 / 2020 / 2021 / 2022 / 2023 / 2024 / 2025:
• Germany: 63 / 190 / 360 / 470 / 520 / 380 / 550
• Belgium: 9 / 15 / 23 / 38 / 93 / 130 / 140
• China: 840 / 930 / 2,700 / 4,500 / 5,500 / 6,400 / 8,200
• Spain: 10 / 18 / 24 / 33 / 57 / 62 / 110
• United States: 240 / 230 / 470 / 800 / 1,100 / 1,200 / 1,200
• France: 45 / 110 / 170 / 210 / 310 / 300 / 340
• Italy: 11 / 33 / 67 / 49 / 66 / 66 / 95
• Japan: 15 / 21 / 22 / 59 / 88 / 60 / 61
• Netherlands: 61 / 72 / 63 / 73 / 110 / 130 / 160
• Poland: 2 / 4 / 7 / 14 / 17 / 22 / 50
• Portugal: 7 / 8 / 13 / 18 / 36 / 42 / 52
• United Kingdom: 38 / 110 / 190 / 270 / 310 / 380 / 470
• Turkey: 0 / 1 / 3 / 7 / 65 / 95 / 190
China dominates throughout the period, with registrations growing every year to 8,200 thousand in 2025. The United States is second in 2025 (1,200 thousand, unchanged from 2024), followed by Germany (550 thousand) and the United Kingdom (470 thousand). Germany is the only country shown, besides Italy, Japan and France, to record a decline in 2024 before rising again in 2025; Japan stays flat in 2025.
GROWING APPEAL
This appetite for innovation translates directly into drivetrain preferences. Hybrid and electric powertrains are no longer just an option; they are rapidly becoming the default choice. Among prospective buyers, 1 in 2 motorists intends to buy a vehicle with an electrified powertrain, whether new or used. Alongside China, the Mediterranean trio of Italy–Spain–France shows the strongest commitment to electrified vehicles. Conversely, two markets remain sceptical: the US and Poland.
Fig. 47 – Knowledge of the type of powertrain for the next car: electric or hybrid (% of those planning to buy within the next 12 months)
Download this infographic for your presentations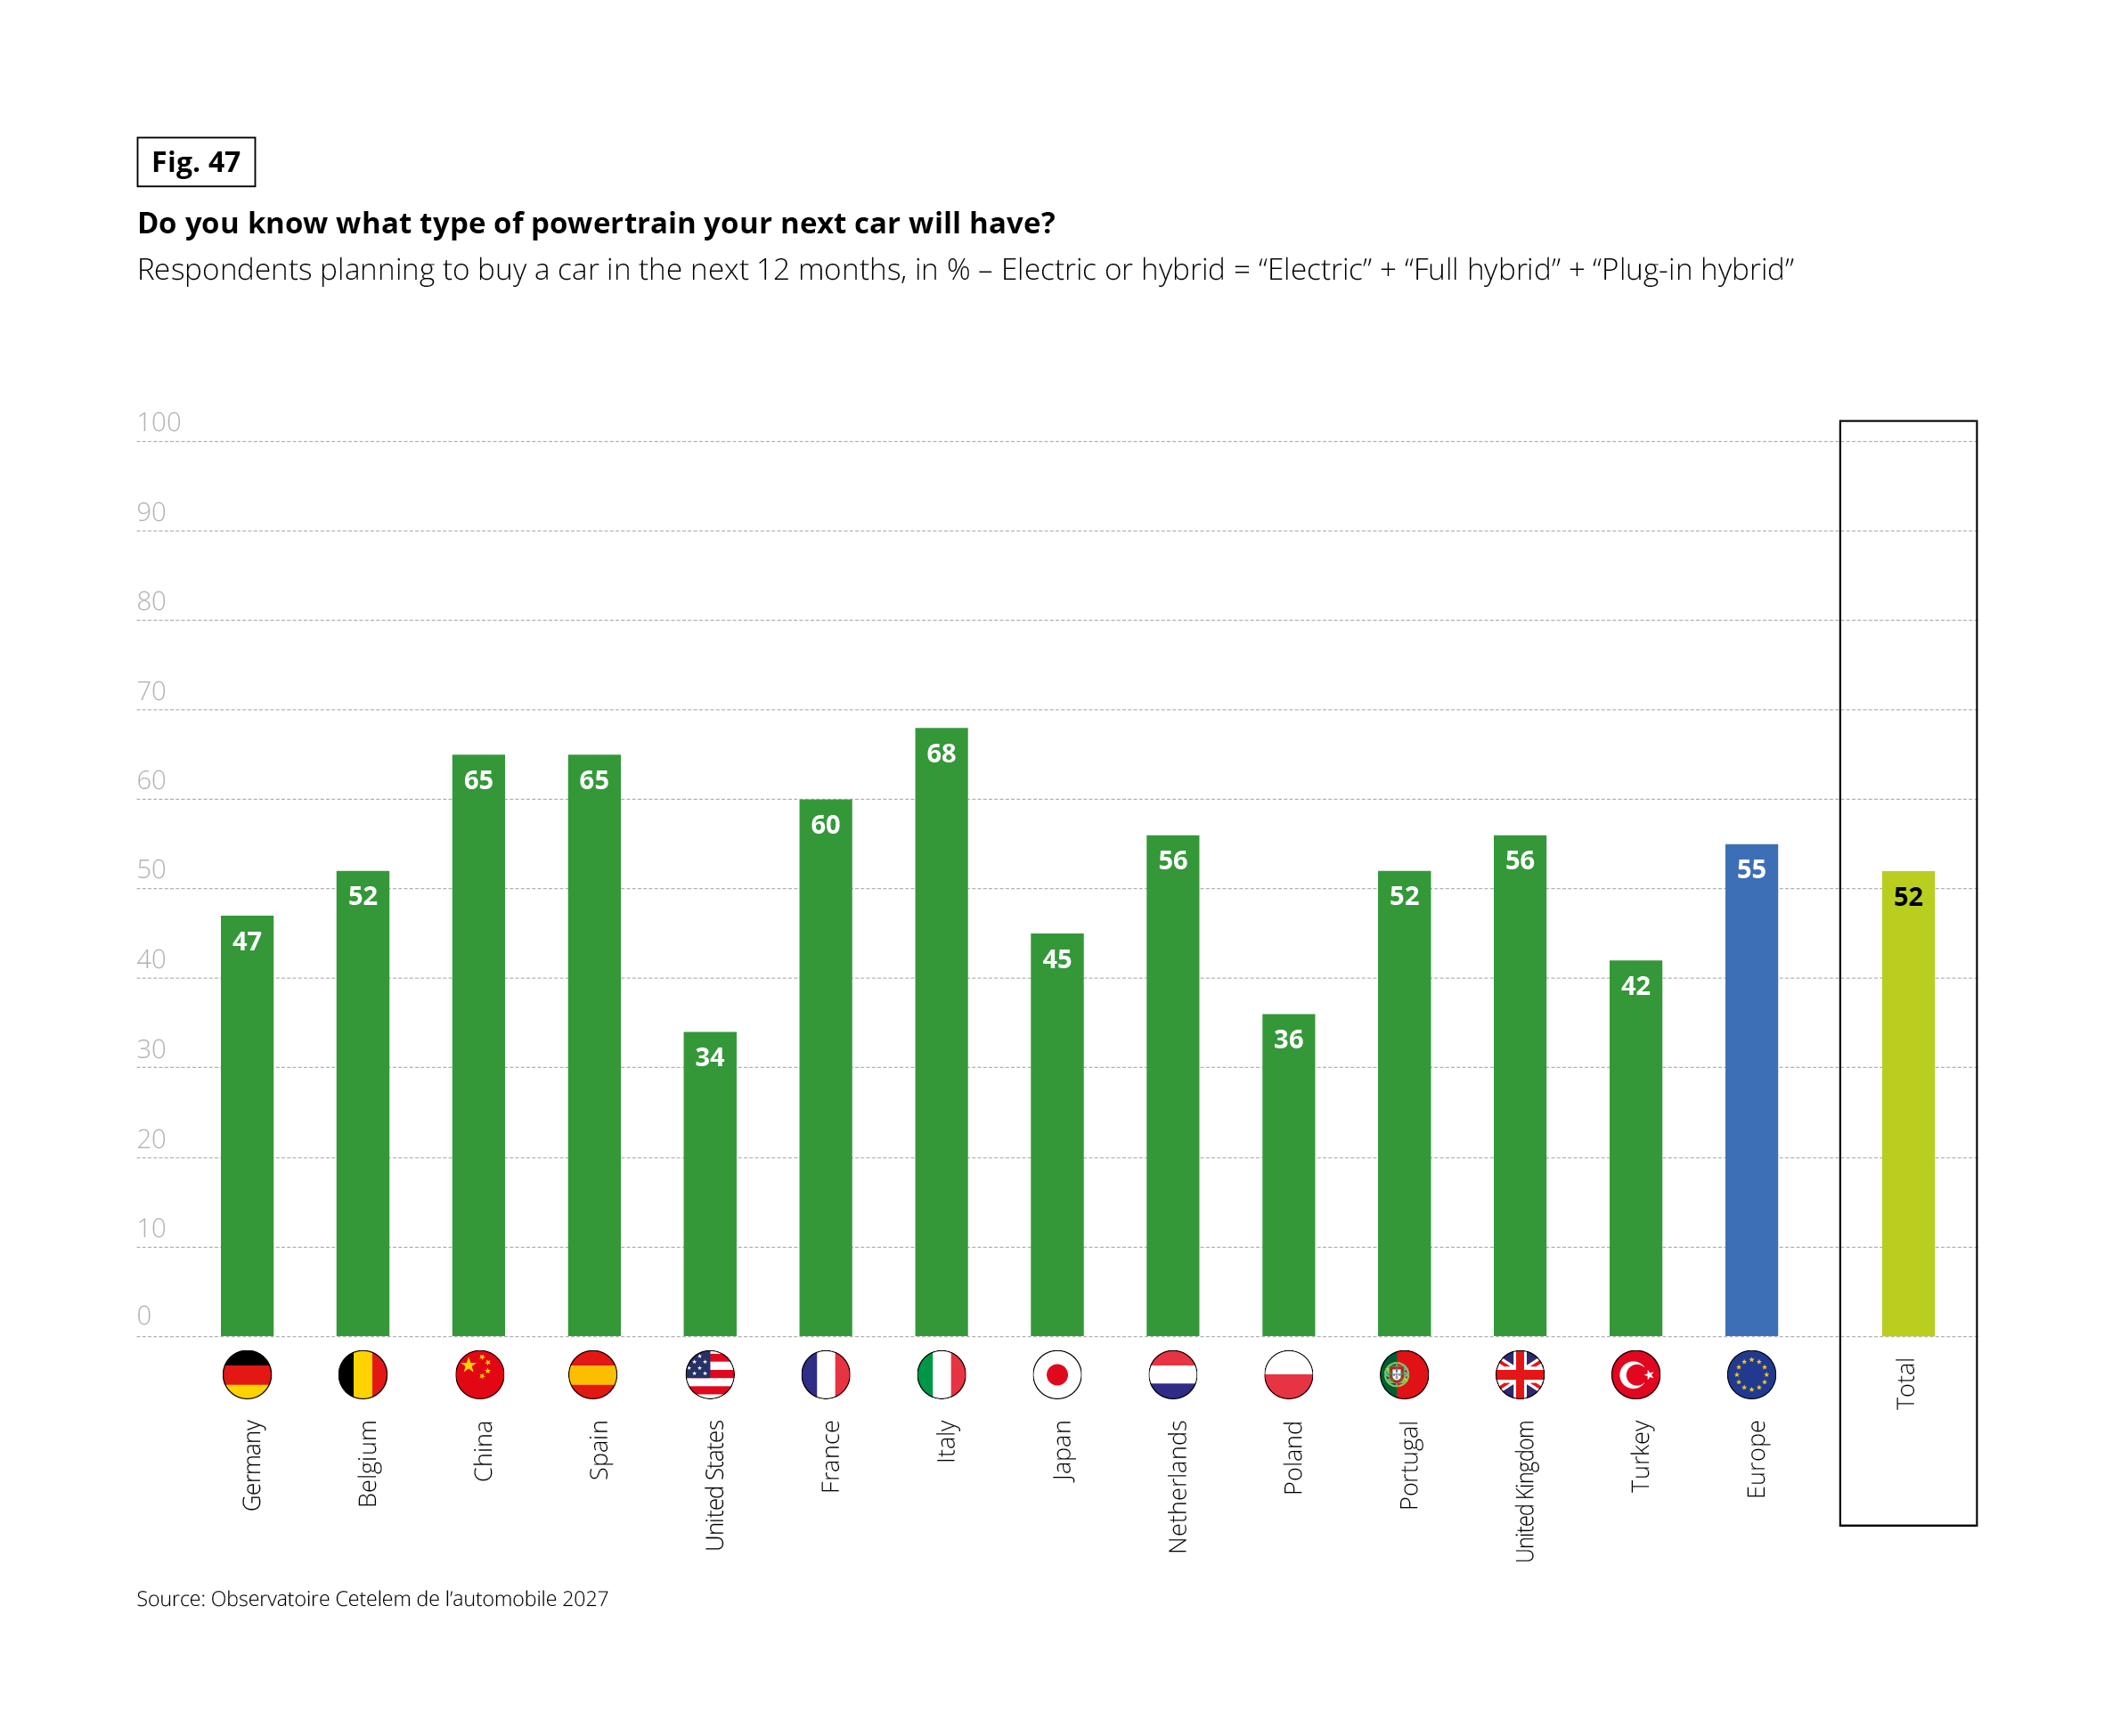 Vertical bar chart. Question: “Do you know what type of powertrain your next car will have?”
Base: respondents planning to buy a car in the next 12 months, in %. “Electric or hybrid” groups “Electric”, “Full hybrid” and “Plug-in hybrid”. Source: Observatoire Cetelem de l’automobile 2027. Across all countries combined, 52% say their next car will be electric or hybrid. Italy is the highest (68%), followed by China and Spain (65% each). The United States is the lowest (34%).
Data by country: Germany 47%, Belgium 52%, China 65%, Spain 65%, United States 34%, France 60%, Italy 68%, Japan 45%, Netherlands 56%, Poland 36%, Portugal 52%, United Kingdom 56%, Turkey 42%. The European average is 55%. The total is 52%.
Vertical bar chart. Question: “Do you know what type of powertrain your next car will have?”
Base: respondents planning to buy a car in the next 12 months, in %. “Electric or hybrid” groups “Electric”, “Full hybrid” and “Plug-in hybrid”. Source: Observatoire Cetelem de l’automobile 2027. Across all countries combined, 52% say their next car will be electric or hybrid. Italy is the highest (68%), followed by China and Spain (65% each). The United States is the lowest (34%).
Data by country: Germany 47%, Belgium 52%, China 65%, Spain 65%, United States 34%, France 60%, Italy 68%, Japan 45%, Netherlands 56%, Poland 36%, Portugal 52%, United Kingdom 56%, Turkey 42%. The European average is 55%. The total is 52%.
WHEN ELECTRIFICATION AND NATIONAL IDENTITY GO HAND IN HAND
Domestic champions and electrified vehicles are by no means mutually exclusive. Germany and Japan stand out as the only countries surveyed where all top three brands for local EV sales are domestic automakers. In several other markets, including France, the top-selling EV brand is also a home-grown manufacturer.
Fig. 48 – Top 3 brands in electrified vehicle market share in the countries in 2025 (% of electrified passenger car sales)
Download this infographic for your presentations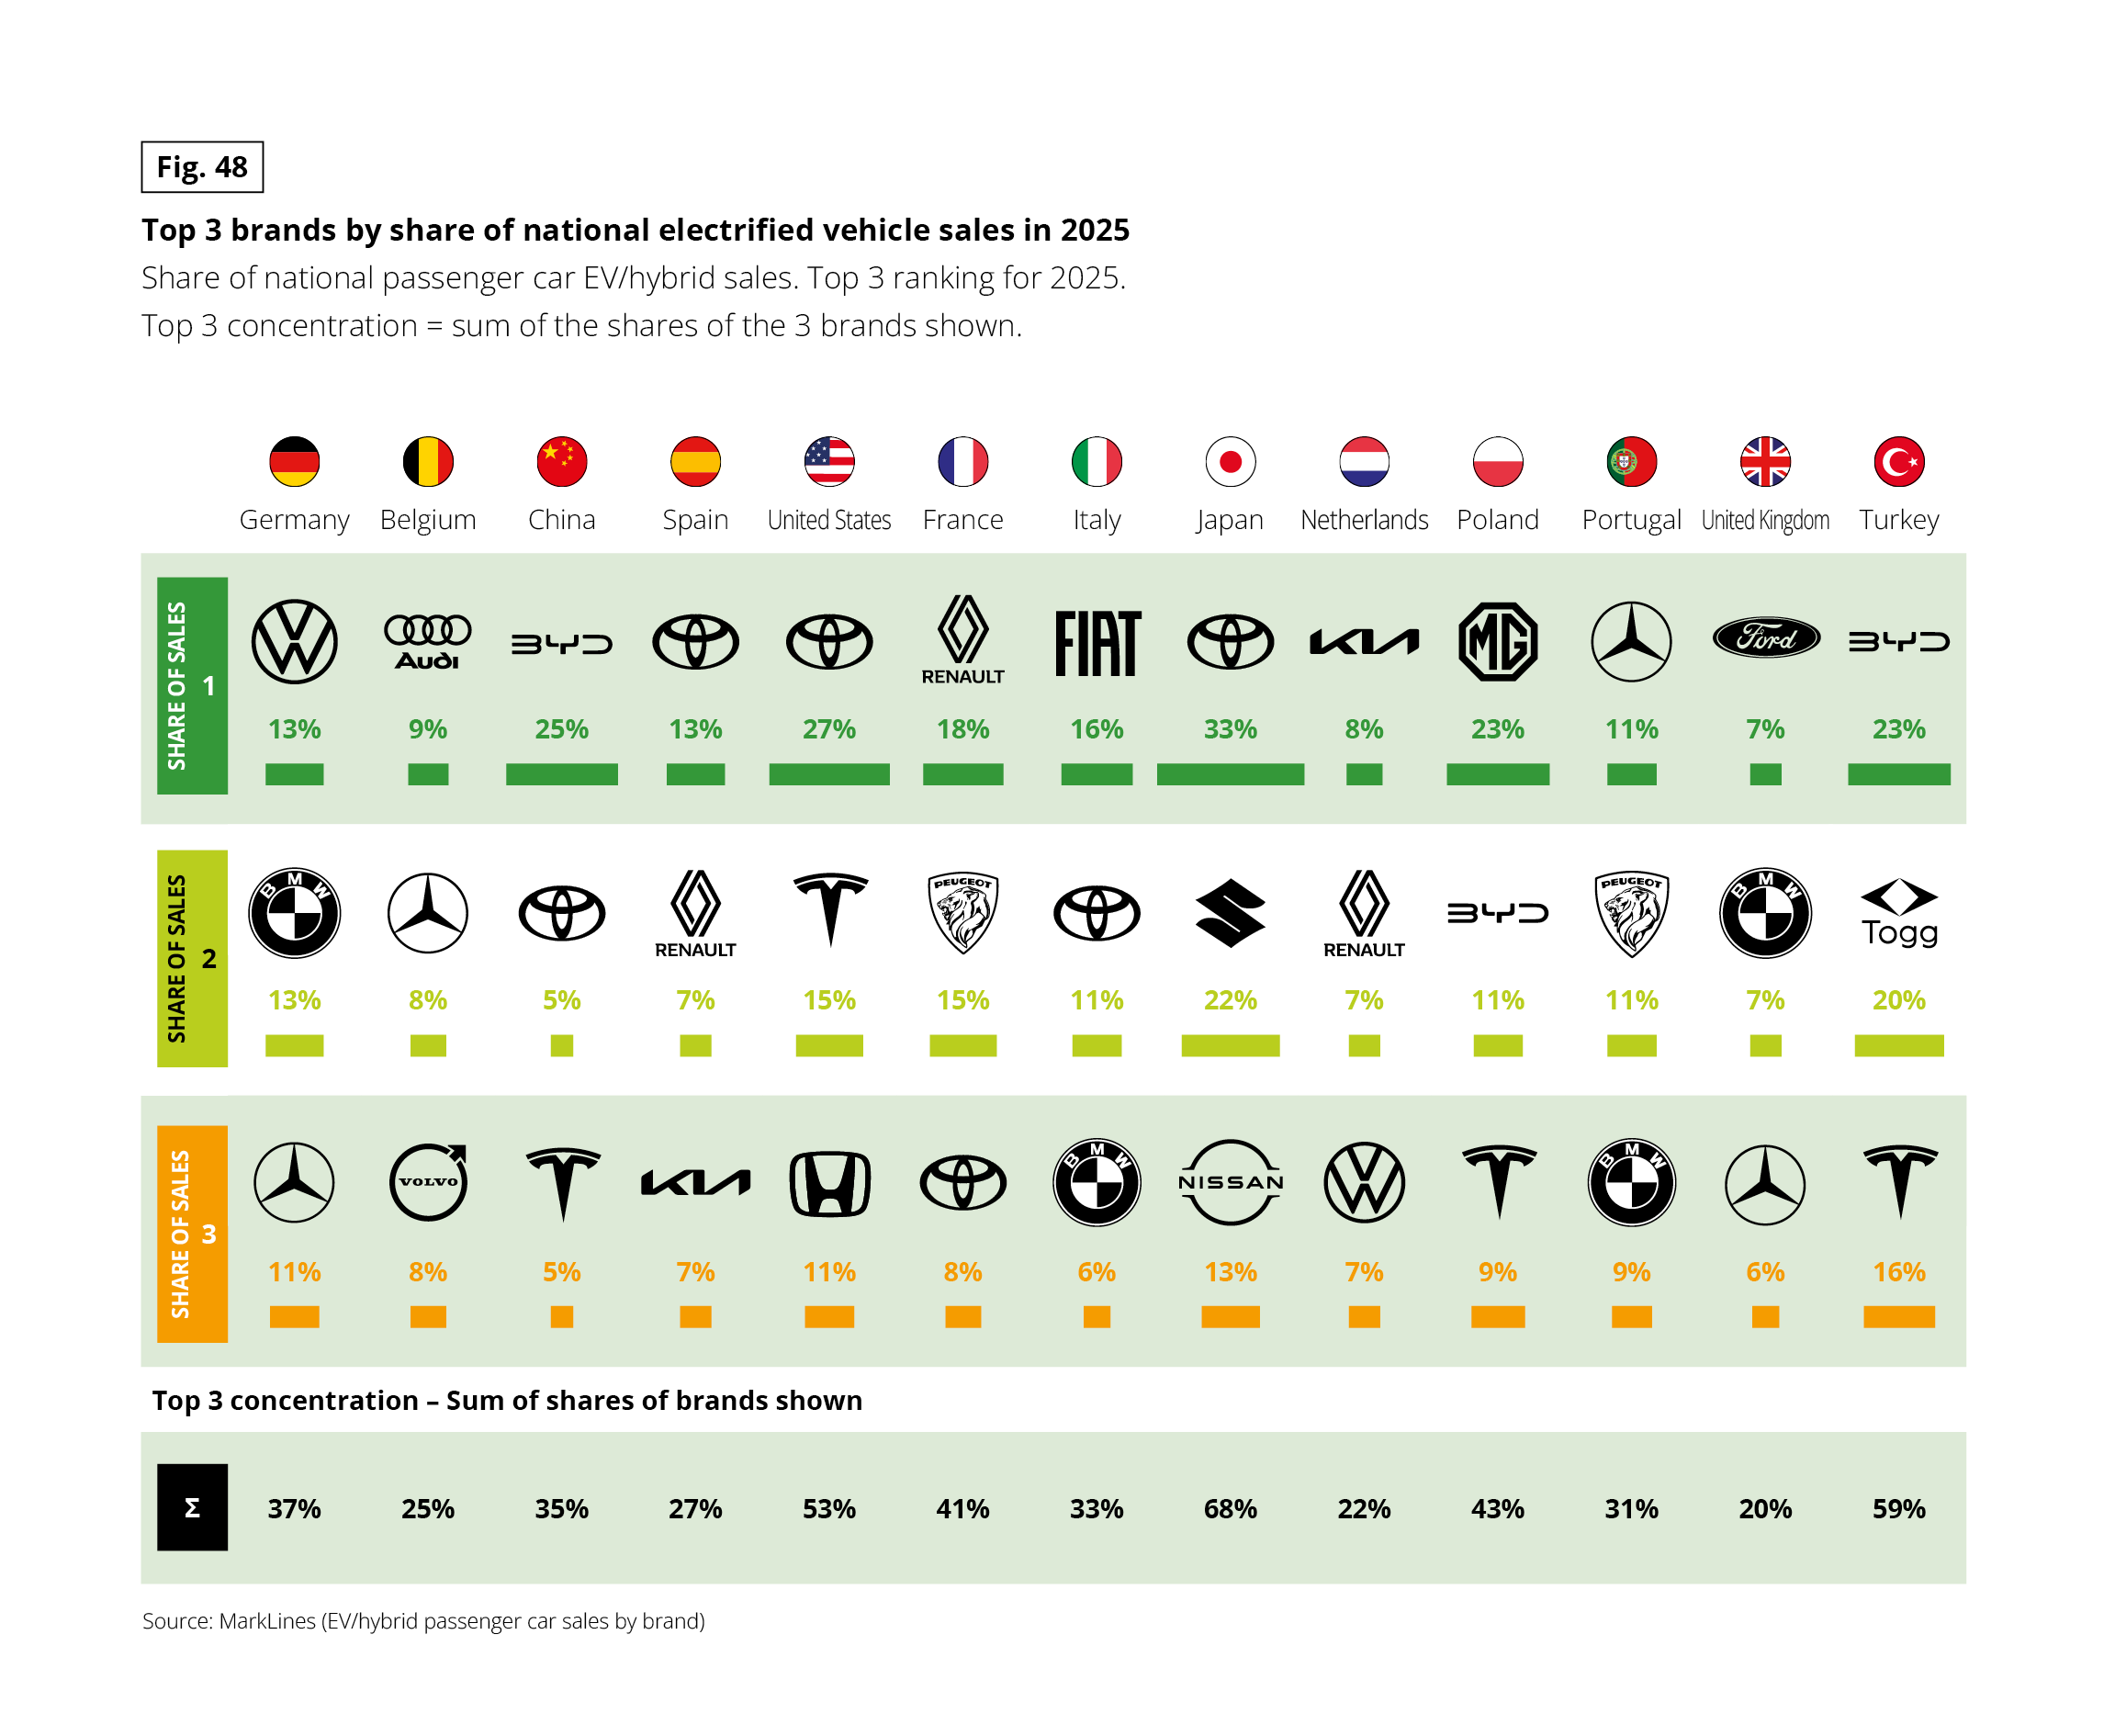 Ranking infographic. For each of the 13 countries, the three brands with the highest share of national passenger car electric and hybrid sales in 2025 are shown with their share. “Top 3 concentration” is the sum of the shares of the three brands shown. Brands are identified from their logos. Source: MarkLines (EV/hybrid passenger car sales by brand).
Data by country, in the form first / second / third brand, then top 3 concentration:
• Germany: Volkswagen 13% / BMW 13% / Mercedes-Benz 11%; concentration 37%
• Belgium: Audi 9% / Mercedes-Benz 8% / Volvo 8%; concentration 25%
• China: BYD 25% / Toyota 5% / Tesla 5%; concentration 35%
• Spain: Toyota 13% / Renault 7% / Kia 7%; concentration 27%
• United States: Toyota 27% / Tesla 15% / Honda 11%; concentration 53%
• France: Renault 18% / Peugeot 15% / Toyota 8%; concentration 41%
• Italy: Fiat 16% / Toyota 11% / BMW 6%; concentration 33%
• Japan: Toyota 33% / Suzuki 22% / Nissan 13%; concentration 68%
• Netherlands: Kia 8% / Renault 7% / Volkswagen 7%; concentration 22%
• Poland: MG 23% / BYD 11% / Tesla 9%; concentration 43%
• Portugal: Mercedes-Benz 11% / Peugeot 11% / BMW 9%; concentration 31%
• United Kingdom: Ford 7% / BMW 7% / Mercedes-Benz 6%; concentration 20%
• Turkey: BYD 23% / Togg 20% / Tesla 16%; concentration 59%
Japan has the most concentrated market (68%), followed by Turkey (59%) and the United States (53%). The United Kingdom (20%) and the Netherlands (22%) are the most fragmented. Toyota is the first brand in Spain, the United States and Japan. BYD is first in China and Turkey.
Ranking infographic. For each of the 13 countries, the three brands with the highest share of national passenger car electric and hybrid sales in 2025 are shown with their share. “Top 3 concentration” is the sum of the shares of the three brands shown. Brands are identified from their logos. Source: MarkLines (EV/hybrid passenger car sales by brand).
Data by country, in the form first / second / third brand, then top 3 concentration:
• Germany: Volkswagen 13% / BMW 13% / Mercedes-Benz 11%; concentration 37%
• Belgium: Audi 9% / Mercedes-Benz 8% / Volvo 8%; concentration 25%
• China: BYD 25% / Toyota 5% / Tesla 5%; concentration 35%
• Spain: Toyota 13% / Renault 7% / Kia 7%; concentration 27%
• United States: Toyota 27% / Tesla 15% / Honda 11%; concentration 53%
• France: Renault 18% / Peugeot 15% / Toyota 8%; concentration 41%
• Italy: Fiat 16% / Toyota 11% / BMW 6%; concentration 33%
• Japan: Toyota 33% / Suzuki 22% / Nissan 13%; concentration 68%
• Netherlands: Kia 8% / Renault 7% / Volkswagen 7%; concentration 22%
• Poland: MG 23% / BYD 11% / Tesla 9%; concentration 43%
• Portugal: Mercedes-Benz 11% / Peugeot 11% / BMW 9%; concentration 31%
• United Kingdom: Ford 7% / BMW 7% / Mercedes-Benz 6%; concentration 20%
• Turkey: BYD 23% / Togg 20% / Tesla 16%; concentration 59%
Japan has the most concentrated market (68%), followed by Turkey (59%) and the United States (53%). The United Kingdom (20%) and the Netherlands (22%) are the most fragmented. Toyota is the first brand in Spain, the United States and Japan. BYD is first in China and Turkey.
CHINA, INHERENTLY ELECTRIC
A brand’s national identity rests not only on objective, rational criteria but also on symbolic, at times subconscious, associations forged over time. Thus, engineering and build quality are seen as German, design as Italian, and electrification as Chinese. Just over a quarter of motorists associate Chinese cars most strongly with electric powertrains. This sentiment takes top spot in eight of the surveyed countries and is, predictably, highest in China itself. Japan also shows a strong domestic electric association, as does, more surprisingly, the US, where the success of Tesla has undoubtedly left its mark. This Chinese dominance highlights a form of cultural victory in the EV arena, translating into easier market share gains and reduced marketing expenditure.
Fig. 49 – Association of electric car qualities with the nationality of “your country” (% of respondents)
Download this infographic for your presentations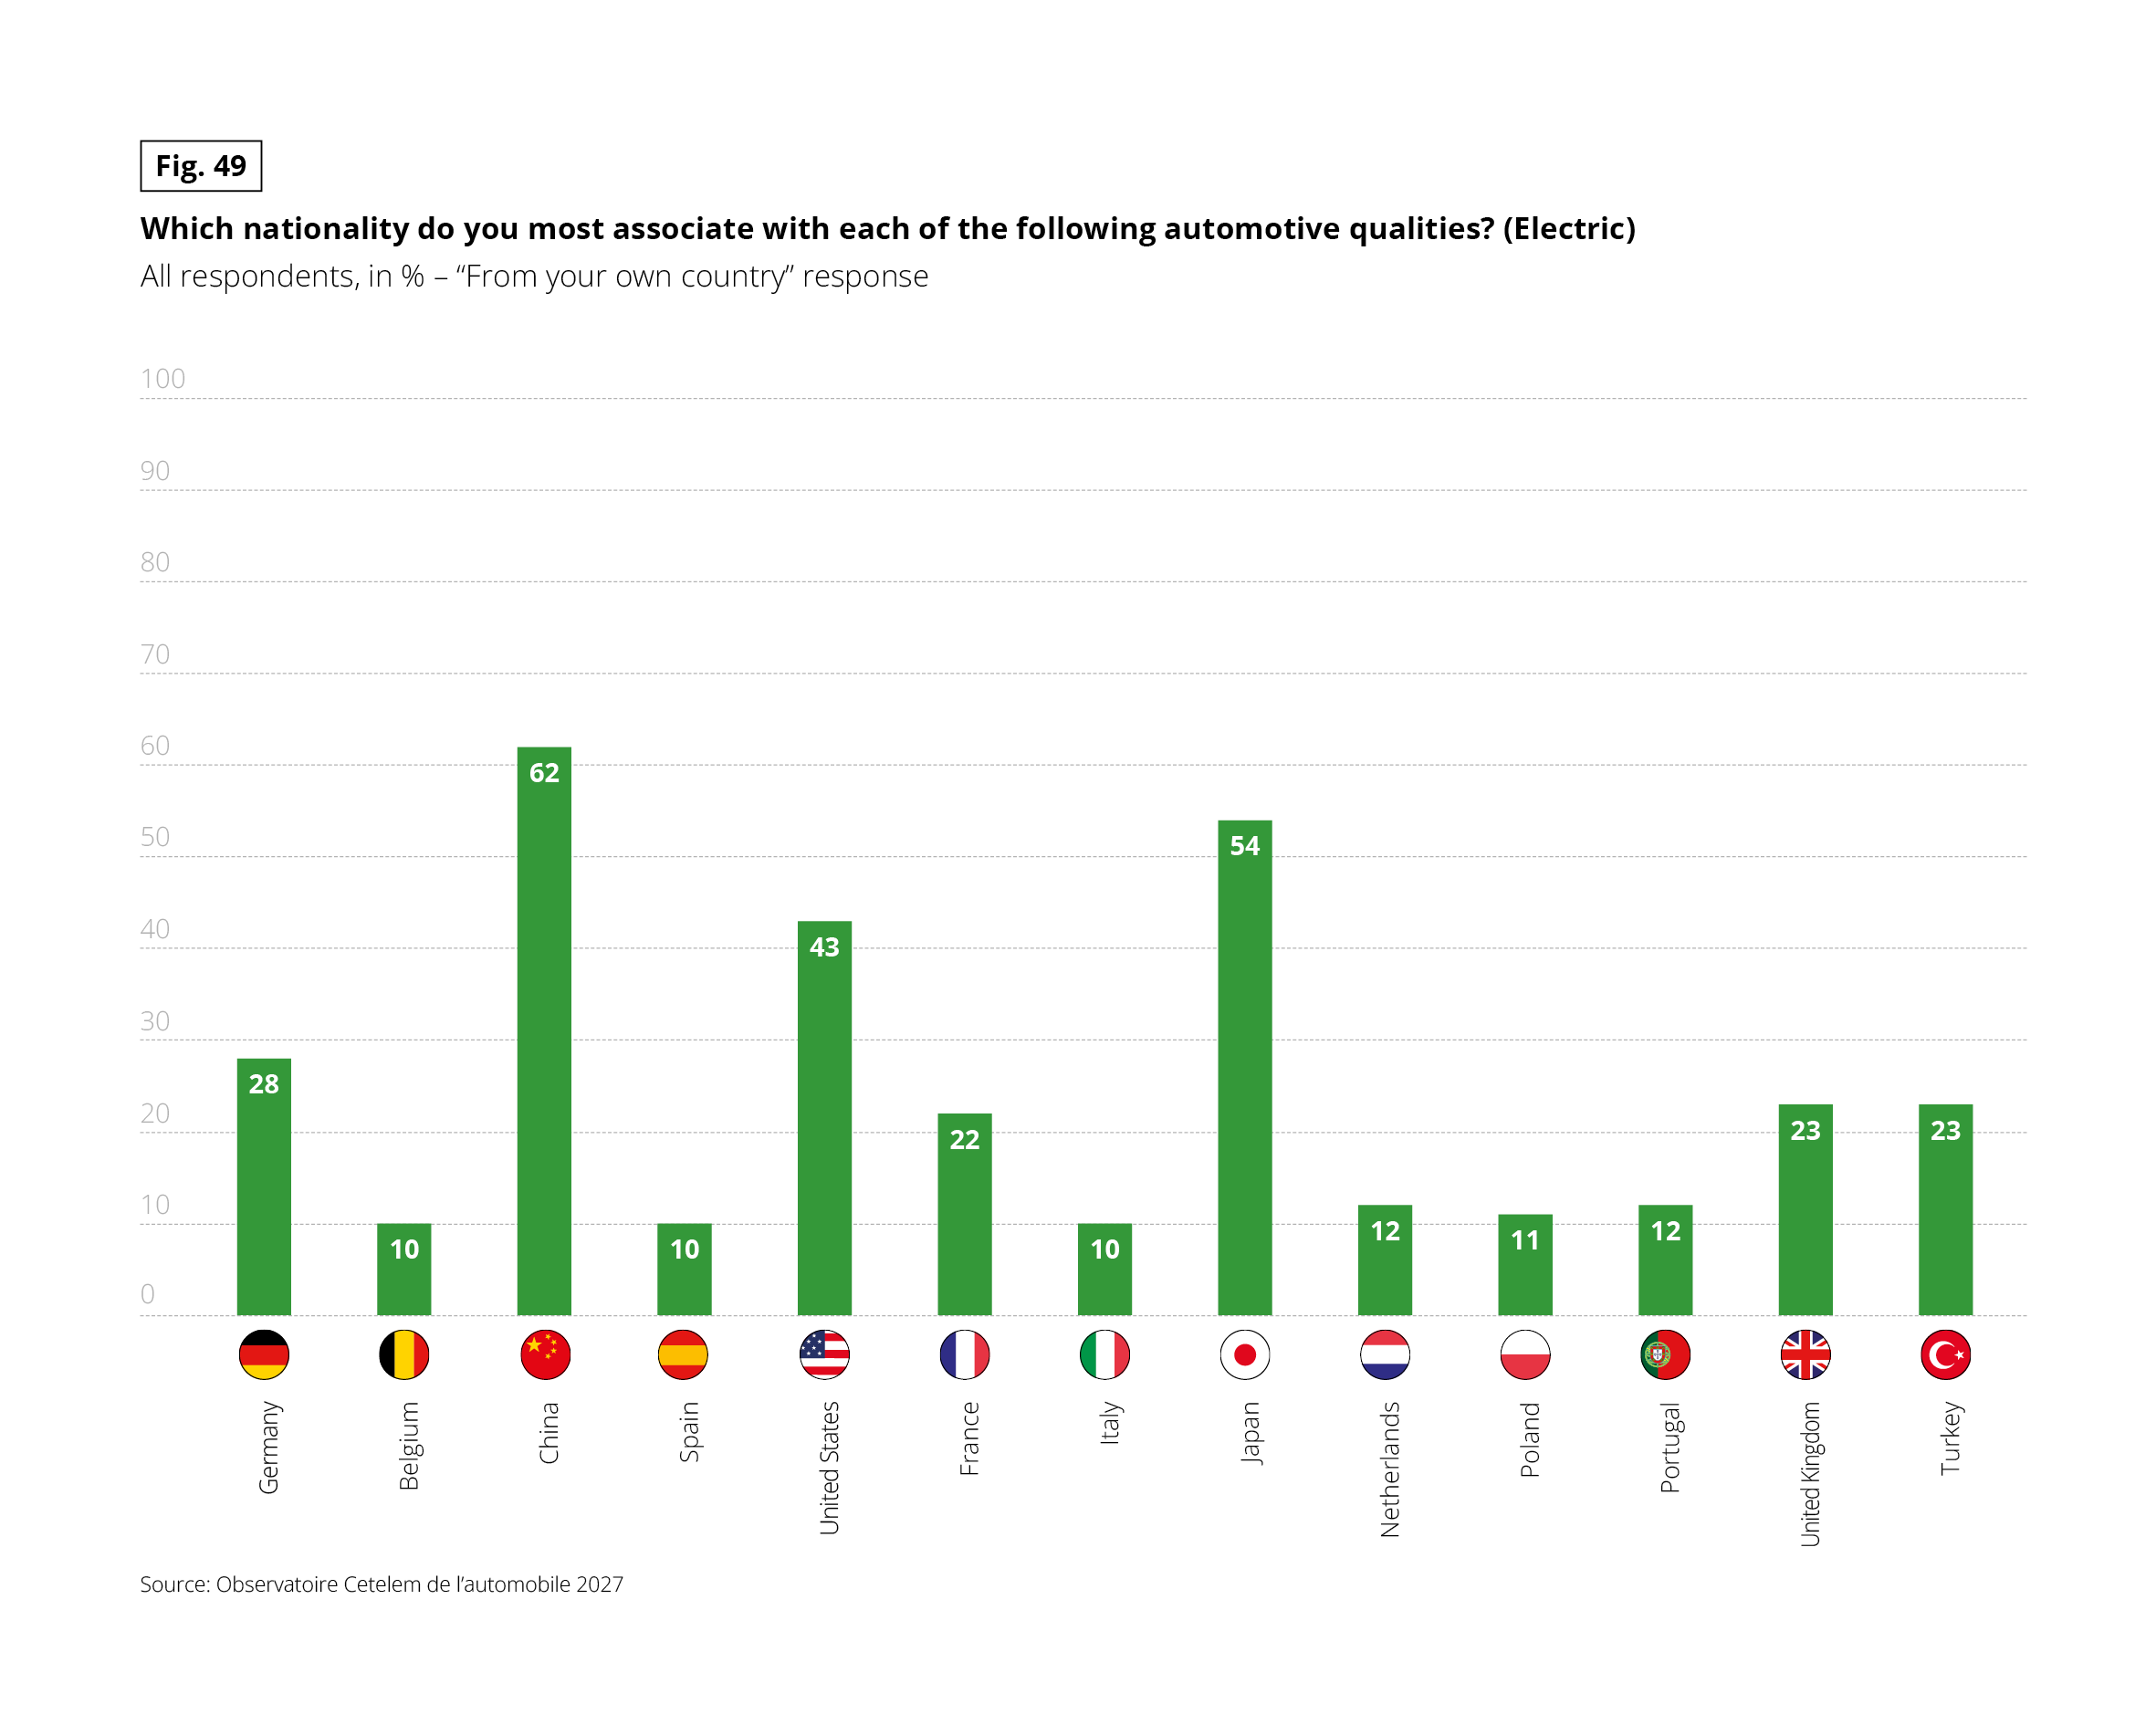 Vertical bar chart. Question: “Which nationality do you most associate with each of the following automotive qualities? (Electric)” Base: all respondents, in %, “From your own country” response.
Source: Observatoire Cetelem de l’automobile 2027.
Data by country: Germany 28%, Belgium 10%, China 62%, Spain 10%, United States 43%, France 22%, Italy 10%, Japan 54%, Netherlands 12%, Poland 11%, Portugal 12%, United Kingdom 23%, Turkey 23%. China (62%), Japan (54%) and the United States (43%) are the countries where respondents most often associate electric vehicles with their own country. Belgium, Spain and Italy are the lowest (10% each). No European average or total is shown on this figure.
Vertical bar chart. Question: “Which nationality do you most associate with each of the following automotive qualities? (Electric)” Base: all respondents, in %, “From your own country” response.
Source: Observatoire Cetelem de l’automobile 2027.
Data by country: Germany 28%, Belgium 10%, China 62%, Spain 10%, United States 43%, France 22%, Italy 10%, Japan 54%, Netherlands 12%, Poland 11%, Portugal 12%, United Kingdom 23%, Turkey 23%. China (62%), Japan (54%) and the United States (43%) are the countries where respondents most often associate electric vehicles with their own country. Belgium, Spain and Italy are the lowest (10% each). No European average or total is shown on this figure.
KEY FIGURES
- 3 in 4 motorists place importance on the size of the dealership and after-sales network
- 1 in 2 motorists would choose a more innovative car over an equivalent domestic model
- Nearly 4 in 10 motorists have turned to artificial intelligence for information and comparisons when choosing a vehicle
- 7 in 10 motorists highlight the dealership’s influence on their choice of brand
- 1 in 2 motorists intends to buy an electric or hybrid vehicle