
At home, a strong sense of security

 2 min
reading time
On this front, the contrast with household budgets is sharp: while energy bills provoke anxiety, security provides reassurance. As the ultimate private refuge, the home is where Europeans feel safest, making security one of their paramount priorities.
HIGH EXPECTATIONS OF SECURITY, BROADLY FULFILLED
Far from a luxury, security ranks as the second most important criterion when choosing a home, trailing only price, and is cited by 9 in 10 Europeans. In this respect, satisfaction levels are reassuringly high: a comparable proportion of respondents feel safe from break-ins or burglaries and express satisfaction with their home’s overall security. This sentiment reflects a genuinely positive reality rather than denial. Residential burglaries have been falling since 2015, and local neighbourhood crime is likewise on a downward trend.
Fig. 20 – Feeling of safety at home regarding the risk of intrusion or burglary
Download this infographic for your presentations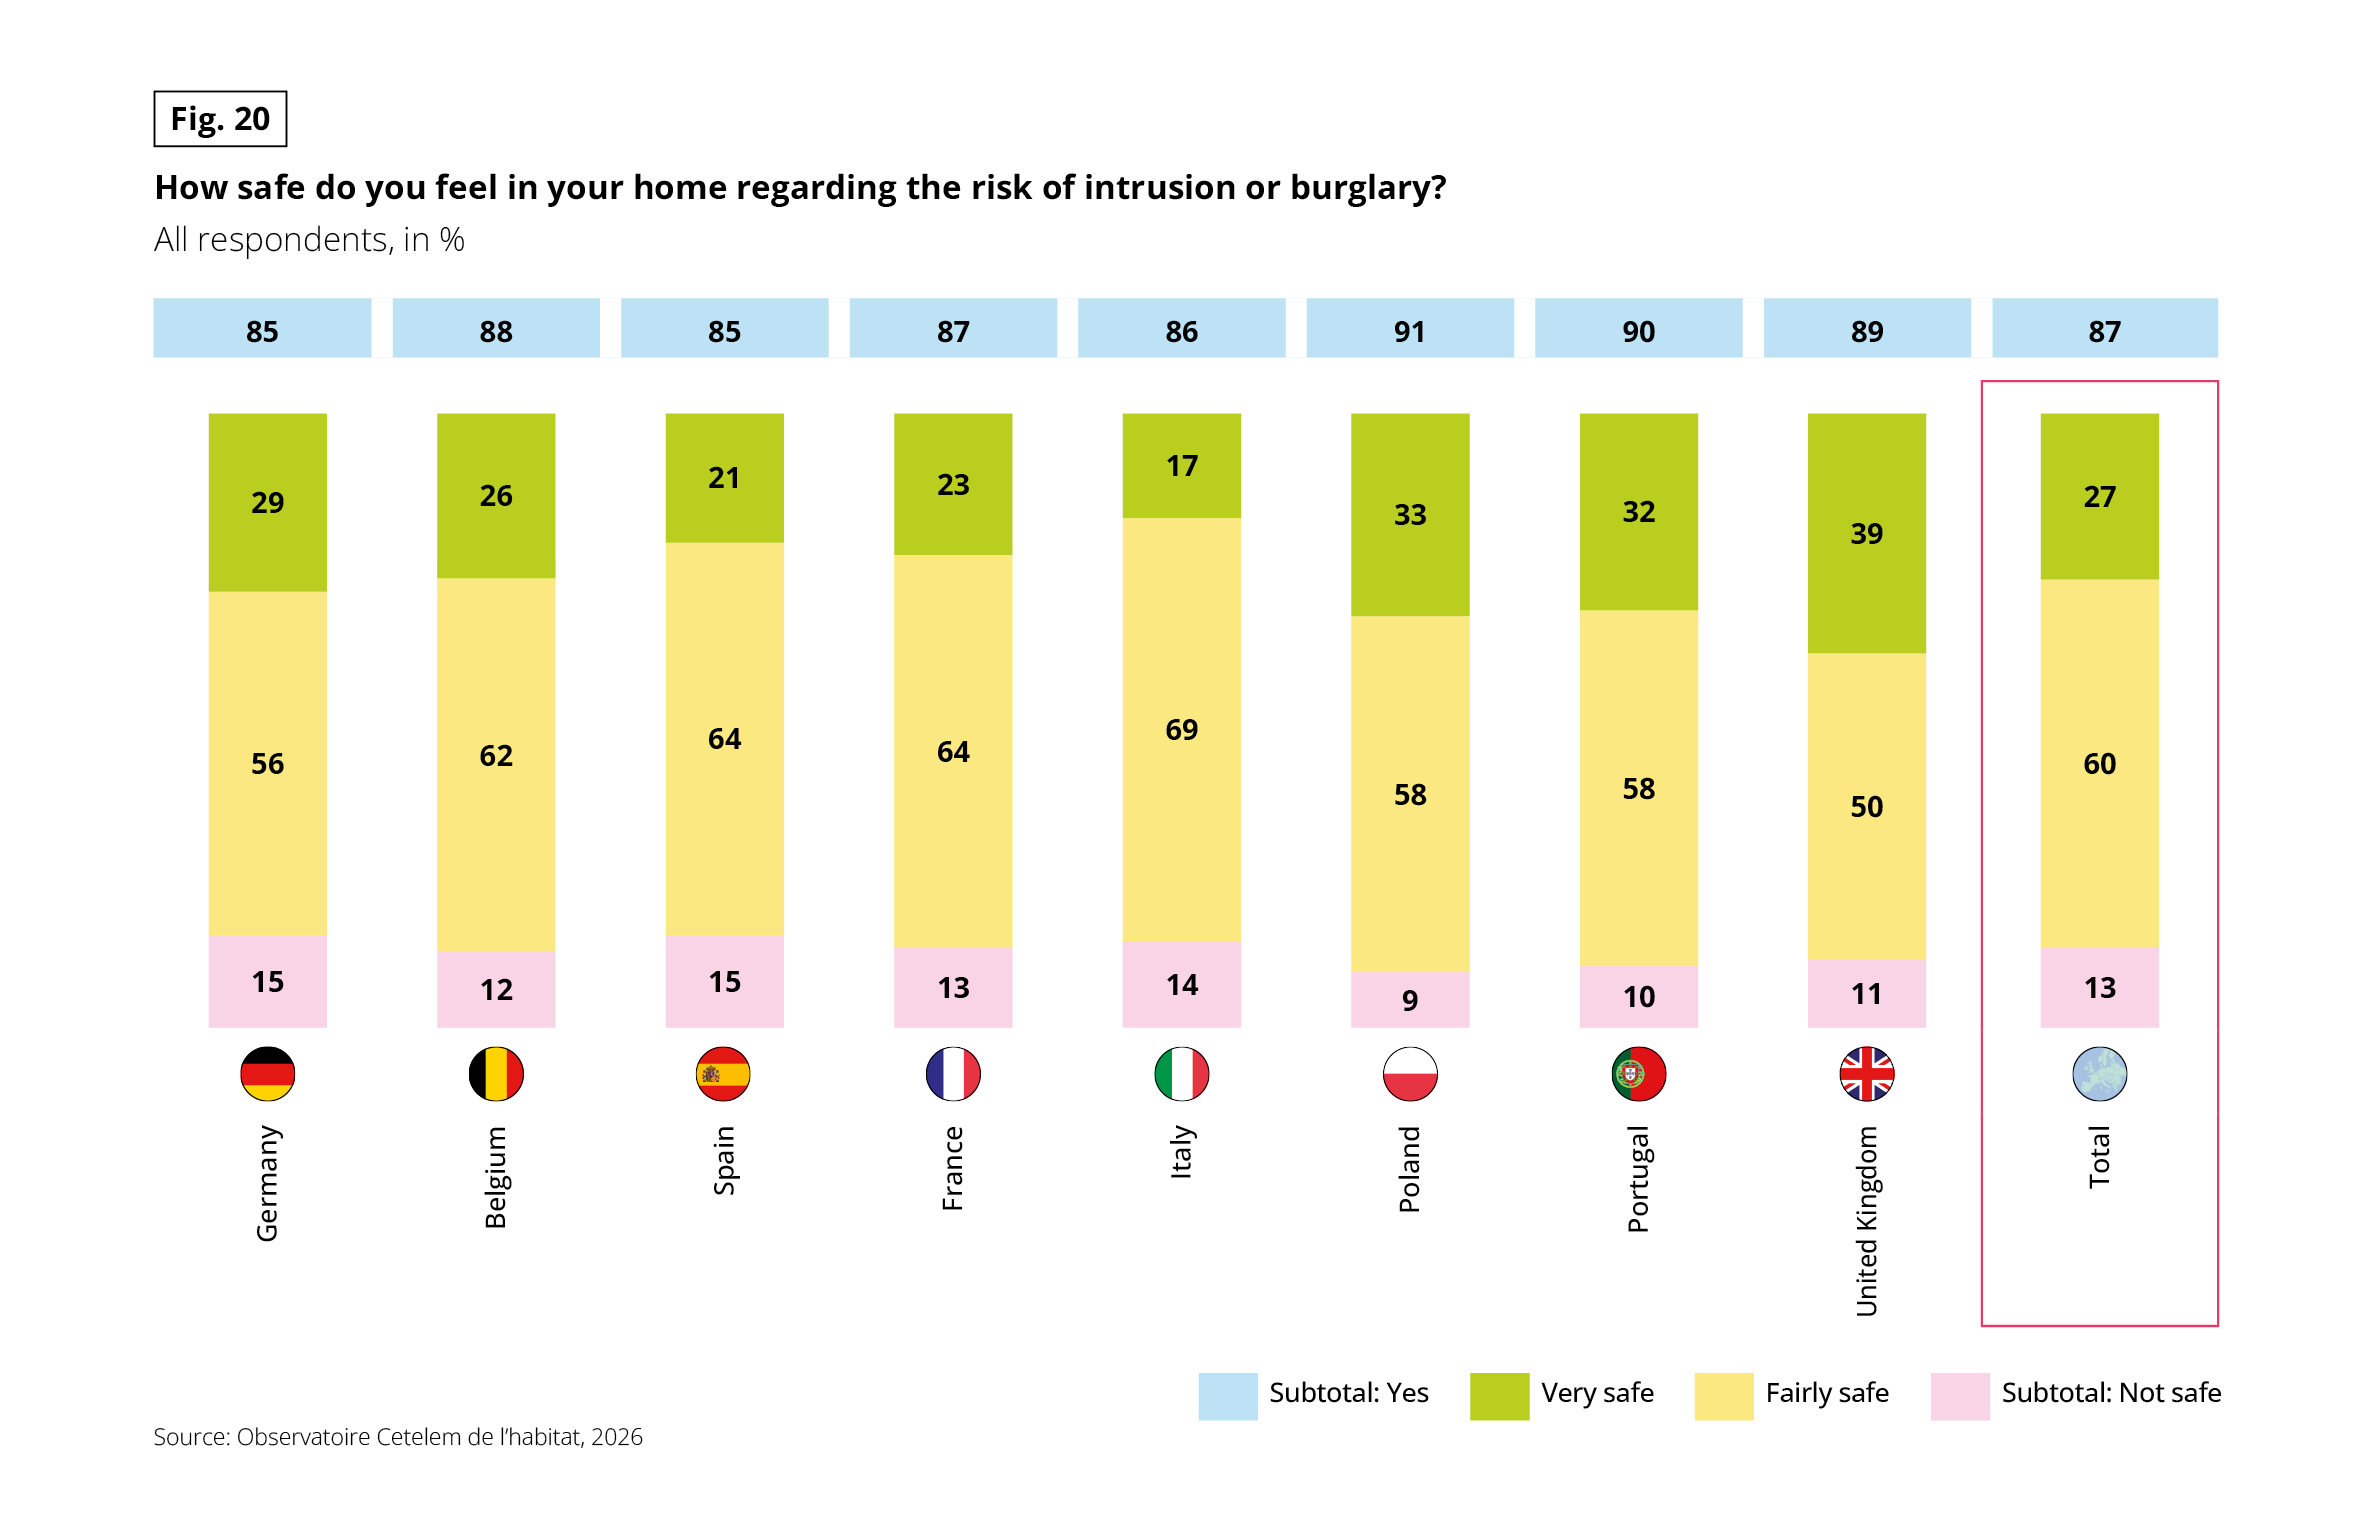 Stacked vertical bar chart. Question: “How safe do you feel in your home regarding the risk of intrusion or burglary?” Base: all respondents, in %. Each column splits into “Very safe”, “Fairly safe” and “Not safe”. The subtotal “Yes” (safe, very plus fairly) is shown above each column. Source: Observatoire Cetelem de l’habitat, 2026.
Data in the form very safe / fairly safe / not safe (safe subtotal):
• Germany: 29 / 56 / 15 (85)
• Belgium: 26 / 62 / 12 (88)
• Spain: 21 / 64 / 15 (85)
• France: 23 / 64 / 13 (87)
• Italy: 17 / 69 / 14 (86)
• Poland: 33 / 58 / 9 (91)
• Portugal: 32 / 58 / 10 (90)
• United Kingdom: 39 / 50 / 11 (89)
• Total: 27 / 60 / 13 (87)
Poland has the highest feeling of safety (91%). The United Kingdom has the highest share of “very safe” (39%) and Italy the lowest (17%).
National contrasts reveal far more than the European average. Poland and Portugal, with some of the lowest burglary and vandalism rates, report the greatest peace of mind. Mediterranean countries—Italy, France and Spain—are more cautious: while residents feel safe, they stop short of feeling entirely secure, reflecting a higher level of perceived crime.
Fig. 21 – Residential burglaries per 100,000 inhabitants, 2012–2023
Download this infographic for your presentations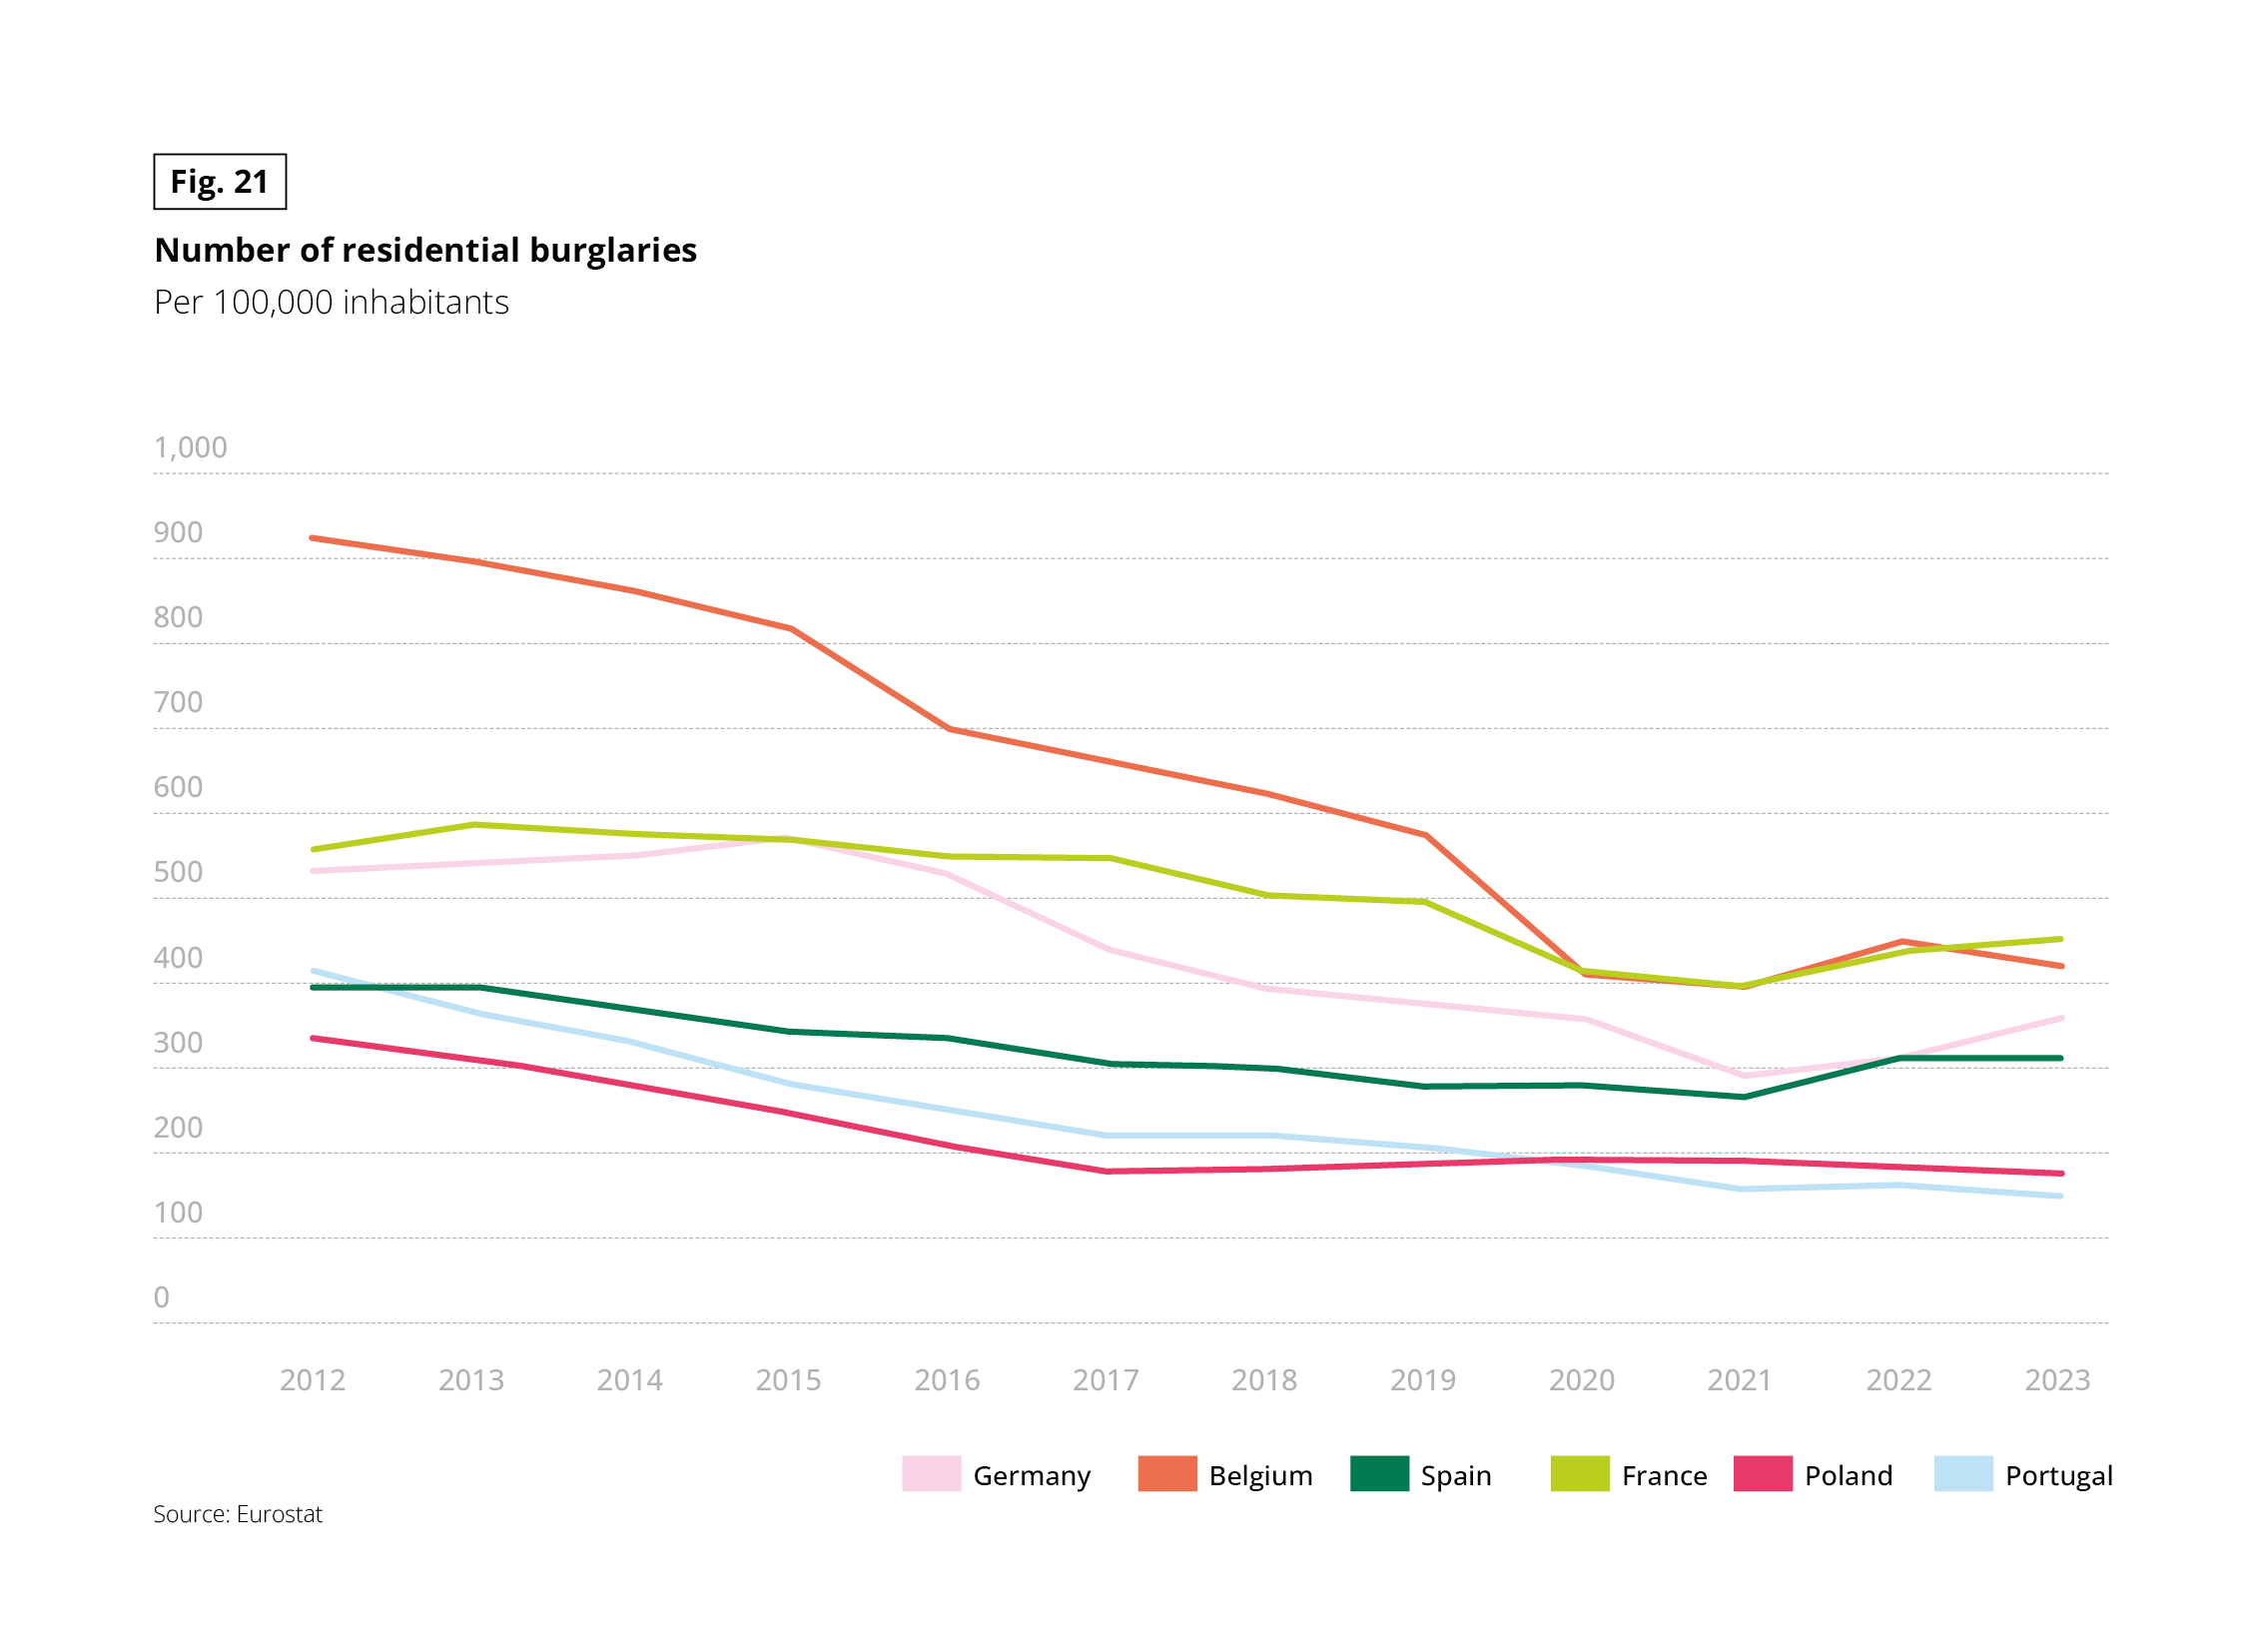 Line chart with six series: Germany, Belgium, Spain, France, Poland and Portugal. Unit: number of burglaries per 100,000 inhabitants. Years 2012 to 2023. Italy and the United Kingdom are not shown. Source: Eurostat.
Approximate values read from the chart, in the form 2012 / 2021 / 2023:
• Belgium: 925 / 395 / 420
• France: 555 / 395 / 450
• Germany: 530 / 290 / 355
• Spain: 395 / 265 / 310
• Portugal: 415 / 155 / 148
• Poland: 335 / 190 / 175
All countries decline overall. Belgium has the sharpest fall, from the highest level in 2012 to about the same level as France in 2020–2023. Germany, France, Belgium and Spain rise slightly after 2021, while Portugal and Poland keep declining or stay flat.
Fig. 22 – Share of households affected by local crime or vandalism, 2012–2023
Download this infographic for your presentations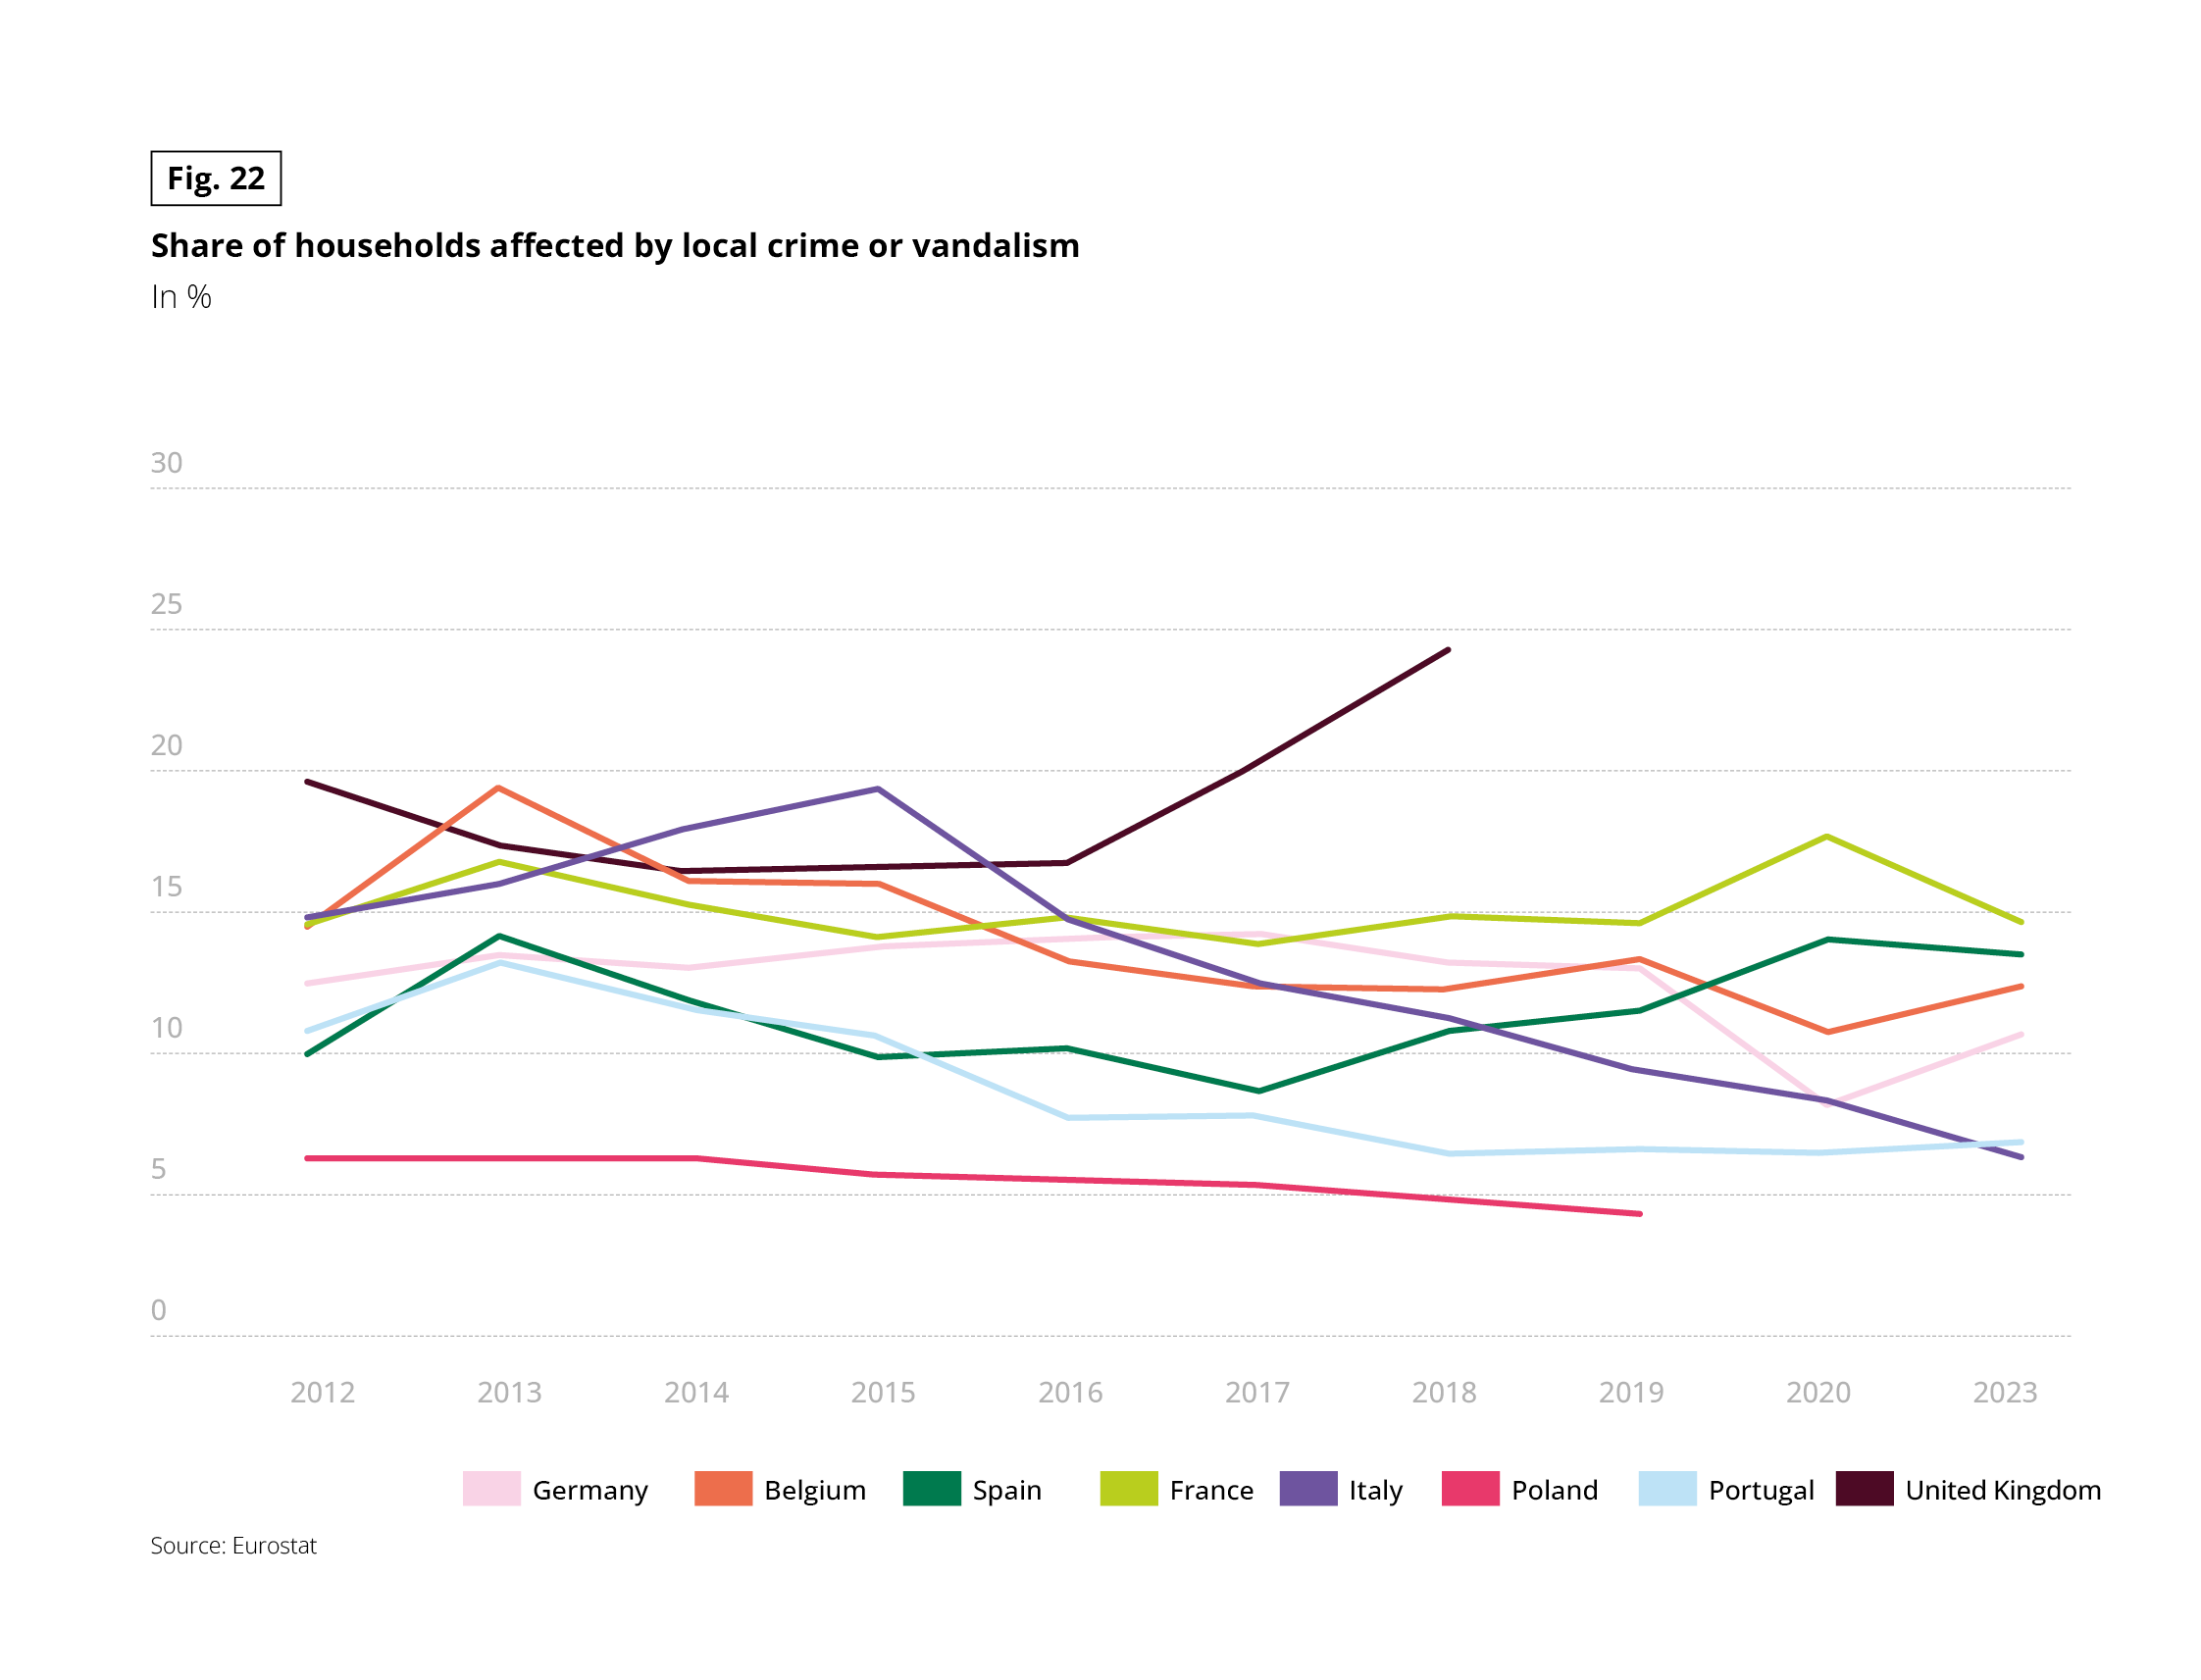 Line chart with eight series: Germany, Belgium, Spain, France, Italy, Poland, Portugal and United Kingdom. Unit: % of households. Years 2012 to 2023. The United Kingdom series stops in 2018 and Poland’s in 2019. Source: Eurostat.
Approximate values read from the chart, in the form 2012 / latest value:
• United Kingdom: 19.5 / 24 (2018)
• France: 14.5 / 14.5 (2023), peak of about 17.5 in 2020
• Spain: 10 / 13.5 (2023)
• Belgium: 14.5 / 12.3 (2023), peak of about 19.3 in 2013
• Germany: 12.5 / 10.7 (2023), low of about 8 in 2020
• Italy: 14.8 / 6.2 (2023), peak of about 19.3 in 2015
• Portugal: 10.7 / 6.8 (2023)
• Poland: 6.2 / 4.2 (2019)
The United Kingdom rises sharply from 2016. Italy shows the largest decline. Poland and Portugal are the lowest.
HOME SECURITY EQUIPMENT: DRIVING PEACE OF MIND
This peace of mind is by no means irrational. It is underpinned by security measures that nearly three quarters of Europeans consider adequate, and the link between the two is clear. Among those who feel very safe, nearly 9 in 10 believe they are well protected, compared with barely a third of the most concerned: effective security equipment and peace of mind reinforce one another. Yet such protection tracks household wealth, being more prevalent among homeowners, occupants of single-family houses, and older demographics. Perceived security thus implicitly mirrors the social fault lines seen in overall housing satisfaction.
Fig. 23 – Home adequately equipped against break-ins, by sense of security
Download this infographic for your presentations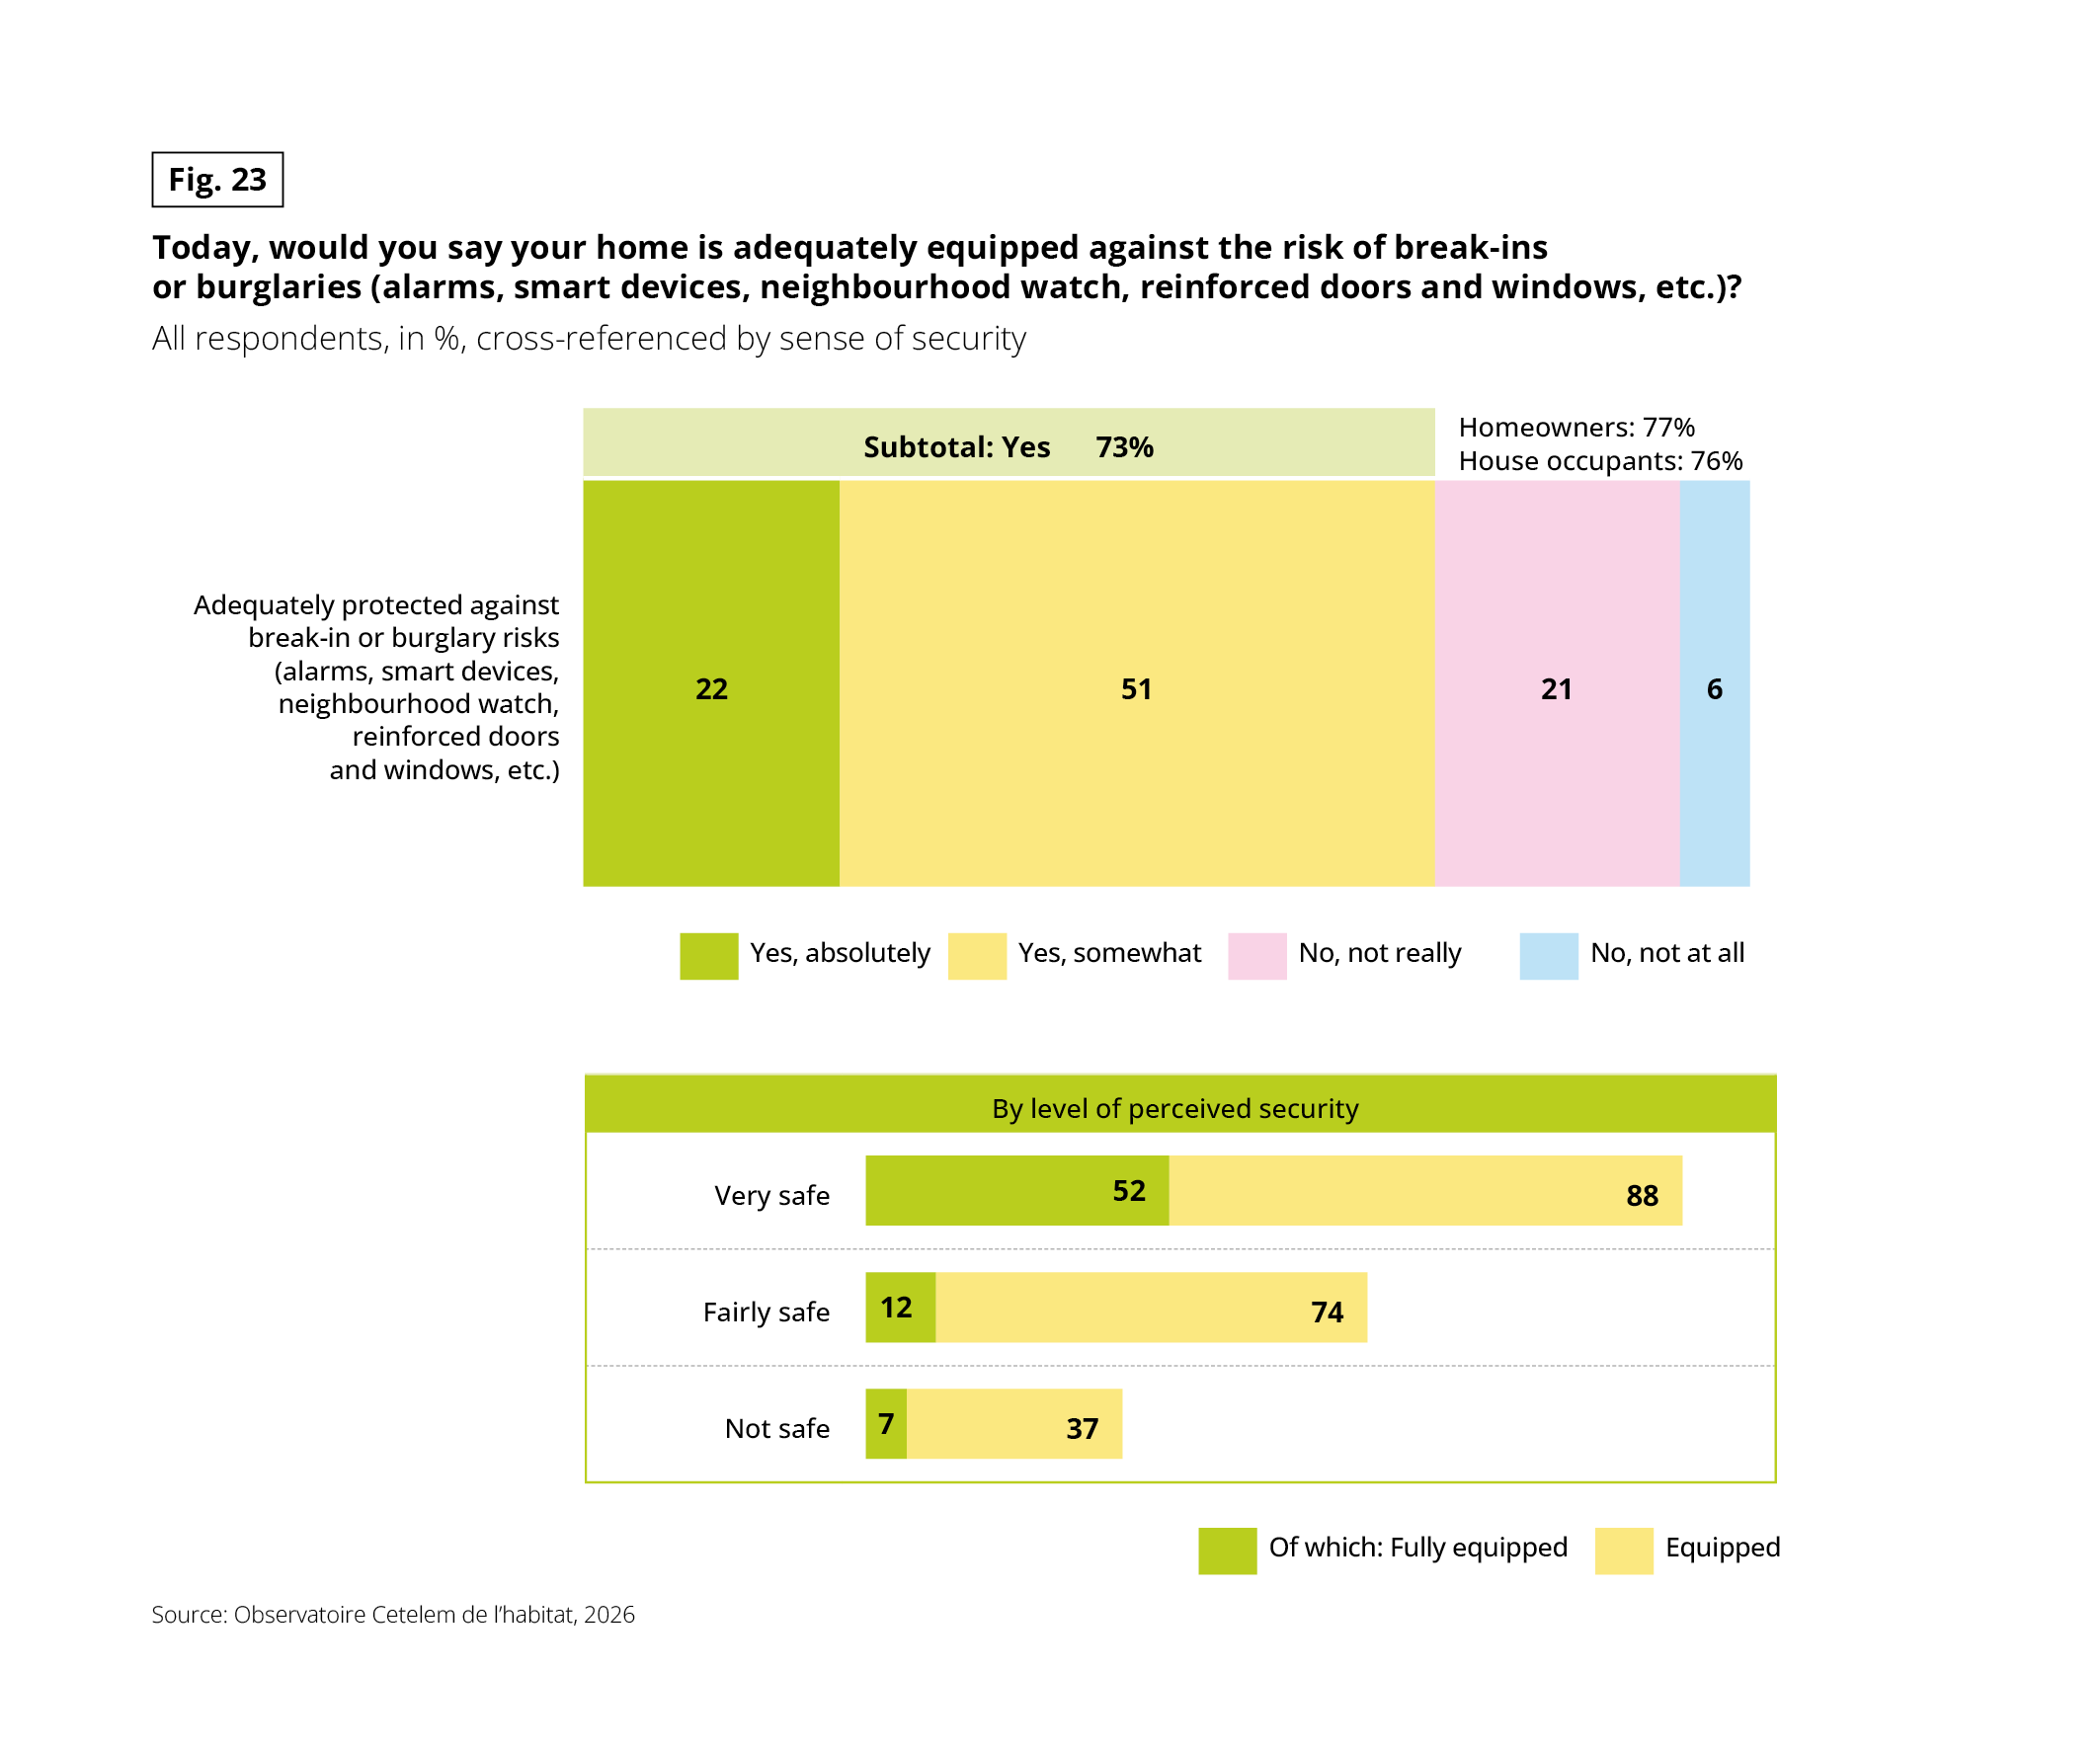 Stacked horizontal bar and cross-tabulation. Question: “Today, would you say your home is adequately equipped against the risk of break-ins or burglaries (alarms, smart devices, neighbourhood watch, reinforced doors and windows, etc.)?” Base: all respondents, in %. Source: Observatoire Cetelem de l’habitat, 2026.
Overall result: yes, absolutely 22%; yes, somewhat 51%; no, not really 21%; no, not at all 6%. Subtotal yes: 73%. Subtotals shown for subgroups: homeowners 77%, house occupants 76%.
By level of perceived security, in the form fully equipped / equipped (total):
• Very safe: 52 / 88
• Fairly safe: 12 / 74
• Not safe: 7 / 37
The better equipped a household is, the safer it feels. The gap between “very safe” and “not safe” is 51 points.
The home remains, above all, a safe haven. But security is no longer merely a matter of preventing break-ins; a quieter, far harder-to-manage danger is setting in for the long haul: climate change.