
A refuge increasingly tested by climate change


 5 min
reading time
SOARING TEMPERATURES
Climate change is no longer a distant threat to European housing; it is a measurable reality. Since 2012, average annual temperatures have risen in all eight countries studied, climbing by between 0.8°C and 1.4°C depending on the country.
Fig. 24 – Average annual surface temperature, 2012 and 2024
Download this infographic for your presentations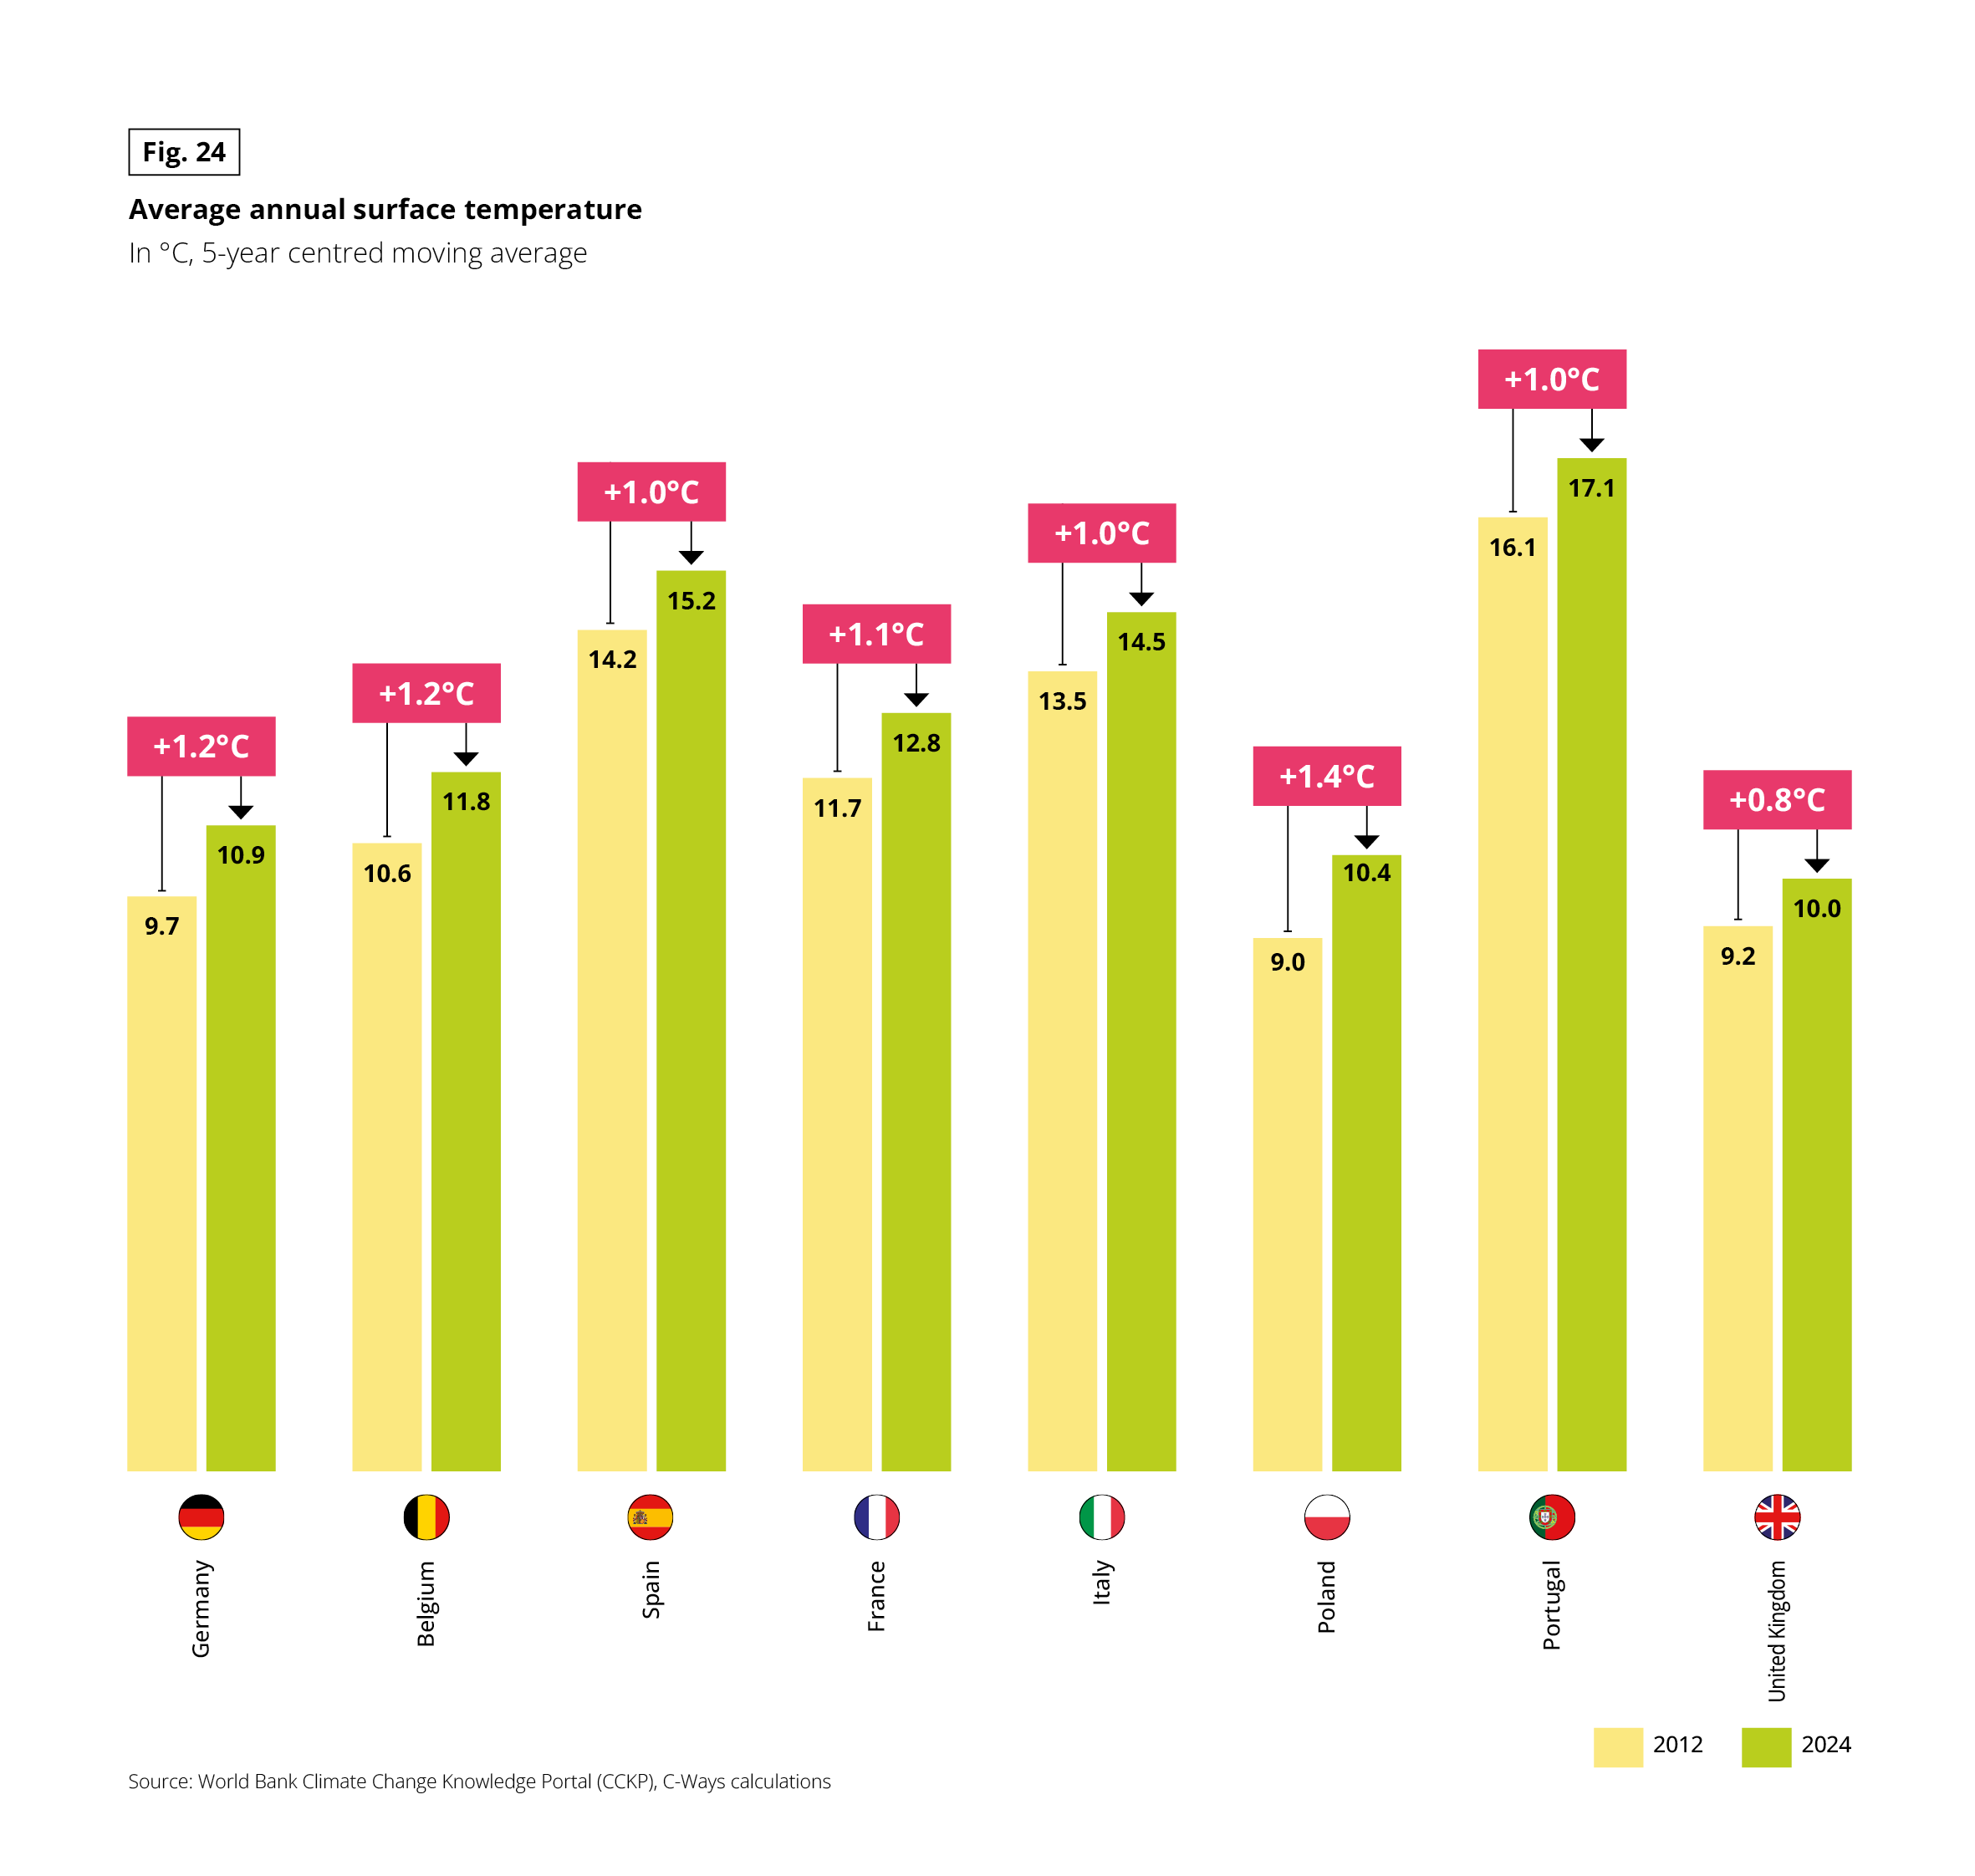 Grouped vertical bar chart. Unit: °C, 5-year centred moving average. Two series, 2012 and 2024, with the increase shown above each pair. Source: World Bank Climate Change Knowledge Portal (CCKP), C-Ways calculations.
Data in the form 2012 / 2024 (increase):
• Germany: 9.7 / 10.9 (+1.2°C)
• Belgium: 10.6 / 11.8 (+1.2°C)
• Spain: 14.2 / 15.2 (+1.0°C)
• France: 11.7 / 12.8 (+1.1°C)
• Italy: 13.5 / 14.5 (+1.0°C)
• Poland: 9.0 / 10.4 (+1.4°C)
• Portugal: 16.1 / 17.1 (+1.0°C)
• United Kingdom: 9.2 / 10.0 (+0.8°C)
Poland warms the most (+1.4°C) and the United Kingdom the least (+0.8°C). Portugal is the hottest country in both years and Poland the coolest in 2012.
In practical terms, this warming has triggered a surge in high-heat days. France now registers 68 days a year above 25°C (2019–2024 average), a 25% increase compared with 2012–2017. Belgium records 45 days, nearly double its previous figure. Further South, the number of high-heat days rises even further: 119 days per year in Spain, and 129 in Portugal.(1)
The summer of 2026 served as a brutal reminder that climate change has become a daily reality for European households. The first warning sign came in late May, with an unprecedented early-season heatwave across Western Europe: France recorded its hottest May day on record and issued its first-ever amber heatwave alert in the month of May. Neighbouring countries were not spared: Portugal (40.3°C) and the UK both broke national temperature records for May, while Spain suffered 101 heat-related deaths in May alone, a record since tracking began.
It was in late June, however, that the heat reached unprecedented intensity. A heat dome triggered one of the most severe heatwaves ever recorded in Europe, surpassing the intensity of August 2003.(2)
Numerous countries shattered their all-time high temperature records, and France experienced its hottest day ever recorded on 24 June, with a national daily average close to 30°C. Across the continent, more than 1,300 excess deaths were attributed to this single heatwave event.(3)
Designed for a milder climate, Europe’s housing stock is now being put to the test for a significant portion of the year. Faced with these hazards, Europeans harbour varying concerns regarding their homes.
(1) Source: ETCCDI (Expert Team on Climate Change Detection and Indices). (2) Source: Météo-France. (3) Source: World Health Organization.
CLIMATE FEARS ALIGN WITH REAL-WORLD RISKS
Asked for the first time this year which climate hazards they consider their home most exposed to, half of Europeans believe they face at least two climate risks.
This sense of vulnerability is particularly acute among those who bear direct financial responsibility for the building: homeowners (around 55%) feel more exposed than tenants (48%), as do house occupants (55%) compared with apartment residents (49%).
Breaking down the specific hazards, 4 in 10 cite extreme heat, which ranks top ahead of wind and storms (36%), extreme cold (29%) and hail (22%); flooding, drought, wildfires and ground movement follow further behind. Here again, concerns mirror the reality of each housing type. Heat is a greater worry for apartment dwellers (44%) than for those in houses (35%), extending the lower summer comfort levels already observed in multi-family buildings. Conversely, wind and storms weigh heaviest on houses (40%, compared with 32% for apartments), given their greater roof exposure. Drought, which causes foundation cracking, is likewise more feared among house residents (21%).
Fig. 25 – Climate risks to which respondents consider their home most exposed
Download this infographic for your presentations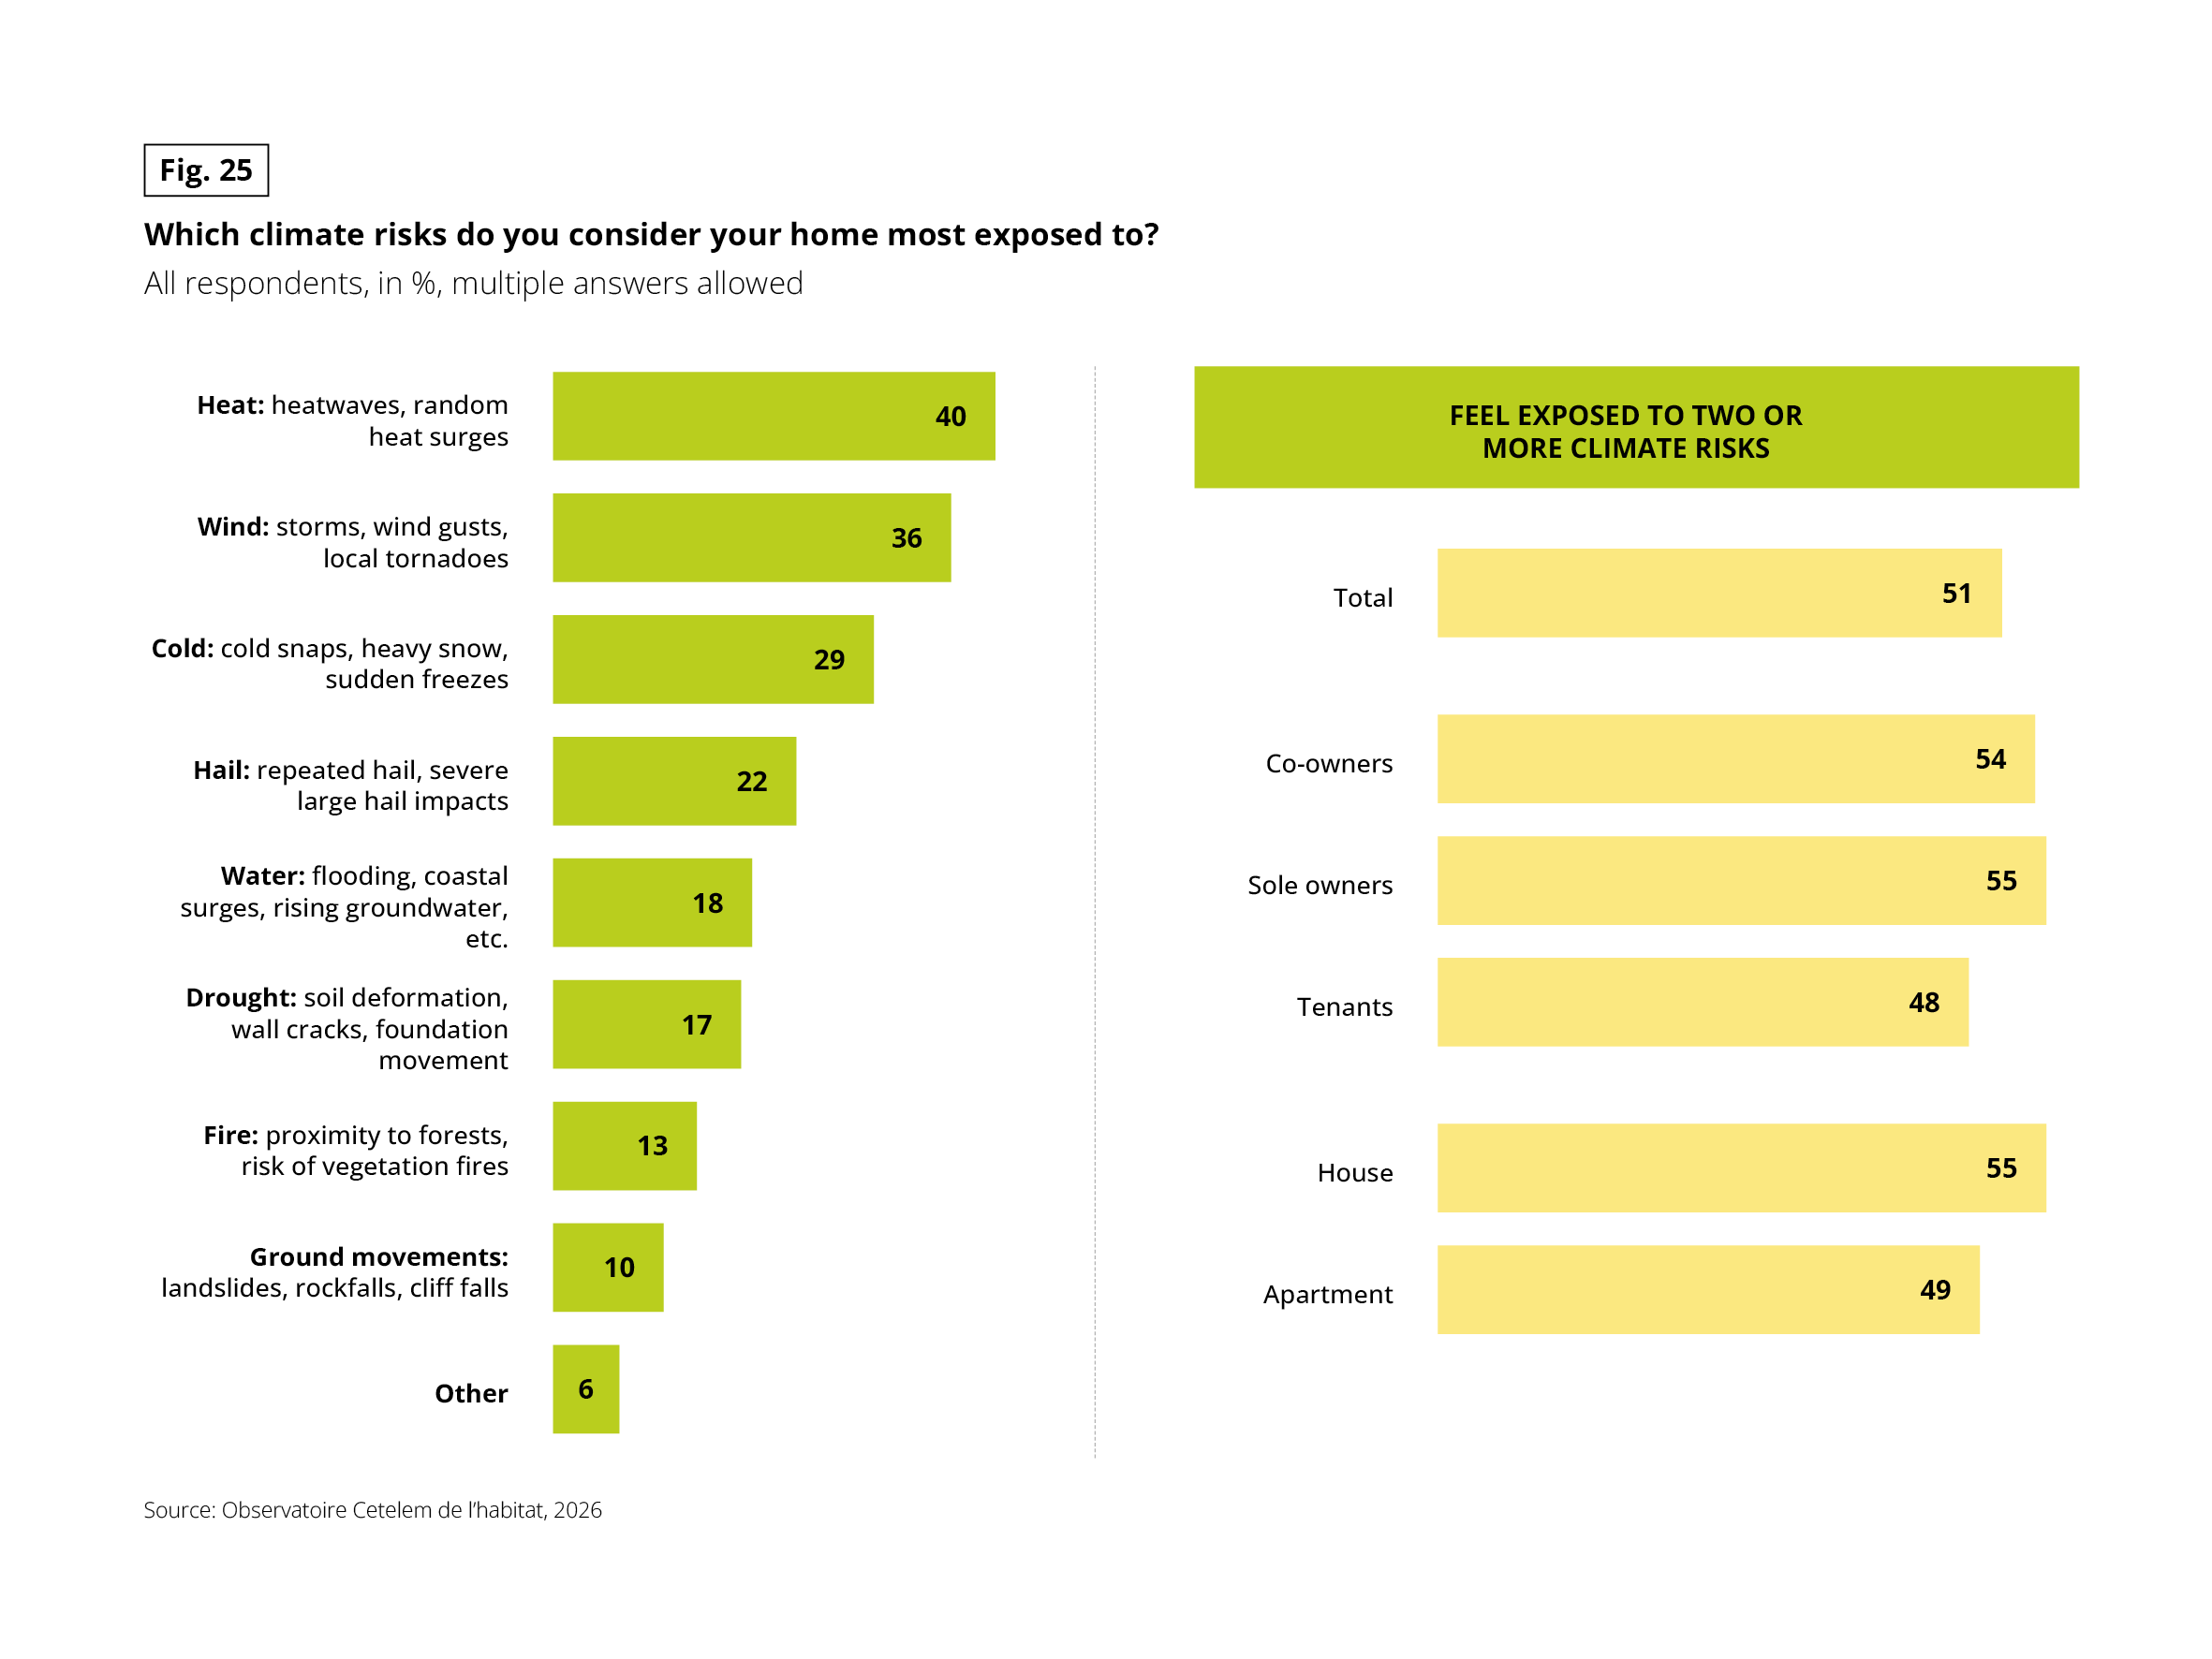 Two horizontal bar charts. Question: “Which climate risks do you consider your home most exposed to?” Base: all respondents, in %, multiple answers allowed. Source: Observatoire Cetelem de l’habitat, 2026.
Risks cited, from most to least:
• Heat (heatwaves, random heat surges): 40%
• Wind (storms, wind gusts, local tornadoes): 36%
• Cold (cold snaps, heavy snow, sudden freezes): 29%
• Hail (repeated hail, severe large hail impacts): 22%
• Water (flooding, coastal surges, rising groundwater, etc.): 18%
• Drought (soil deformation, wall cracks, foundation movement): 17%
• Fire (proximity to forests, risk of vegetation fires): 13%
• Ground movements (landslides, rockfalls, cliff falls): 10%
• Other: 6%
Share feeling exposed to two or more climate risks: total 51%; co-owners 54%; sole owners 55%; tenants 48%; house occupants 55%; apartment occupants 49%.
Behind this overall average lie starkly different national anxieties, a faithful reflection of geography and recent weather extremes. Heatwaves dominate almost everywhere, troubling half of all French and Spanish respondents. The UK is the notable outlier: only half as concerned about heat, it is the sole country where extreme cold heads the list of fears.
Further south, concerns diverge: the Portuguese fear storms above all and are most attuned to wildfire risk, whereas hail, a sharp echo of recent severe storms across the peninsula, preoccupies over 1 in 3 Italians.
Fig. 26 – Top 3 climate risks reported by residents, by country
Download this infographic for your presentations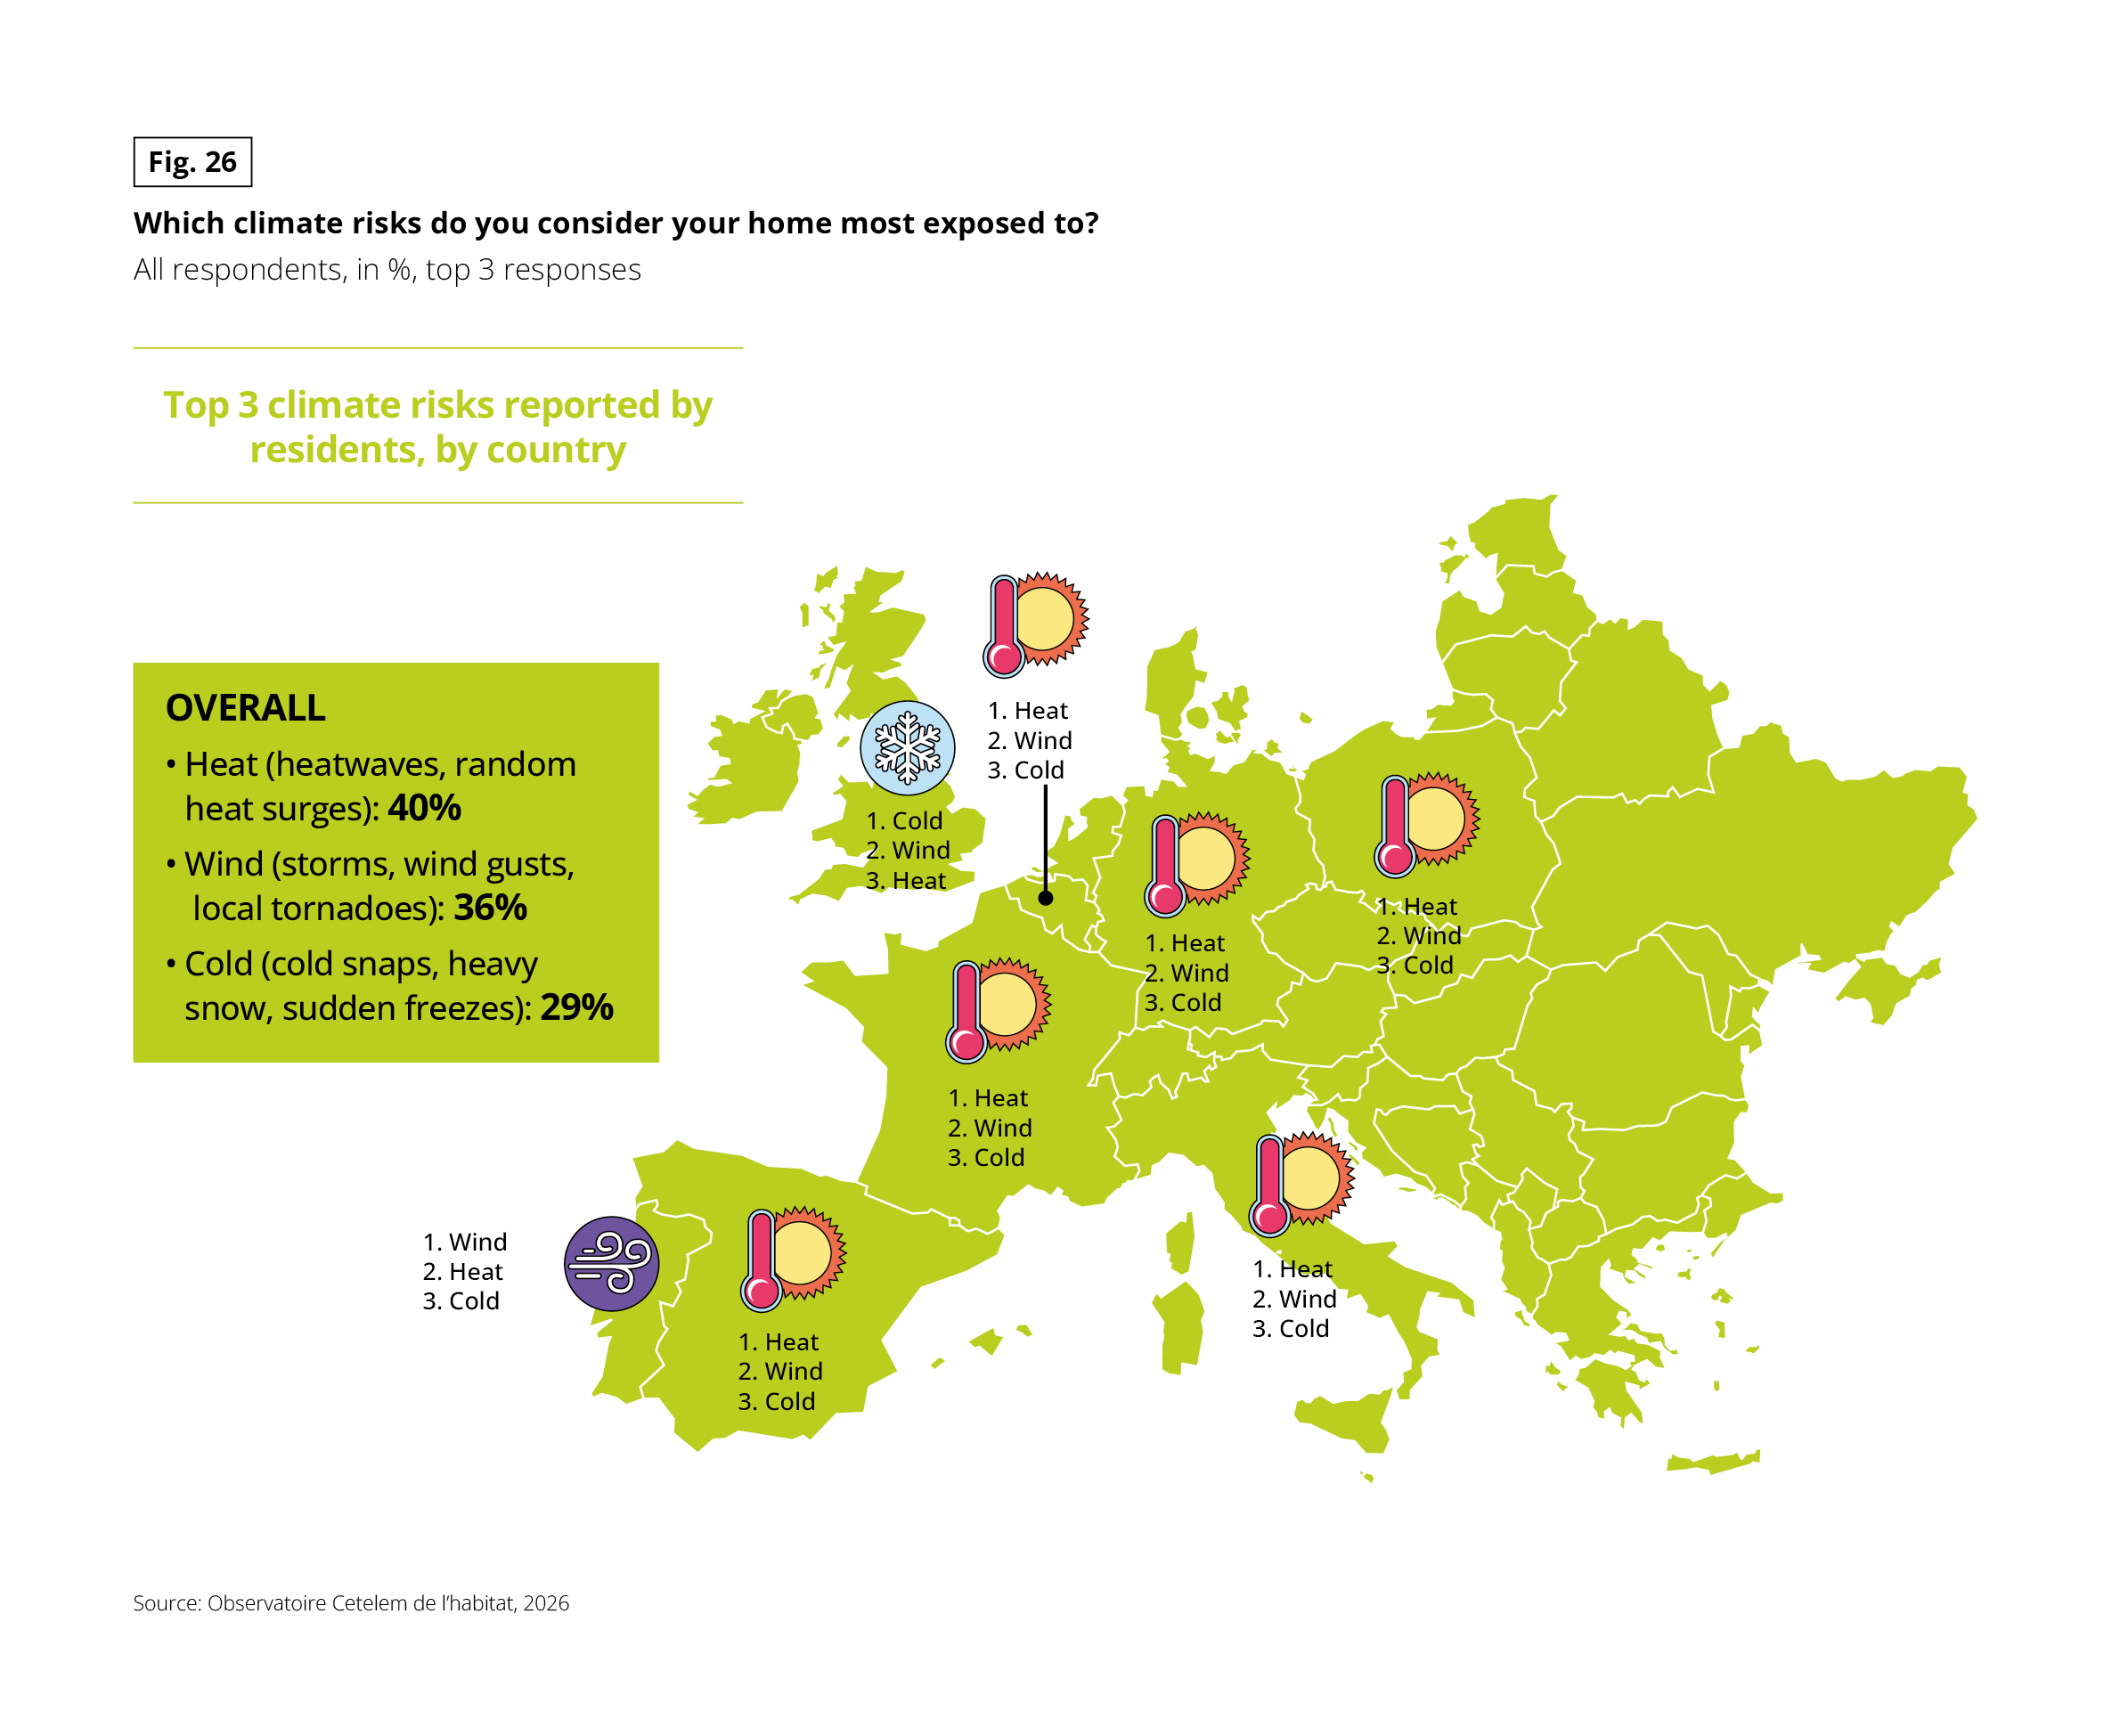 Map of Europe with a ranking of three climate risks per country. Question: “Which climate risks do you consider your home most exposed to?” Base: all respondents, in %, top 3 responses. A box gives the overall results. Source: Observatoire Cetelem de l’habitat, 2026.
Overall: heat 40%, wind 36%, cold 29%.
Ranking by country, in the form first / second / third:
• Germany: heat / wind / cold
• Belgium: heat / wind / cold
• Spain: heat / wind / cold
• France: heat / wind / cold
• Italy: heat / wind / cold
• Poland: heat / wind / cold
• Portugal: wind / heat / cold
• United Kingdom: cold / wind / heat
Heat is the first risk in six of the eight countries. Portugal (wind first) and the United Kingdom (cold first) are the exceptions. Belgium’s label is linked to the country by a line on the map.
Far from being mere perceptions, these fears are borne out by the data. The ND-GAIN index, which gauges housing-sector climate vulnerability (combining climate sensitivity, physical hazard exposure and building-stock adaptive capacity) is rising across all countries.
Belgium records the highest housing vulnerability score (47.1/100 in 2023), reflecting its ageing housing stock. Spain (37/100) remains the least vulnerable. France (41.5/100), alongside the UK, is seeing the sample’s fastest rate of deterioration (+2.3 and +2.4 points, respectively, since 2012).
Fig. 27 – ND-GAIN housing sector climate vulnerability index, 2012 and 2023
Download this infographic for your presentations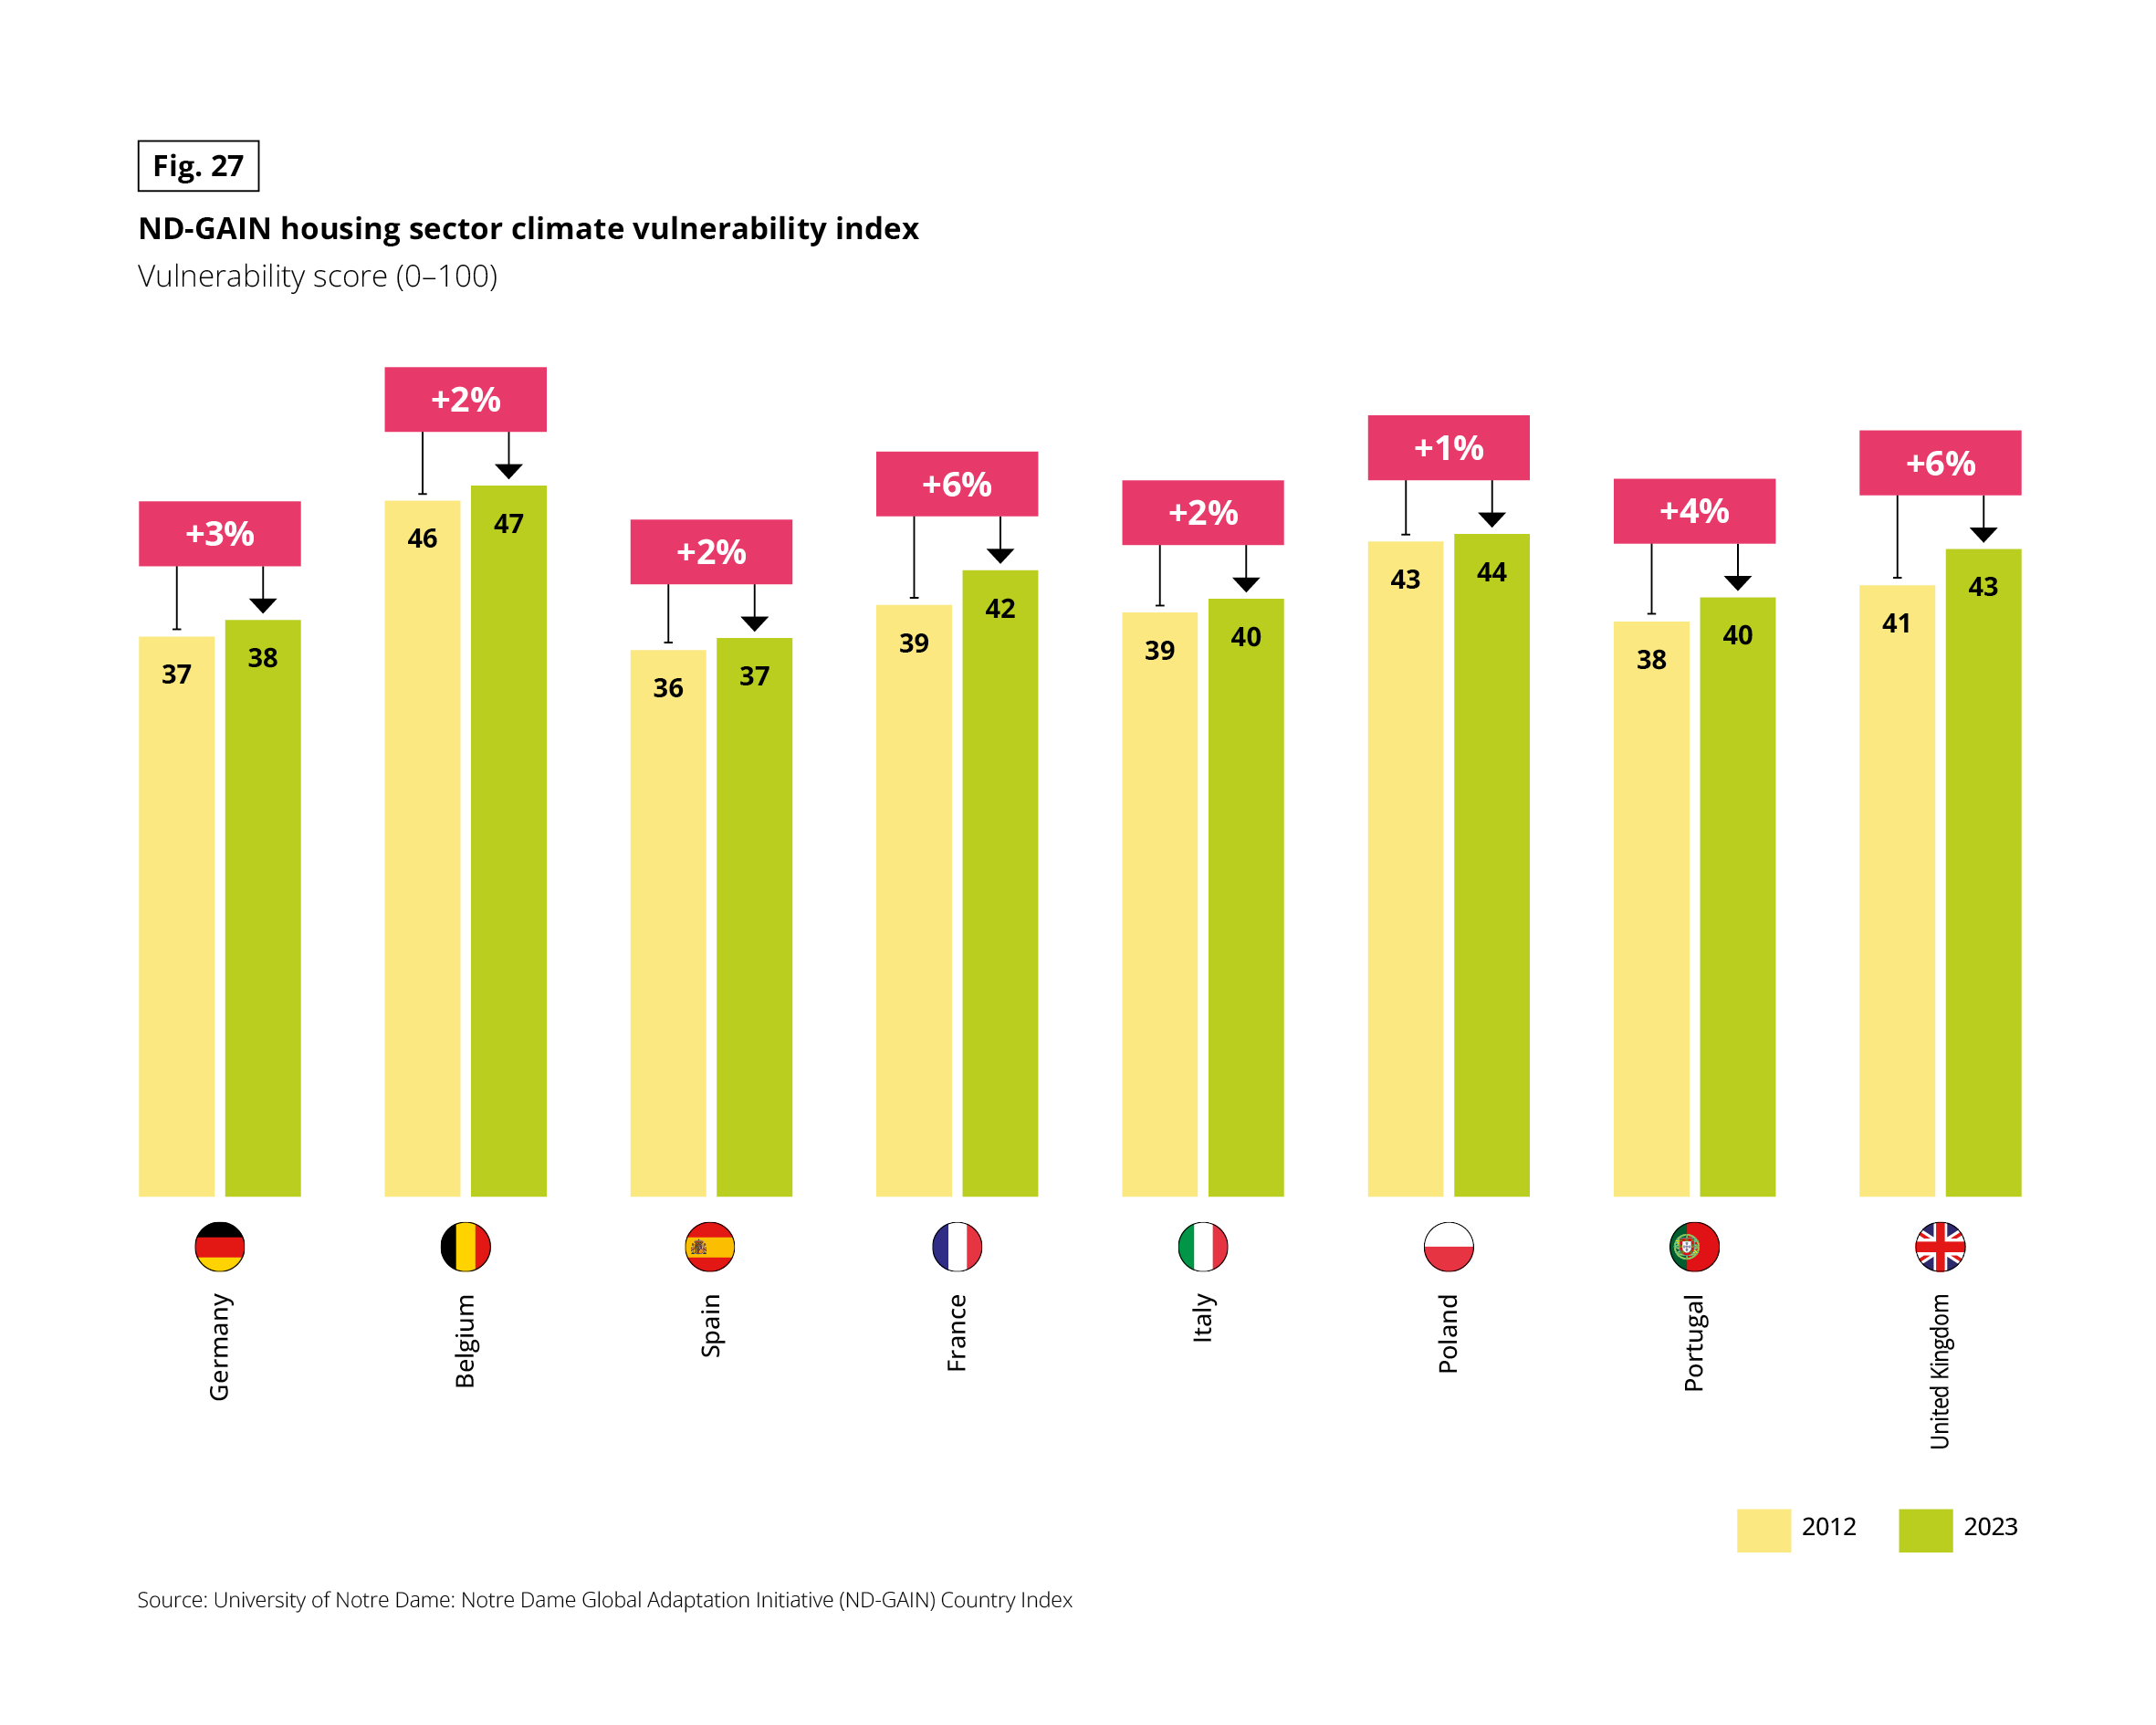 Grouped vertical bar chart. Unit: vulnerability score from 0 to 100. Two series, 2012 and 2023, with the increase shown above each pair. Source: University of Notre Dame, Notre Dame Global Adaptation Initiative (ND-GAIN) Country Index.
Data in the form 2012 / 2023 (increase):
• Germany: 37 / 38 (+3%)
• Belgium: 46 / 47 (+2%)
• Spain: 36 / 37 (+2%)
• France: 39 / 42 (+6%)
• Italy: 39 / 40 (+2%)
• Poland: 43 / 44 (+1%)
• Portugal: 38 / 40 (+4%)
• United Kingdom: 41 / 43 (+6%)
Vulnerability rises everywhere. France and the United Kingdom have the largest increases (+6%). Belgium has the highest score and Spain the lowest in 2023.
HOUSING ILL-PREPARED FOR CLIMATE RISKS
Faced with this growing exposure, just over 2 in 3 Europeans consider their home sufficiently equipped to withstand climate hazards. Yet barely 16% feel “completely” satisfied, a sign of fragile confidence.
Country-by-country comparisons reveal stark contrasts: Spain and the UK report the highest readiness levels (73%), whereas France (63%) and Portugal (62%) trail behind.
Fig. 28 – Home sufficiently equipped to withstand climate risks
Download this infographic for your presentations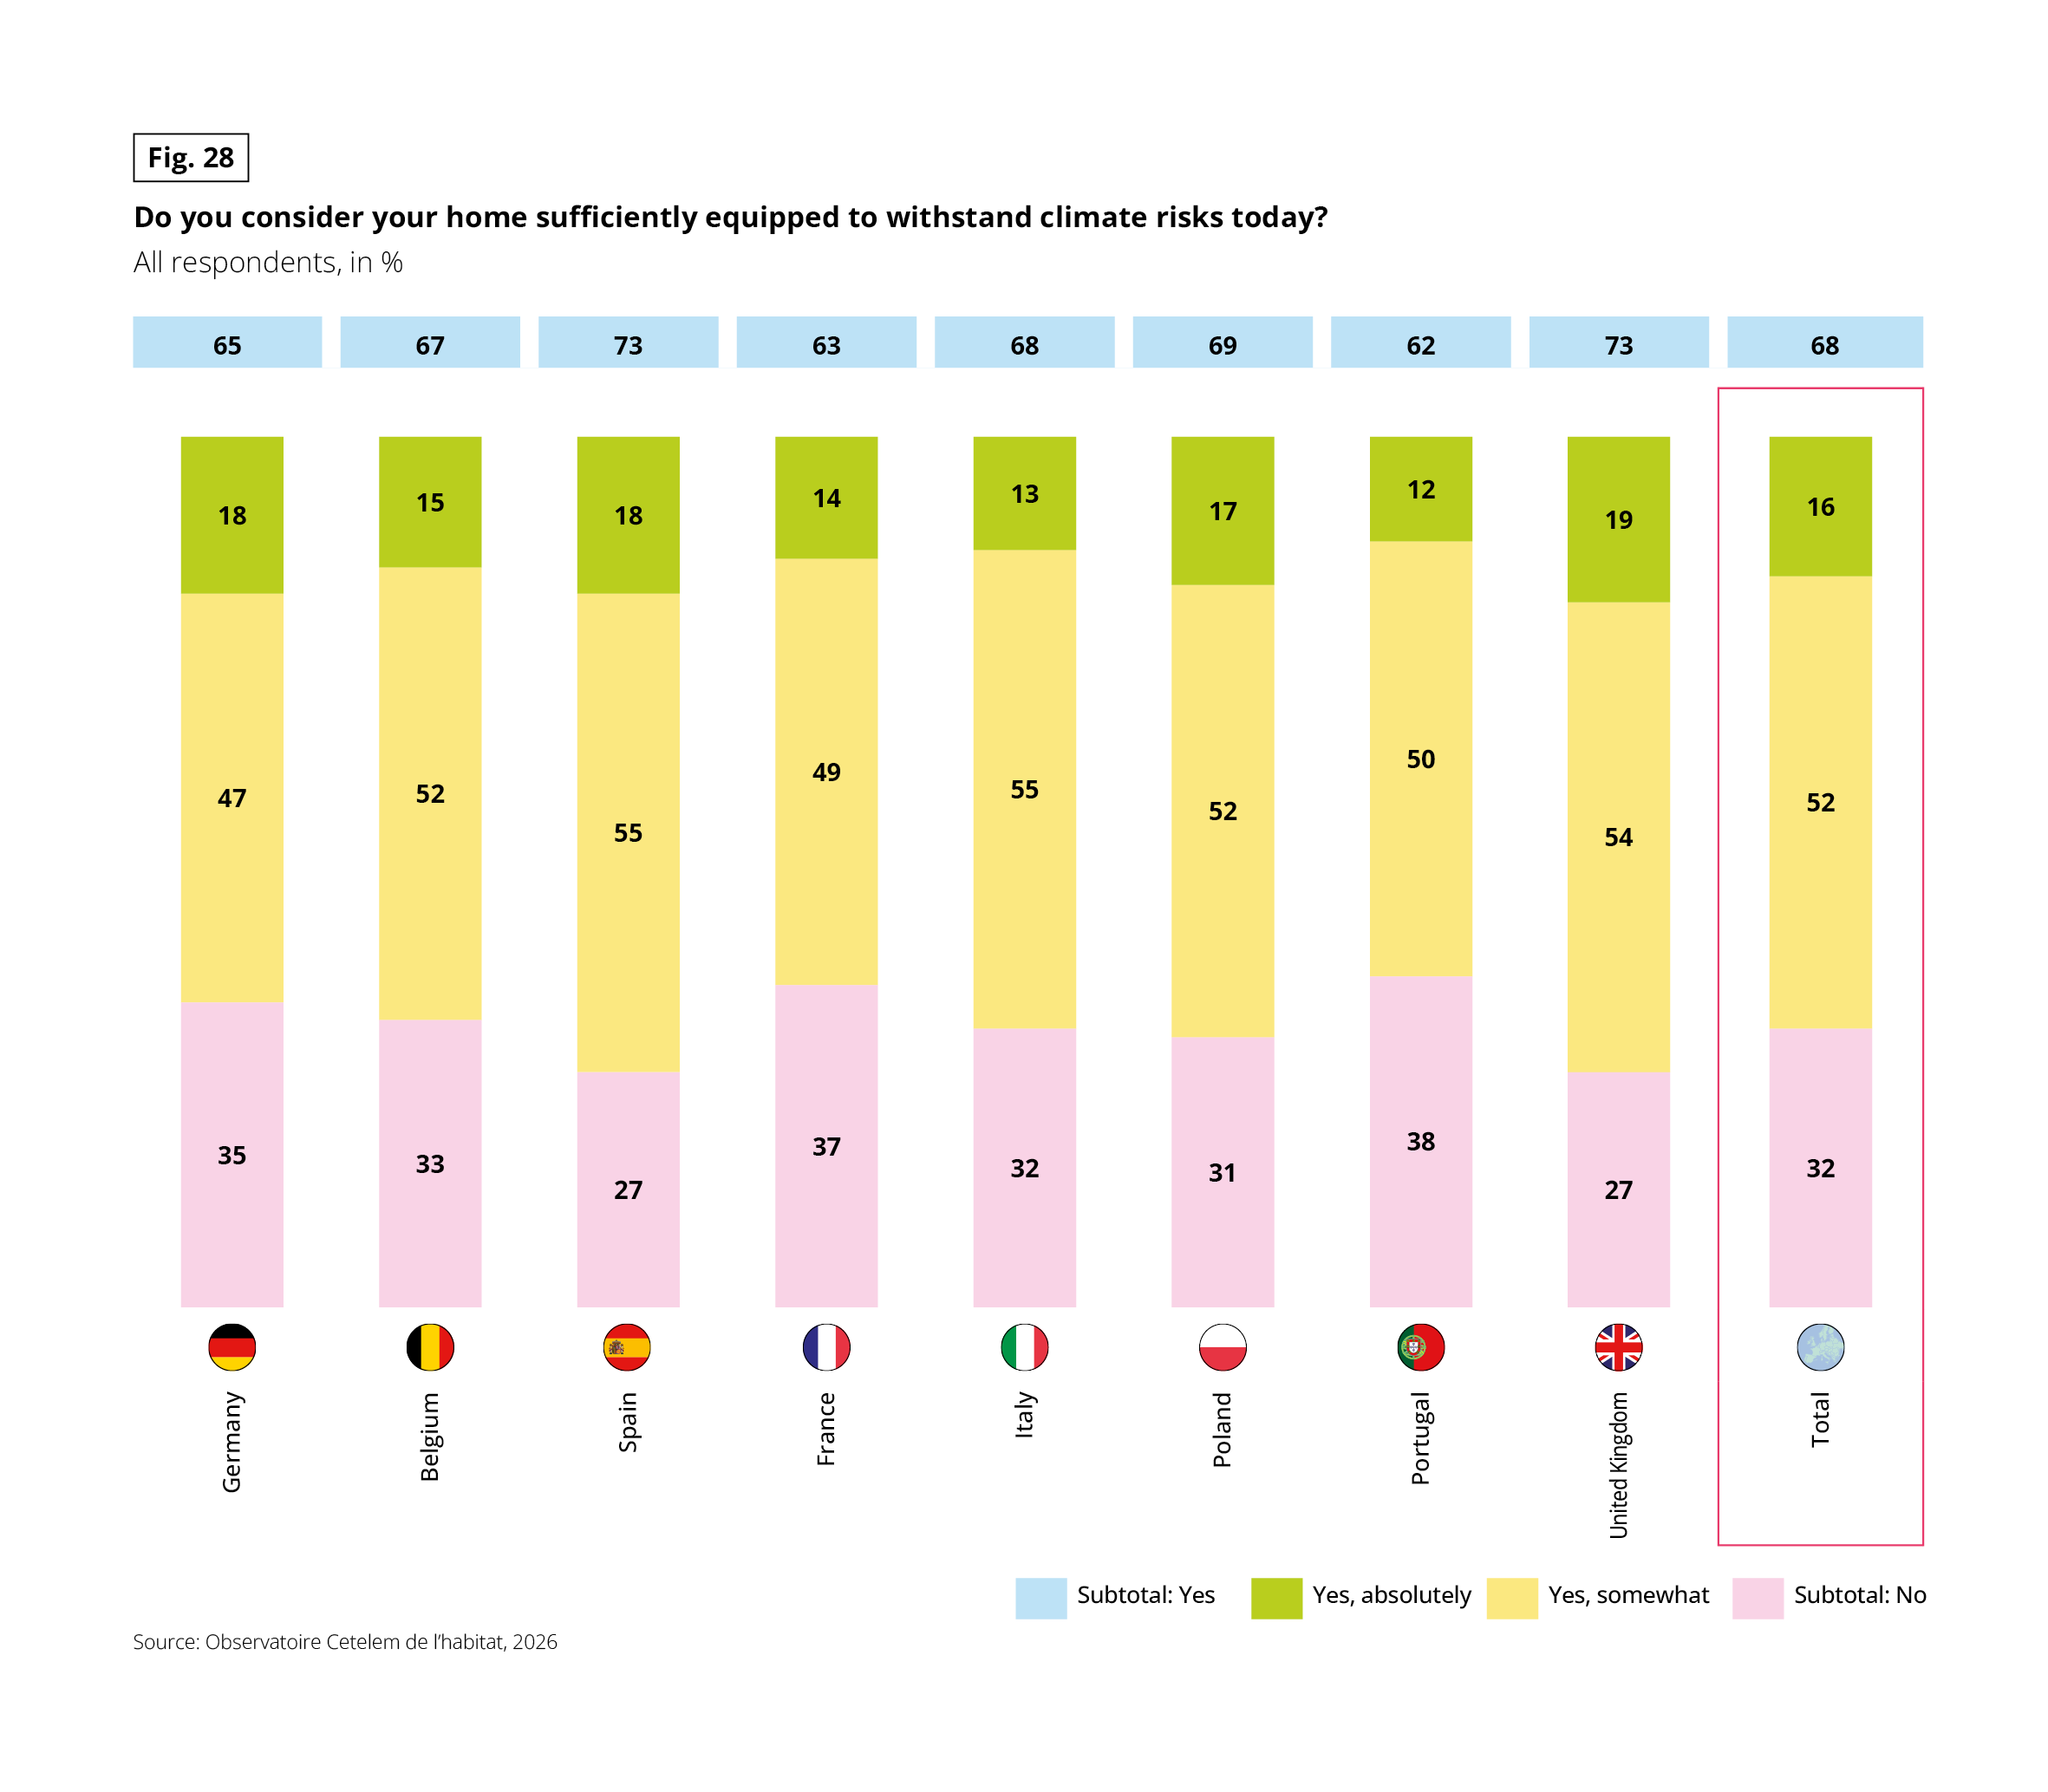 Stacked vertical bar chart. Question: “Do you consider your home sufficiently equipped to withstand climate risks today?” Base: all respondents, in %. Each column splits into “Yes, absolutely”, “Yes, somewhat” and “No”. The subtotal “Yes” is shown above each column. Source: Observatoire Cetelem de l’habitat, 2026.
Data in the form yes absolutely / yes somewhat / no (yes subtotal):
• Germany: 18 / 47 / 35 (65)
• Belgium: 15 / 52 / 33 (67)
• Spain: 18 / 55 / 27 (73)
• France: 14 / 49 / 37 (63)
• Italy: 13 / 55 / 32 (68)
• Poland: 17 / 52 / 31 (69)
• Portugal: 12 / 50 / 38 (62)
• United Kingdom: 19 / 54 / 27 (73)
• Total: 16 / 52 / 32 (68)
Spain and the United Kingdom are the most confident (73%). Portugal and France have the highest shares of “no” (38% and 37%).
Herein lies the paradox: the French, who report the highest combined perceived exposure to heat and drought, are also among the least convinced of their home’s resilience.
Spain presents the exact opposite: equally worried about heatwaves, it nevertheless considers itself among the best prepared. There, anxiety reflects not a lack of readiness, but a sharp awareness of risk forged by decades of adapting Mediterranean buildings to the heat (air conditioning, shutters, summer insulation).
Nor is this merely a matter of perception. Smoothed over 30 years to filter out anomaly years, climate-related economic losses now exceed €50 per capita annually in almost every Western European country studied. This mismatch between risk, preparedness and tangible cost underscores the sheer scale of the challenge facing Europe’s housing stock.
Annual losses can nevertheless spike dramatically: reaching €1,006 per capita in Belgium in 2021 (flooding) and €373 per capita in Spain in 2024 (the Valencia DANA floods).
Fig. 29 – Annual normalised economic losses from climate events, 2012 and 2024
Download this infographic for your presentations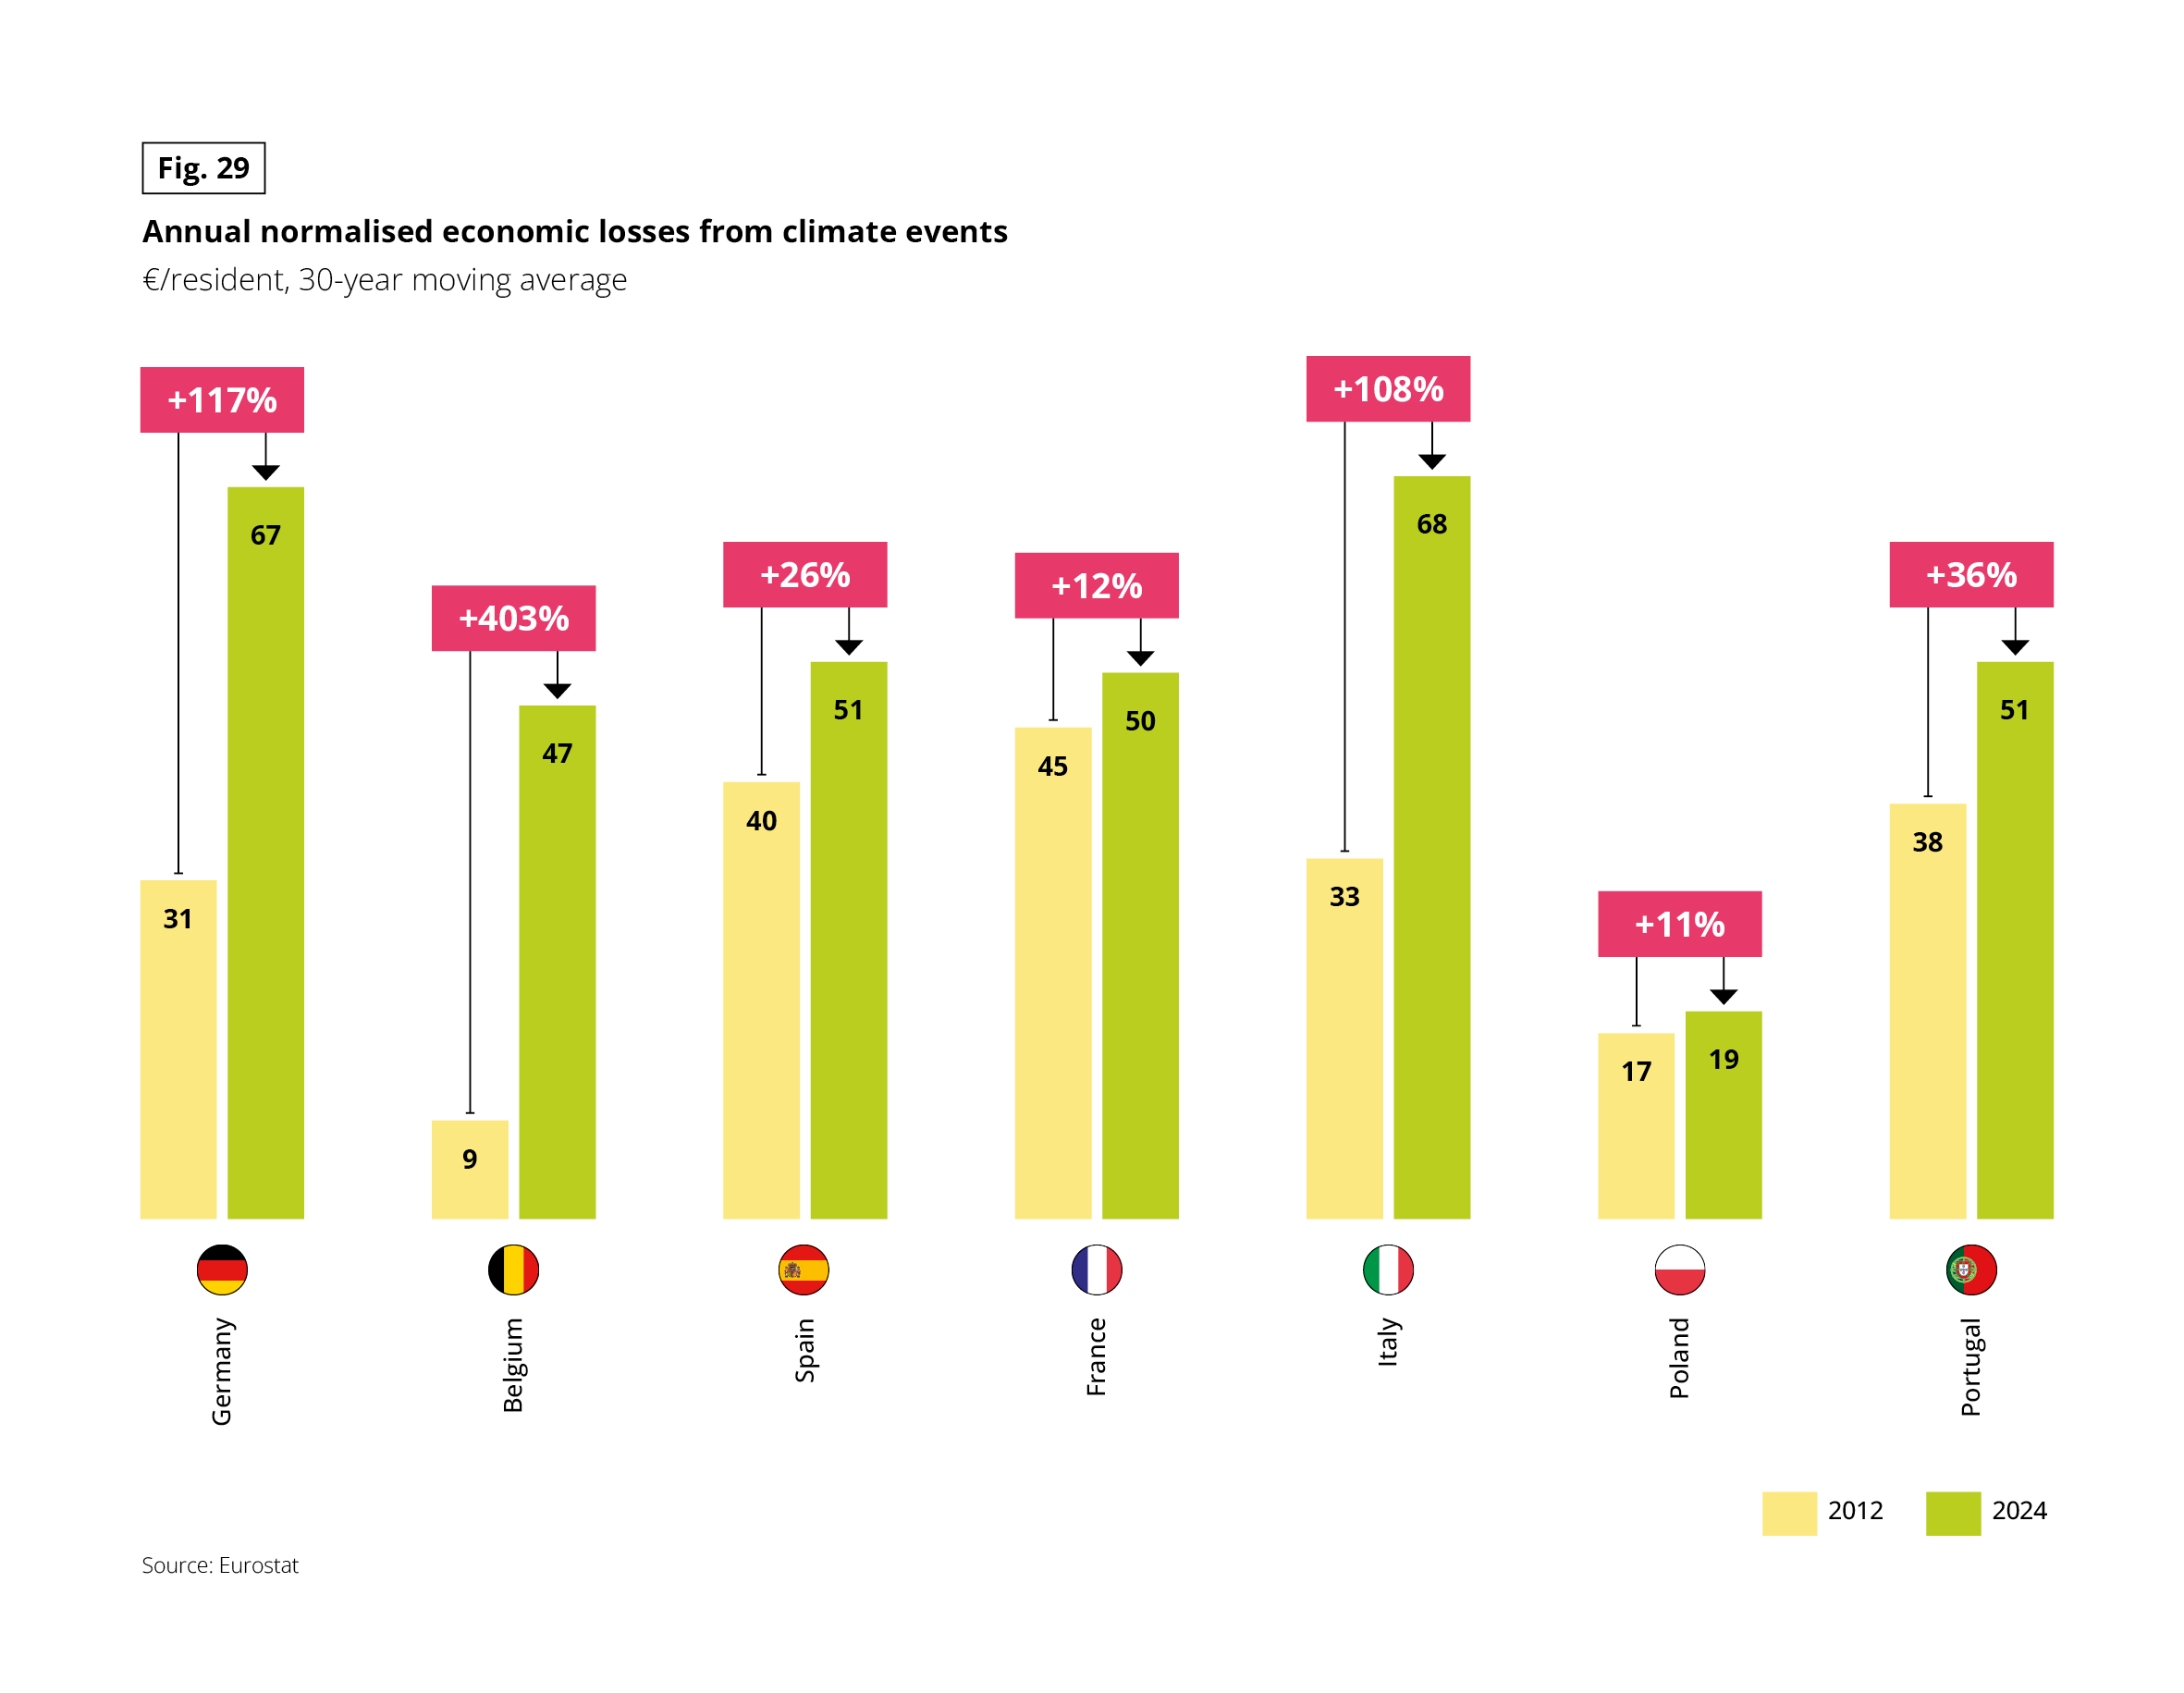 Grouped vertical bar chart. Unit: € per resident, 30-year moving average. Two series, 2012 and 2024, with the percentage change shown above each pair. Source: Eurostat.
Data in the form 2012 / 2024 (change):
• Germany: 31 / 67 (+117%)
• Belgium: 9 / 47 (+403%)
• Spain: 40 / 51 (+26%)
• France: 45 / 50 (+12%)
• Italy: 33 / 68 (+108%)
• Poland: 17 / 19 (+11%)
• Portugal: 38 / 51 (+36%)
Losses per resident rise in every country. Belgium has the sharpest relative increase, from a low base. Italy (68) and Germany (67) have the highest levels in 2024, and Poland the lowest (19).
Crucially, only a small fraction of these losses is covered by insurance. Across the European Union, a mere minority of climate damage is insured, leaving the remainder to be borne by households and public finances.
In 2023, for instance, barely 15% of European climate losses were covered by insurers. This protection gap extends the disconnect already seen between exposure and preparedness directly into the wallet, underscoring the true magnitude of the adaptation challenge facing Europe’s housing stock.
Fig. 30 – EU-27 climate losses, total and insured, 1980–2023
Download this infographic for your presentations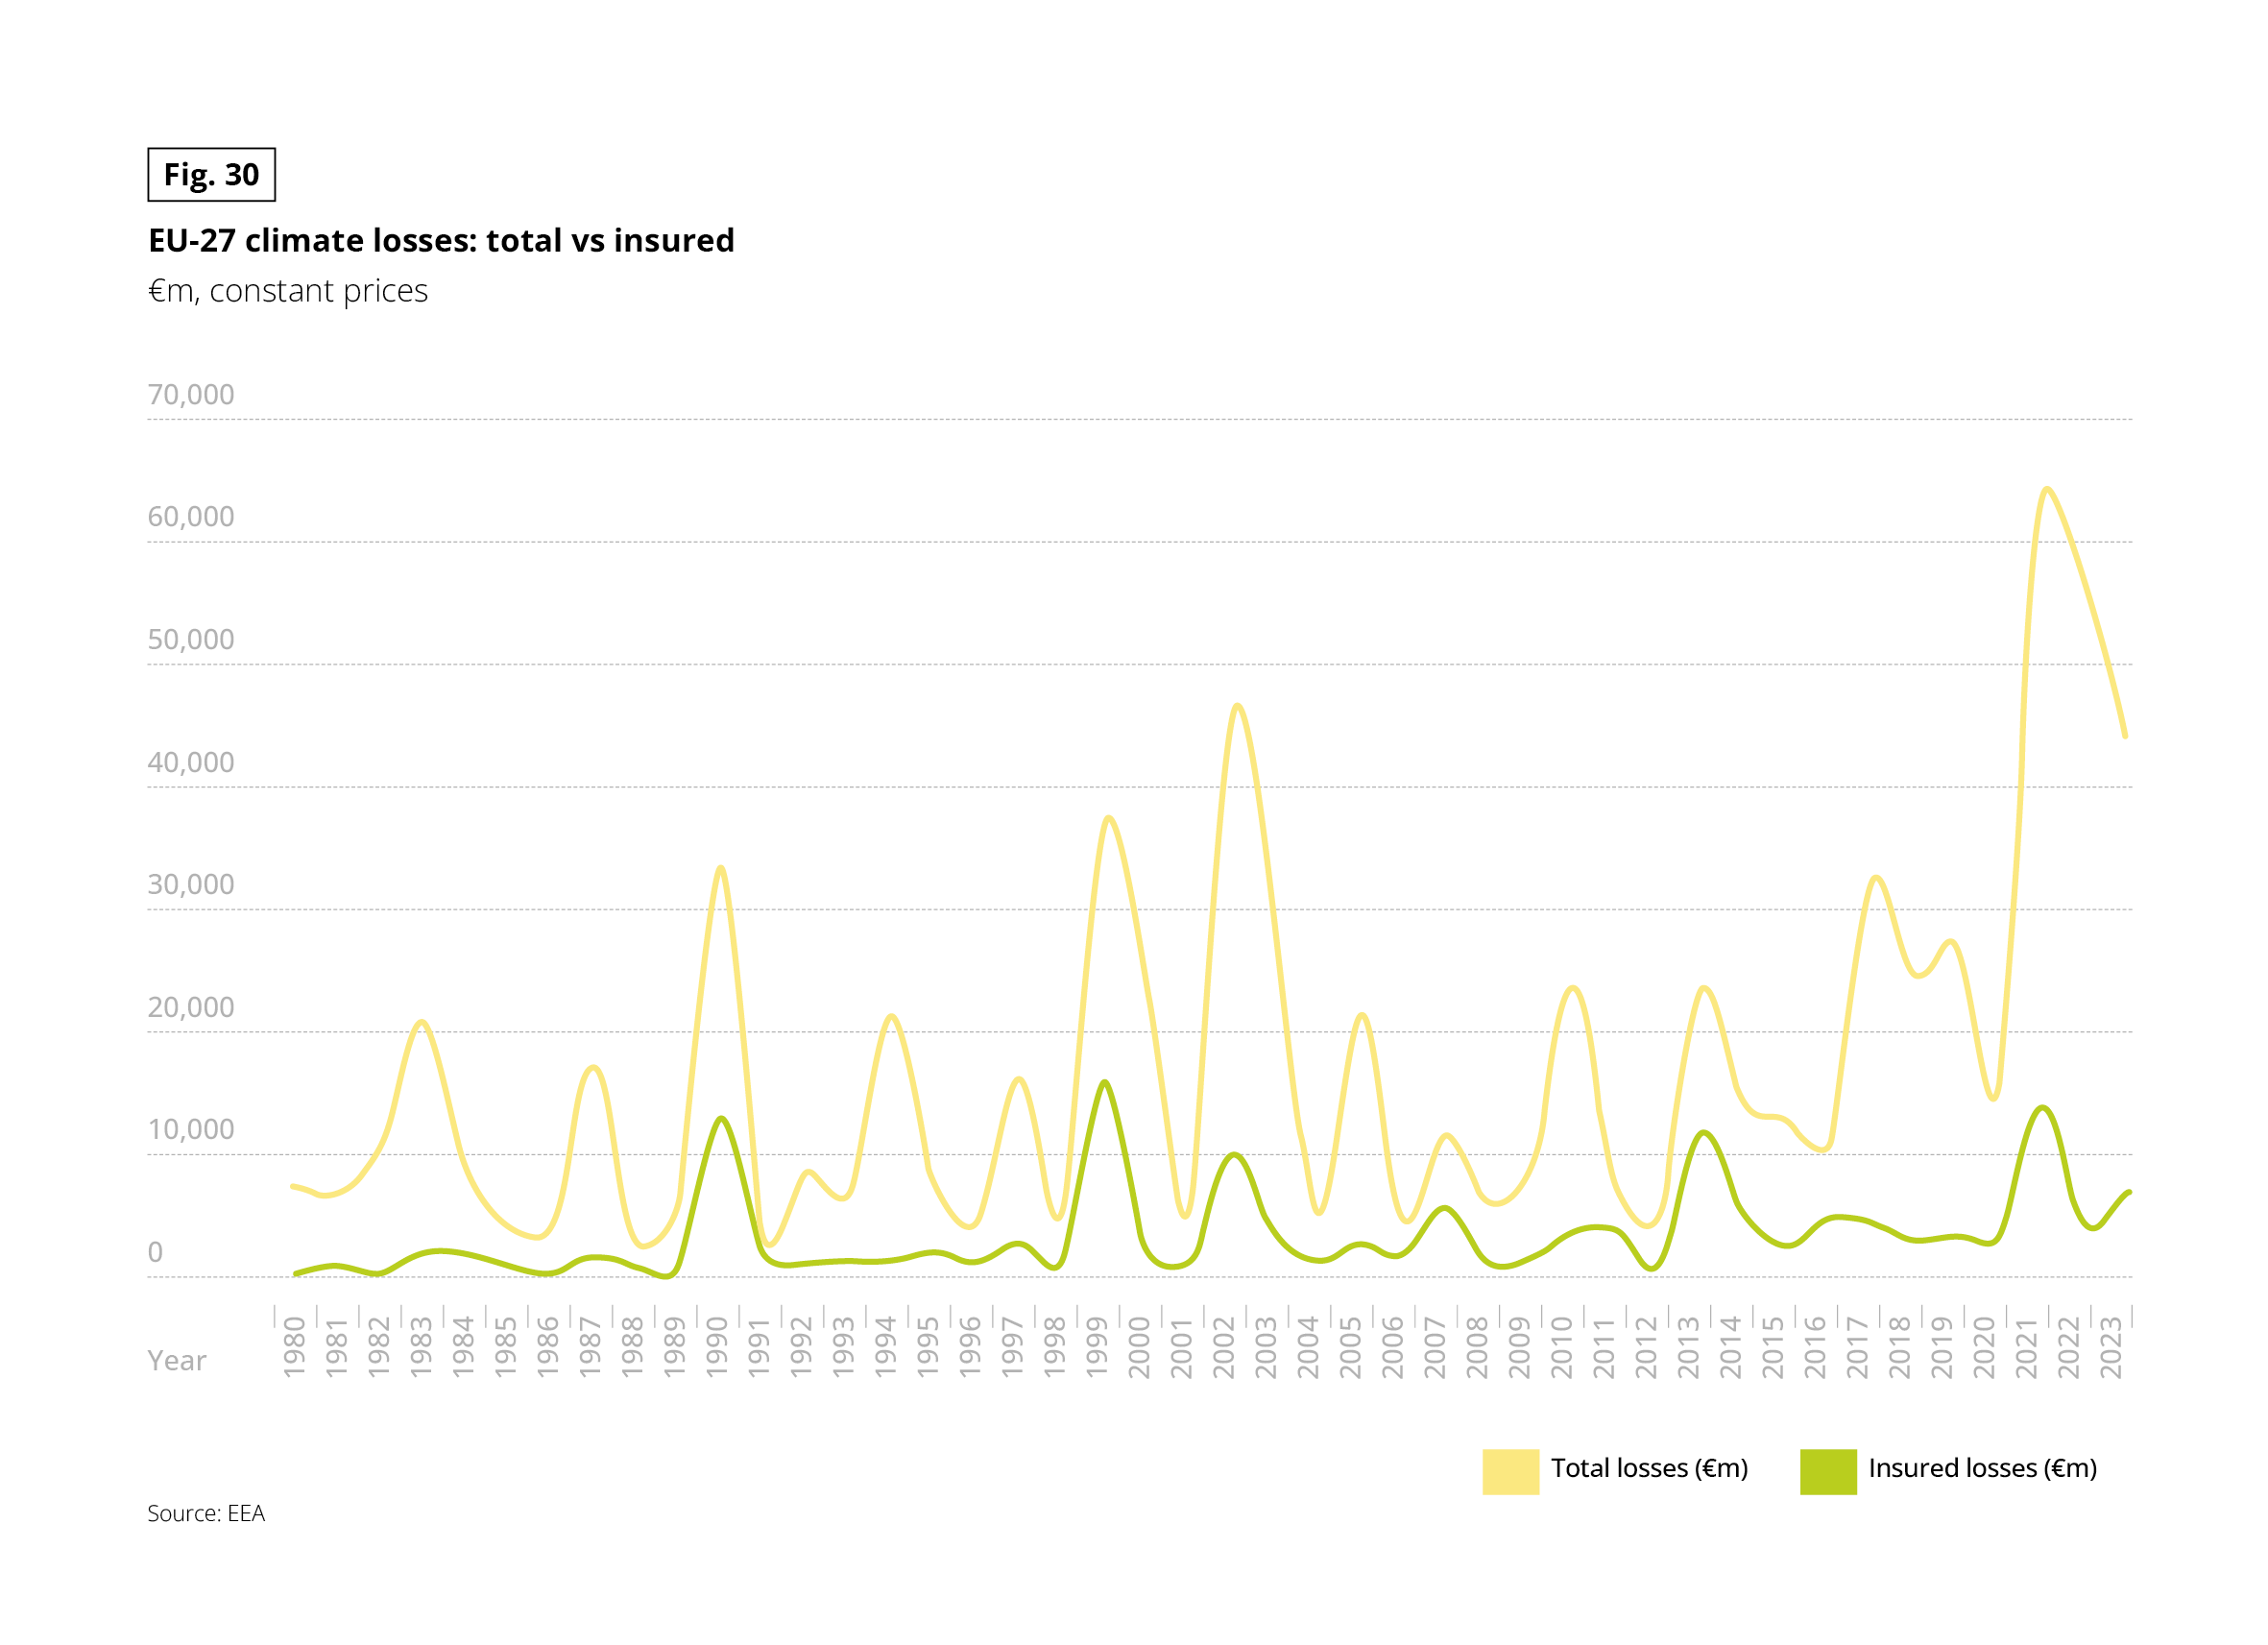 Line chart with two series, total losses and insured losses, in € millions at constant prices, for each year from 1980 to 2023. Source: EEA.
Approximate values read from the chart. Total losses fluctuate strongly, with peaks of about 20,000 in 1983, 33,000 in 1990, 37,000 in 1999, 47,000 in 2002, 23,000 in 2010 and 2013, 32,000 in 2017 and about 64,000 in 2021, the highest of the period. They fall to about 44,000 in 2023. Insured losses are much lower. Their main peaks are about 13,000 in 1990, 16,000 in 1999, 10,000 in 2002, 12,000 in 2013 and 14,000 in 2021. They are about 7,000 in 2023.
Insured losses represent only a fraction of total losses in most years. The gap is widest in 2021–2023.