
Retrofit funding must meet the demand for return on investment


 9 min
reading time
In co-owned properties, energy efficiency retrofits hinge largely on financing. However, the core challenge lies less in the availability of funds than in meeting the necessary preconditions: demonstrated ROI, accessible support mechanisms and a collective agreement to incur the expense. The question remains as to the conditions under which co-owners are prepared to commit, the resources available to them, and the public and private support upon which they can rely. As a reminder, this analysis focuses on the four target markets: France, Italy, Spain and Belgium.
ENERGY EFFICIENCY RETROFITS: YES, BUT ONLY IF THEY PAY OFF
For co-owners, the primary motivation for undertaking energy efficiency retrofits is overwhelmingly financial: reducing energy bills takes precedence over thermal comfort and property value appreciation, with regulatory compliance and the fight against climate change lagging behind. Within the target markets, Italy is the most sensitive to energy bills (79%), Spain and Italy to thermal comfort (71%) and Belgium to property values (62%). The underlying logic is universal: it is economic proof, far more than environmental conviction, that secures buy-in.
This hierarchy becomes even more pronounced as building size increases: the larger the co-owned property, the more motivations become focused on two priorities: bills and comfort. Meanwhile, the climate argument fades, though it remains noticeably stronger in smaller, wealthier developments (37% in large complexes versus 48% in the smallest properties).
Yet what serves as a driver also acts as an obstacle. The single biggest barrier is undeniable: cost, cited far ahead of all other factors. Moreover, it does not stand alone: of the top five barriers, three are financial, including cost, the lack of targeted subsidies and financing difficulties. Low interest and the absence of a shared vision only follow later.
Fig. 61 – Expected benefits of energy Efficiency retrofit projects in co-owned properties
Download this infographic for your presentations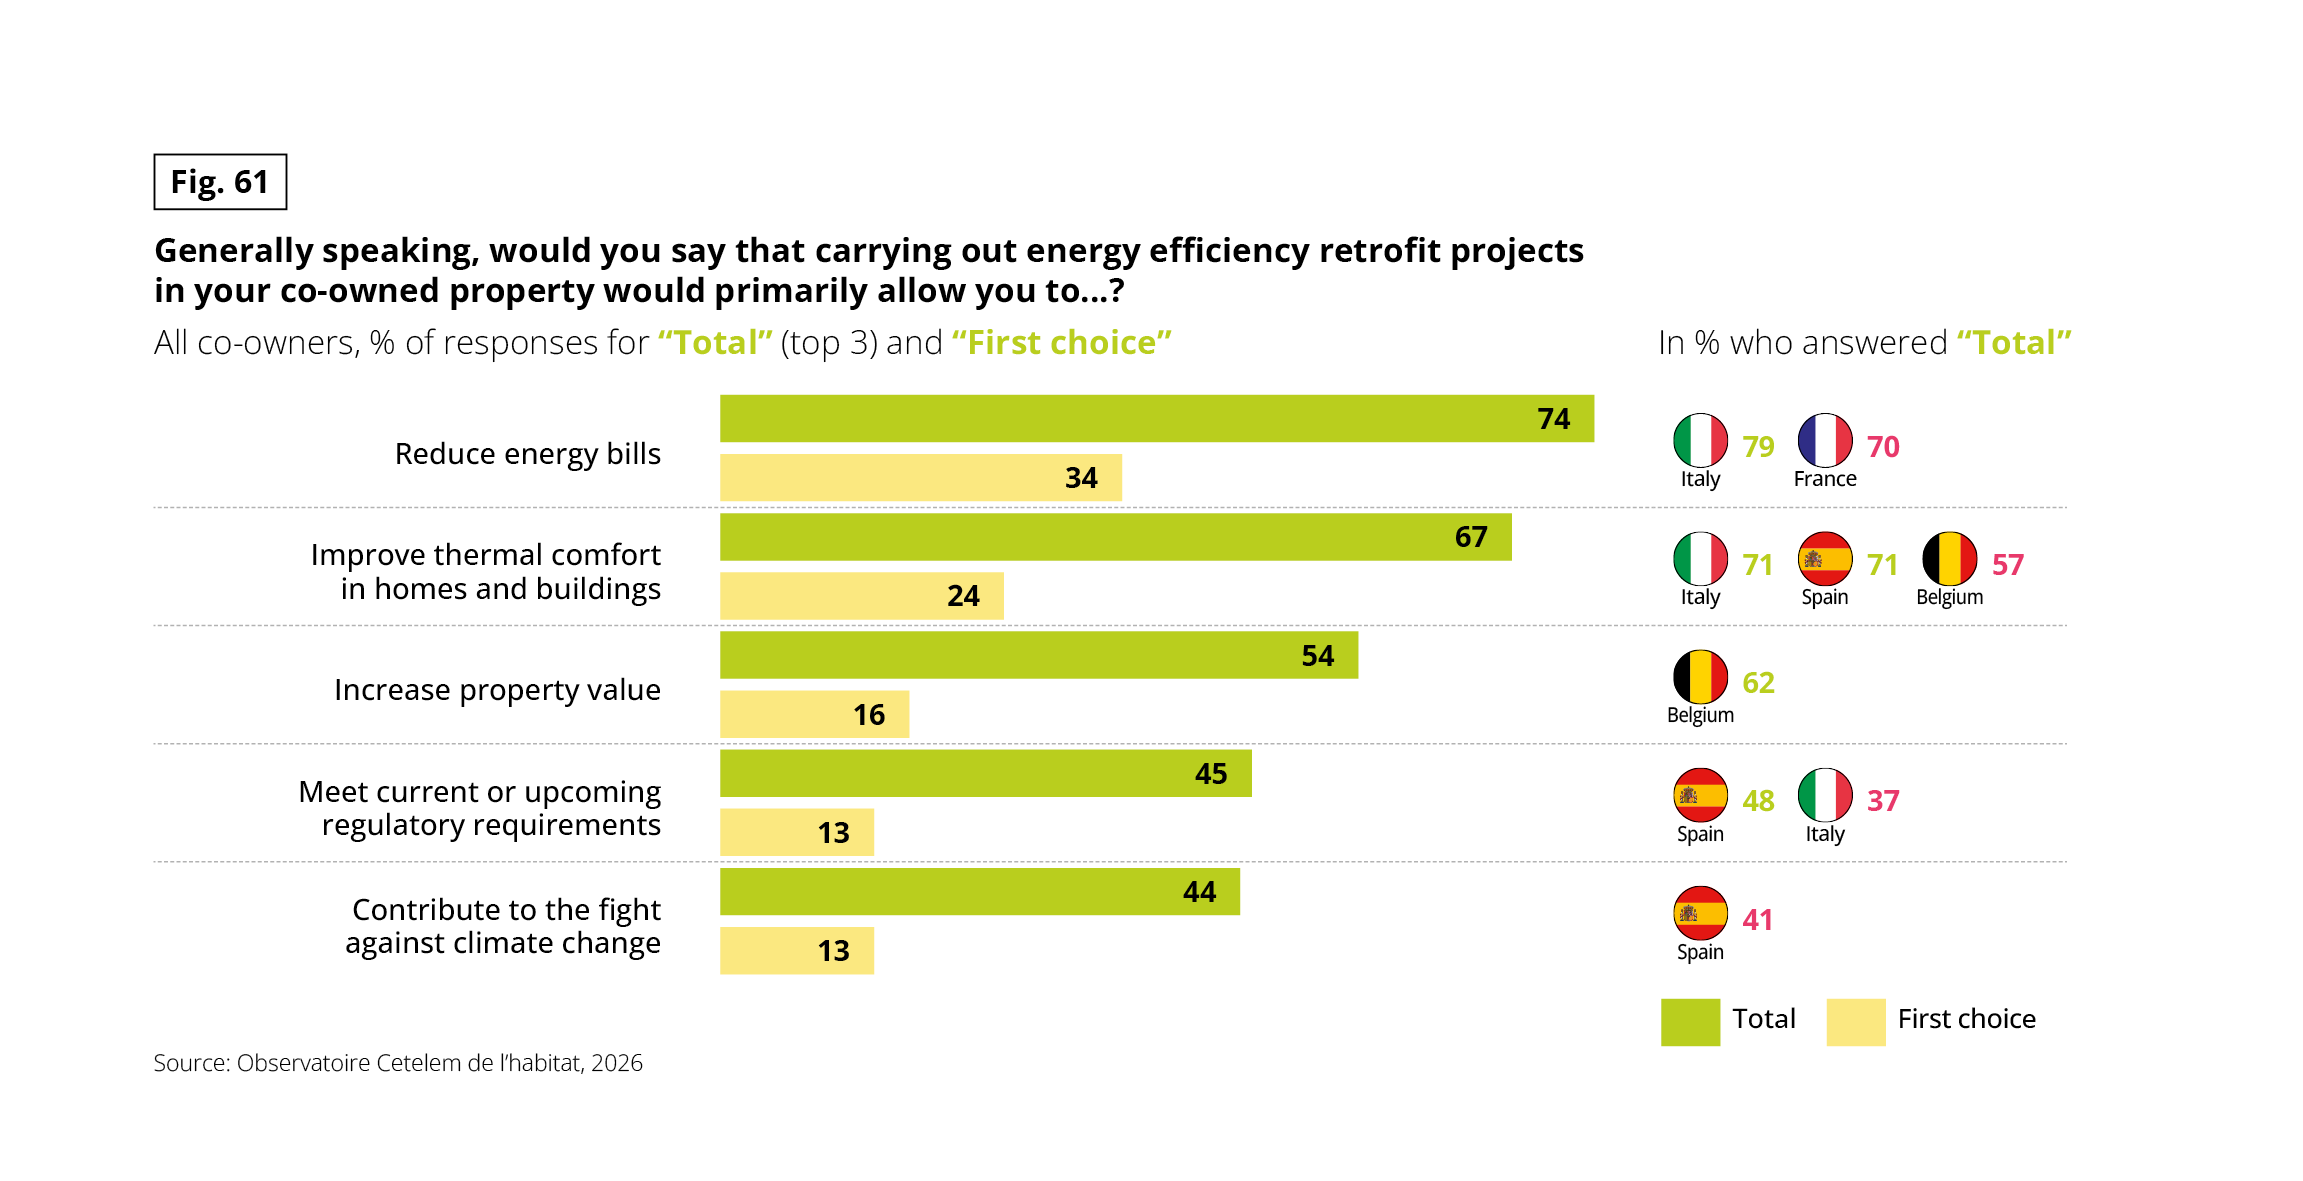 The infographic presents the benefits co-owners expect from energy efficiency retrofit projects in jointly owned properties. For each benefit, the longer green bar represents the percentage selecting it among their top three responses, labelled “Total”. The shorter yellow bar represents the percentage choosing it as their first priority. Country comparisons are shown on the right for selected benefits. The source is the Observatoire Cetelem de l’habitat, 2026.
Overall results, from most to least frequently selected:
• Reducing energy bills: 74% in the top three; 34% as first choice.
• Improving thermal comfort in homes and buildings: 67% in the top three; 24% as first choice.
• Increasing property value: 54% in the top three; 16% as first choice.
• Meeting current or upcoming regulatory requirements: 45% in the top three; 13% as first choice.
• Contributing to the fight against climate change: 44% in the top three; 13% as first choice.
Selected country comparisons for respondents who included each benefit in their top three:
• Reducing energy bills: Italy 79%, France 70%.
• Improving thermal comfort: Italy 71%, Spain 71%, Belgium 57%.
• Increasing property value: Belgium 62%.
• Meeting regulatory requirements: Spain 48%, Italy 37%.
• Contributing to the fight against climate change: Spain 41%.
Reducing energy bills is both the most frequently selected benefit overall and the most common first choice. Improving thermal comfort ranks second in the top-three responses. The results indicate that practical household benefits, particularly lower energy costs and improved comfort, are more frequently cited than regulatory compliance or climate-related benefits.
Fig. 62 – Main barriers to energy efficiency retrofit projects in co-owned properties
Download this infographic for your presentations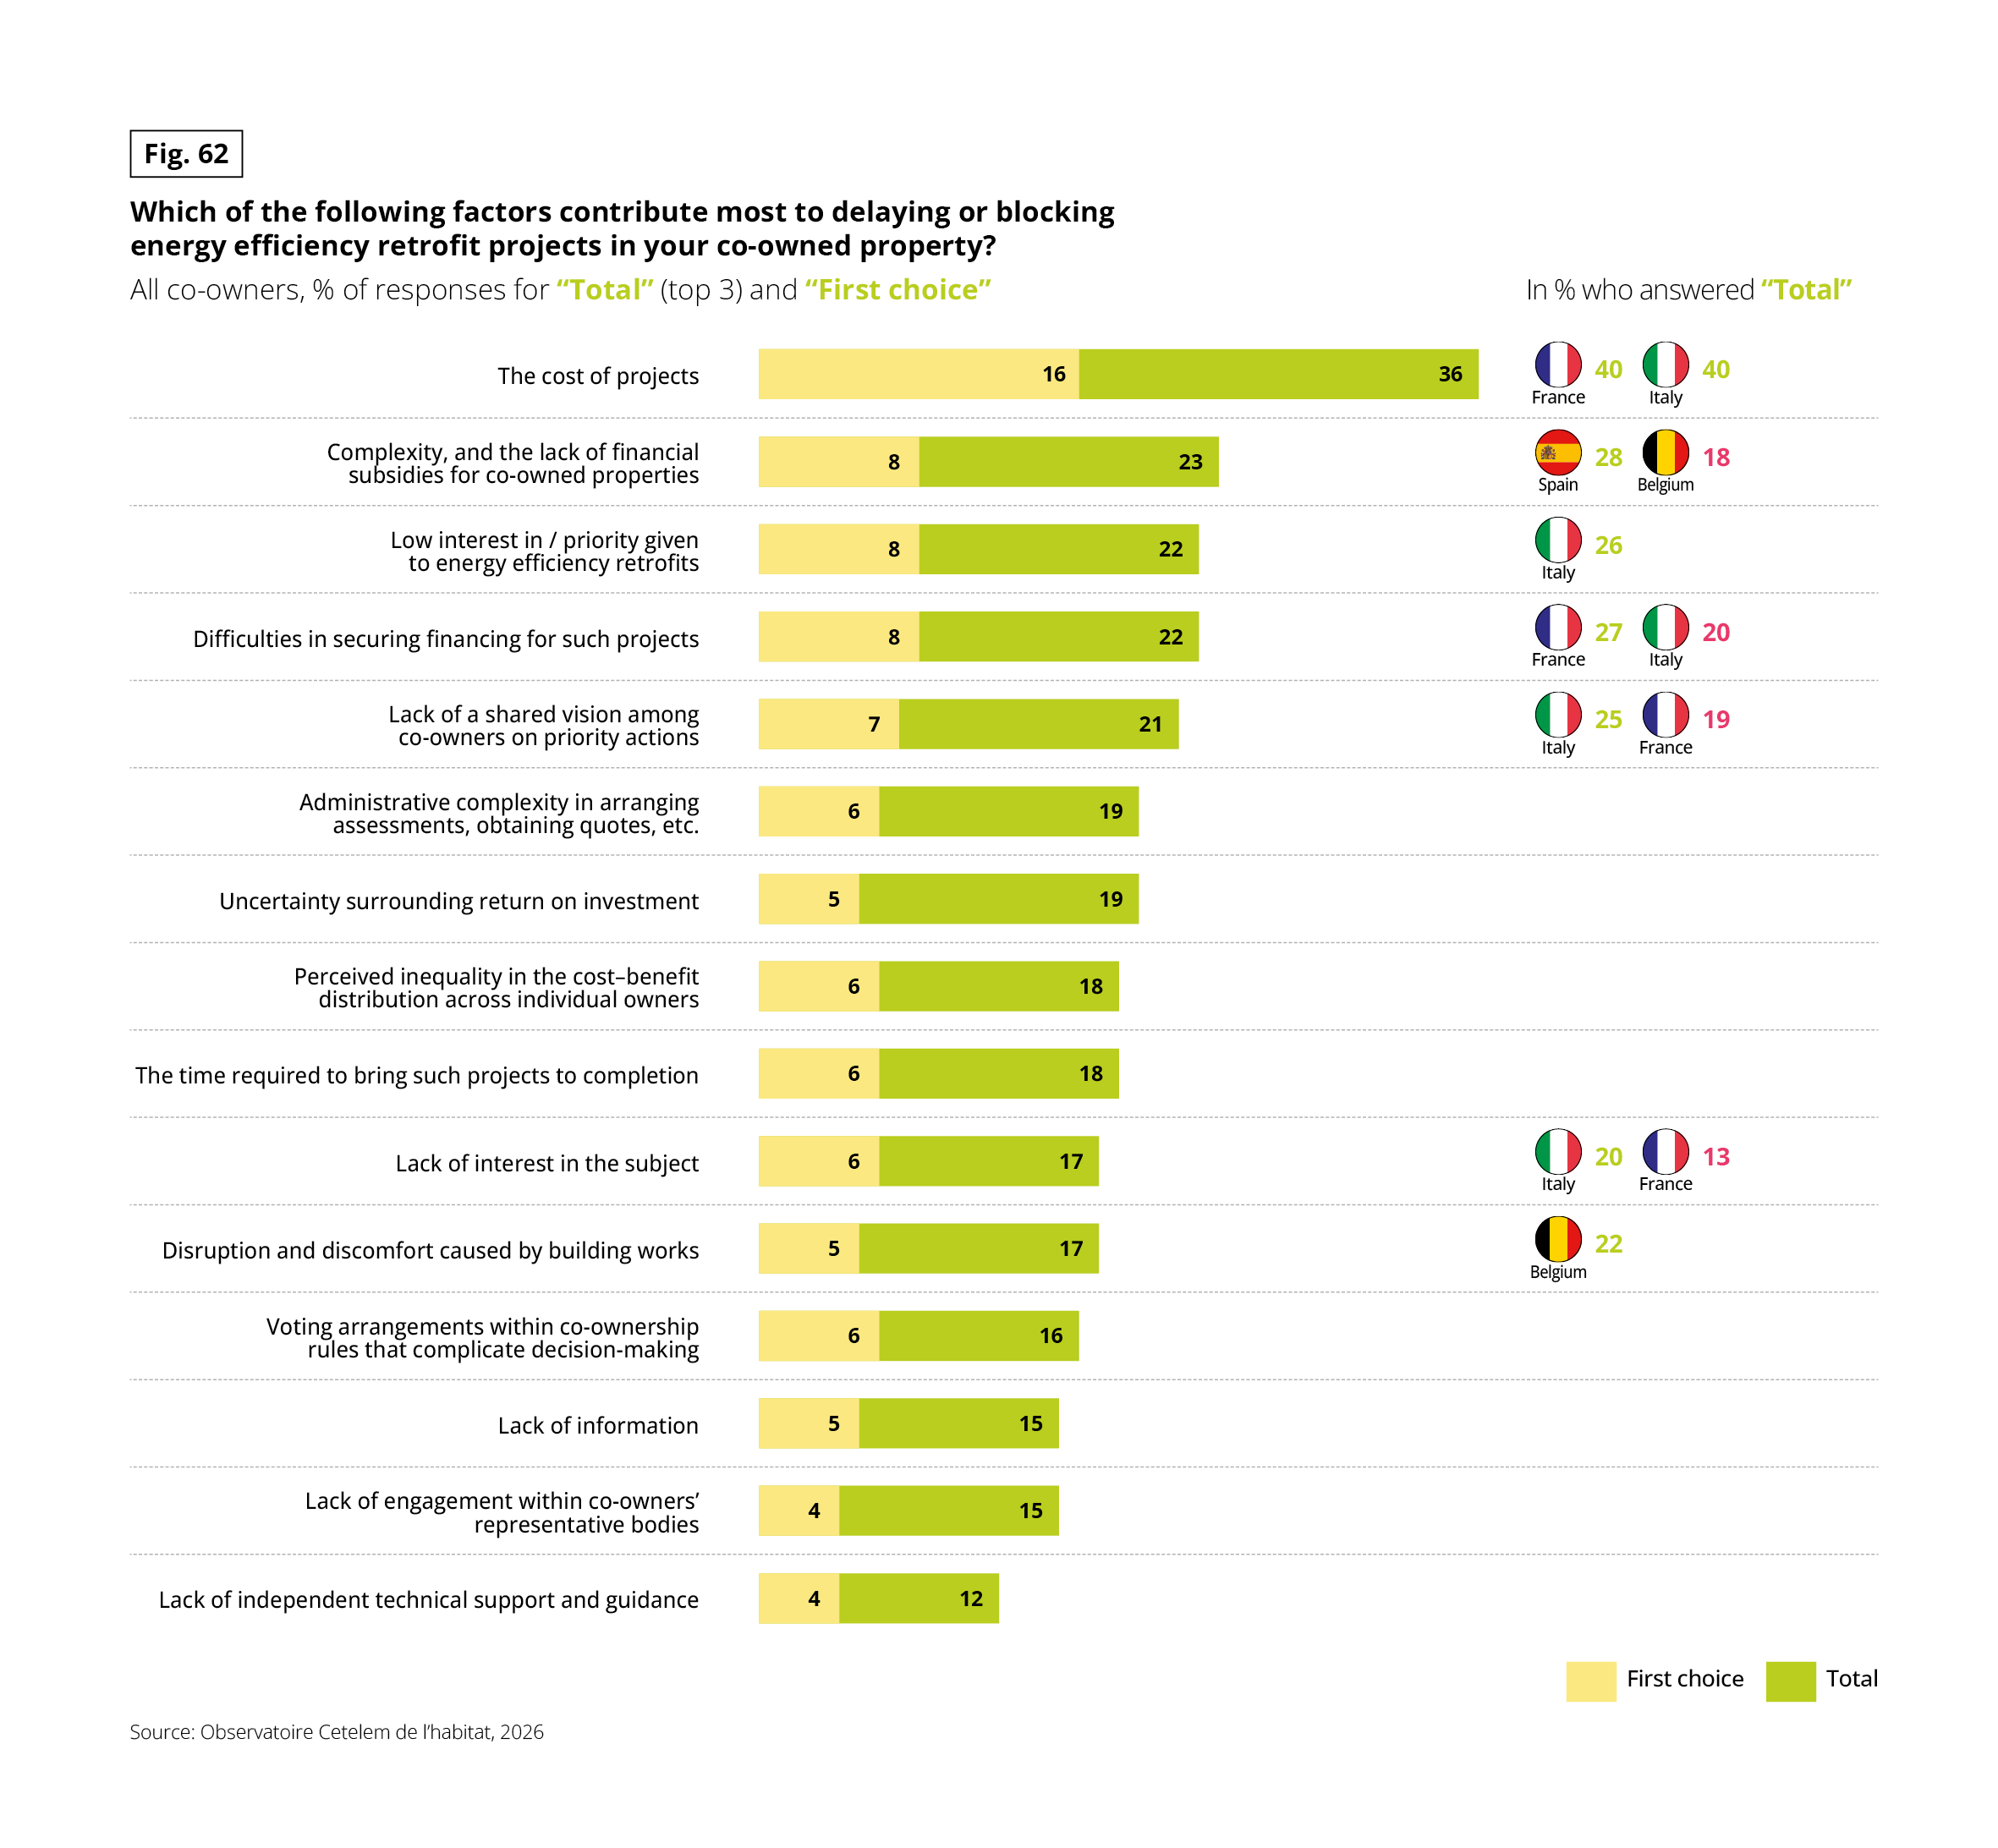 The infographic presents the factors that contribute most to delaying or blocking energy efficiency retrofit projects in co-owned properties. The horizontal stacked bars compare two measures: the percentage of co-owners who included each factor among their top three responses, labelled “Total”, and the percentage who selected it as their first choice. Green represents the total of the top three responses, while yellow represents the first choice. Selected country-level results appear on the right. All figures are percentages. The source is the Observatoire Cetelem de l’habitat, 2026.
Overall results, ranked by the percentage selecting each barrier among their top three responses:
The cost of projects: 36% total; 16% first choice.
Complexity and the lack of financial subsidies for co-owned properties: 23% total; 8% first choice.
Low interest in, or low priority given to, energy efficiency retrofits: 22% total; 8% first choice.
Difficulties in securing financing for such projects: 22% total; 8% first choice.
Lack of a shared vision among co-owners on priority actions: 21% total; 7% first choice.
Administrative complexity in arranging assessments, obtaining quotes and similar tasks: 19% total; 6% first choice.
Uncertainty surrounding return on investment: 19% total; 5% first choice.
Perceived inequality in the distribution of costs and benefits among individual owners: 18% total; 6% first choice.
The time required to complete projects: 18% total; 6% first choice.
Lack of interest in the subject: 17% total; 6% first choice.
Disruption and discomfort caused by building works: 17% total; 5% first choice.
Voting arrangements under co-ownership rules that complicate decision-making: 16% total; 6% first choice.
Lack of information: 15% total; 5% first choice.
Lack of engagement within co-owners’ representative bodies: 15% total; 4% first choice.
Lack of independent technical support and guidance: 12% total; 4% first choice.
Selected country comparisons for the total top-three responses:
Cost of projects: France 40%; Italy 40%.
Complexity and lack of financial subsidies: Spain 28%; Belgium 18%.
Low interest in or priority given to energy efficiency retrofits: Italy 26%.
Difficulties securing financing: France 27%; Italy 20%.
Lack of a shared vision among co-owners: Italy 25%; France 19%.
Lack of interest in the subject: Italy 20%; France 13%.
Disruption and discomfort caused by building works: Belgium 22%.
Project cost is the leading barrier, with 36% of co-owners identifying it among their top three concerns and 16% choosing it as their first priority. Financial and administrative obstacles also feature prominently, alongside limited interest and difficulties reaching agreement among co-owners. The results indicate that addressing affordability, access to subsidies, financing and collective decision-making may help reduce barriers to energy efficiency retrofits.
Energy efficiency retrofitting thus turns on two sides of the same coin: the money it promises to save versus the money it requires upfront. Co-owners know it can lower their bills, but their primary concern remains what it will cost.
What is lacking is neither conviction nor, in most cases, capital, but rather proof that the retrofit will pay off and the capacity for collective action.
CREDITWORTHY CO-OWNERS READY TO BORROW, BUT FOCUSED ON RAPID ROI
While cost is undeniably the top barrier cited, financial means are more readily available than might be expected: nearly 2 out of 3 co-owners consider their co-owned property capable of funding energy efficiency retrofits. Financial capacity is not, therefore, the primary obstacle in itself.
The four focus countries reveal sharp disparities: Belgium and Spain feel best equipped, France follows, while Italy lags noticeably behind (49%). It is in older buildings, where the stakes are highest, that funds are most lacking: perceived capacity drops from over 8 out of 10 in recent properties to just 1 in 2 in pre-2005 buildings.
Fig. 63 – Co-owners’ perceived financial capacity to undertake energy efficiency retrofits
Download this infographic for your presentations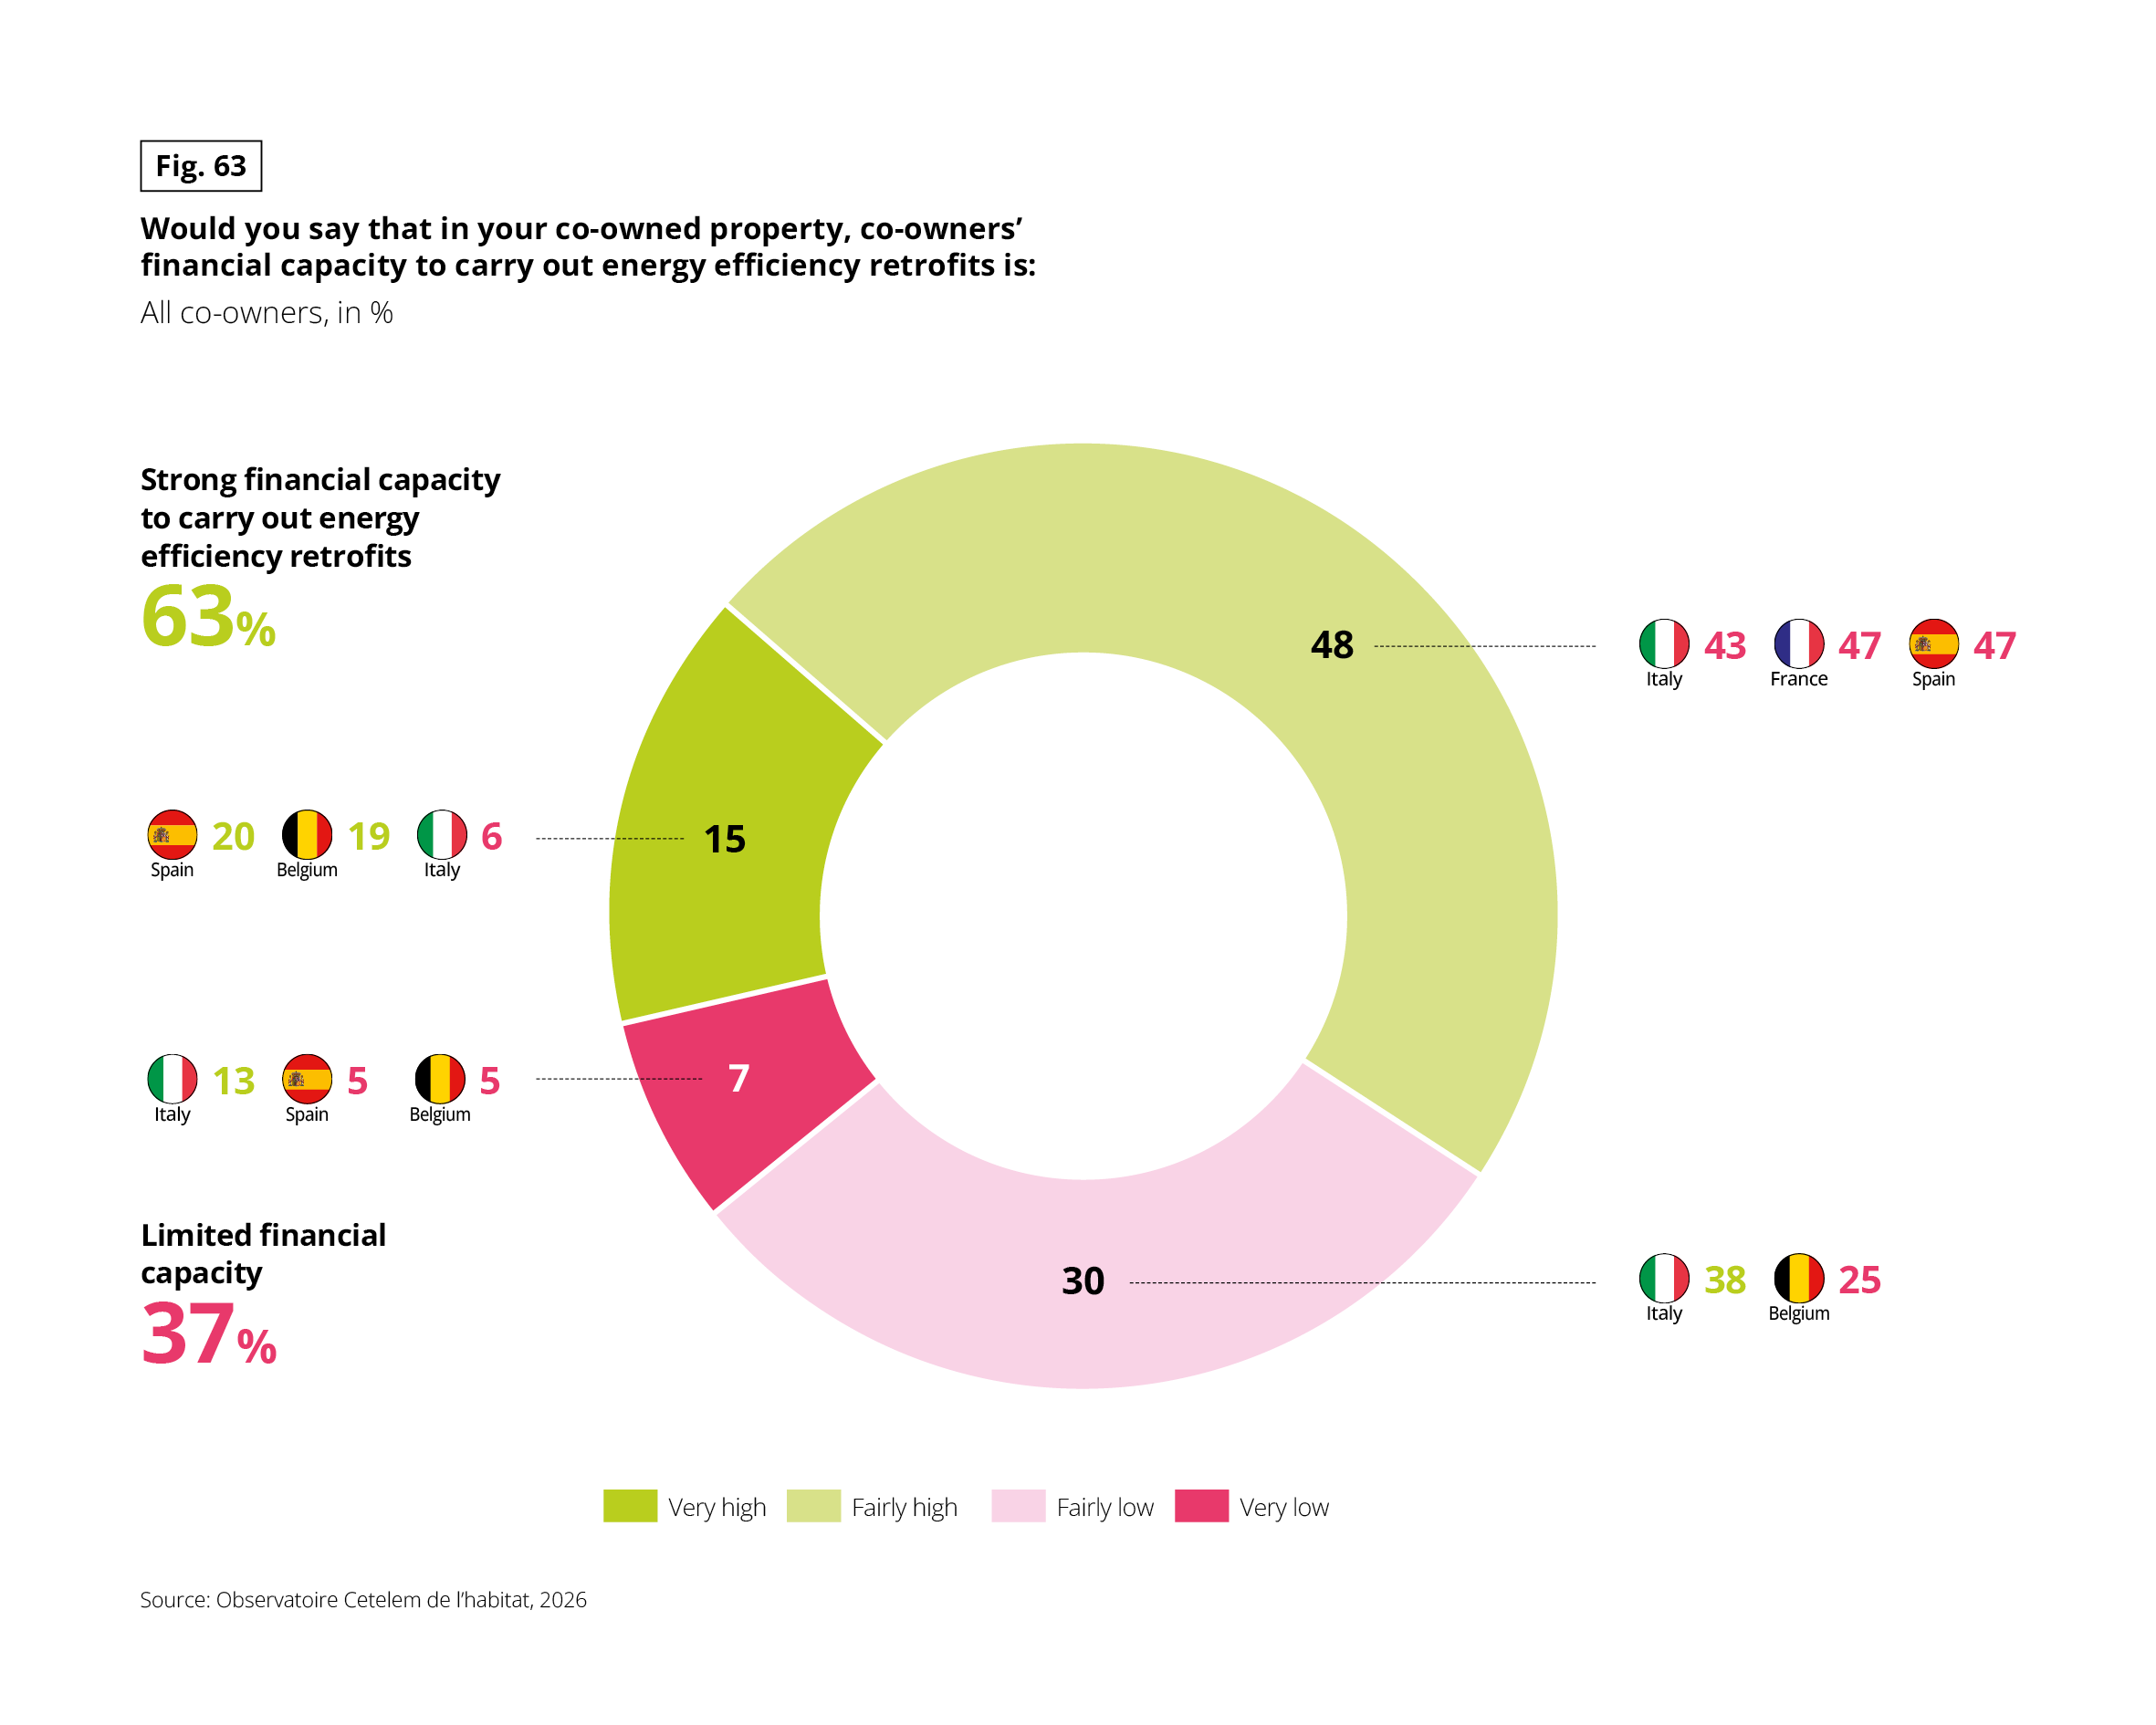 The infographic presents co-owners’ assessment of their financial capacity to carry out energy efficiency retrofit works in their jointly owned property. A central doughnut chart divides respondents into four categories, with two categories representing strong financial capacity and two representing limited financial capacity. All figures are percentages. The source is the Observatoire Cetelem de l’habitat, 2026.
Overall results:
• Very high financial capacity: 15%.
• Fairly high financial capacity: 48%.
• Fairly low financial capacity: 30%.
• Very low financial capacity: 7%.
The first two categories combine to give 63% of co-owners who report strong financial capacity. The last two categories combine to give 37% who report limited financial capacity.
The chart also displays selected country comparisons alongside the corresponding categories:
• For very high financial capacity, Spain records 20%, Belgium 19% and Italy 6%.
• For fairly high financial capacity, Italy records 43%, France 47% and Spain 47%.
• For fairly low financial capacity, Italy records 38% and Belgium 25%.
• For very low financial capacity, Italy records 13%, Spain 5% and Belgium 5%.
The country figures are shown as additional comparisons rather than as a complete breakdown for every country. The overall finding is that nearly two-thirds of co-owners perceive their financial capacity to be strong, although almost two-fifths report fairly low or very low capacity. This distinction is relevant when considering how retrofit projects might be funded and whether financial support may be needed.
Taking out a loan, on the other hand, is widely considered. Only a minority state that they would not need a loan: 86% could therefore consider one, subject to certain conditions. These conditions are mainly financial: owners borrow when costs exceed available equity or when simple, turnkey solutions are available, directly aligning with their main goals to cut energy bills and boost property value.
Fig. 64 – Circumstances in which co-owners would consider a loan for energy efficiency retrofit works
Download this infographic for your presentations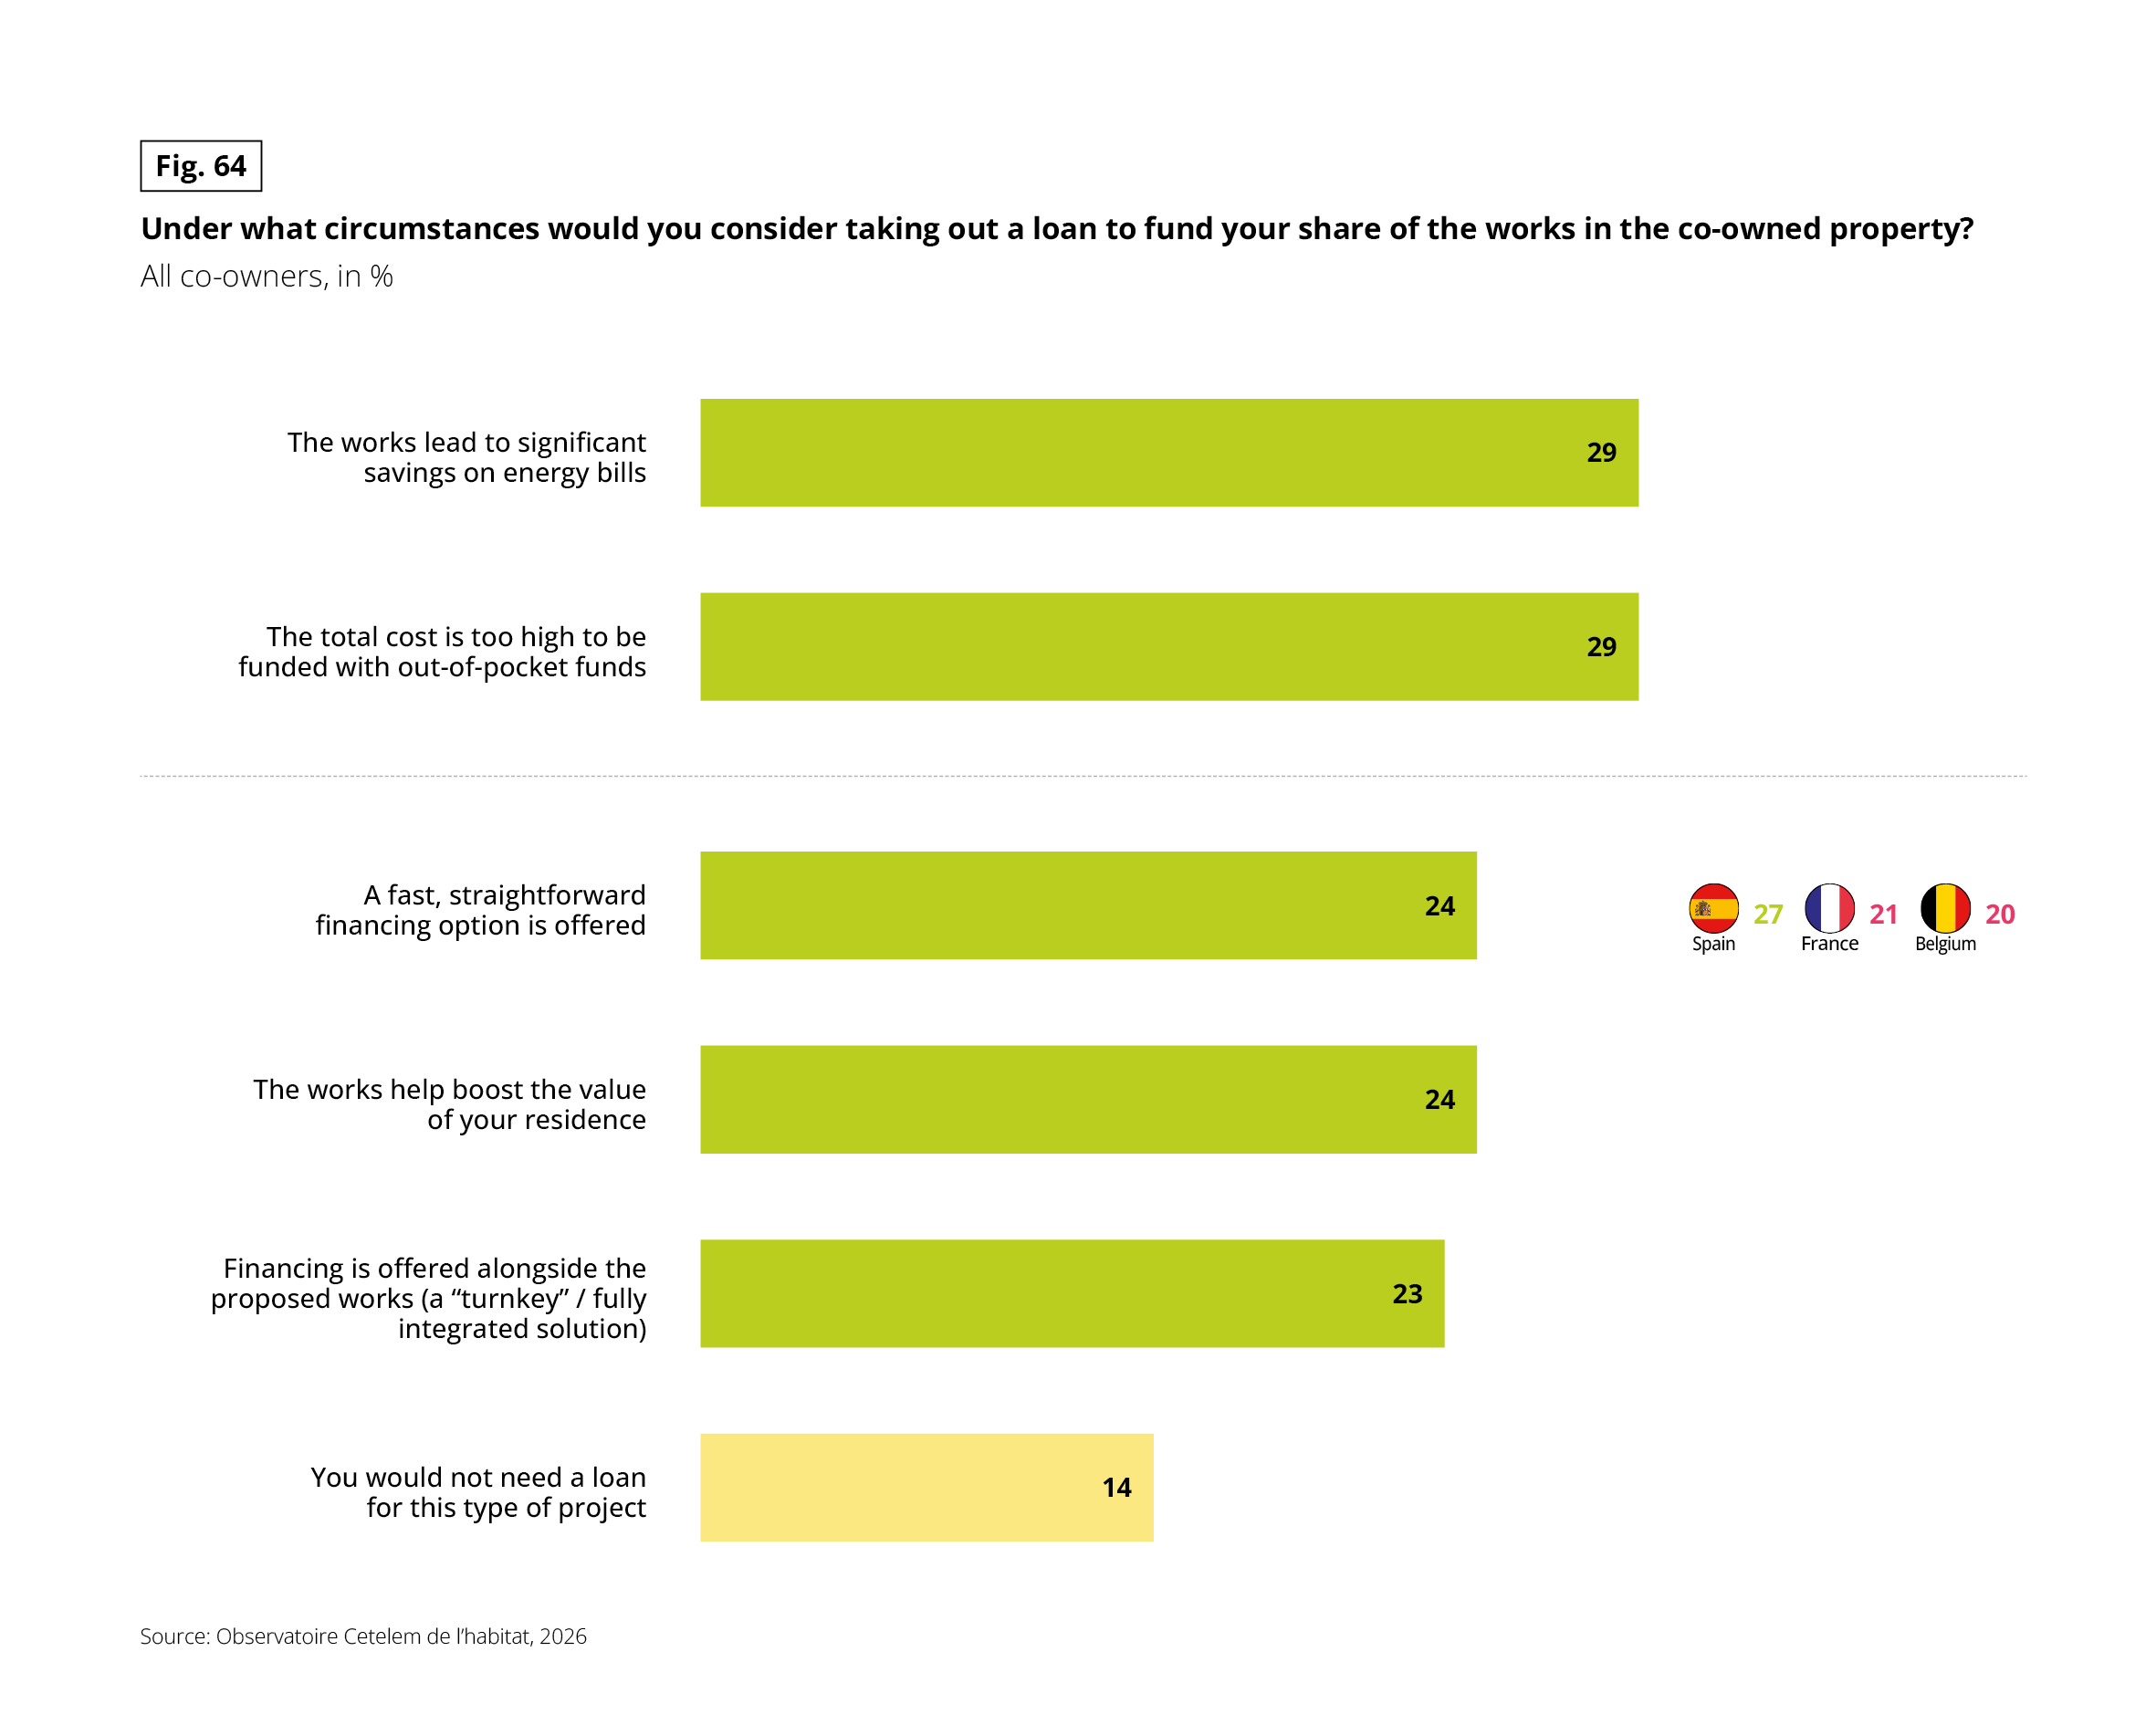 The infographic presents the circumstances under which co-owners would consider taking out a loan to fund their share of energy efficiency retrofit works in a jointly owned property. Six horizontal bars display the overall results, with selected country comparisons alongside one of the responses. All figures are percentages of co-owners. The source is the Observatoire Cetelem de l’habitat, 2026.
Overall responses:
• 29% would consider a loan if the works led to significant savings on energy bills.
• 29% would consider a loan if the total cost were too high to be covered by out-of-pocket funds.
• 24% would consider a loan if a fast, straightforward financing option were offered.
• 24% would consider a loan if the works helped increase the value of their residence.
• 23% would consider a loan if financing were offered alongside the proposed works as a turnkey or fully integrated solution.
• 14% say they would not need a loan for this type of project.
Country comparisons for respondents who would consider a loan if a fast, straightforward financing option were offered:
• Spain: 27%.
• France: 21%.
• Belgium: 20%.
The two most frequently cited circumstances are the prospect of significant energy bill savings and the inability to cover the total cost from personal funds, both at 29%. The availability of a simple financing option and the prospect of increasing property value are each cited by 24%. The results indicate that both the expected financial benefits of retrofits and the affordability of upfront costs influence co-owners’ willingness to borrow.
The remaining question is under what conditions co-owners would actually agree to contribute financially. When asked about a major investment with costs shared among all owners, 93% answered yes. However, this agreement is almost always subject to a condition: only 19% accept without hesitation, while 45% demand proof of energy savings, 16% require an increase in property value, and 13% condition their approval on obtaining public subsidies. Absolute refusal remains marginal (7%). What holds projects back is therefore not a matter of principle, but a need for proof: retrofit works are accepted once their value is demonstrated.
Building size is the most decisive factor shaping these conditions, and its effect is cumulative. As the building grows larger, spontaneous agreement diminishes: acceptance without hesitation drops from 24% in co-owned properties with fewer than five units to 15–17% in those with more than 10, while outright refusal nearly doubles from 6% to 11%.
Crucially, the nature of the condition itself shifts. The capital value argument fades as individual ownership feels diluted within a larger collective, falling from 17% to 11% for property value gains, while reliance on public subsidies increases steadily. In other words, large co-owned properties do not merely expect the benefits to be proven; they expect public funding to help finance the works.
Financial means operate in the same direction and amplify the impact of building size. Unconditional acceptance falls from 26% in financially secure co-owned properties to 9% in those with tighter budget constraints. The latter are four times more likely to refuse outright and three times as likely to make their approval conditional on receiving subsidies. For these large, cash-strapped properties, taking action depends not on proving returns, but on securing public funding, the very lifeline that remains most elusive to them.
Fig. 65 – Co-owners’ willingness to invest in energy efficiency retrofits
Download this infographic for your presentations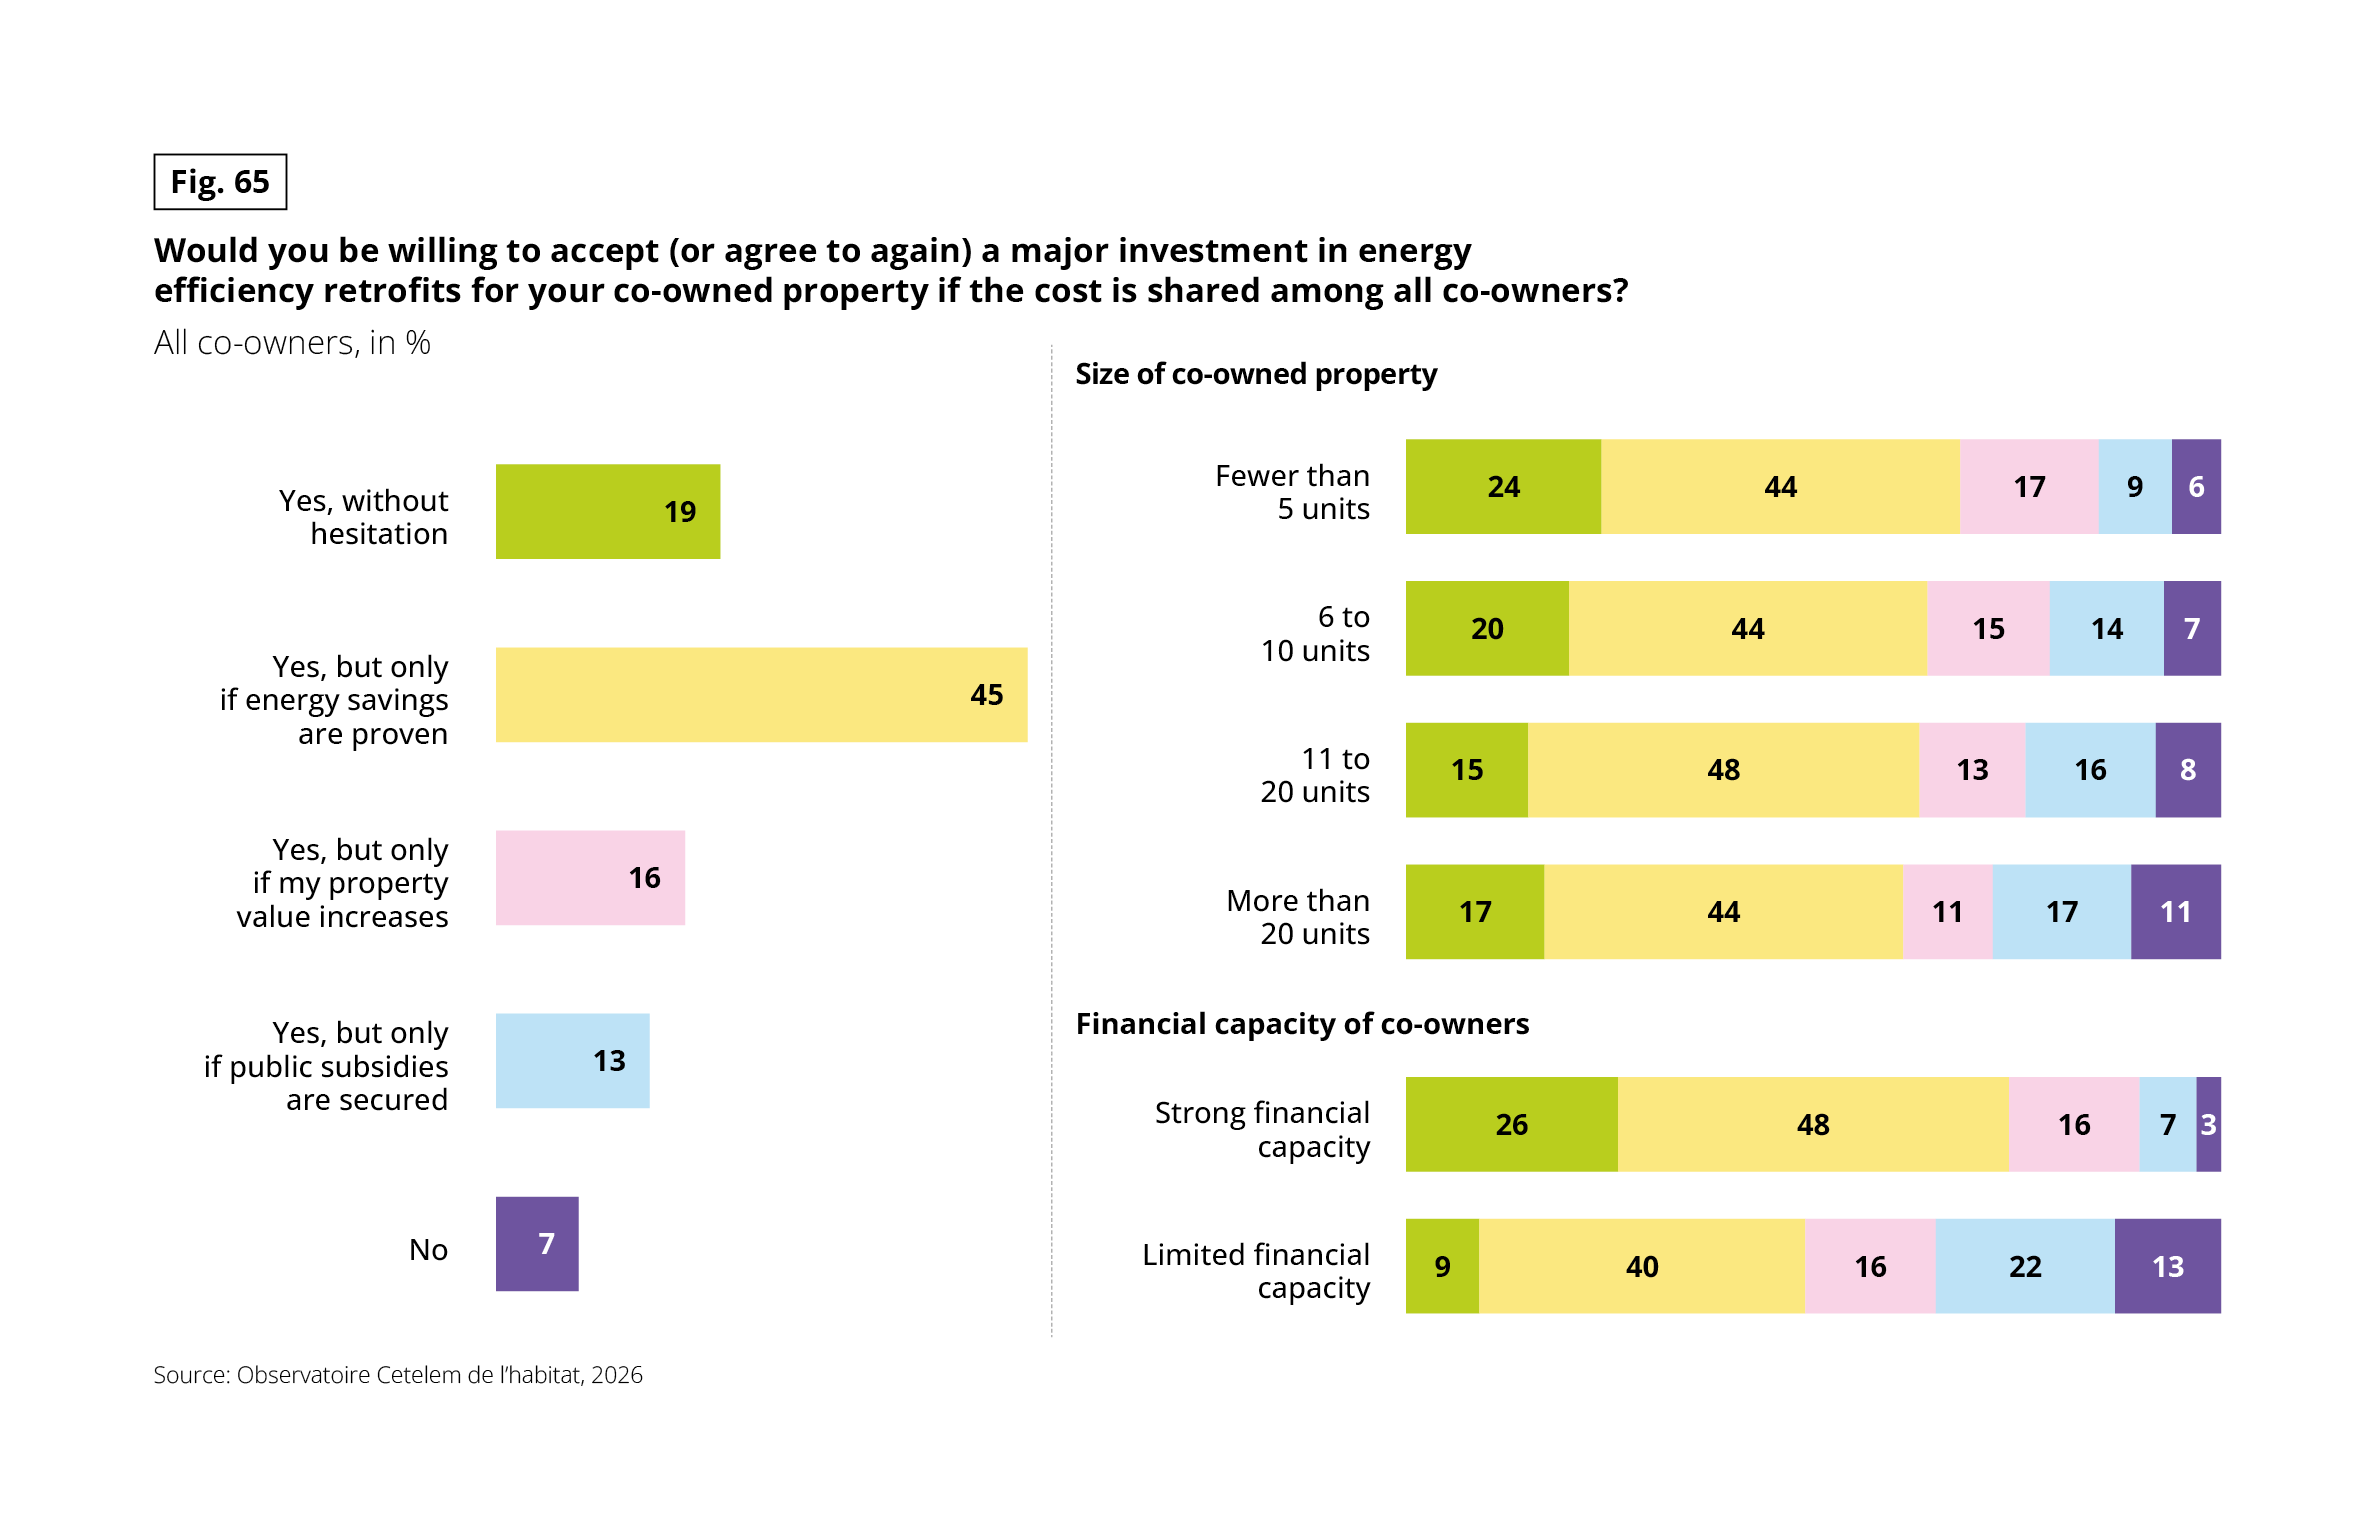 The chart presents the responses of co-owners to a proposed major investment in energy efficiency retrofits for their jointly owned property, assuming that the cost is shared among all co-owners. The overall results are shown on the left, while the breakdown by property size and financial capacity is shown on the right. All figures are percentages. The source is the Observatoire Cetelem de l’habitat, 2026.
Overall responses:
• 19% would accept the investment without hesitation.
• 45% would accept only if energy savings were proven.
• 16% would accept only if the investment increased their property’s value.
• 13% would accept only if public subsidies were secured.
• 7% would refuse.
Results by size of co-owned property:
• Fewer than 5 units: 24% would accept without hesitation, 44% if energy savings were proven, 17% if property value increased, 9% if public subsidies were secured, and 6% would refuse.
• 6 to 10 units: 20%, 44%, 15%, 14% and 7%, respectively.
• 11 to 20 units: 15%, 48%, 13%, 16% and 8%, respectively.
• More than 20 units: 17%, 44%, 11%, 17% and 11%, respectively.
Results by financial capacity of co-owners:
• Strong financial capacity: 26% would accept without hesitation, 48% if energy savings were proven, 16% if property value increased, 7% if public subsidies were secured, and 3% would refuse.
• Limited financial capacity: 9%, 40%, 16%, 22% and 13%, respectively.
The most common response in every subgroup is conditional acceptance if energy savings are proven. Unconditional acceptance is more frequent among co-owners with strong financial capacity than among those with limited financial capacity. Conversely, those with limited financial capacity are more likely to require public subsidies or refuse the investment.
The interest rate environment offers little help. After reaching historic lows in 2020–2021, long-term government bond yields have risen sharply, pushing up mortgage borrowing costs. Mortgage rates have followed suit: in France, they rose from 1.1% in 2021 to 3.1% in 2025, and currently range between 3.1% and 3.8% across the four focus markets. Borrowing to carry out retrofits is therefore significantly more expensive than it was four years ago, making the demand for a rapid return on investment all the more acute.
Fig. 66 – Long-term government bond yields and residential mortgage interest rates in 2020 and 2025
Download this infographic for your presentations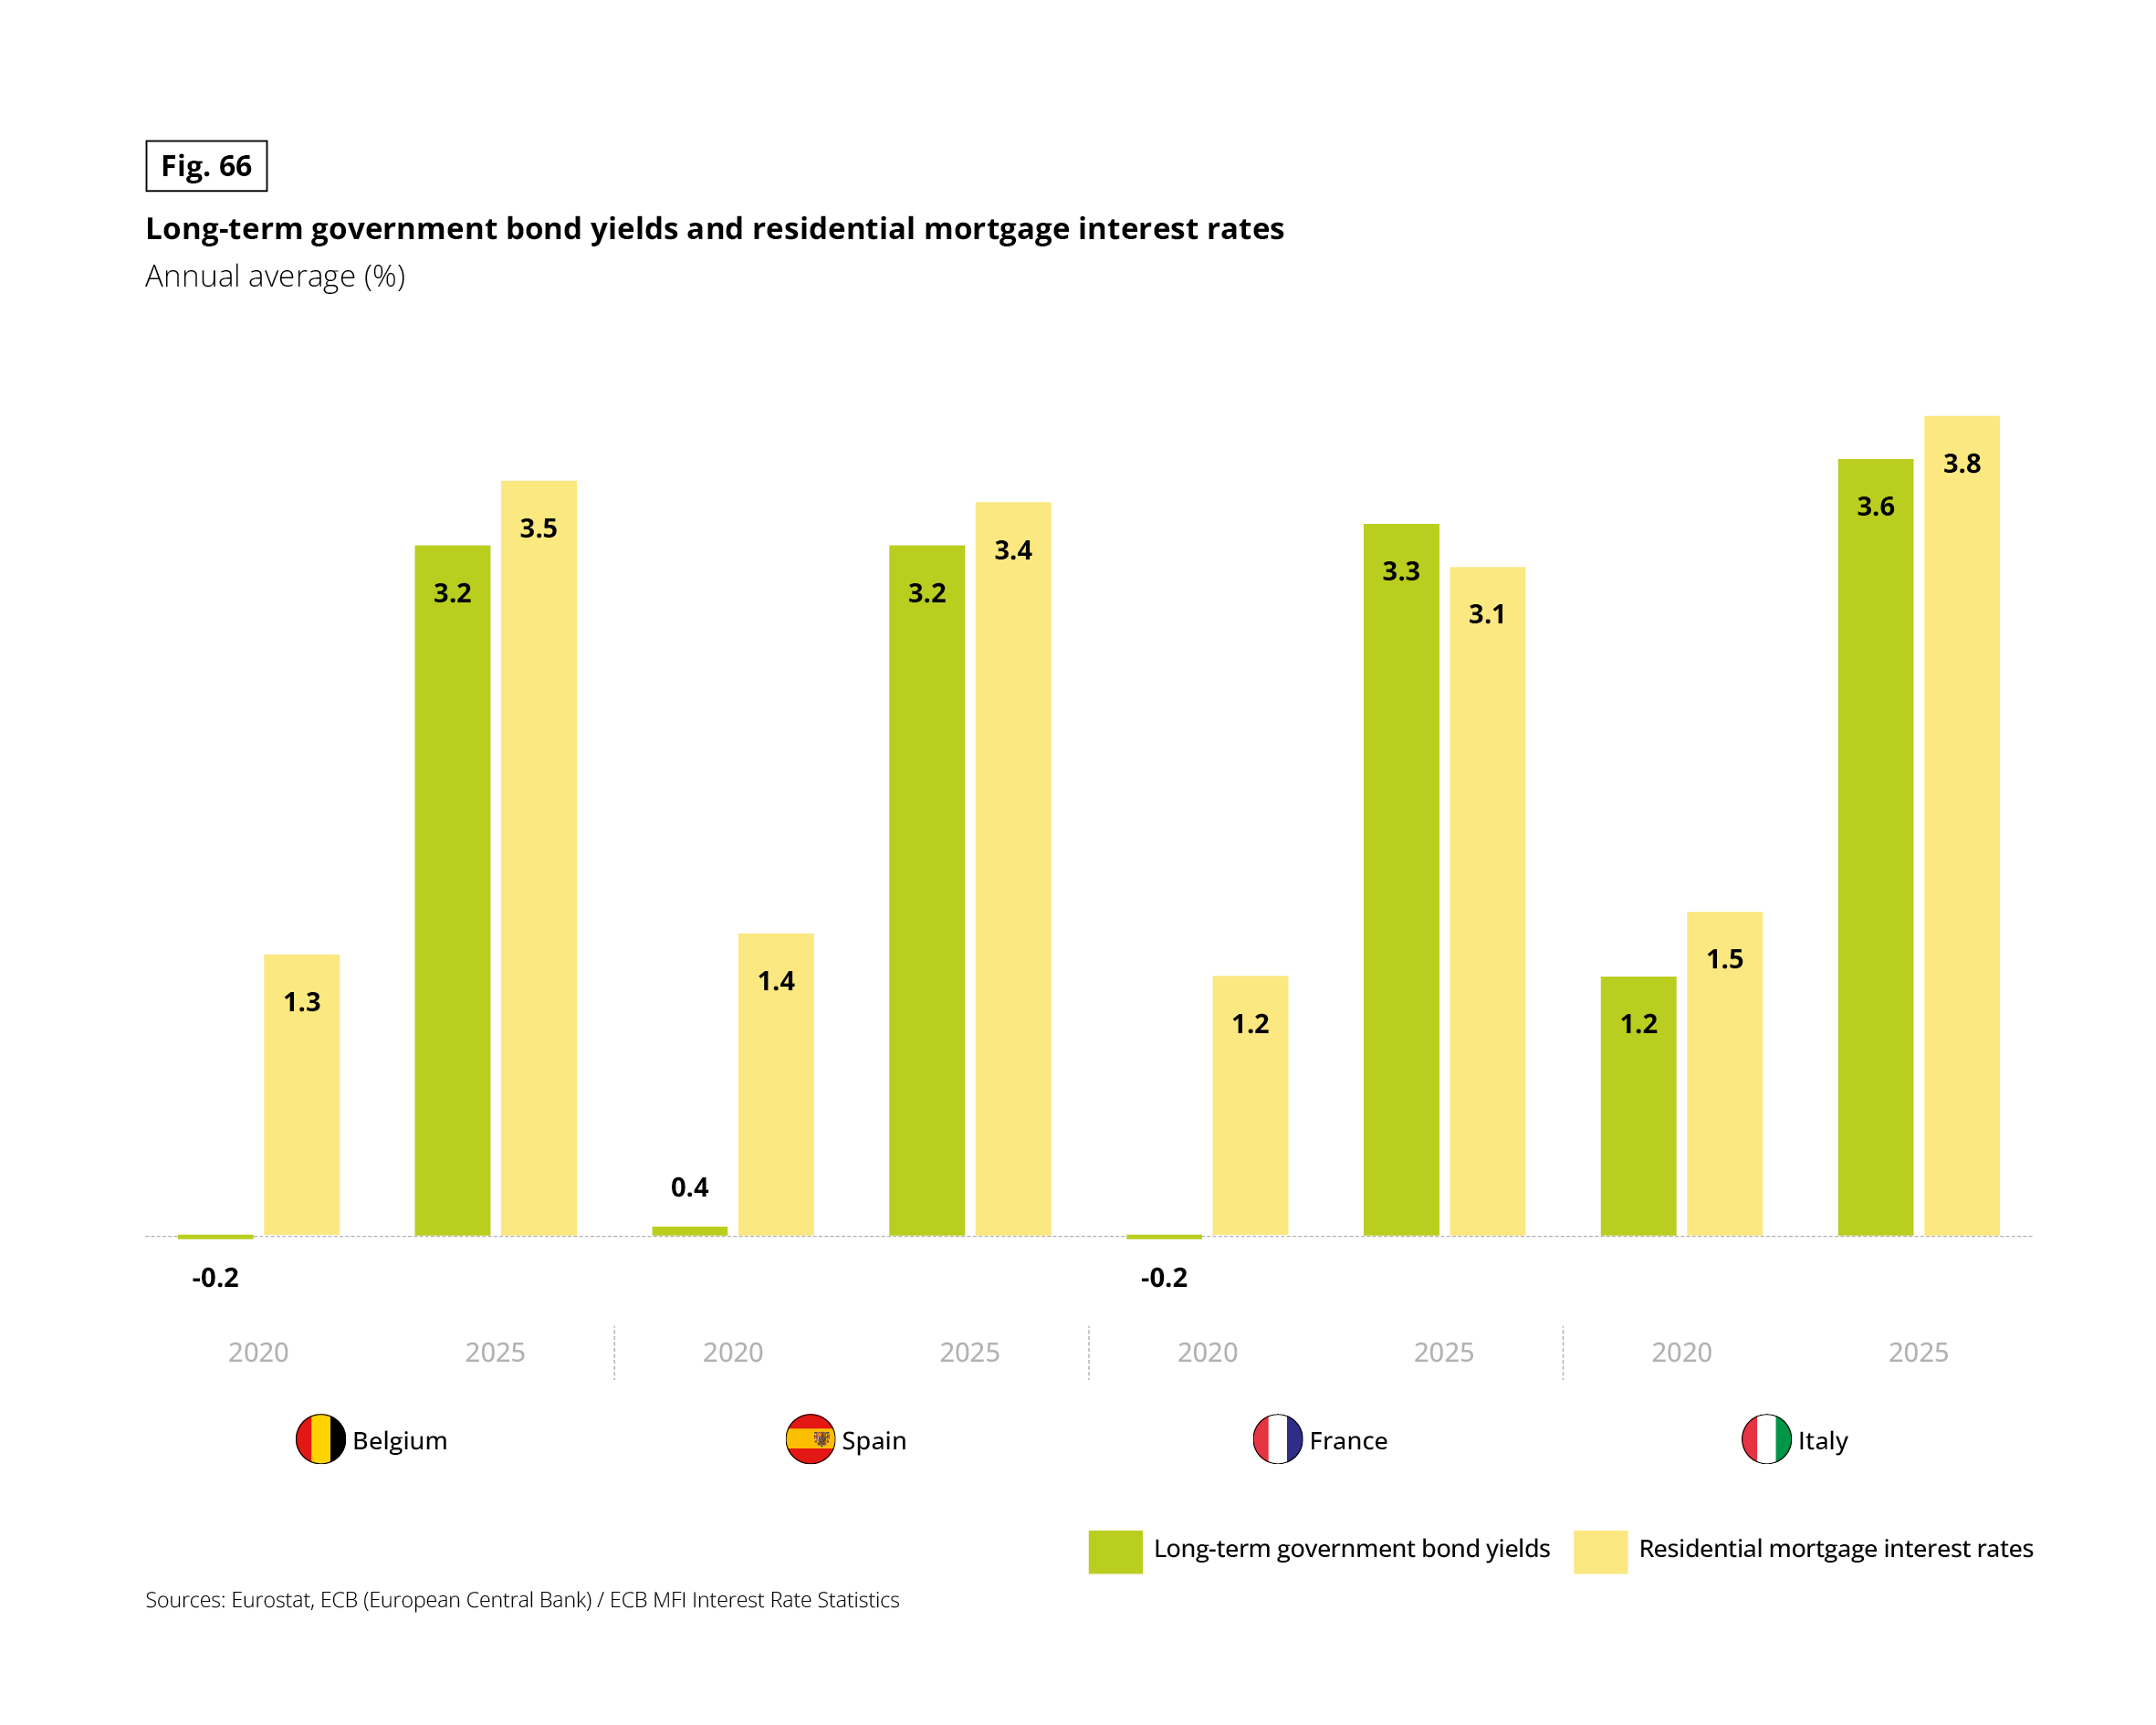 The grouped bar chart compares annual average long-term government bond yields with residential mortgage interest rates in four European countries: Belgium, Spain, France and Italy. For each country, two pairs of bars represent the years 2020 and 2025. Green bars indicate long-term government bond yields, while yellow bars indicate residential mortgage interest rates. Values are percentages. The sources are Eurostat and the European Central Bank, including ECB MFI Interest Rate Statistics.
Belgium:
• 2020: government bond yield −0.2%; residential mortgage interest rate 1.3%.
• 2025: government bond yield 3.2%; residential mortgage interest rate 3.5%.
Spain:
• 2020: government bond yield 0.4%; residential mortgage interest rate 1.4%.
• 2025: government bond yield 3.2%; residential mortgage interest rate 3.4%.
France:
• 2020: government bond yield −0.2%; residential mortgage interest rate 1.2%.
• 2025: government bond yield 3.3%; residential mortgage interest rate 3.1%.
Italy:
• 2020: government bond yield 1.2%; residential mortgage interest rate 1.5%.
• 2025: government bond yield 3.6%; residential mortgage interest rate 3.8%.
Between 2020 and 2025, long-term government bond yields rose in all four countries, moving from negative or low values in 2020 to values above 3% in 2025. Residential mortgage interest rates also increased over the period. In 2025, mortgage rates were slightly higher than government bond yields in Belgium, Spain and Italy, while the French mortgage rate was slightly lower than its government bond yield.
Indeed, this demand for a rapid return on investment appears urgent: more than half of co-owners expect a payback within five years, including nearly 20% who look for a return in less than a year. At the other extreme, nearly 1 in 5 believes that “it always costs more than it delivers”.
Yet the actual payback period for a comprehensive energy retrofit typically ranges from 10 to 20 years. This gap between expectation and reality points to a structural bottleneck: most co-owners will commit only under conditions that the market is currently unable to offer.
Fig. 67 – Acceptable payback period for energy efficiency retrofit investments in co-owned properties
Download this infographic for your presentations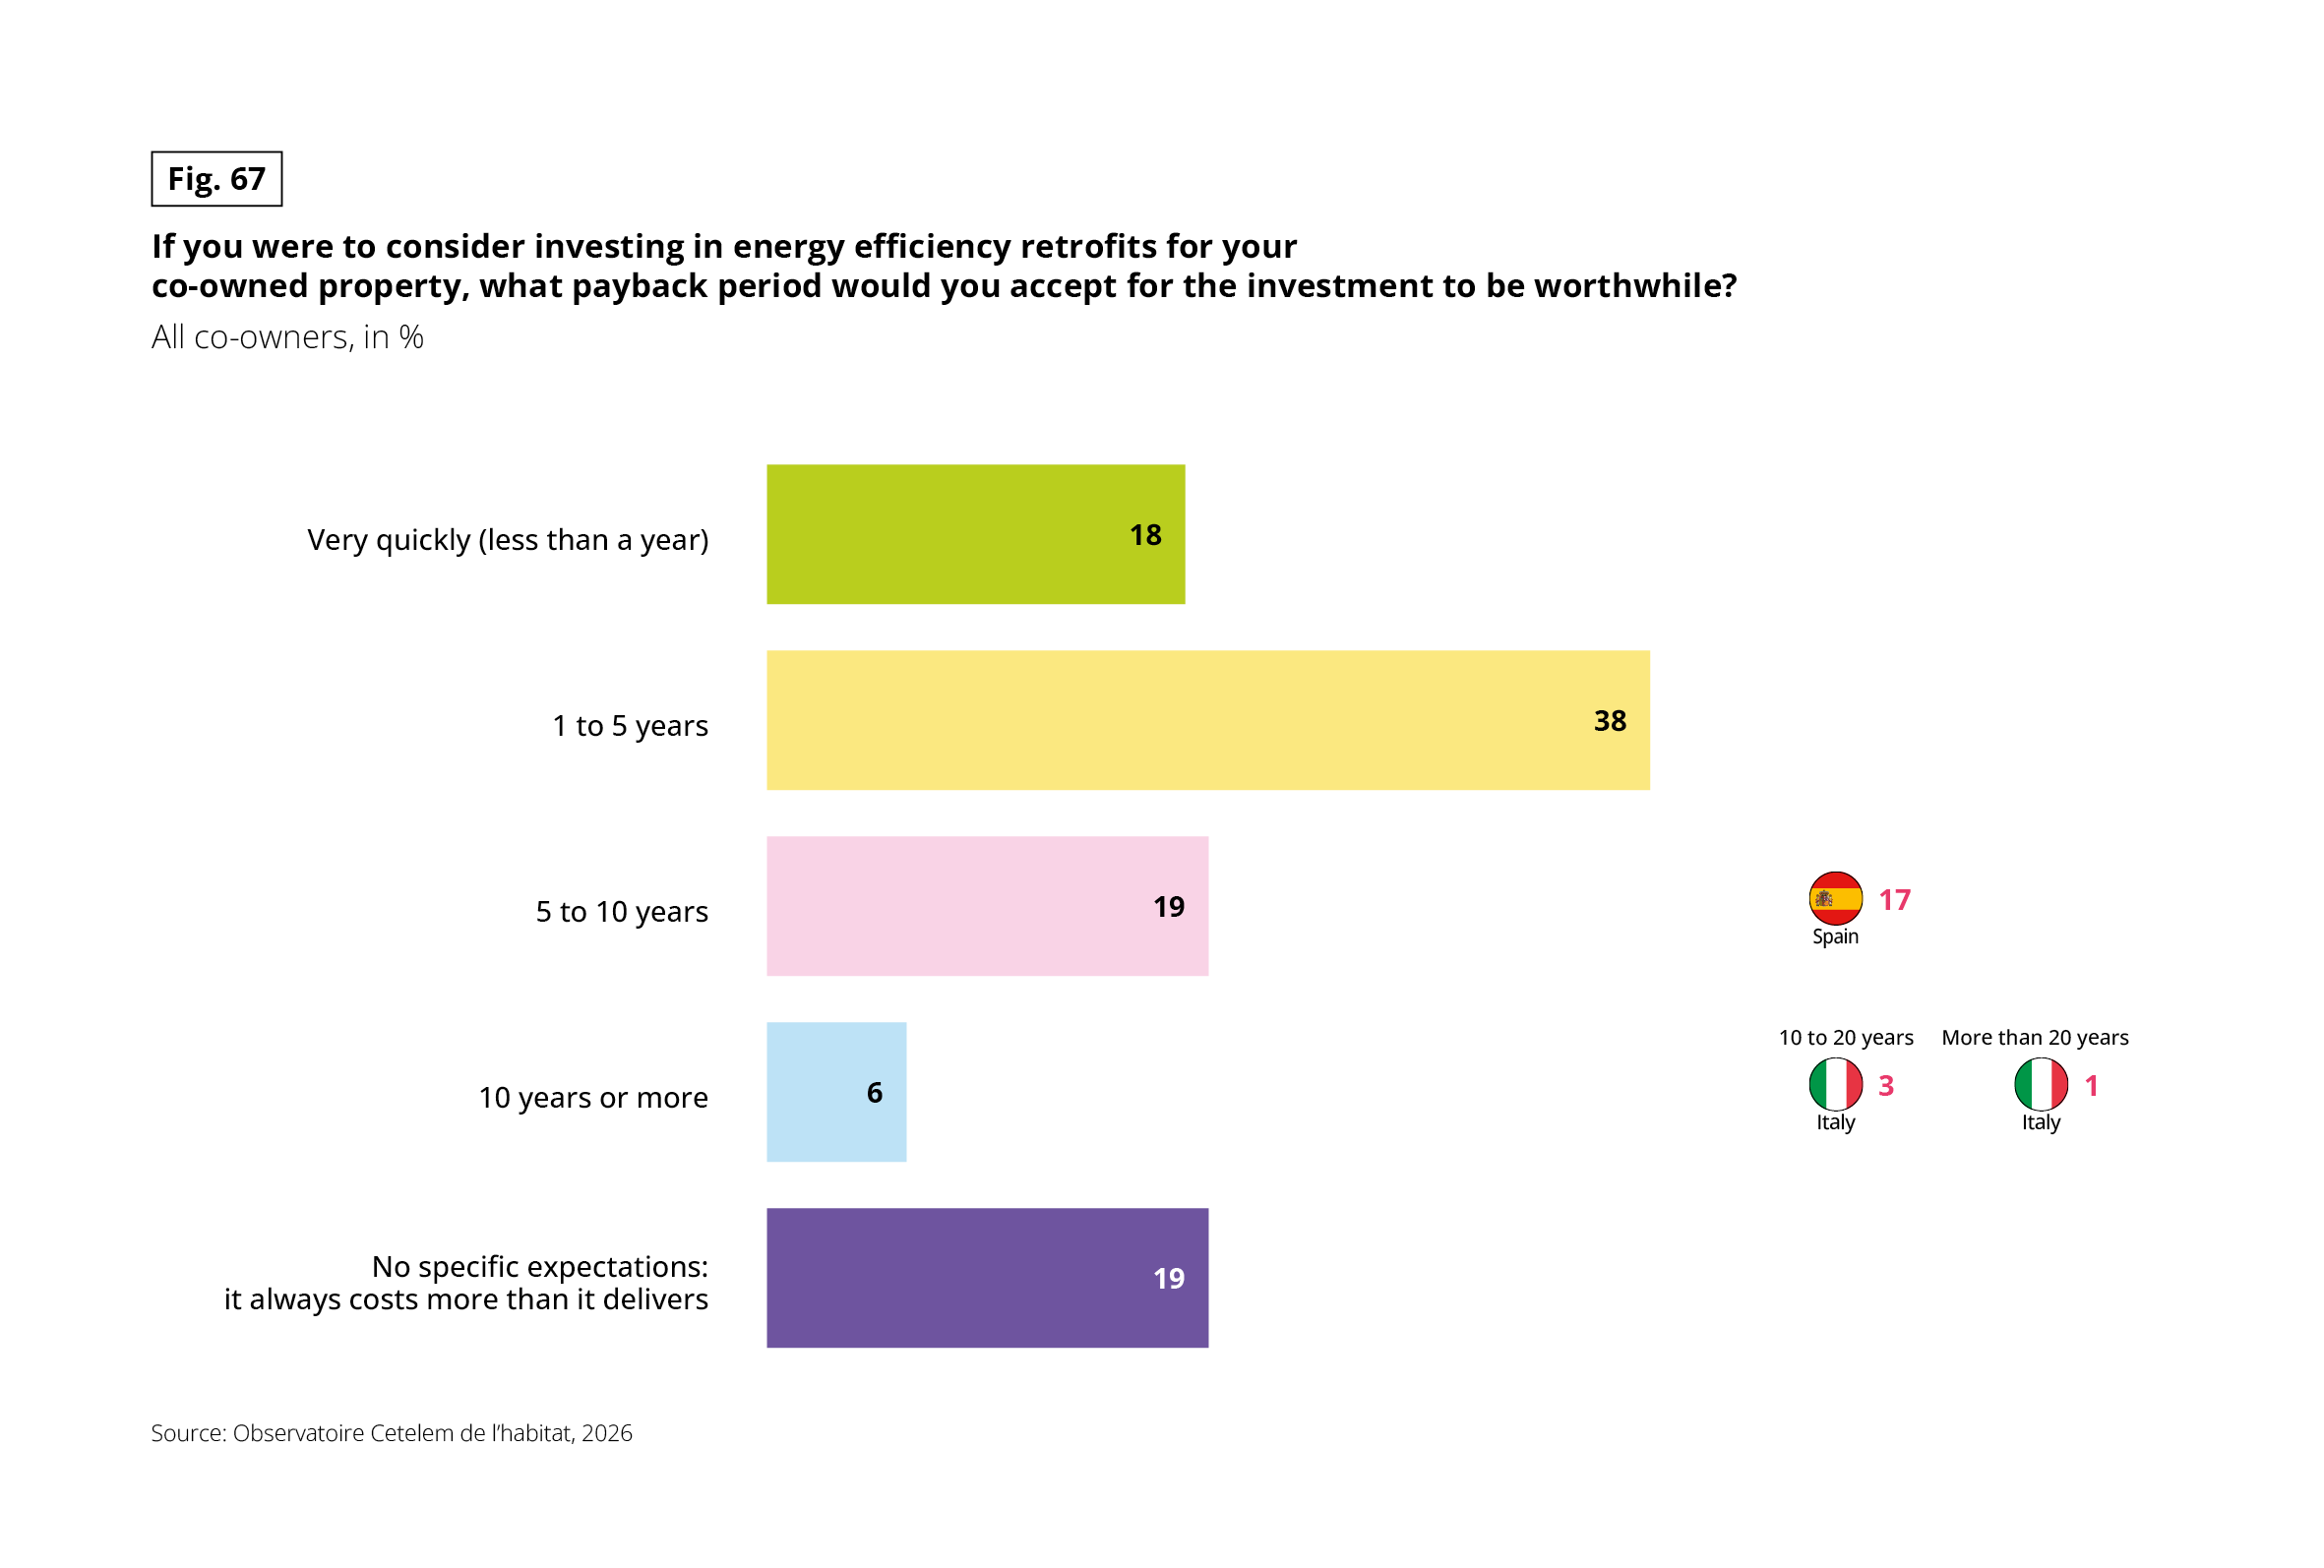 The infographic presents the payback periods that co-owners would consider acceptable when assessing whether an investment in energy efficiency retrofits for their jointly owned property is worthwhile. Five horizontal bars show the distribution of responses among all co-owners. Each bar represents a response category, with its percentage displayed inside the bar. Selected country-level results appear on the right. All figures are percentages. The source is the Observatoire Cetelem de l’habitat, 2026.
Overall results:
• Very quickly, in less than one year: 18%.
• Between one and five years: 38%.
• Between five and ten years: 19%.
• Ten years or more: 6%.
• No specific expectations, because the investment is perceived as always costing more than it delivers: 19%.
The most common response is a payback period of one to five years, selected by 38% of co-owners. Equal proportions of respondents, at 19% each, accept a payback period of five to ten years or report having no specific expectations because they believe retrofit investments always cost more than they deliver. A further 18% expect the investment to pay back in less than one year, while 6% accept a period of ten years or more.
Selected country comparisons:
• Spain: 17% of co-owners accept a payback period of five to ten years.
• Italy: 3% accept a payback period of ten to twenty years.
• Italy: 1% accept a payback period of more than twenty years.
Overall, most co-owners who specify an acceptable payback period favour relatively short investment recovery times. The results also reveal a group of respondents who do not expect energy efficiency retrofits to deliver sufficient value to justify their costs. These findings highlight the importance of clearly communicating expected energy savings, investment costs and estimated payback periods when presenting retrofit projects to co-owners.
A POWERFUL PUBLIC LEVER, UNEVENLY DEPLOYED
To compensate for these limited financial means, public support serves as a decisive lever. However, governments must still provide the necessary backing, and situations vary sharply across borders on this front.
In 2024, France allocated 1.4% of its GDP to public housing expenditure, whereas Italy, following a peak of 4.4% in 2023 driven by its Superbonus scheme, has already dropped back to 0.8%, with other countries sitting between 0.4% and 0.6%.(1)
Their room for manoeuvre is further constrained as all public accounts remain in deficit, ranging from -3.2% of GDP in Spain (the least strained) to -5.8% in France, the highest deficit in the cohort.(1)
France provides a concrete illustration of this: in the absence of an approved budget, MaPrimeRénov’ was suspended on 1 January 2026, freezing roughly 38,000 co-owned property applications.(2) The scheme reopened only upon the enactment of the 2026 Finance Act, and has since remained subject to strict fiscal trade-offs.
These policy stop-starts illustrate the fragility of public support that is nevertheless essential, and whose availability and terms depend on increasingly tight national budgetary balances.
Where it is deployed, this support proves decisive: among co-owned properties that have completed or formally approved works, 62% have benefited from or will benefit from public subsidies. Once activated, state support clearly tilts the balance in favour of project delivery.
1) Source: Eurostat. (2) Source: Banque des Territoires, “MaPrimeRénov’: suspension on 1 January, reopening and budget allocation”, 2026
Fig. 68 – Use of government grants and public subsidies for energy efficiency retrofits across Europe
Download this infographic for your presentations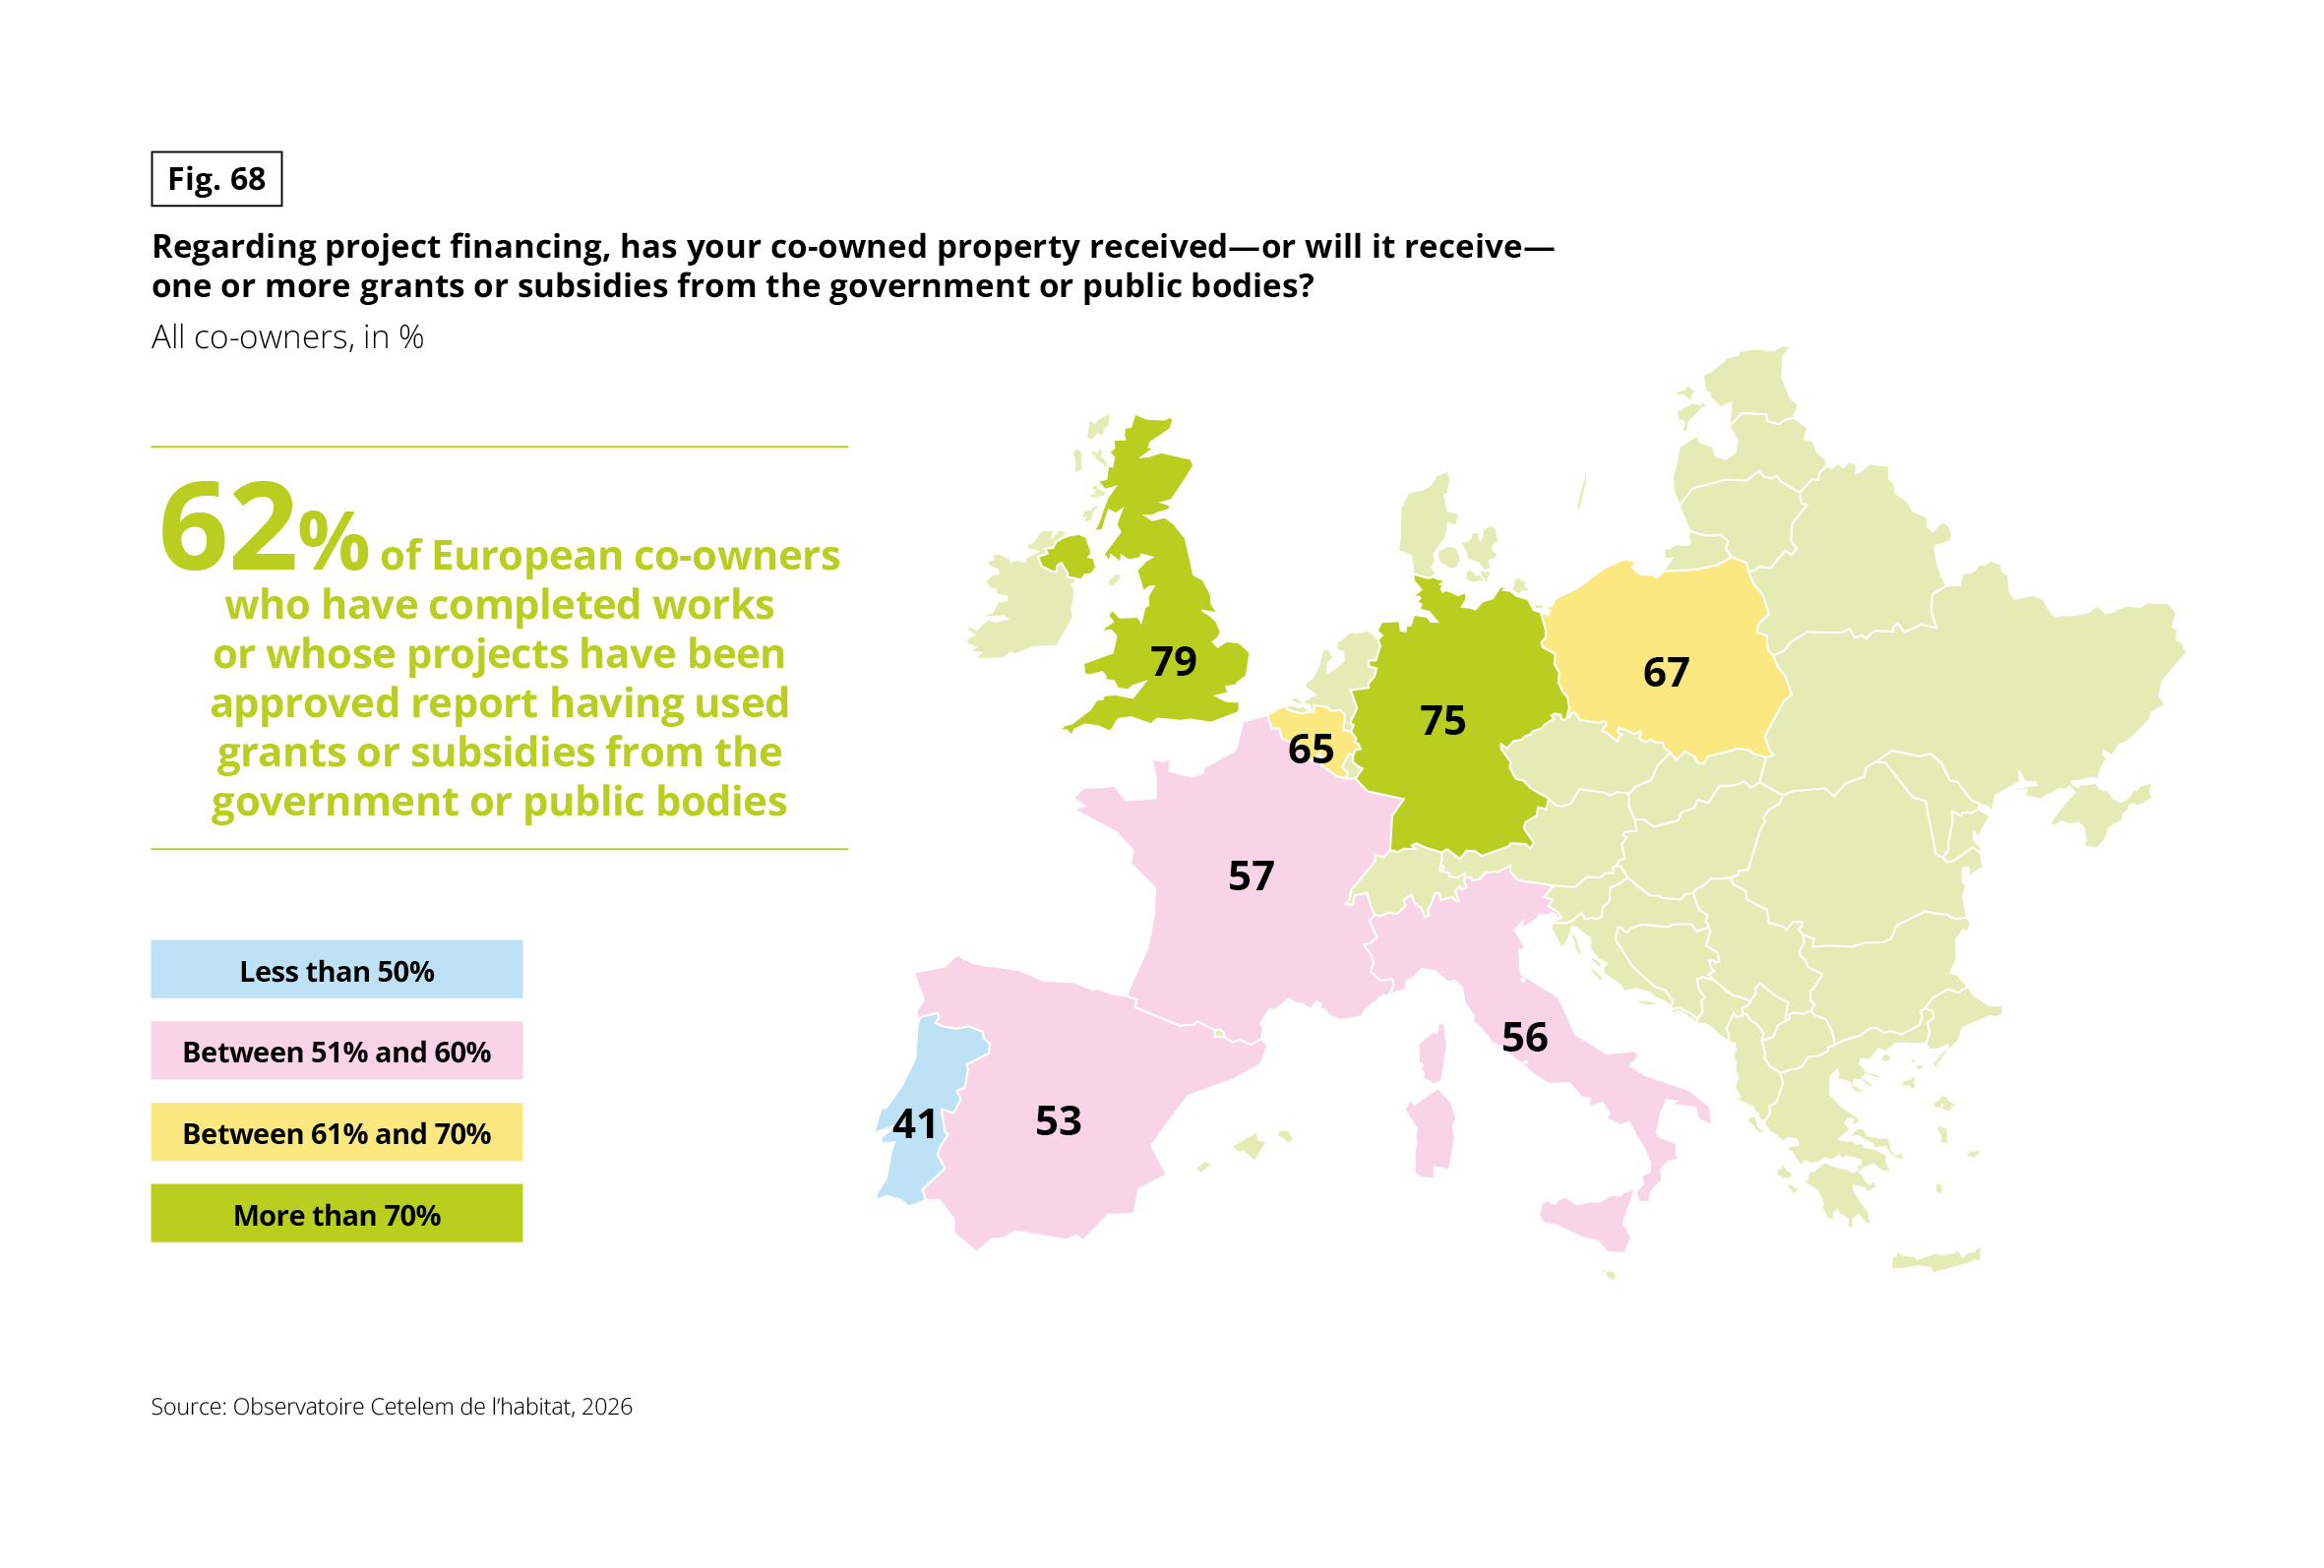 The infographic uses a map of Europe to show the percentage of co-owners whose properties have received, or are expected to receive, grants or subsidies from government or public bodies to finance energy efficiency retrofit projects. The headline figure refers specifically to co-owners whose works have been completed or whose projects have been approved or nearly approved. It states that 62% of this group across Europe report having used grants or subsidies. The source is the Observatoire Cetelem de l’habitat, 2026.
The legend divides countries into four colour-coded percentage ranges:
• Less than 50%.
• Between 51% and 60%.
• Between 61% and 70%.
• More than 70%.
The map displays the following country values:
• United Kingdom: 79%.
• Germany: 75%.
• Poland: 67%.
• Belgium: 65%.
• France: 57%.
• Italy: 56%.
• Spain: 53%.
• Portugal: 41%.
The United Kingdom has the highest displayed value, at 79%, followed by Germany at 75%. Poland and Belgium fall within the 61% to 70% range. France, Italy and Spain fall within the 51% to 60% range. Portugal is below 50%, at 41%.
The map uses geographic positioning and colour to compare countries visually. The country labels provide the exact percentages and should be used as the primary source for conveying the figures in an accessible format. The headline figure of 62% refers to a specific subgroup whose works are completed or whose projects have been approved or nearly approved; it should not be interpreted as the percentage of all European co-owners.
Yet for the majority of co-owned properties, public support remains out of reach, and the obstacle is not a lack of understanding. Schemes are broadly understood, with nearly 6 in 10 co-owners (59%) considering them easy to comprehend. The bottleneck lies elsewhere, in accessibility and implementation.
Barely 14% find schemes both simple to understand and easy to access, whereas 45% report that they are clear in principle but difficult to mobilise, 28% view them as overly complex, and 13% are entirely unaware of them. In total, nearly 9 out of 10 co-owners do not have straightforward access to public funding.
Fig. 69 – Co-owners’ perceptions of public grant and subsidy schemes for energy efficiency retrofits
Download this infographic for your presentations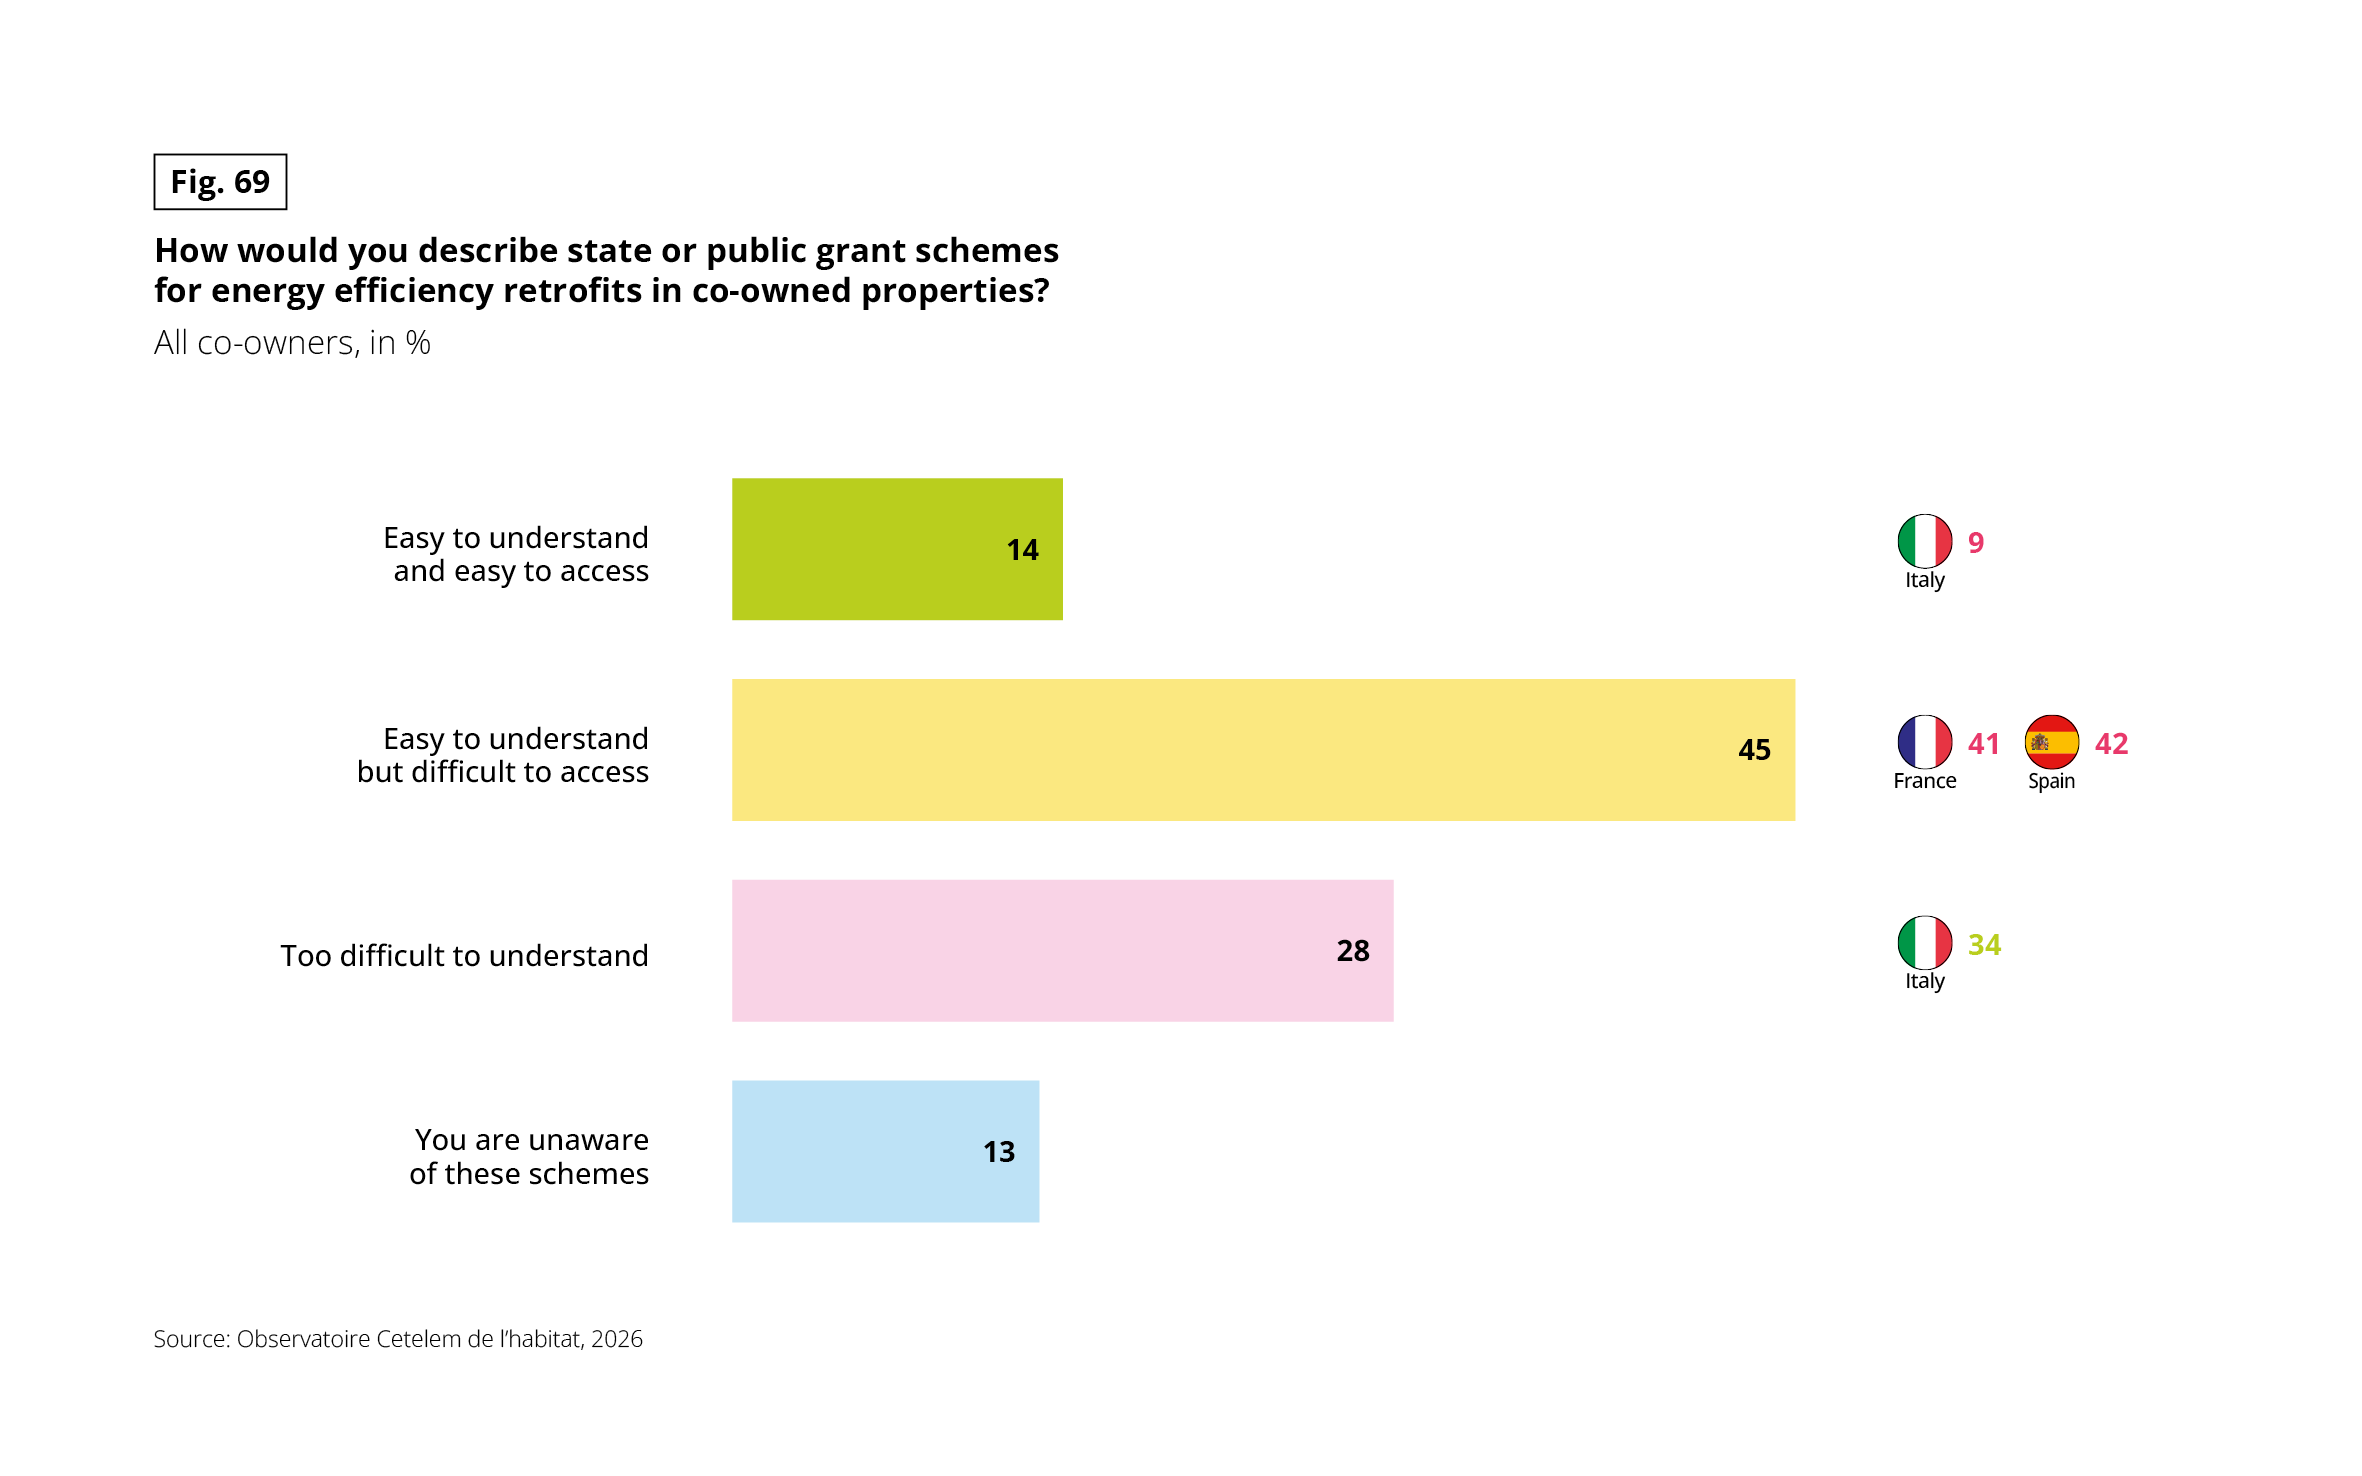 The infographic describes how co-owners perceive government or public grant schemes for energy efficiency retrofit projects in jointly owned properties. Four horizontal bars show the overall responses, and selected country comparisons appear on the right. All figures are percentages of co-owners. The source is the Observatoire Cetelem de l’habitat, 2026.
Overall responses:
• 14% say the schemes are easy to understand and easy to access.
• 45% say the schemes are easy to understand but difficult to access.
• 28% say the schemes are too difficult to understand.
• 13% are unaware of these schemes.
Country comparisons shown in the infographic:
• For schemes that are easy to understand and easy to access, Italy records 9%.
• For schemes that are easy to understand but difficult to access, France records 41% and Spain 42%.
• For schemes that are too difficult to understand, Italy records 34%.
The most common response overall is that grant schemes are easy to understand but difficult to access, at 45%. A further 28% find them too difficult to understand, while 13% are unaware of their existence. Only 14% consider the schemes both easy to understand and easy to access. The results suggest that access and administrative complexity are significant barriers to the use of public financial support for energy efficiency retrofits.
In practice, taking up public support and easily accessing it reflect the exact same divide encountered at every stage. Uptake rises from 36% in the most financially constrained co-owned properties to 70% in the most affluent, and from 50% in large developments to 73% in small ones.
Ease of access to these schemes follows the same upward curve, climbing from barely 4% in constrained properties to 21% in affluent ones, and from 9% in large residential complexes to 21% in the smallest ones. This means that public support structurally fails those who need it most.
HOUSING PROFESSIONALS FOR GUIDANCE, FINANCIAL ACTORS FOR FUNDING
To guide them through their projects, co-owners place their trust first and foremost in local, on-the-ground players: specialized installers and building managers lead the way, ahead of financial actors such as banks and insurers.
However, when it comes to the funding itself, the hierarchy is reversed: co-owners turn primarily to the financial sector, with banks or credit institutions taking precedence over building managers, a trend even more pronounced across the four focus countries. Ultimately, financing is the arena where the financial sector takes the lead, with banks playing the primary role, a natural positioning that can be leveraged to support co-owners in delivering their projects.
Finally, regarding how to accelerate progress, no single approach commands a clear majority, though incentive takes precedence over compulsion: a third (33%) consider encouraging decisions at general meetings through grants and financial incentives to be the most effective approach, ahead of freedom of choice (25%), simplifying voting rules (21%) and regulatory mandates targeting energy-inefficient properties (21%).(1) The anticipated lever is therefore, once again, financial: it is by lowering costs and facilitating collective decision-making, rather than through compulsion, that retrofit projects will be unblocked.
(1) Source : Observatoire Cetelem de l’habitat, 2026. “In your country, which approach do you believe would be most effective in accelerating energy efficiency retrofits in co-owned properties?” All co-owners, in %.
Fig. 70 – Perceived support and preferred financing solutions for energy efficiency retrofits
Download this infographic for your presentations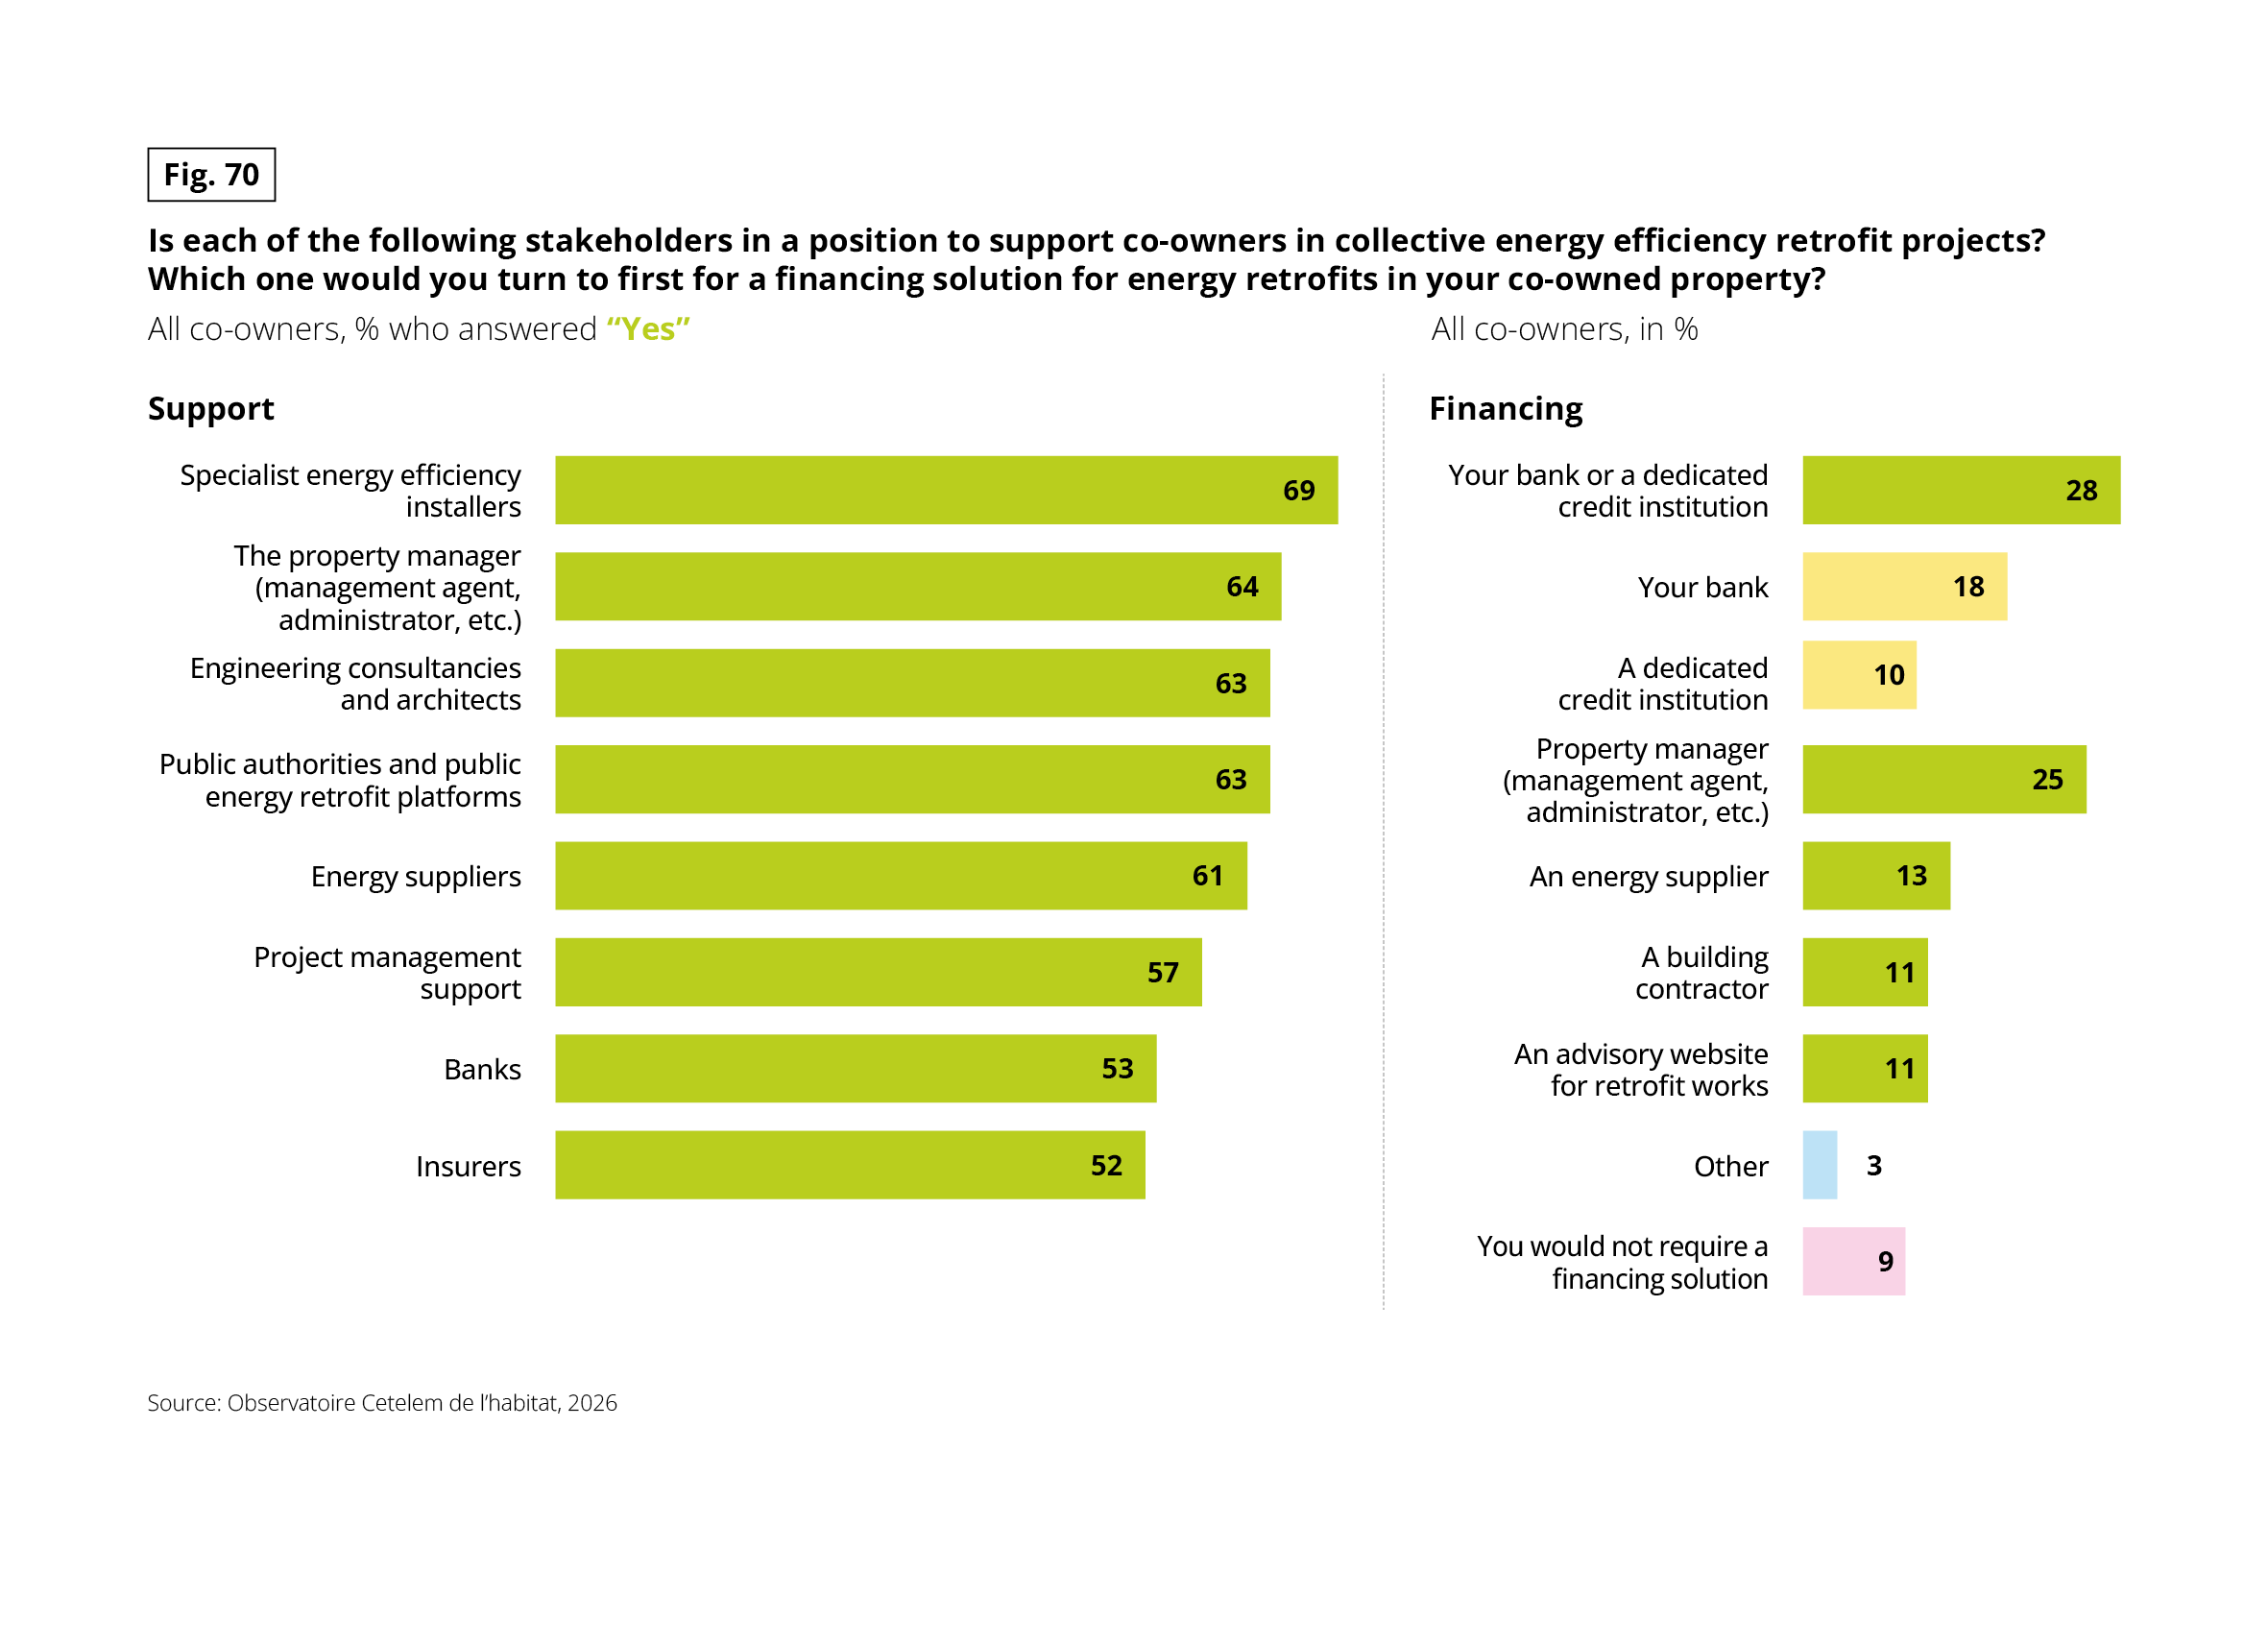 The infographic contains two separate horizontal bar charts from the Observatoire Cetelem de l’habitat, 2026. The left chart measures the perceived ability of different stakeholders to support co-owners in collective energy efficiency retrofit projects. Its figures represent the percentage of co-owners who answered “Yes” to the question about each stakeholder’s ability to provide support. The right chart shows the stakeholder that co-owners would approach first for a financing solution. Its figures represent percentages of all co-owners.
Support:
• Specialist energy efficiency installers: 69%.
• Property managers, including management agents and administrators: 64%.
• Engineering consultancies and architects: 63%.
• Public authorities and public energy retrofit platforms: 63%.
• Energy suppliers: 61%.
• Project management support: 57%.
• Banks: 53%.
• Insurers: 52%.
Specialist energy efficiency installers receive the highest support rating, at 69%. Property managers rank second, while engineering consultancies and architects and public authorities or retrofit platforms are tied at 63%.
Preferred first contact for financing:
• Bank or dedicated credit institution, as a combined option: 28%.
• Property manager, including management agent or administrator: 25%.
• Bank: 18%.
• Energy supplier: 13%.
• Building contractor: 11%.
• Advisory website for retrofit works: 11%.
• Dedicated credit institution: 10%.
• No financing solution required: 9%.
• Other: 3%.
The combined option of a bank or dedicated credit institution is the most frequently selected first contact for financing, at 28%, followed by property managers at 25%. The combined option is a separate response category from the individual bank and dedicated credit institution categories, so these percentages should not be added together without further information about the questionnaire design.
HOUSING AND ENERGY IN EUROPE
KEY FIGURES
- 69% consider their energy budget to be reasonable or low
- 82% report that their electricity bill has increased over the last 12 months
- 85% are looking to reduce their energy consumption
- 46% are considering works to improve their home’s energy efficiency
- 28% wish to move house within the next 12 months
- 65% believe it is preferable for everyone to have a say in their building or neighbourhood’s energy choices
ENERGY EFFICIENCY RETROFITS AND CO-OWNED PROPERTIES
KEY FIGURES
- 87% of co-owners consider energy efficiency retrofits to be an important or priority topic
- Only 23% have already completed or agreed upon energy retrofit works
- 46% have not yet made a decision or are not considering the matter
- 86% could consider a loan to finance their share of the works, subject to certain conditions
- 62% have benefited or will benefit from public grants or subsidies
- Only 14% find public grants easy to understand and access