Europe slowly recovers, as the Franco-German tandem engages in self-reflection


With its annual Barometer, L’Observatoire Cetelem charts a weather map of European consumers, by questioning them about their mood, their personal economic circumstances and those of their country, as well as their attitude to consumption and savings. We could just as easily use a medical metaphor and call it a thermometer, given the crises that Europeans have faced in recent years, putting their health to the test in both the literal and figurative senses. The Barometer’s first two indicators – perceptions of the overall situation in the country and feelings regarding personal circumstances – have followed broadly similar trends over the period, keeping in step with the various events that have impacted global affairs.
THE OVERALL SITUATION IN EACH COUNTRY: A SLOW UPTURN
When it comes to how they perceive the situation in their country, Europeans once again report a slight improvement, without being overly optimistic. With a score of 5.2, opinions have improved by a meagre 0.1 points, an increase equal to last year’s. As a result, we are creeping back towards the peak attained in recent years, i.e., the modest score of 5.4 recorded as the Covid-19 crisis was ending, which was not exactly much to shout about.
Belgium continues to post the highest score, despite the country’s unstable political climate, which seems to have had little impact on people’s opinions in this area. This year, it is joined at the top of the ranking by Sweden, which experienced the sharpest increase in its score (+0.3 points). The biggest shift can be found at the bottom of the pile, with France posting both the Barometer’s worst score (4.6) and its biggest decline (-0.3 points). It is also worth noting that the differential between the highest and lowest scores is gradually falling. Indeed, while the gap between Germany in first place and Romania in last place was more than 2 points in 2019, the difference is just 1.2 points today and was only 1 point last year (Fig. 1 Barometer).
Fig 1 – General situation of the country according to inhabitants
Download this infographic for your presentations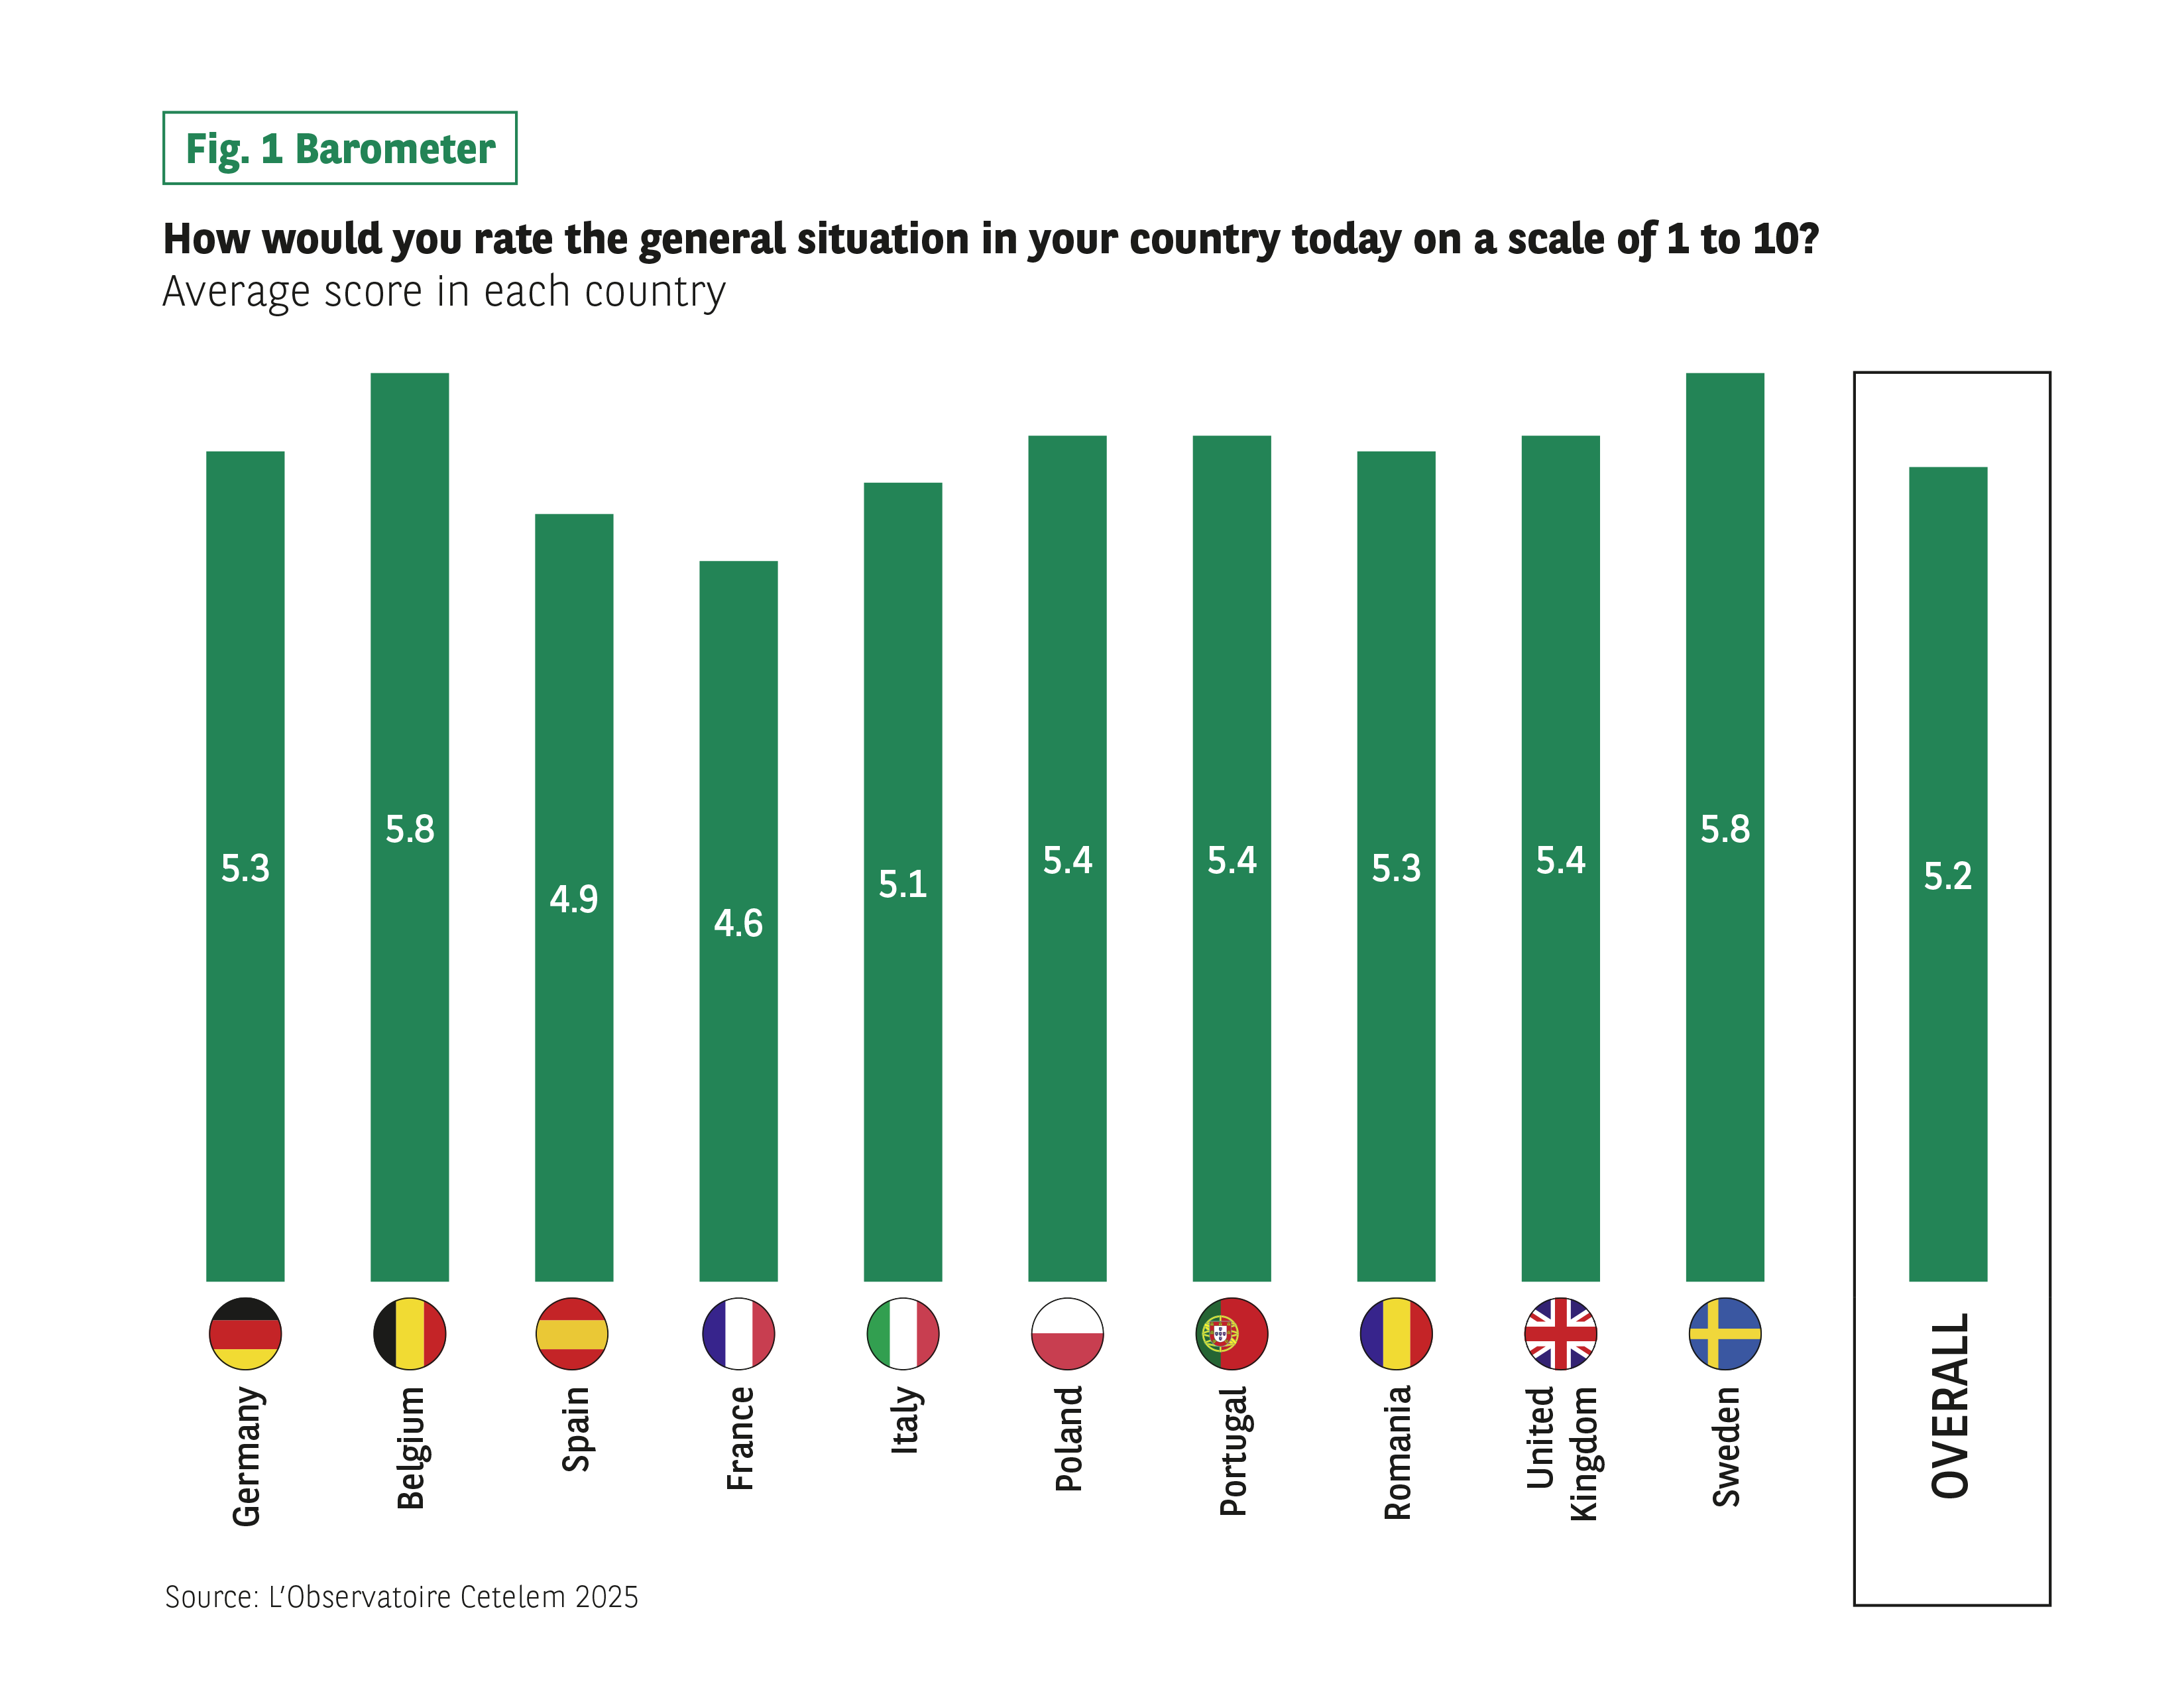 Context:
The infographic presents the question “How would you describe the current general situation in your country on a scale of 1 to 10?” The data are expressed as an average score per country. No decorative element has any informative value.
Visuals:
Vertical bars, one per country, with the score written in the center of each bar. The countries are: Belgium, France, Germany, Italy, Poland, Portugal, Romania, Spain, Sweden, United Kingdom, plus an “Ensemble” average.
Data:
Germany: 5.3
Belgium: 5.8
Spain: 4.9
France: 4.6
Italy: 5.1
Poland: 5.4
Portugal: 5.4
Romania: 5.3
United Kingdom: 5.4
Sweden: 5.8
Overall: 5.2
Main course:
Overall, the scores range from 4.6 to 5.8, with moderate variations between countries.
Source: The Cetelem 2025 Observatory.
Context:
The infographic presents the question “How would you describe the current general situation in your country on a scale of 1 to 10?” The data are expressed as an average score per country. No decorative element has any informative value.
Visuals:
Vertical bars, one per country, with the score written in the center of each bar. The countries are: Belgium, France, Germany, Italy, Poland, Portugal, Romania, Spain, Sweden, United Kingdom, plus an “Ensemble” average.
Data:
Germany: 5.3
Belgium: 5.8
Spain: 4.9
France: 4.6
Italy: 5.1
Poland: 5.4
Portugal: 5.4
Romania: 5.3
United Kingdom: 5.4
Sweden: 5.8
Overall: 5.2
Main course:
Overall, the scores range from 4.6 to 5.8, with moderate variations between countries.
Source: The Cetelem 2025 Observatory.
INDIVIDUAL MORALE IS HOLDING UP
As has always been the case since the Cetelem Barometer was created, Europeans are optimistic about their personal circumstances, with the ranking remaining virtually unchanged. The average stands at 6 and no rating has fallen. The biggest rises can be observed in Sweden and Spain, whose scores have increased by 0.2 points.
Just like last year, Belgium sits at the top of the ranking, while Poland continues to occupy the bottom spot. As with perceptions of the overall situation, the gap between the highest and lowest scores is gradually narrowing, and now stands at just 0.8 points. These results may well reflect a wait-and-see attitude among Europeans, at a time when some of the crises they have faced are subsiding, such as rocketing inflation or Covid-19, which has become an almost “ordinary” illness. However, it remains to be seen how other events will unfold and what their outcomes will ultimately be, with various geopolitical crises raging on and changes of government taking place in many countries. (Fig. 2 Barometer and Fig. 3 Barometer).
Fig 2 – Assessment of their current personal situation
Download this infographic for your presentations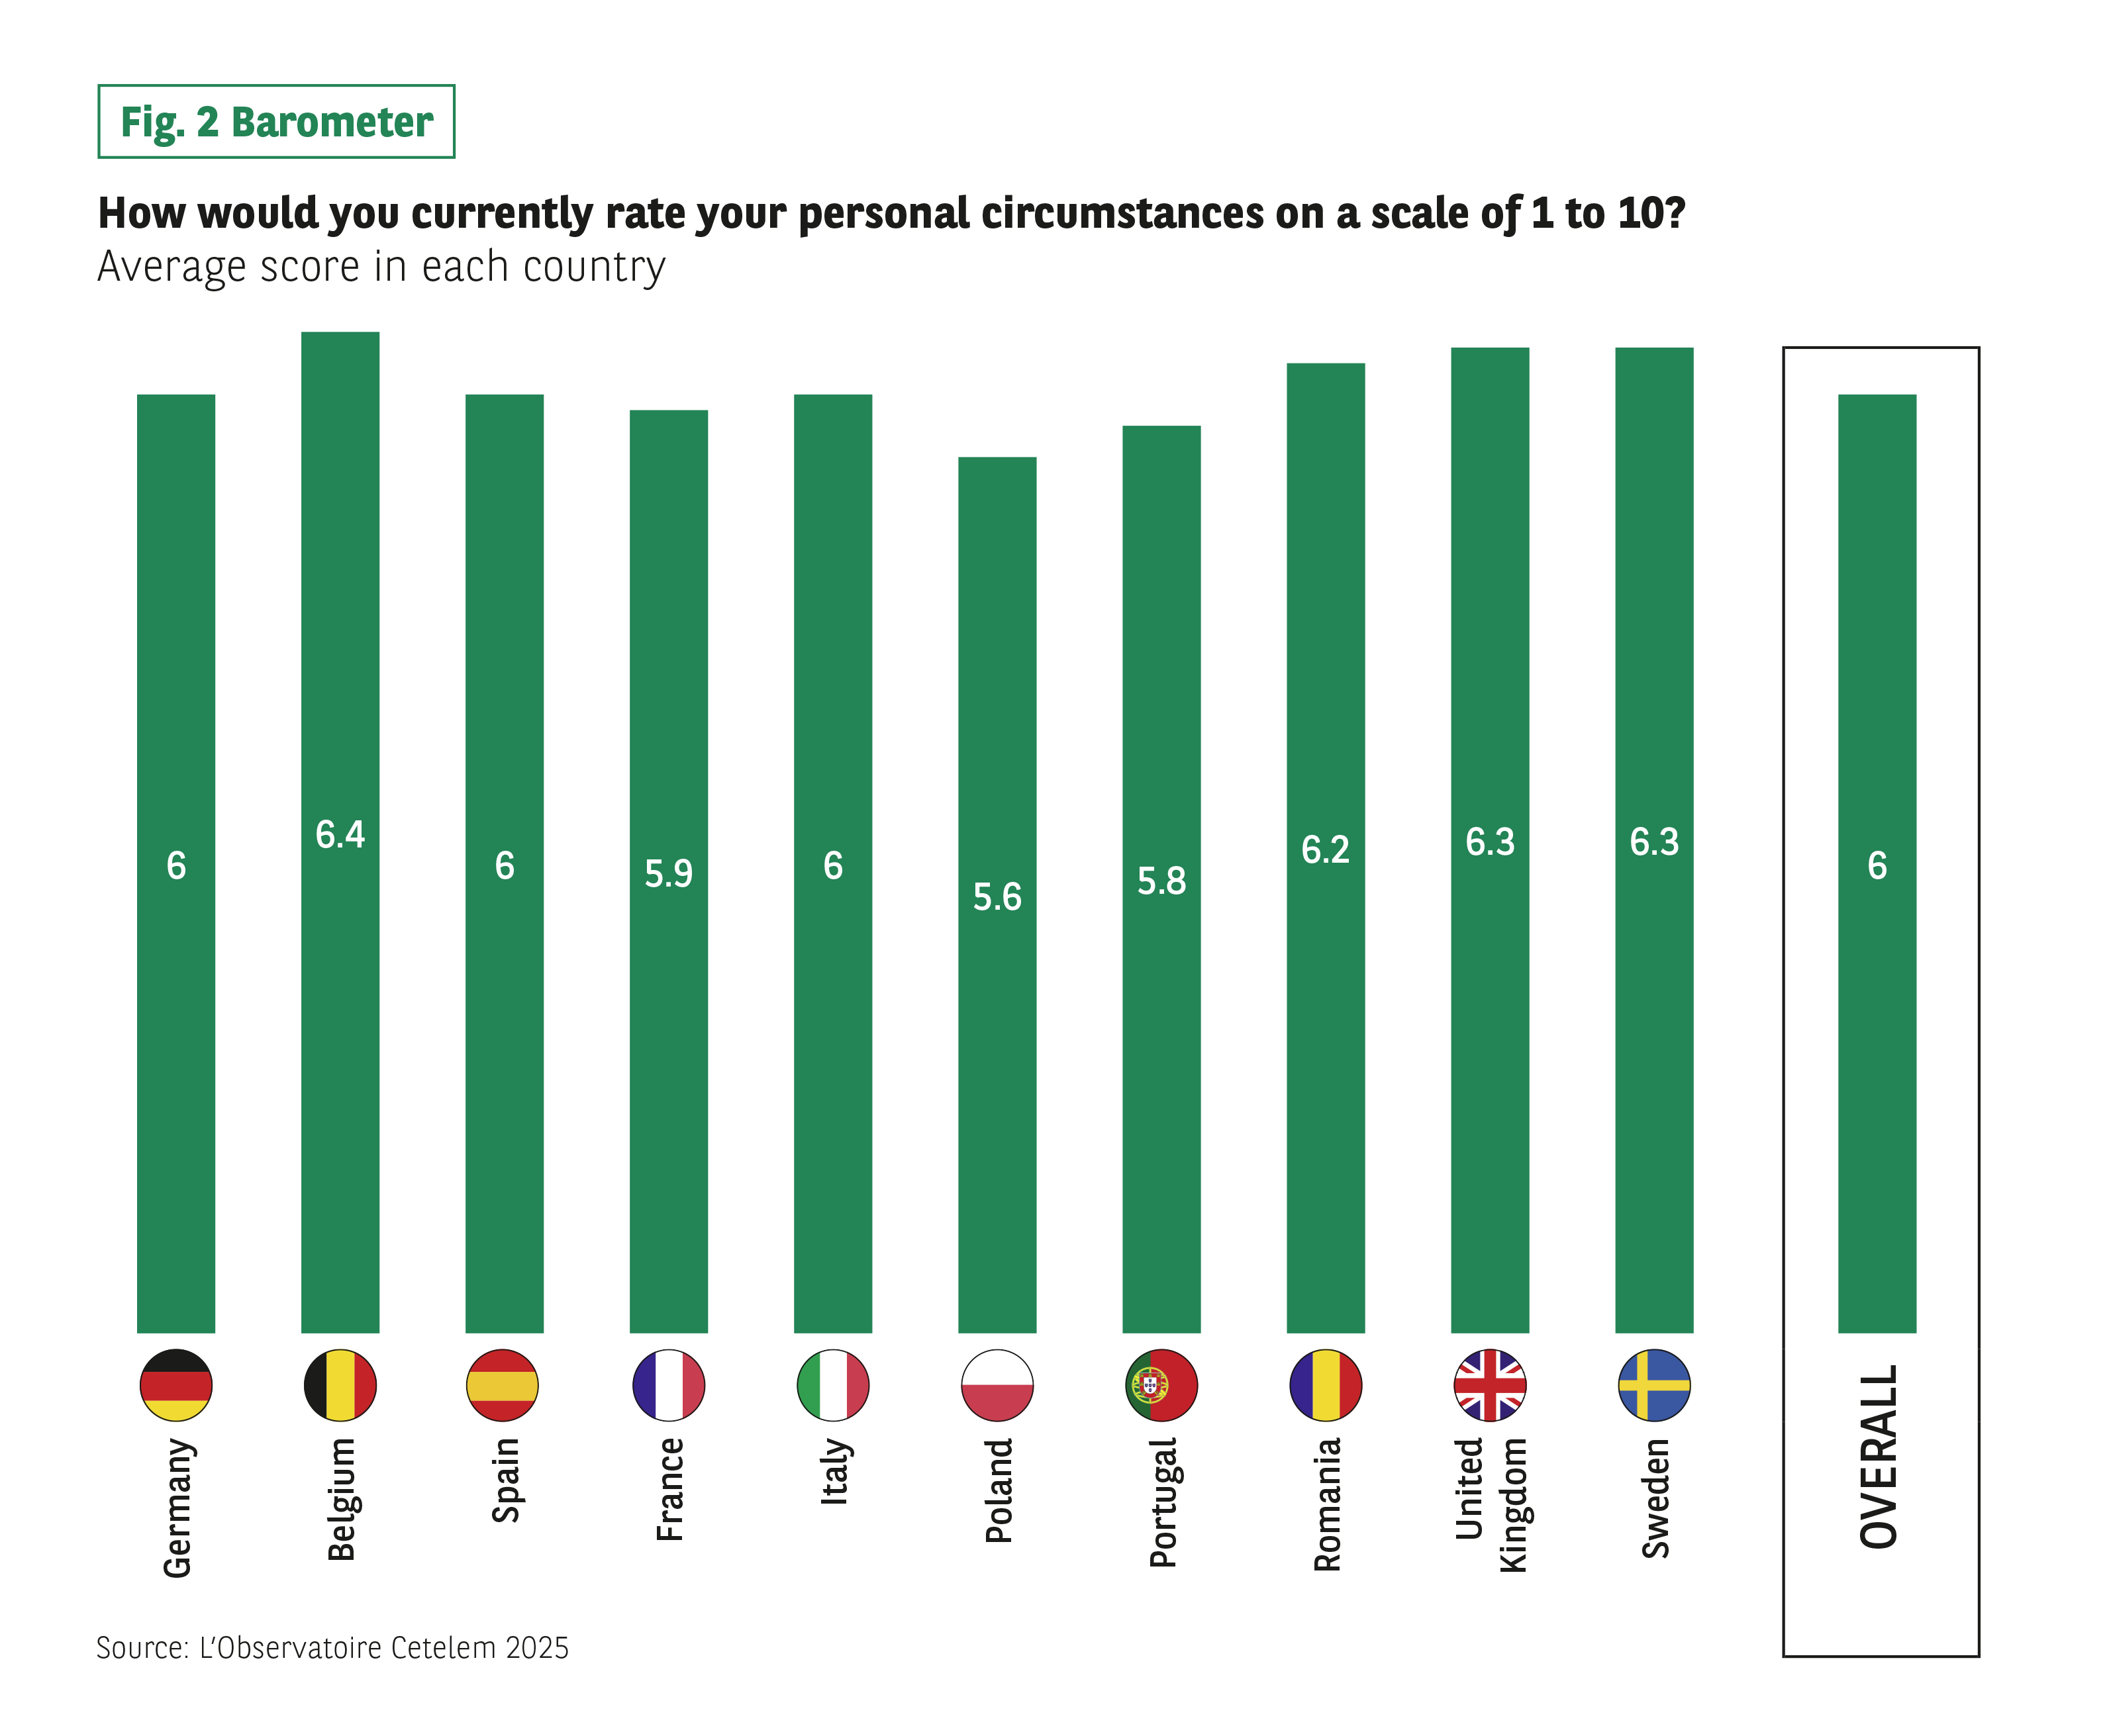 Context:
Data from the question “How would you describe your current personal situation on a scale of 1 to 10?” Values are given by country and for the whole.
Visuals:
Vertical bars, score displayed on each bar. The countries appear in the following order: Belgium, France, Germany, Italy, Poland, Portugal, Romania, Spain, Sweden, United Kingdom, Ensemble.
Data:
Germany: 6
Belgium: 6.4
Spain: 6
France: 5.9
Italy: 6
Poland: 5.6
Portugal: 5.8
Romania: 6.2
United Kingdom: 6.3
Sweden: 6.3
Set: 6
Main course:
Most scores are close to 6, with small differences between countries.
Source: The Cetelem 2025 Observatory.
Context:
Data from the question “How would you describe your current personal situation on a scale of 1 to 10?” Values are given by country and for the whole.
Visuals:
Vertical bars, score displayed on each bar. The countries appear in the following order: Belgium, France, Germany, Italy, Poland, Portugal, Romania, Spain, Sweden, United Kingdom, Ensemble.
Data:
Germany: 6
Belgium: 6.4
Spain: 6
France: 5.9
Italy: 6
Poland: 5.6
Portugal: 5.8
Romania: 6.2
United Kingdom: 6.3
Sweden: 6.3
Set: 6
Main course:
Most scores are close to 6, with small differences between countries.
Source: The Cetelem 2025 Observatory.
Fig 3 – Perceived change in expenditure saving price purchasing power
Download this infographic for your presentations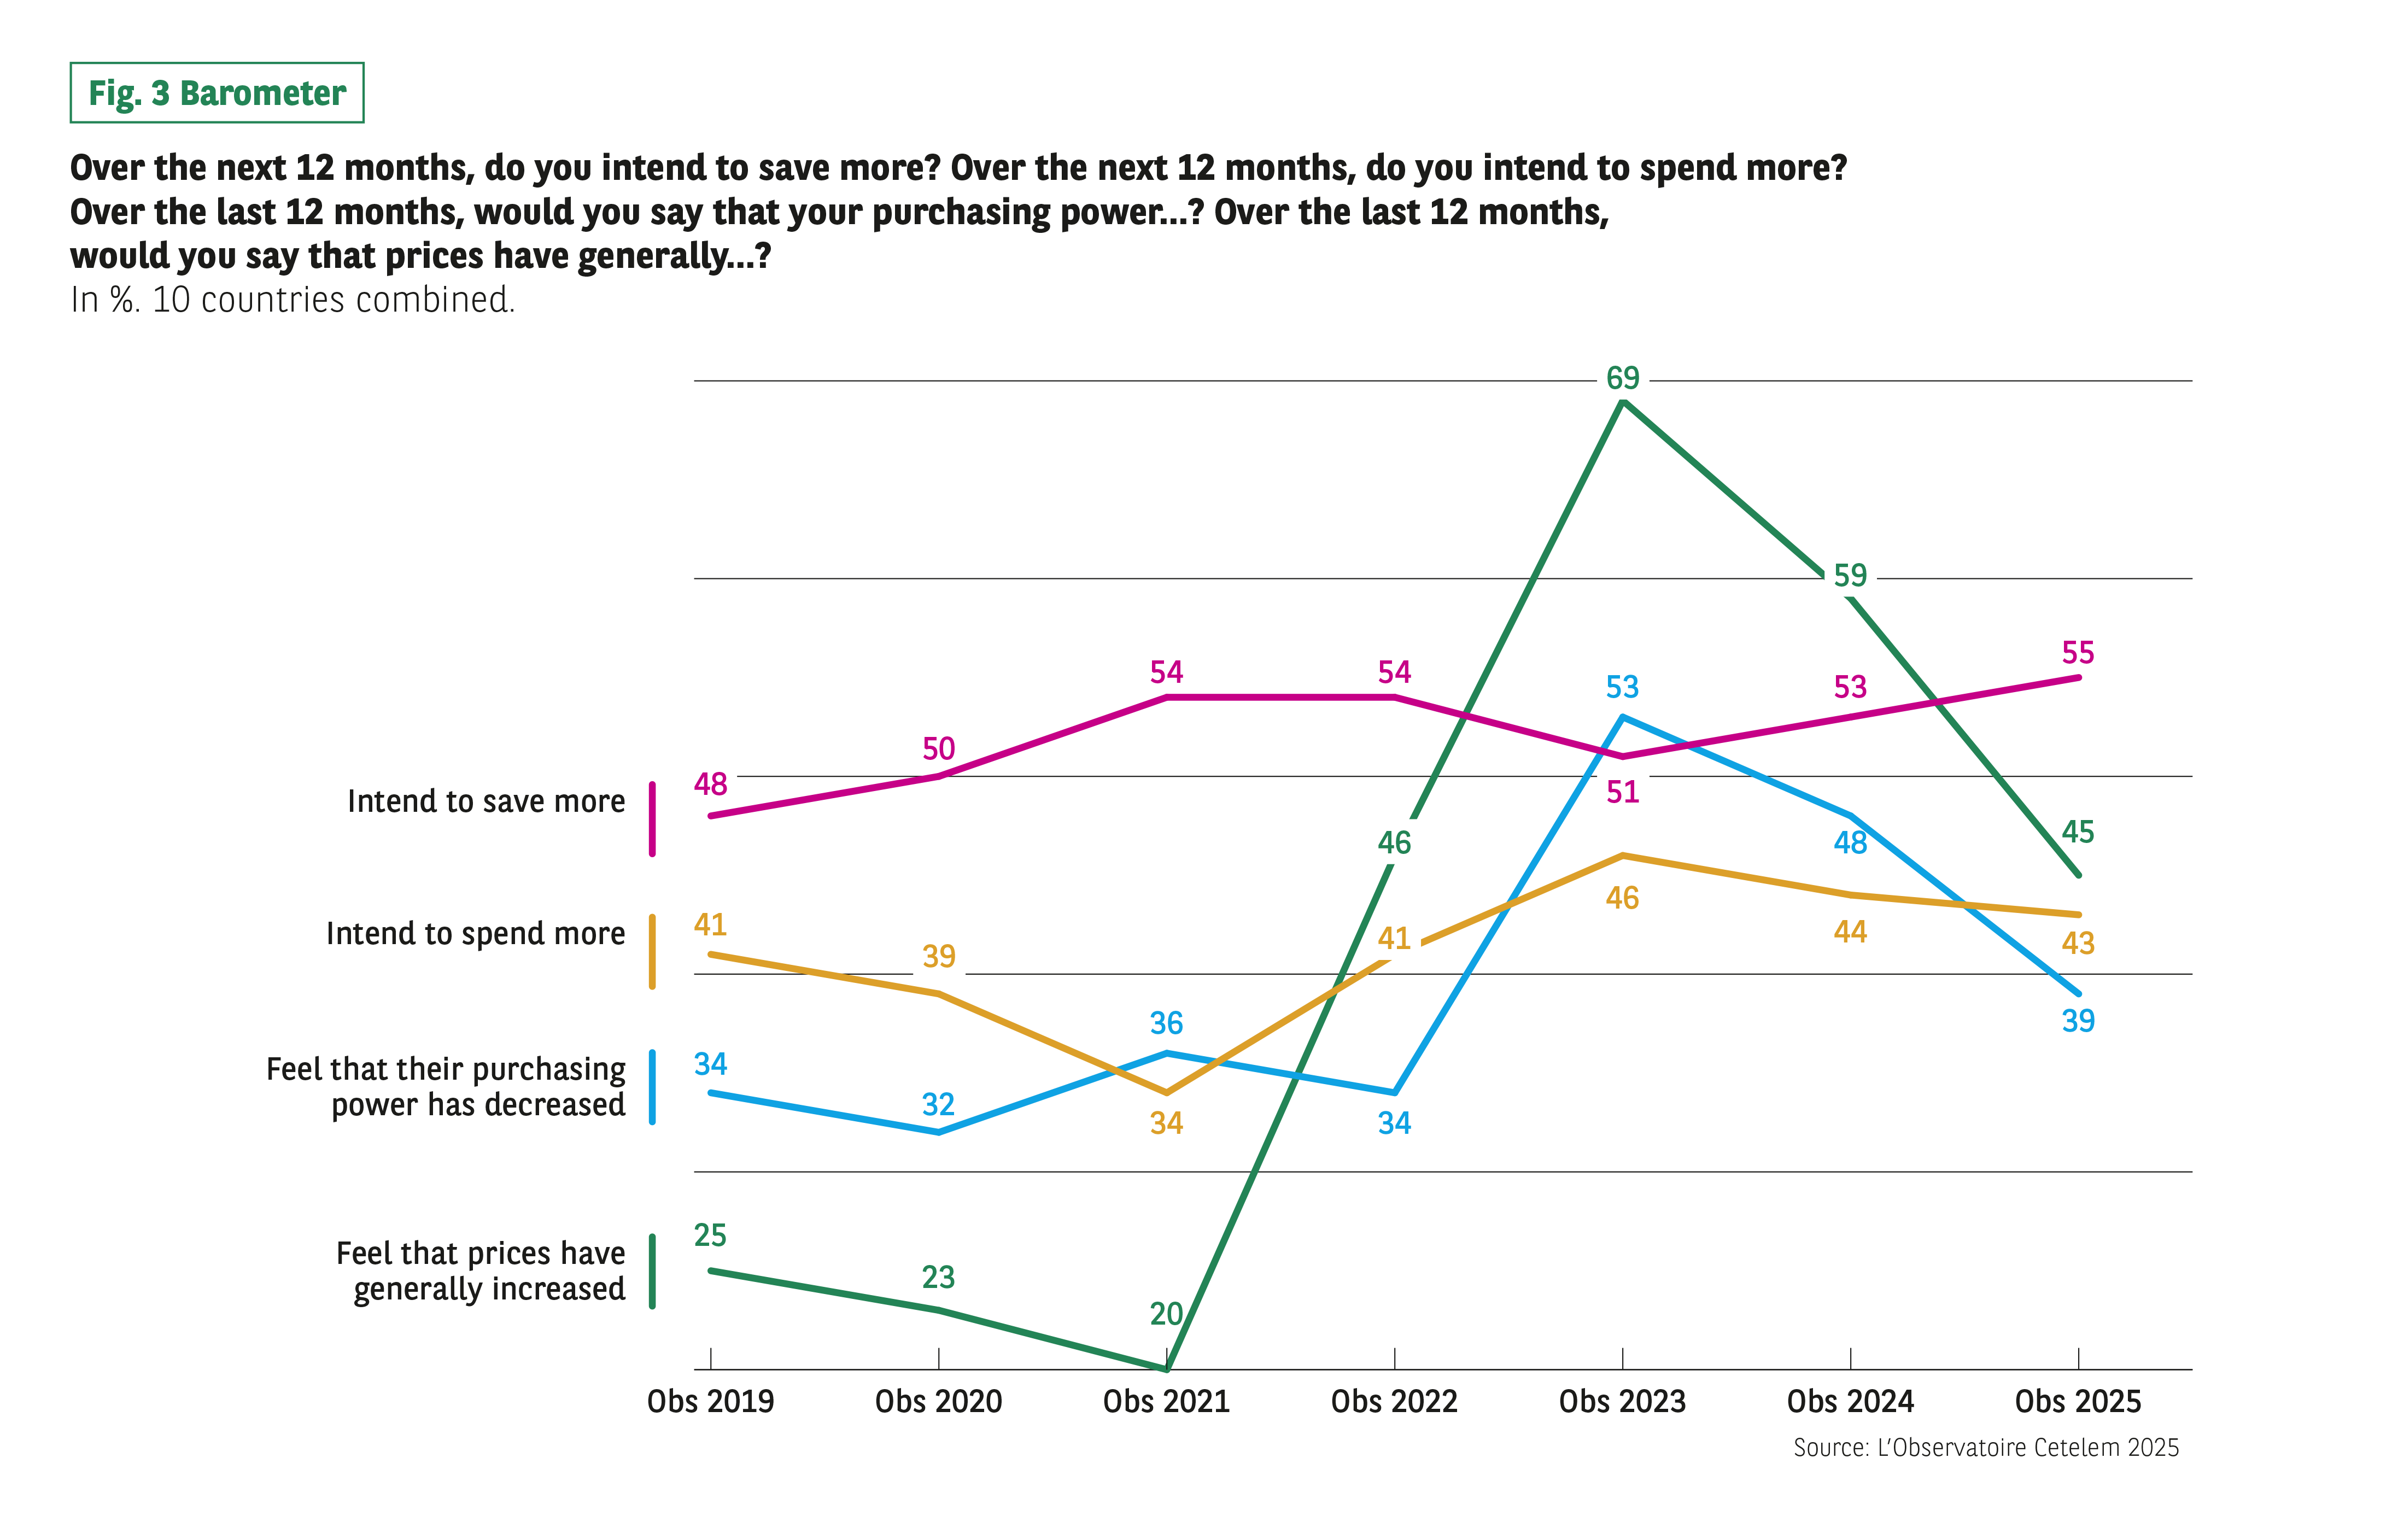 Context:
The infographic presents four indicators, expressed as a percentage of respondents, for the years 2019 to 2025 (10 countries).
Indicators:
Anticipation of increasing savings
Anticipation of increasing expenses
Feeling that their purchasing power has fallen
Feeling that prices have risen significantly
Data by year (main visible values):
Anticipated savings: 48 (2019), 50 (2020), 54 (2021), 54 (2022), 53 (2023), 53 (2024), 55 (2025).
Anticipated increase in expenditure: 41 (2019), 39 (2020), 34 (2021), 41 (2022), 46 (2023), 44 (2024), 43 (2025).
Feeling of declining purchasing power: 34 (2019), 32 (2020), 36 (2021), 34 (2022), 53 (2023), 48 (2024), 39 (2025).
Feeling that prices have risen significantly: 25 (2019), 23 (2020), 20 (2021), 46 (2022), 69 (2023), 59 (2024), 45 (2025).
Main course:
Perceptions of inflation rise sharply in 2022-2023 and then decrease. Savings expectations remain stable overall with a slight increase.
Source: The Cetelem 2025 Observatory.
Context:
The infographic presents four indicators, expressed as a percentage of respondents, for the years 2019 to 2025 (10 countries).
Indicators:
Anticipation of increasing savings
Anticipation of increasing expenses
Feeling that their purchasing power has fallen
Feeling that prices have risen significantly
Data by year (main visible values):
Anticipated savings: 48 (2019), 50 (2020), 54 (2021), 54 (2022), 53 (2023), 53 (2024), 55 (2025).
Anticipated increase in expenditure: 41 (2019), 39 (2020), 34 (2021), 41 (2022), 46 (2023), 44 (2024), 43 (2025).
Feeling of declining purchasing power: 34 (2019), 32 (2020), 36 (2021), 34 (2022), 53 (2023), 48 (2024), 39 (2025).
Feeling that prices have risen significantly: 25 (2019), 23 (2020), 20 (2021), 46 (2022), 69 (2023), 59 (2024), 45 (2025).
Main course:
Perceptions of inflation rise sharply in 2022-2023 and then decrease. Savings expectations remain stable overall with a slight increase.
Source: The Cetelem 2025 Observatory.
THE DROP IN INFLATION HAS GONE RELATIVELY UNNOTICED
Aside from public health and geopolitical crises, inflation has been the big story of recent years. By the end of 2024, it had fallen to 2.4%, not far from the symbolic 2% mark, which the European Central Bank considers to indicate price stability in the European Union. However, marked disparities between countries remain. In Belgium, Poland and Romania, inflation has stayed above 4%, while in Spain, France and Italy, it has contracted significantly and is now below the symbolic threshold. Economic experts generally agree that inflation has been brought under control faster than expected.
The Europeans surveyed for this latest Barometer appear not to share this optimism. On the whole, they still feel that prices have risen, in some cases sharply (Fig. 4 Barometer). And although this perception has clearly lost ground since last year (-14 points), 45% of respondents still consider that prices have increased markedly. The Portuguese and Romanians are by far the most pessimistic populations surveyed, despite the former having experienced a sharp drop in inflation, unlike the latter. True to form, the French take a more measured view of the issue.
This difference between reality and perception is likely due to the fact that people often only believe what they can see. When it comes to being persuaded that prices are falling, seeing is believing, and the length of time between the two can stretch over several months. We may have to wait until next year’s survey to see this demonstrated. Moreover, inflation has hit food and energy prices particularly hard. Both of these affect the lowest-income households on a daily basis and have a lasting impact on people’s perceptions.
Fig 4 – Perception of price developments by country
Download this infographic for your presentations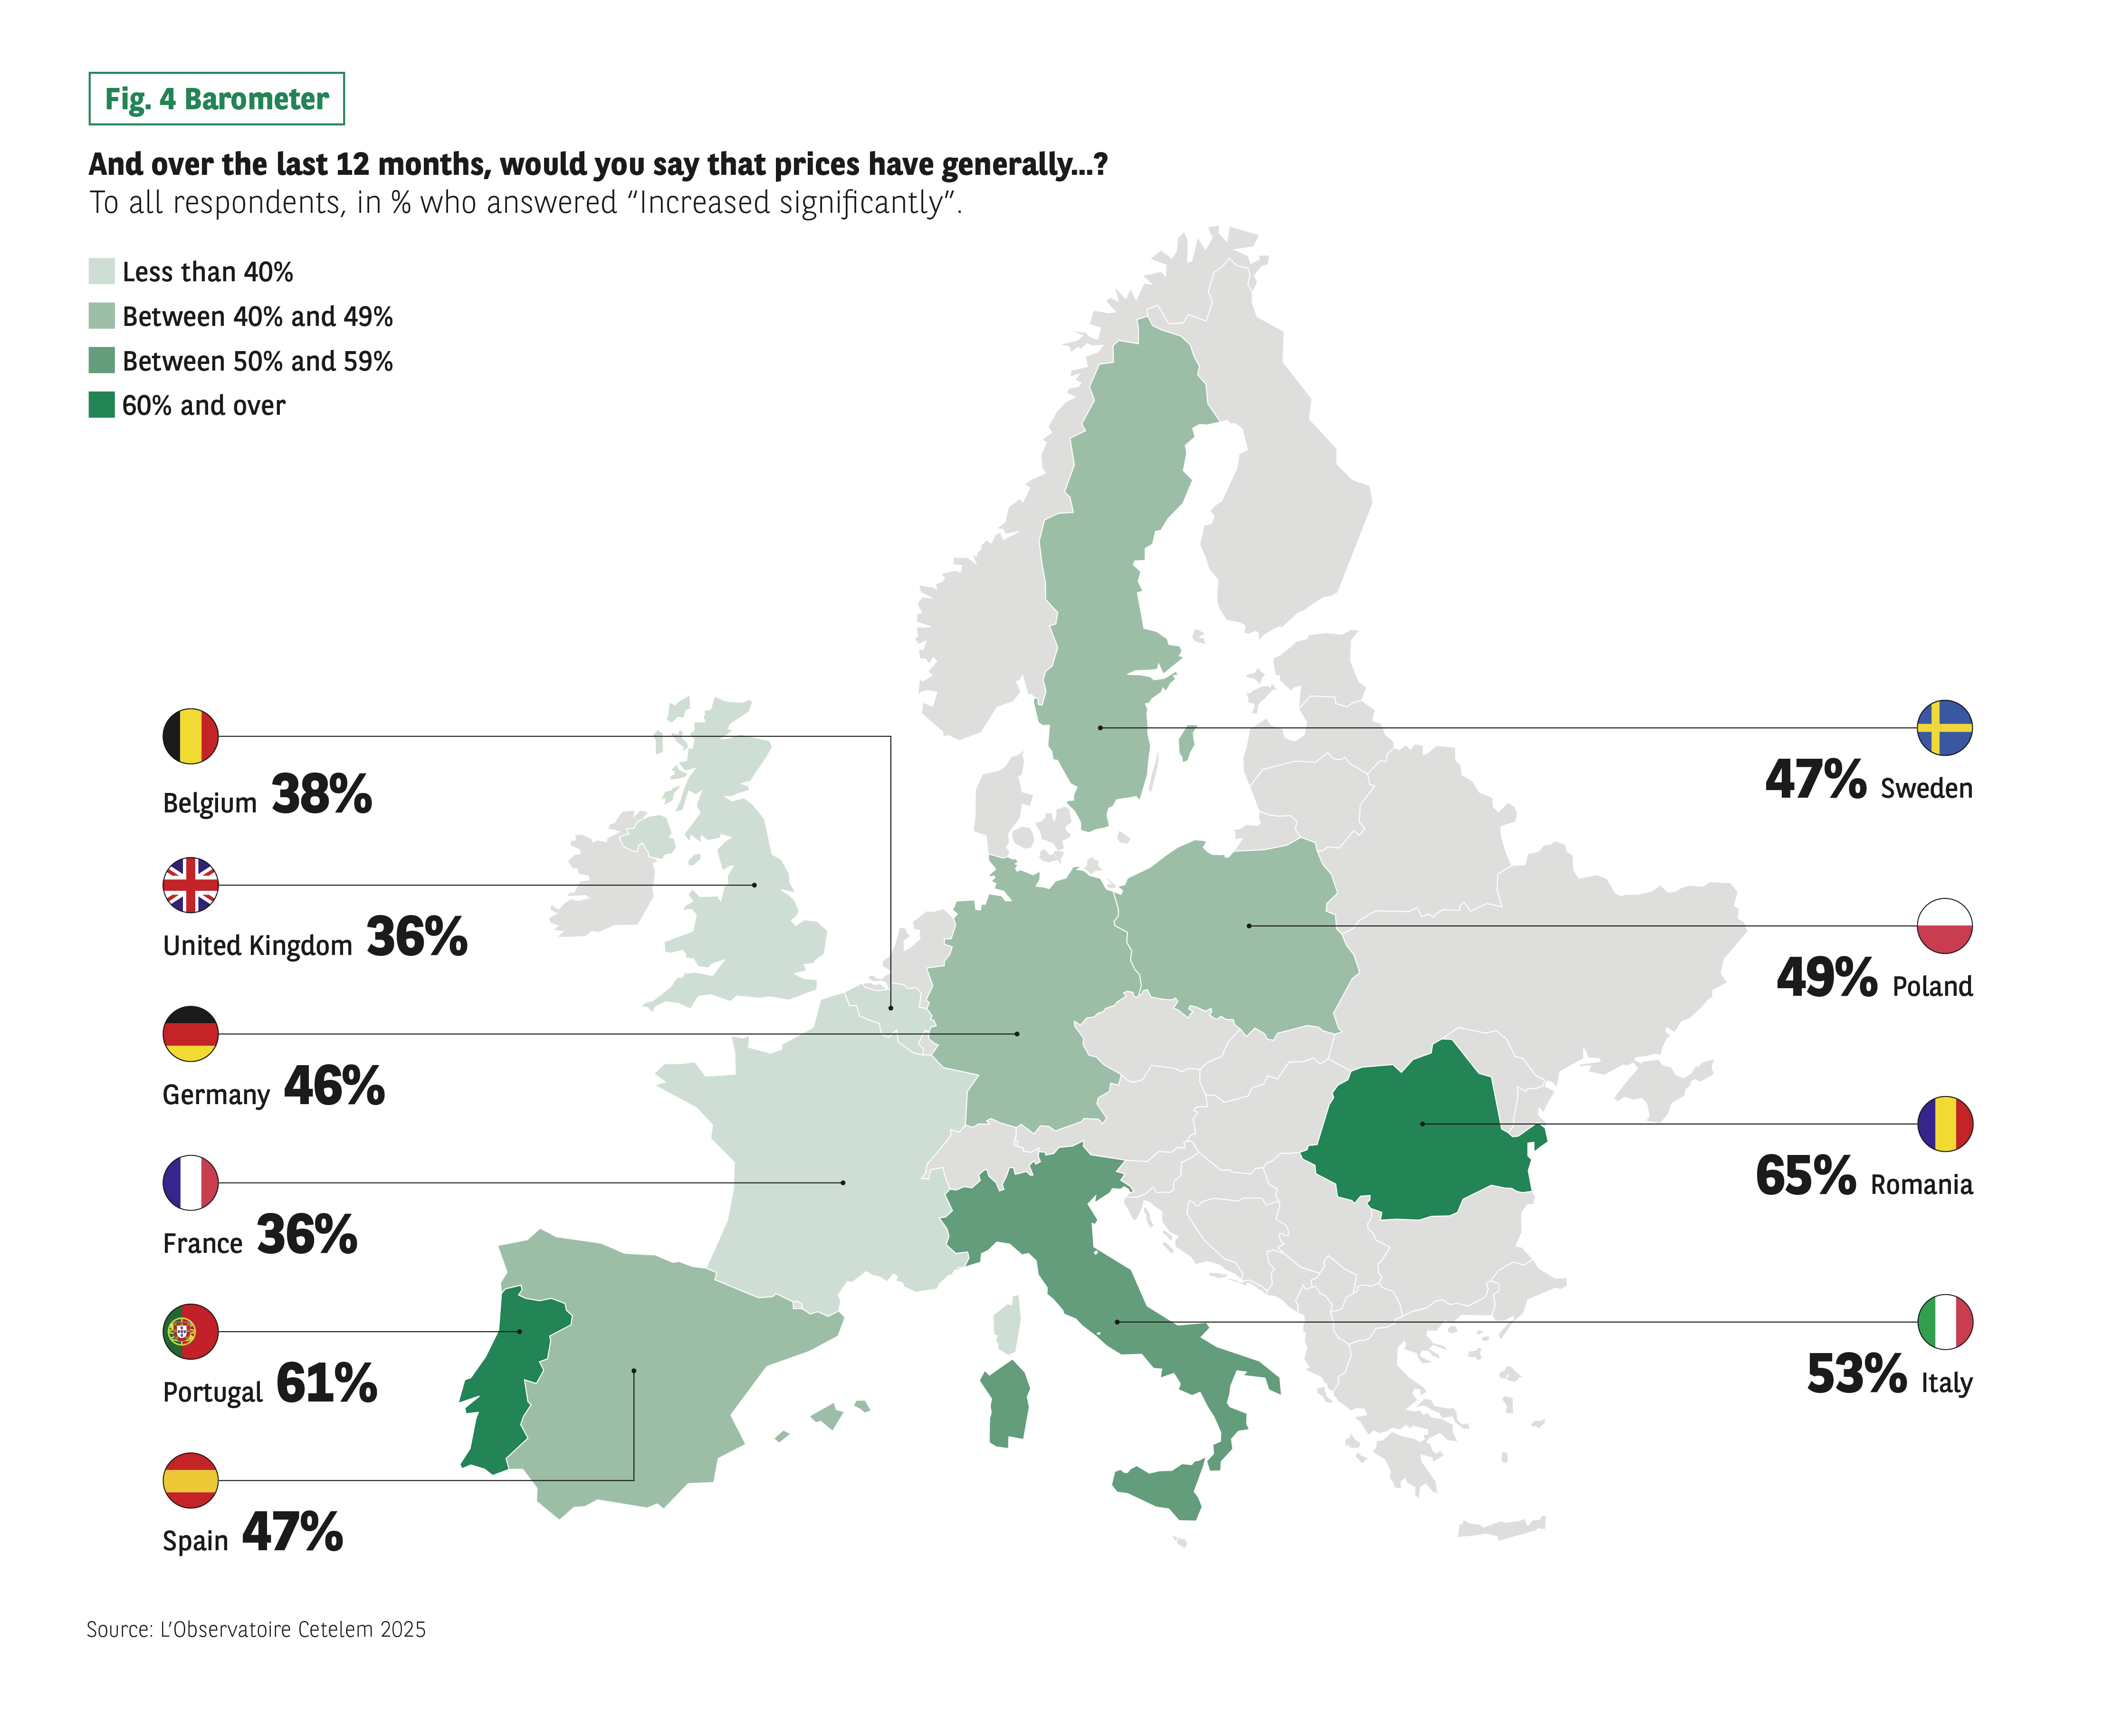 Context:
Percentage of respondents who feel that prices have increased significantly in the past 12 months.
Visuals:
Coloured map of Europe according to 4 classes (<40%, 40–49%, 50–59%, 60% and above). Encrypted labels by country.
Data:
Belgium: 38%
United Kingdom: 36%
Germany: 46%
France: 36%
Portugal: 61%
Spain: 47%
Sweden: 47%
Poland: 49%
Romania: 65%
Italy: 53%
Main course:
Values range from 36% to 65%, with particularly high levels in Portugal and Romania.
Source: The Cetelem 2025 Observatory.
Context:
Percentage of respondents who feel that prices have increased significantly in the past 12 months.
Visuals:
Coloured map of Europe according to 4 classes (<40%, 40–49%, 50–59%, 60% and above). Encrypted labels by country.
Data:
Belgium: 38%
United Kingdom: 36%
Germany: 46%
France: 36%
Portugal: 61%
Spain: 47%
Sweden: 47%
Poland: 49%
Romania: 65%
Italy: 53%
Main course:
Values range from 36% to 65%, with particularly high levels in Portugal and Romania.
Source: The Cetelem 2025 Observatory.
Fig 5 – Average annual inflation
Download this infographic for your presentations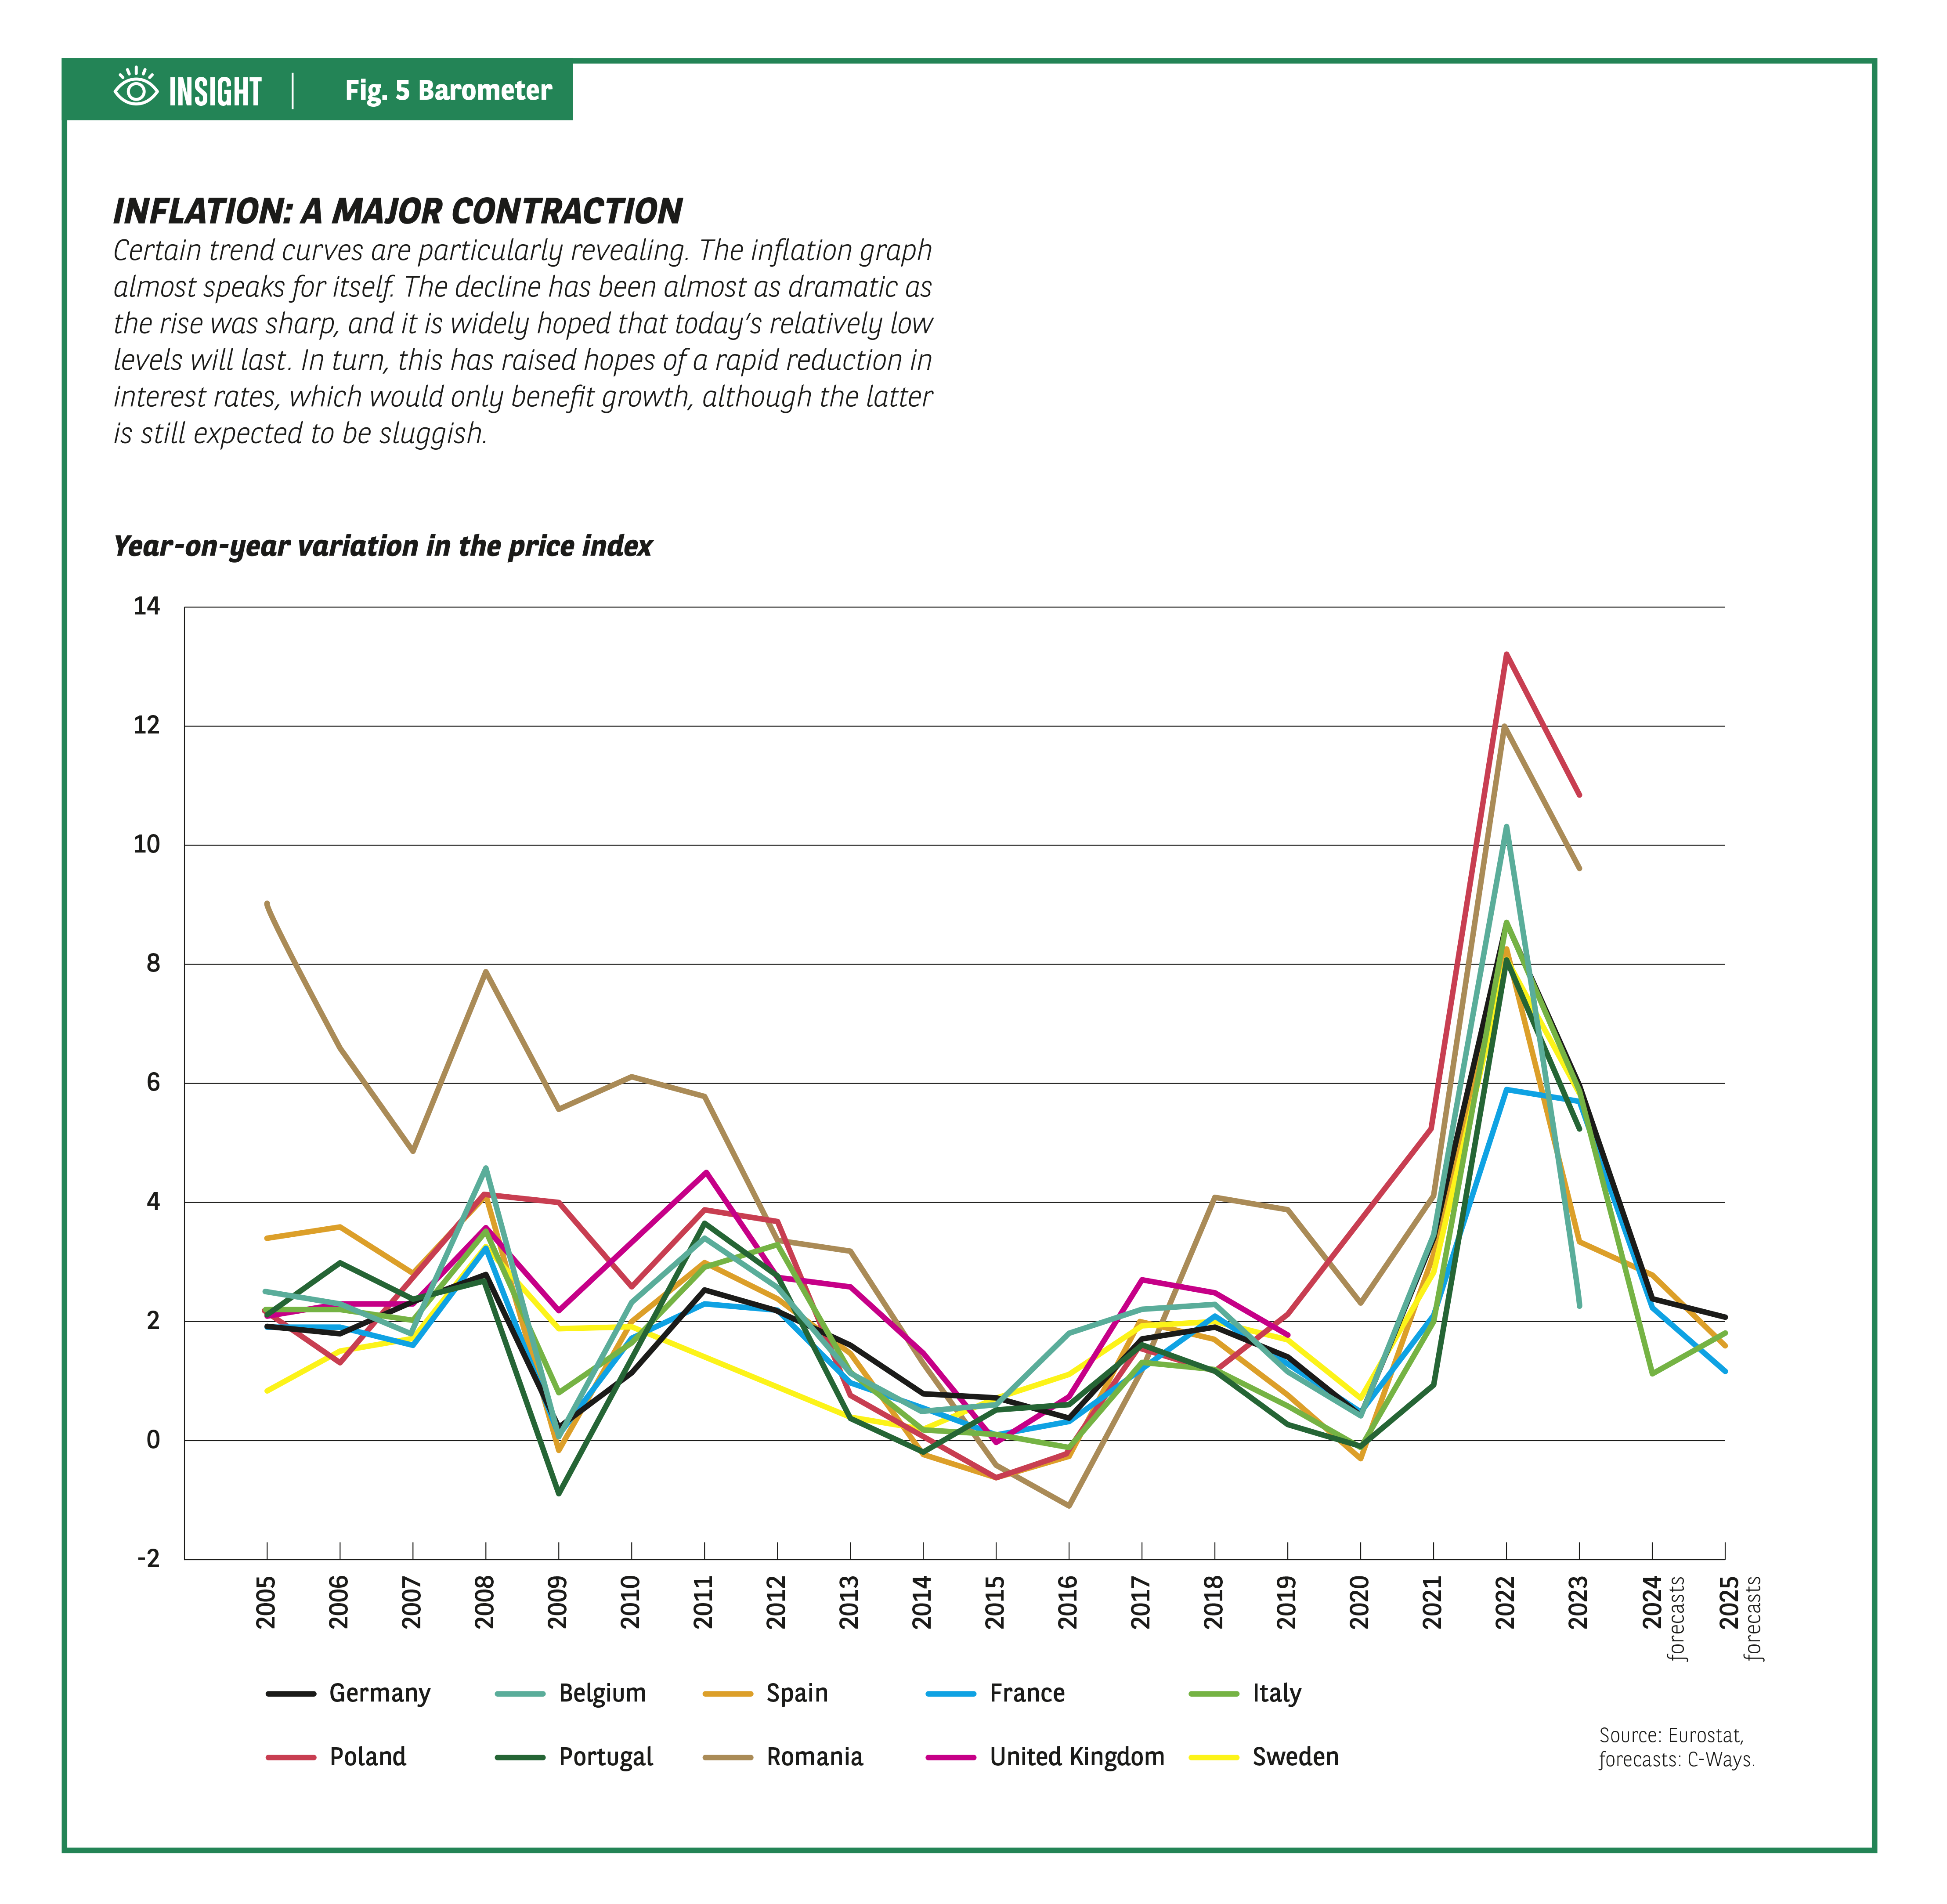 Context:
The infographic shows the average annual rate of change in the price index for ten European countries between 2005 and 2025, including forecasts for 2024 and 2025. The values come from Eurostat, C-Ways forecasts.
Visuals:
Multi-colored line chart. Each country has a curve identified in the legend: Belgium, France, Germany, Italy, Poland, Portugal, Romania, Spain, Sweden, United Kingdom.
Observable data (main trends):
Between 2005 and 2020, the rates mostly fluctuated between 0% and 4%, depending on the country.
Romania and Portugal have several peaks above 5% before 2010.
All countries are experiencing a marked peak in 2022, with values between around 7% and 14%.
In 2023, a sharp decline appears in all countries.
The 2024-2025 forecasts indicate a stabilization of around 2% to 4%, depending on the country.
Main course:
The curves show an exceptional rise in inflation in 2022 followed by a rapid decline in 2023 and in the forecasts.
Source: Eurostat, C-Ways forecasts.
Context:
The infographic shows the average annual rate of change in the price index for ten European countries between 2005 and 2025, including forecasts for 2024 and 2025. The values come from Eurostat, C-Ways forecasts.
Visuals:
Multi-colored line chart. Each country has a curve identified in the legend: Belgium, France, Germany, Italy, Poland, Portugal, Romania, Spain, Sweden, United Kingdom.
Observable data (main trends):
Between 2005 and 2020, the rates mostly fluctuated between 0% and 4%, depending on the country.
Romania and Portugal have several peaks above 5% before 2010.
All countries are experiencing a marked peak in 2022, with values between around 7% and 14%.
In 2023, a sharp decline appears in all countries.
The 2024-2025 forecasts indicate a stabilization of around 2% to 4%, depending on the country.
Main course:
The curves show an exceptional rise in inflation in 2022 followed by a rapid decline in 2023 and in the forecasts.
Source: Eurostat, C-Ways forecasts.
A BOOST FOR PURCHASING POWER
When it comes to their purchasing power, Europeans soften their views and display more optimism. In all countries, more than 50% of respondents feel that it has increased or remained stable (Fig. 6 Barometer). While a large proportion of people still believe the opposite, such perceptions have lost significant ground since last year. The biggest drop can be seen in Portugal (-15 points) and the smallest in Poland (-5 points). Concerns around this topic remain acute in France and Portugal, more so than in countries further north. All in all, it would therefore appear that wage increases have had some influence on the opinions of Europeans.
Fig 6 – Perception of declining purchasing power by country
Download this infographic for your presentations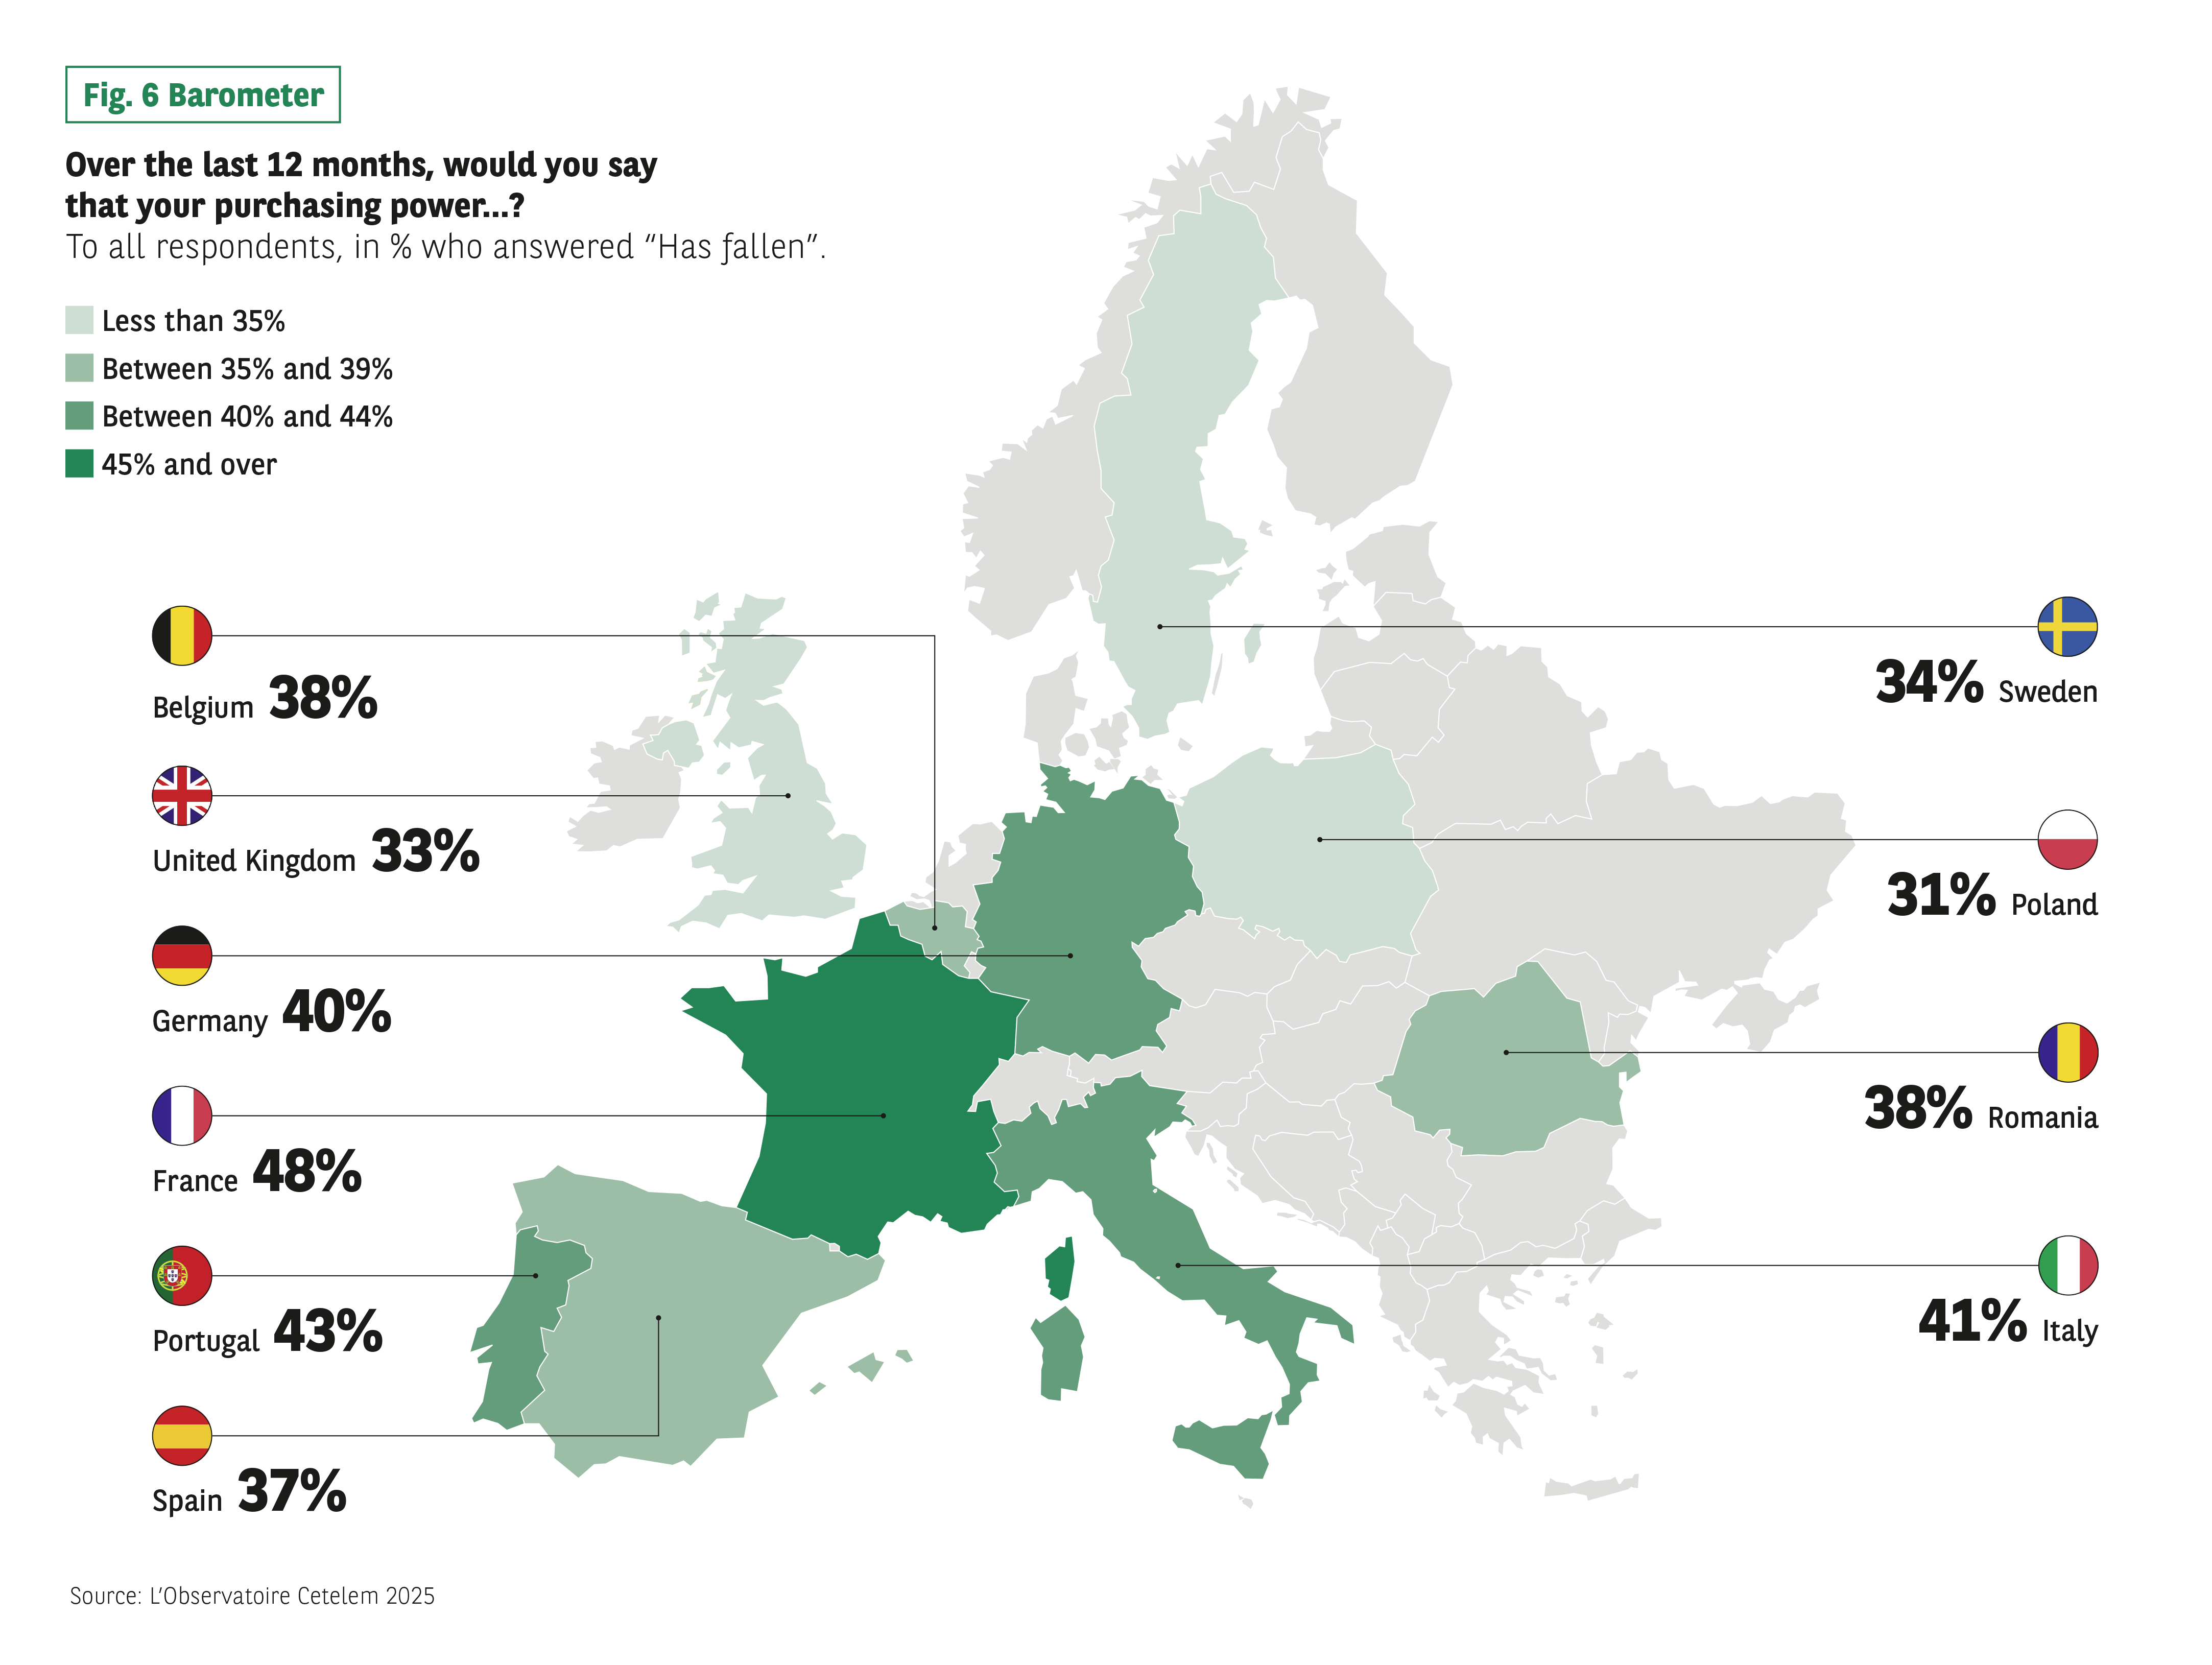 Context:
Share of the population declaring that their purchasing power has decreased over the last 12 months.
Data:
Belgium: 38%
United Kingdom: 33%
Germany: 40%
France: 48%
Portugal: 43%
Spain: 37%
Sweden: 34%
Poland: 31%
Romania: 38%
Italy: 41%
Main course:
The proportions vary between 31% and 48%, with France having the highest value.
Source: The Cetelem 2025 Observatory.
Context:
Share of the population declaring that their purchasing power has decreased over the last 12 months.
Data:
Belgium: 38%
United Kingdom: 33%
Germany: 40%
France: 48%
Portugal: 43%
Spain: 37%
Sweden: 34%
Poland: 31%
Romania: 38%
Italy: 41%
Main course:
The proportions vary between 31% and 48%, with France having the highest value.
Source: The Cetelem 2025 Observatory.
Fig 7 – Evolution of real purchasing power per capital
Download this infographic for your presentations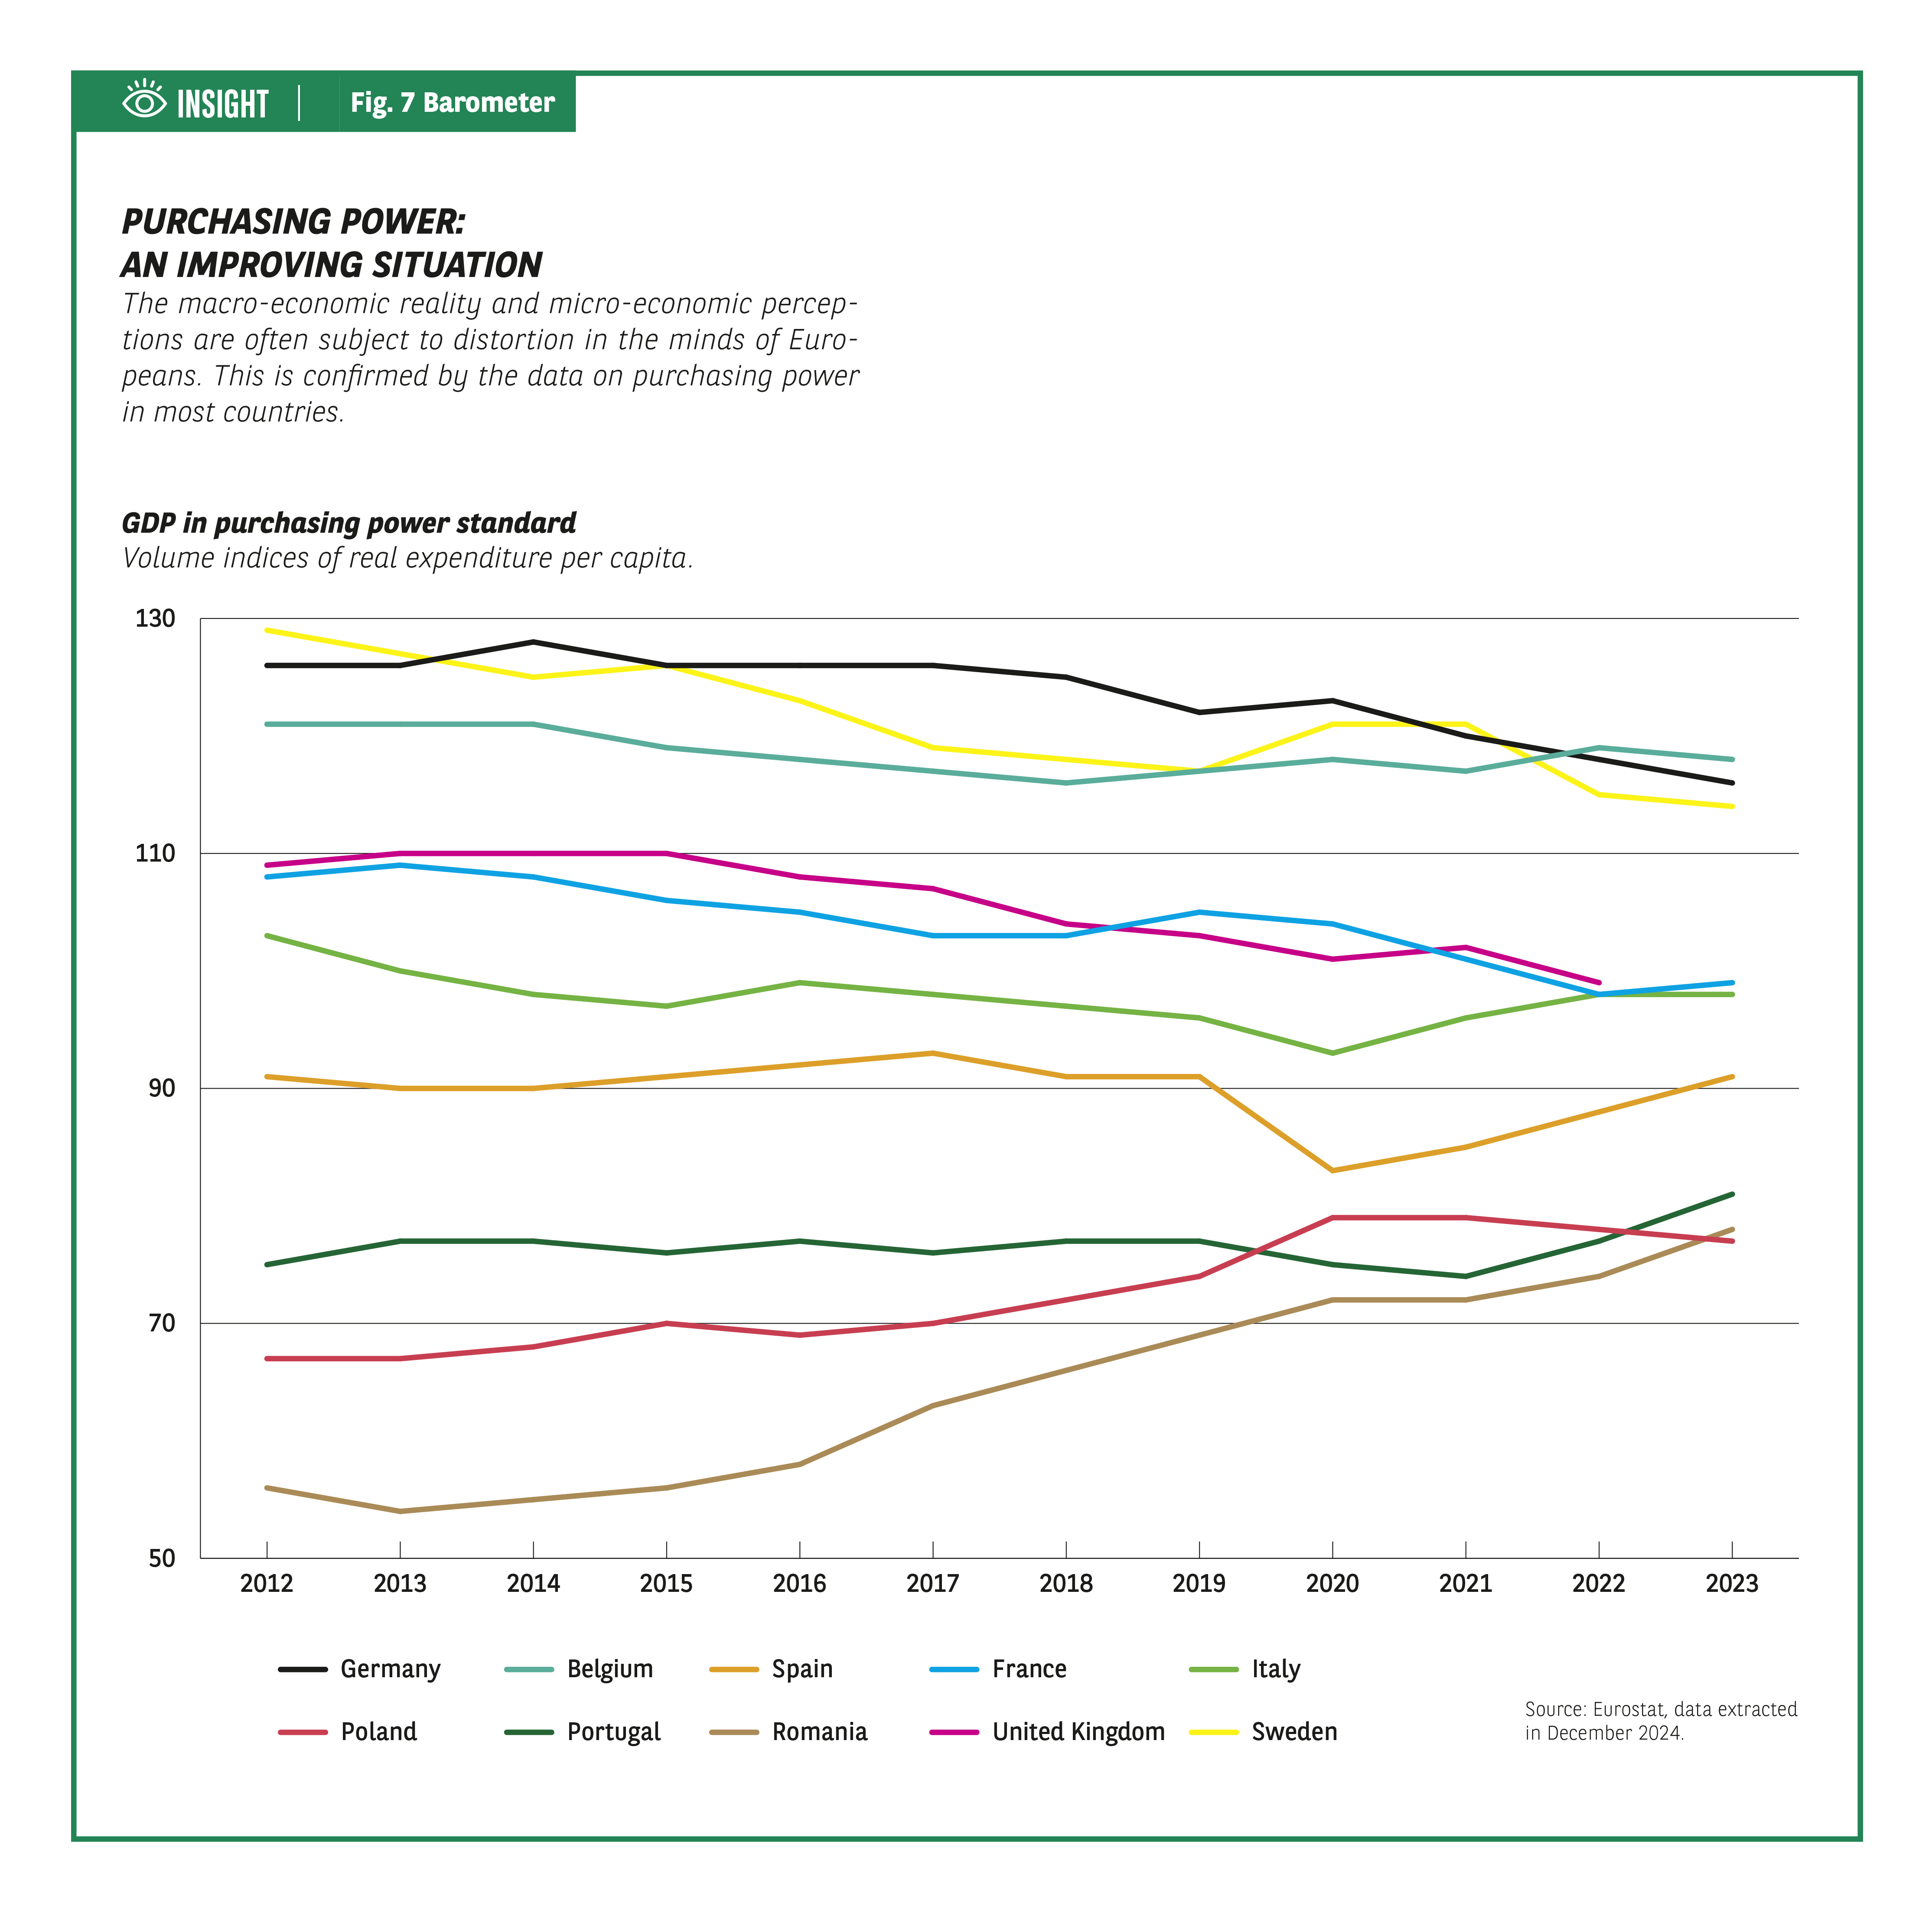 Context:
Line chart showing the volume index of real expenditure per country for 10 countries.
Visuals:
10 curves (Belgium, France, Germany, Italy, Poland, Portugal, Romania, Spain, Sweden, United Kingdom) over the period 2012–2023.
Key trends:
Most countries show moderate variations.
Romania shows a notable increase, from about 55 to more than 80.
Spain declines slightly before rising again after 2021.
Germany remains around 120, slightly decreasing.
Main course:
Trajectories differ from country to country, with a visible improvement for some Eastern European states.
Source: Eurostat, extraction December 2024.
Context:
Line chart showing the volume index of real expenditure per country for 10 countries.
Visuals:
10 curves (Belgium, France, Germany, Italy, Poland, Portugal, Romania, Spain, Sweden, United Kingdom) over the period 2012–2023.
Key trends:
Most countries show moderate variations.
Romania shows a notable increase, from about 55 to more than 80.
Spain declines slightly before rising again after 2021.
Germany remains around 120, slightly decreasing.
Main course:
Trajectories differ from country to country, with a visible improvement for some Eastern European states.
Source: Eurostat, extraction December 2024.
Fig 8 – Evolution of compensation of employees
Download this infographic for your presentations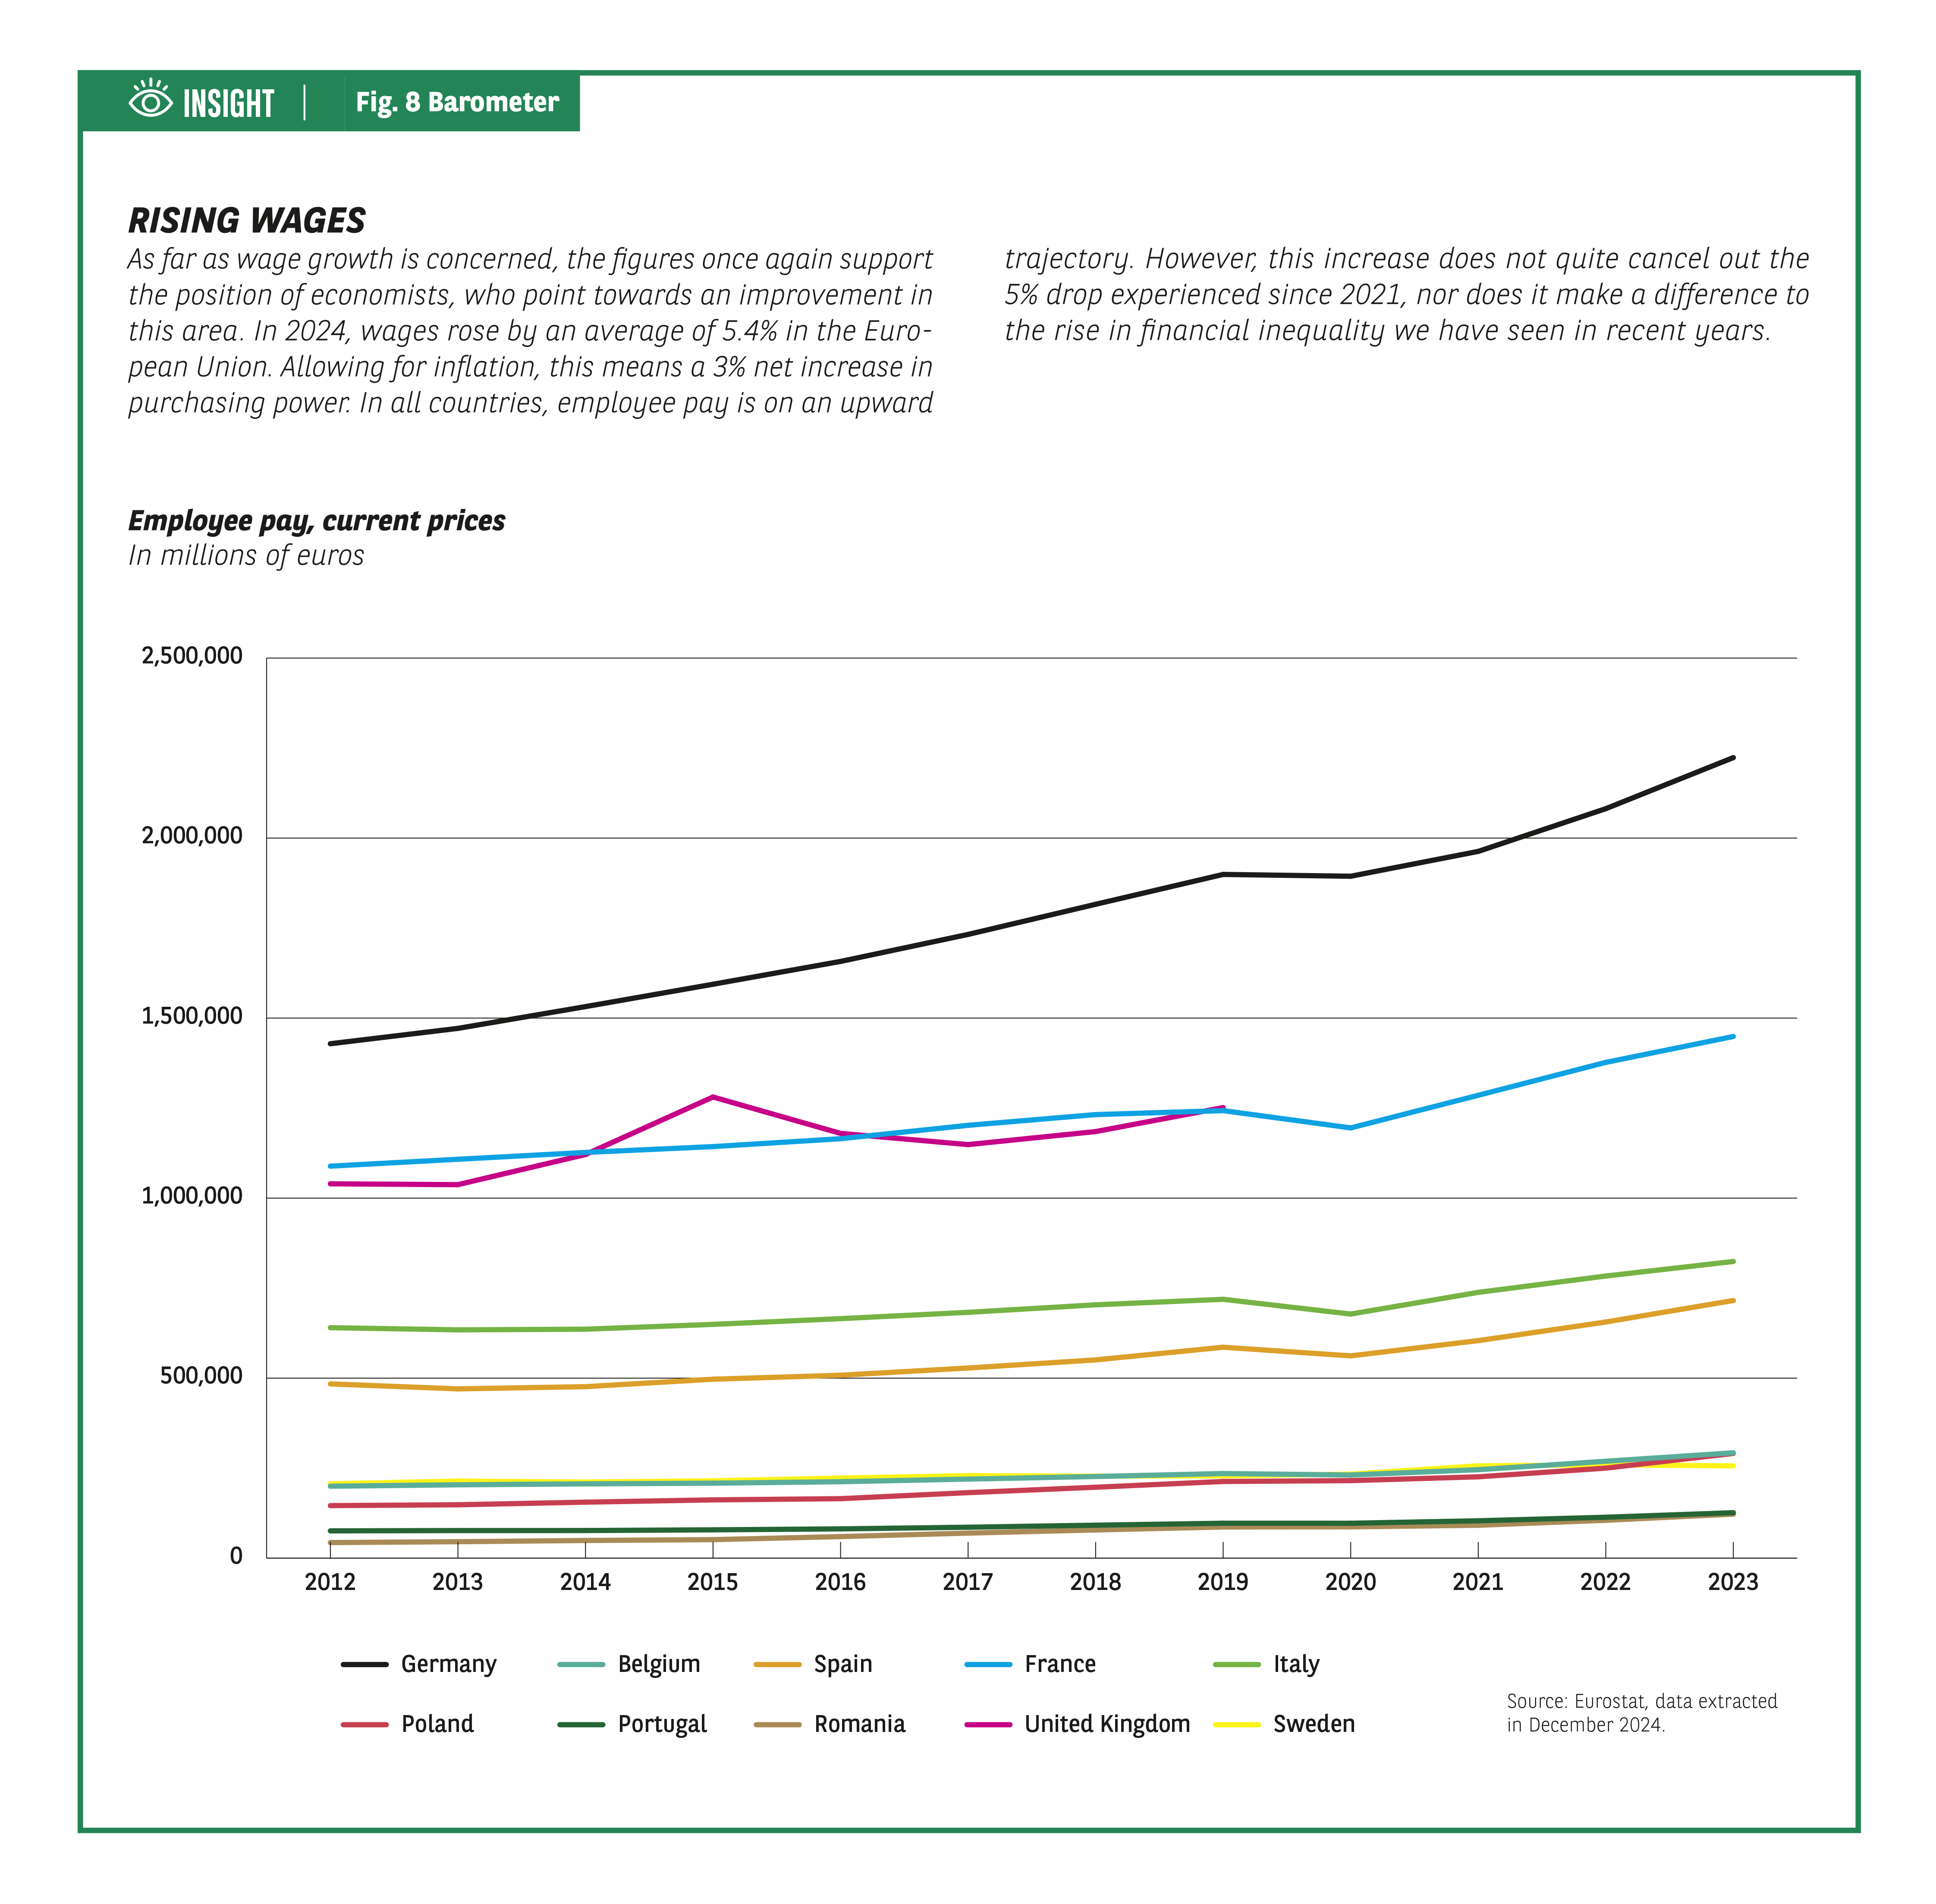 Context:
The graph shows the development, in current prices, of total compensation of employees between 2012 and 2023 in 10 European countries.
Key data (visible trends):
Germany: increase from ~€1,400,000 million to more than €2,200,000 million.
France: steady increase, around €1,000,000 million to €1,300,000 million.
Spain and the United Kingdom: moderate growth, around €1,000,000–1,200,000 million.
Italy: increase from ~€600,000 to ~€700,000 million.
Portugal, Poland, Romania: more modest increases.
Caption: Belgium, France, Germany, Italy, Poland, Portugal, Romania, Spain, Sweden, United Kingdom.
Main course:
All the curves show an increase, at different rates depending on the country.
Source: Eurostat, extraction December 2024.
Context:
The graph shows the development, in current prices, of total compensation of employees between 2012 and 2023 in 10 European countries.
Key data (visible trends):
Germany: increase from ~€1,400,000 million to more than €2,200,000 million.
France: steady increase, around €1,000,000 million to €1,300,000 million.
Spain and the United Kingdom: moderate growth, around €1,000,000–1,200,000 million.
Italy: increase from ~€600,000 to ~€700,000 million.
Portugal, Poland, Romania: more modest increases.
Caption: Belgium, France, Germany, Italy, Poland, Portugal, Romania, Spain, Sweden, United Kingdom.
Main course:
All the curves show an increase, at different rates depending on the country.
Source: Eurostat, extraction December 2024.
SAVING REMAINS POPULAR
Does this perception that purchasing power is improving have an influence on the saving and consumption habits of Europeans? Not exactly, since opinions are fairly evenly split between those who intend to do more or less of each, while the long-term trend does not suggest that this will be the case in the future.
For instance, 55% of Europeans want to save more, a score almost identical to that recorded during the Covid crisis (Fig. 9 Barometer). While saving intentions stand at 67% in Romania, 65% in the UK and 58% in Poland, they reach “just” 43% in France and 47% in Belgium, the only countries with a score of less than 50%.
Only Germany and Poland have seen saving intentions drop, and even then only slightly (-1 point and -3 points), while the desire to save has intensified the most in Italy and the UK (+7 points).
Since the 2019 Barometer, all countries have experienced a sustained rise in saving intentions, with the exception of Sweden. However, there are significant disparities from country to country.
This cautious attitude continues to prevail. It may be rooted in a desire not to jeopardise the future and to retain some financial wiggle room at a time of record government deficits, which may well herald tax increases that will have a detrimental effect on purchasing power.
It should be noted that the savings rate, which stood at 15.7% of income in the eurozone in the second quarter of 2024, has never been so high (source: Eurostat).
Fig 9 – Intention to increase savings by country
Download this infographic for your presentations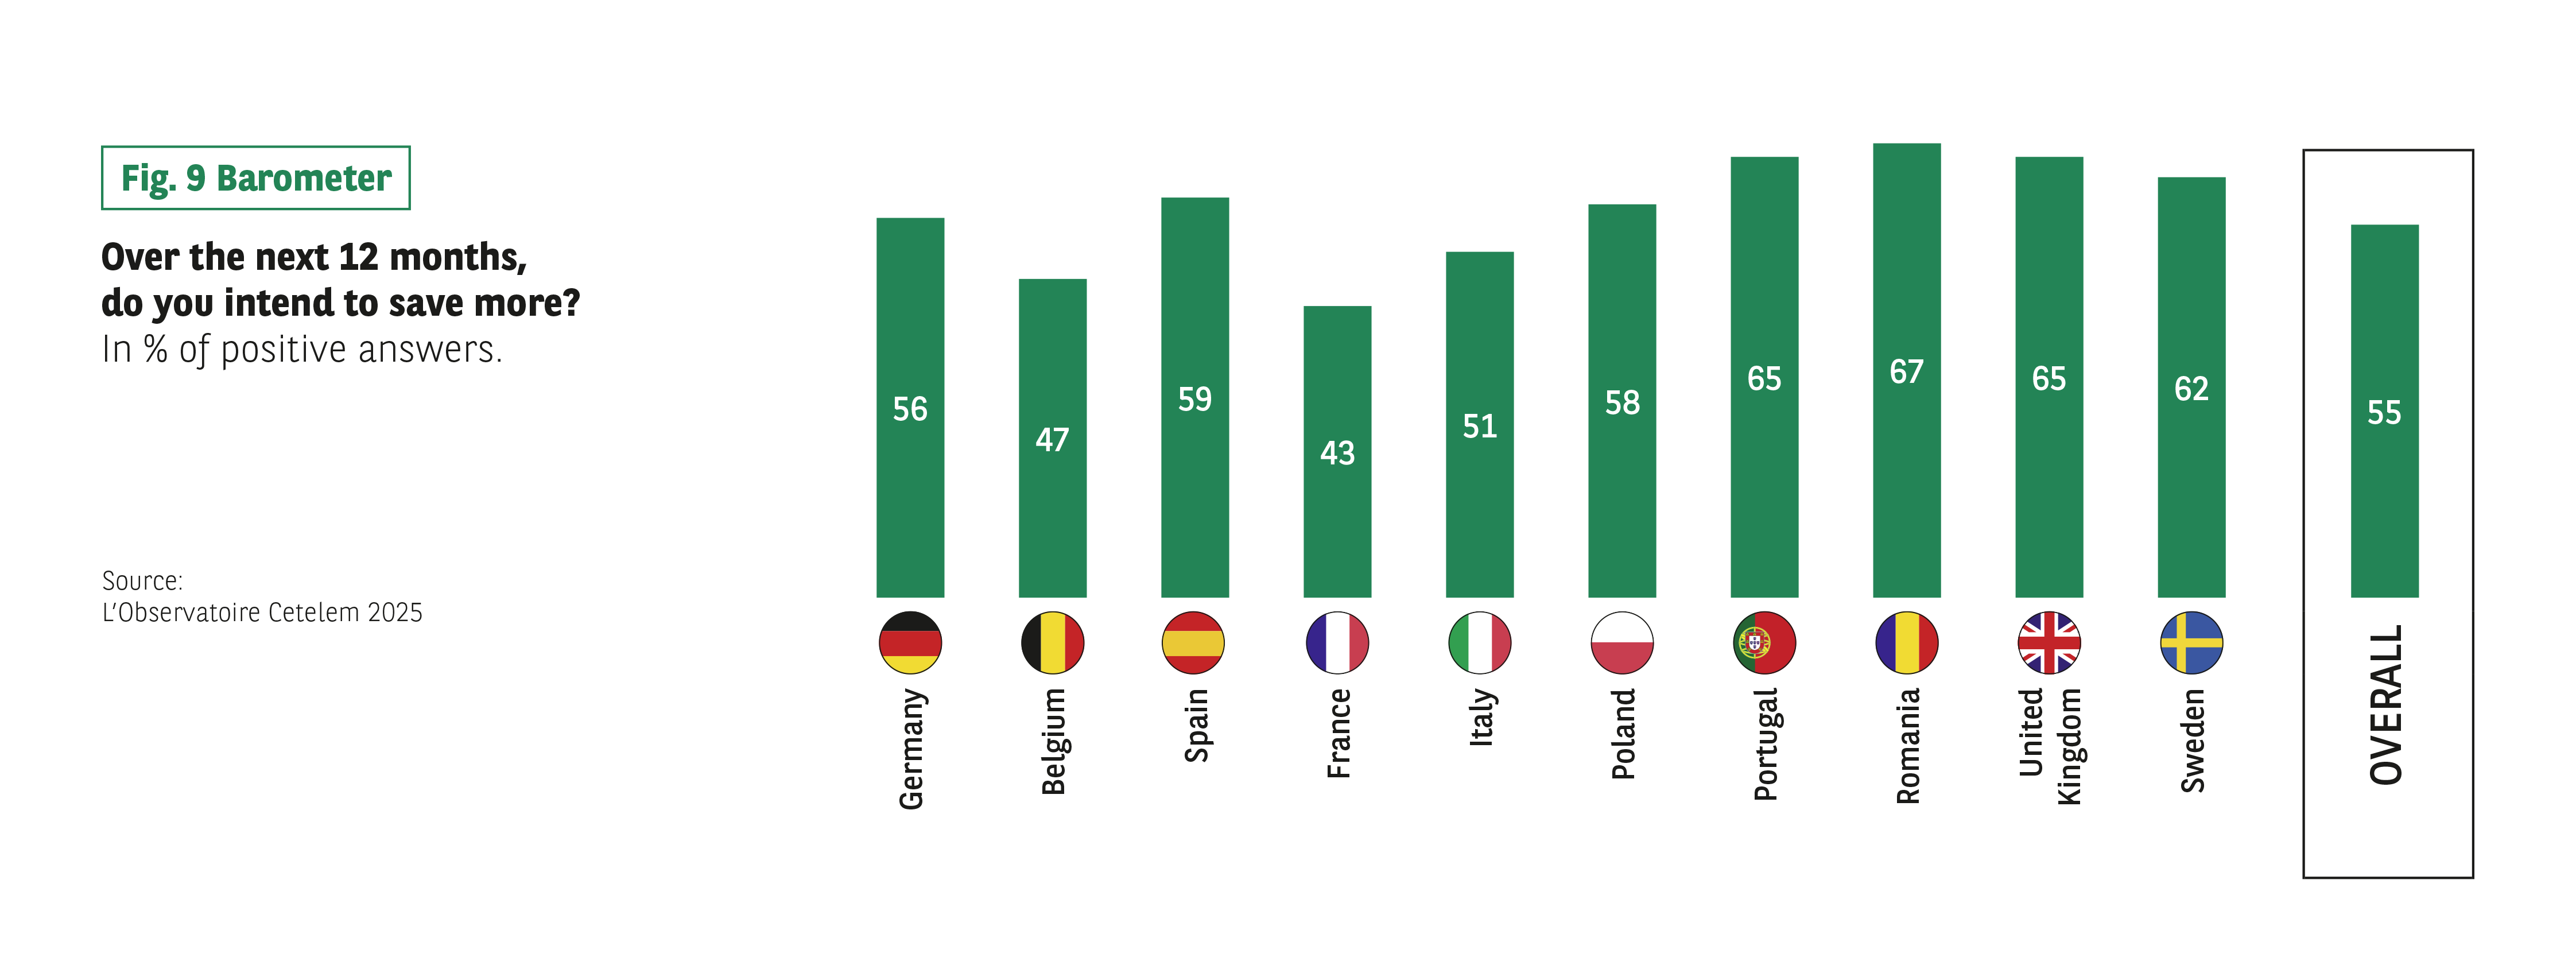 Context:
Share of respondents who believe they will increase their savings in the next 12 months.
Data:
Germany: 56%
Belgium: 47%
Spain: 59%
France: 43%
Italy: 51%
Poland: 58%
Portugal: 65%
Romania: 67%
United Kingdom: 65%
Sweden: 62%
Overall: 55%
Main course:
Savings intentions are high in most countries, with peaks in Romania, Portugal and the United Kingdom.
Source: The Cetelem 2025 Observatory.
Context:
Share of respondents who believe they will increase their savings in the next 12 months.
Data:
Germany: 56%
Belgium: 47%
Spain: 59%
France: 43%
Italy: 51%
Poland: 58%
Portugal: 65%
Romania: 67%
United Kingdom: 65%
Sweden: 62%
Overall: 55%
Main course:
Savings intentions are high in most countries, with peaks in Romania, Portugal and the United Kingdom.
Source: The Cetelem 2025 Observatory.
PEOPLE REMAIN WARY OF SPENDING
When it comes to consumption, a sense of caution, not to say defiance, is evident. 57% of Europeans have no plans to spend more (Fig. 10 Barometer). However, in comparison to savings, intentions vary more widely from country to country. Four countries report an increase in consumer spending intentions, while six have seen a drop. However, the gaps are not particularly wide: +3 points in the UK, Romania and Poland, -5 points in Sweden and Spain. Looking at the trend since 2019, a similar disparity in intentions remains present, although most countries have moved around on the scale. What hasn’t changed is that the British are keen to spend more, while the Swedes are reluctant to open their wallets.
Fig 10 – Intention to increase spending by country
Download this infographic for your presentations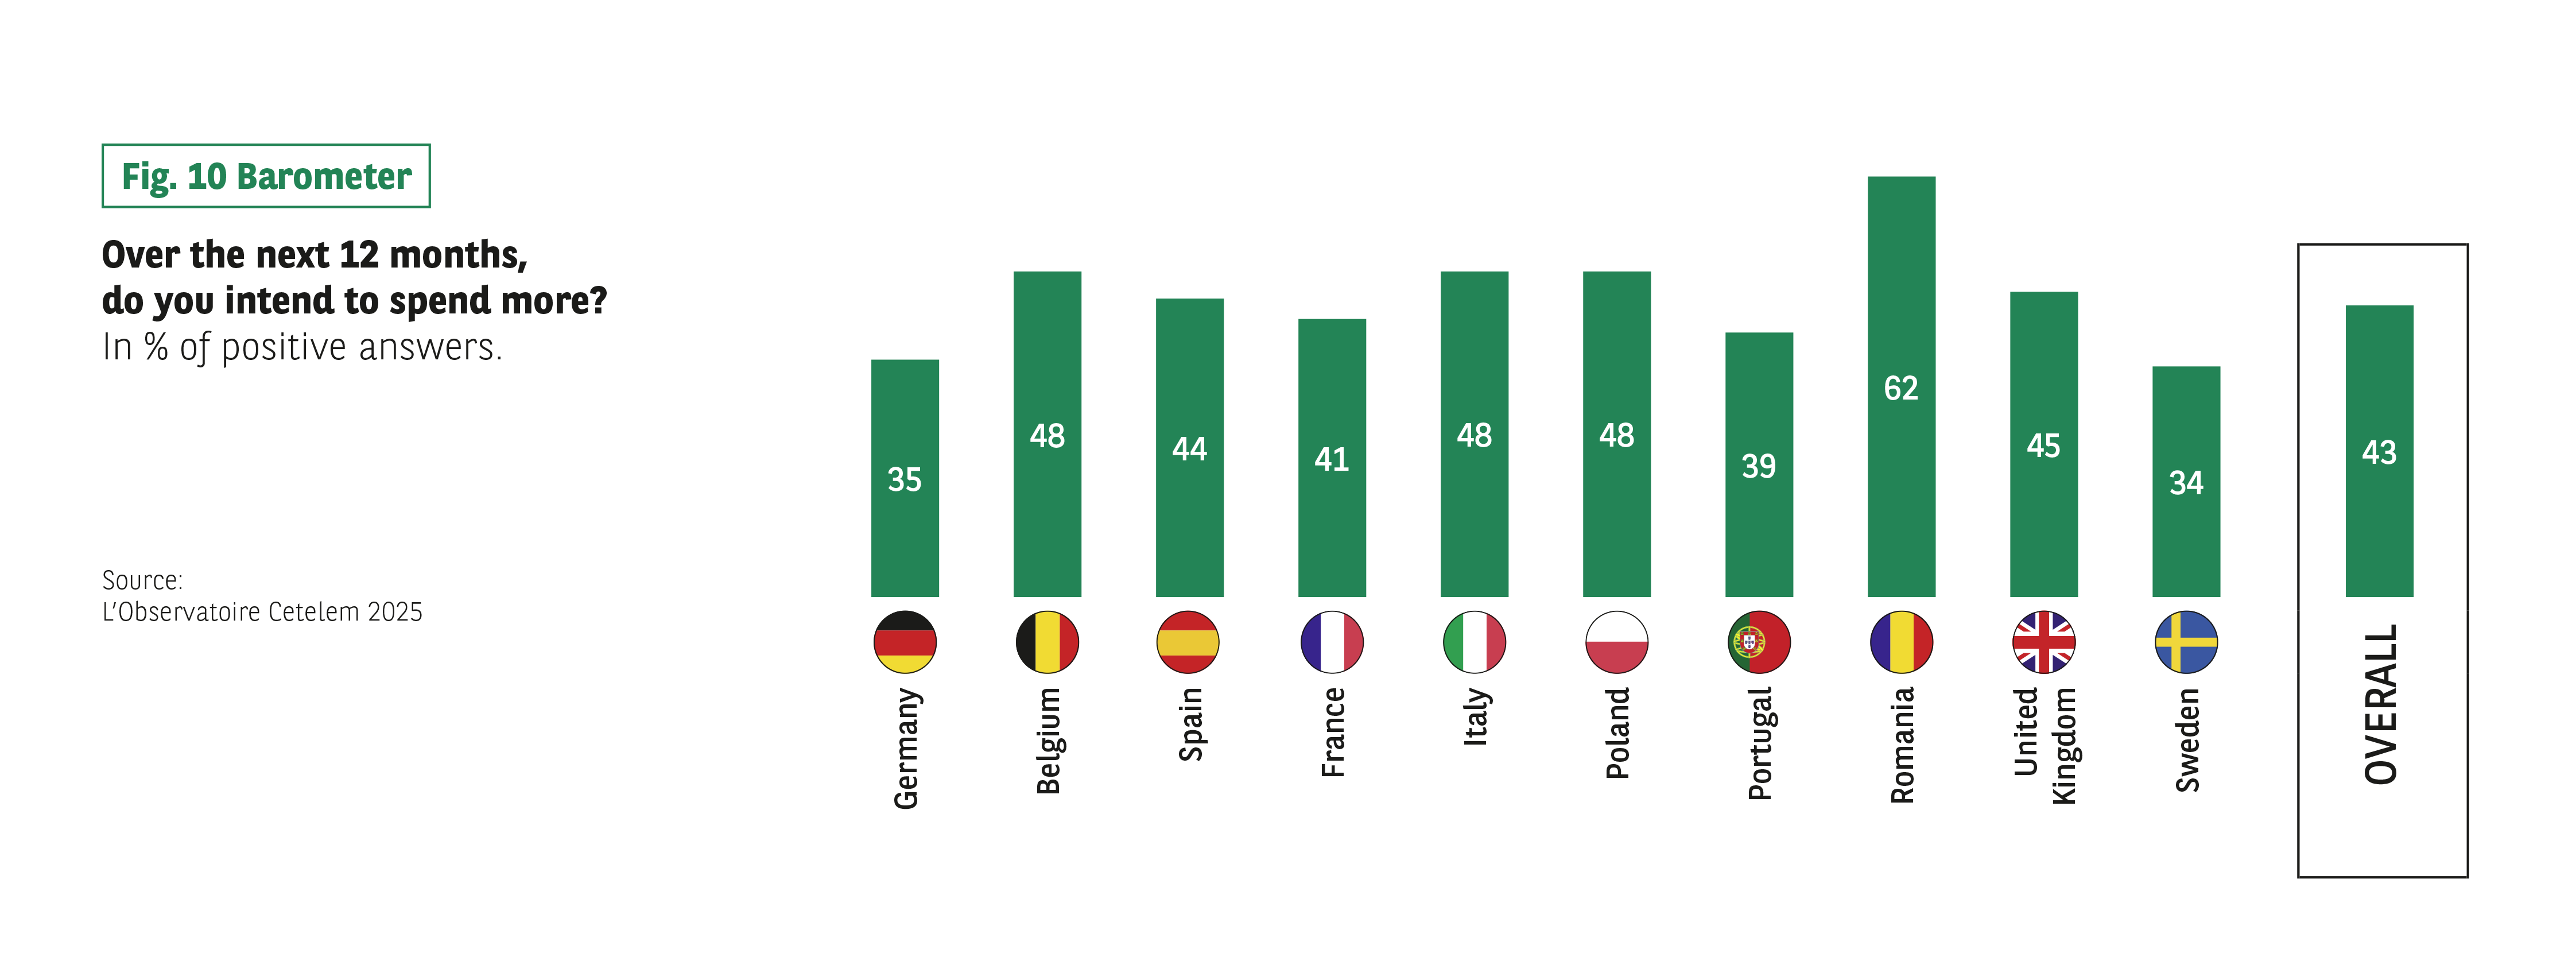 Context:
The infographic presents the positive answers to the question:
“Do you plan to increase your spending in the next 12 months?”
Visuals:
Vertical bars, one per country, with the percentage in the centre. An additional bar represents the “Together” value.
Data:
Germany: 35%
Belgium: 48%
Spain: 44%
France: 41%
Italy: 48%
Poland: 48%
Portugal: 39%
Romania: 62%
United Kingdom: 45%
Sweden: 34%
Overall: 43%
Main course:
Spending intentions range from 34% to 62%, with a significantly higher value in Romania.
Source: The Cetelem 2025 Observatory.
Context:
The infographic presents the positive answers to the question:
“Do you plan to increase your spending in the next 12 months?”
Visuals:
Vertical bars, one per country, with the percentage in the centre. An additional bar represents the “Together” value.
Data:
Germany: 35%
Belgium: 48%
Spain: 44%
France: 41%
Italy: 48%
Poland: 48%
Portugal: 39%
Romania: 62%
United Kingdom: 45%
Sweden: 34%
Overall: 43%
Main course:
Spending intentions range from 34% to 62%, with a significantly higher value in Romania.
Source: The Cetelem 2025 Observatory.
Meanwhile, the actual figures posted provide a mixed picture, with only Spain and Portugal experiencing significant consumption growth (+2% and +3.3% respectively).
THE DESIRE TO SPEND HAS BARELY SHIFTED
Once again, Europeans are split down the middle when it comes to their spending intentions. Remarkably, these intentions remain similar to last year’s, with 53% still responding in the affirmative. The desire to consume is strongest in Italy and Romania, while the Belgians and Germans lag behind. Again compared to 2019, spending intentions are down by 6 points, with a particularly marked drop in Poland and Germany. (Fig. 11 Barometer).
Fig 11 – Relationship to the desire to spend
Download this infographic for your presentations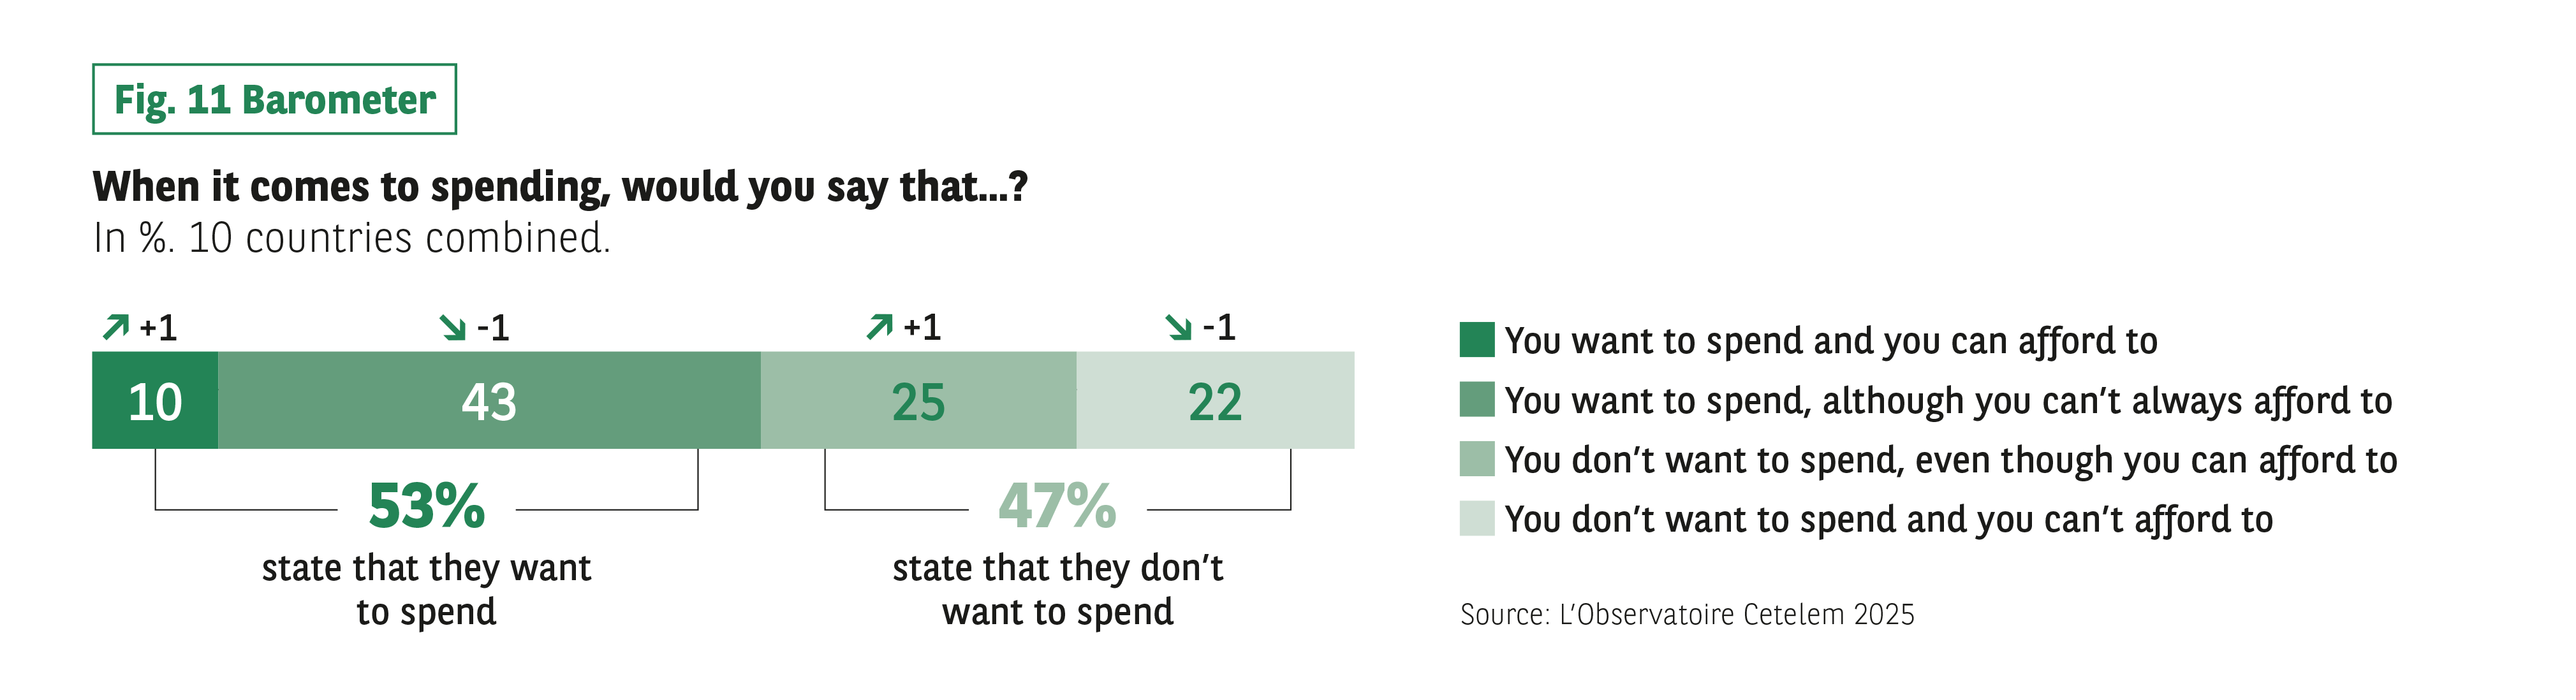 Context:
Answers to the question “Regarding your spending, would you say…?” by grouping ten countries.
Categories and data:
I want to spend and I can afford it: 10%
I want to spend and I don’t always have the means to do so: 43%
I don’t want to spend and I can afford it: 25%
I don’t want to spend and I can’t afford it: 22%
Synthesis:
53% say they want to spend; 47% say they do not want to.
Source: The Cetelem 2025 Observatory.
Context:
Answers to the question “Regarding your spending, would you say…?” by grouping ten countries.
Categories and data:
I want to spend and I can afford it: 10%
I want to spend and I don’t always have the means to do so: 43%
I don’t want to spend and I can afford it: 25%
I don’t want to spend and I can’t afford it: 22%
Synthesis:
53% say they want to spend; 47% say they do not want to.
Source: The Cetelem 2025 Observatory.
TRAVEL TOPS THE LIST
Of those Europeans who are keen to spend, 58% will continue to prioritise travel, a score that has remained relatively stable over time, if we exclude the Covid-19 period. In second place are subscriptions to video streaming platforms, which appeal to more than 4 out of 10 Europeans. This is the result that has seen the biggest increase since 2019 (+14 points), followed by the purchase of games consoles, reflecting a shift towards more service-oriented consumption (see: Observatoire de la Consommation Cetelem 2025).
Germany and France: the engine of Europe is misfiring
For the French and Germans, 2024 was synonymous with political upheaval.
On 9 June last year, President Macron decided to go all-in by dissolving the national assembly in a bid to win a new electoral mandate. The results on 7 July proved that it had been a miscalculation.
Meanwhile, after Chancellor Olaf Scholz lost a vote of confidence on 16 December, President Steinmeier announced that another federal election would be held on 23 February 2025. At the time of writing this 2025 Cetelem Barometer, we still have no idea how the new Bundestag will shape up. All we know for certain is that it will undergo significant changes.
THE BUDGET DEFICIT: A CENTRAL ISSUE
Both countries are also experiencing a severe budgetary crisis, albeit to varying degrees. In France, the deficit target set for the new government is around 5.4%, with debt now reaching over 113% of GDP. In Germany, the topic is also being hotly debated, despite debt standing at just 63% of GDP and a budget deficit of around 2% in 2024. A maximum structural deficit of 0.35% outside of a recession, as enshrined in the constitution, restricts the government’s room for manoeuvre at a time when the country is in need of major investment. There is also a risk that the latter will find itself squeezed by the sanctions being imposed on the EU by the new US administration and the Chinese government. What’s more, Germany is in the midst of serious economic uncertainty, notably due to a loss of confidence in its automotive industry and what have traditionally been its core sectors.
CONSUMERS FEAR FOR THEIR COUNTRY’S HEALTH AND THEIR PERSONAL CIRCUMSTANCES
The results of this latest Cetelem Barometer attest to the fragility of the Franco-German partnership. It should be pointed out that this survey was conducted in the autumn, when the French government was in stasis, which could have foreshadowed Belgium’s political stalemate* and German legislative tensions. The impact of these events should not be underestimated, although they do not tell the whole story, since the roots of consumer trepidation often go back much further.
The scores awarded to the overall situation in the two countries illustrate this, albeit in different ways. While Germany posted an impressive figure of 6.7 in 2019, placing it squarely at the top of the ranking, its latest score is a mediocre 5.3, which drags it back into the main pack. This drop of 1.4 points is by far the greatest of all the nations surveyed.
Although France returns the same score of 4.6 as in 2019, it remains in last place, and firmly so once again. It is also the only country to be more pessimistic in this area than last year.
When it comes to personal circumstances, there is less disparity between the views of Europeans, as we have already seen. Once more, however, Germany stands out from the rest by posting the sharpest drop in its score compared with 2019 (-0.5%).
INFLATION: FRANCE OUTPERFORMS GERMANY
The feeling in the two countries that prices have risen over the last 12 months is not dissimilar to that experienced by their fellow Europeans, although France does stand apart somewhat in one respect. Indeed, unexpectedly, the French are the least likely to think that prices have risen significantly over the last year. And once again, reality matches perceptions. In 2024, prices in France rose by just 2%, compared with 4.9% the previous year. In Germany, inflation stood at 2.6% overall in 2024, with the final quarter seeing a higher-than-expected rise.
CONVERGING VIEWS ON PURCHASING POWER
When it comes to purchasing power, however, the duo find themselves among the gloomiest nations. In fact, the French are the most likely to believe that theirs has fallen over this period, despite it having risen by 2.1% in 2024. However, the shifts of opinion that have occurred in the two countries since 2019 differ immensely. Few Germans reported a drop at the time, but a majority of French consumers did so (23% and 59% respectively). Since then, the figure has risen by 17% in the case of the former and fallen by 11% in the case of the latter.
Fig 12 – Household saving rate France Germany
Download this infographic for your presentations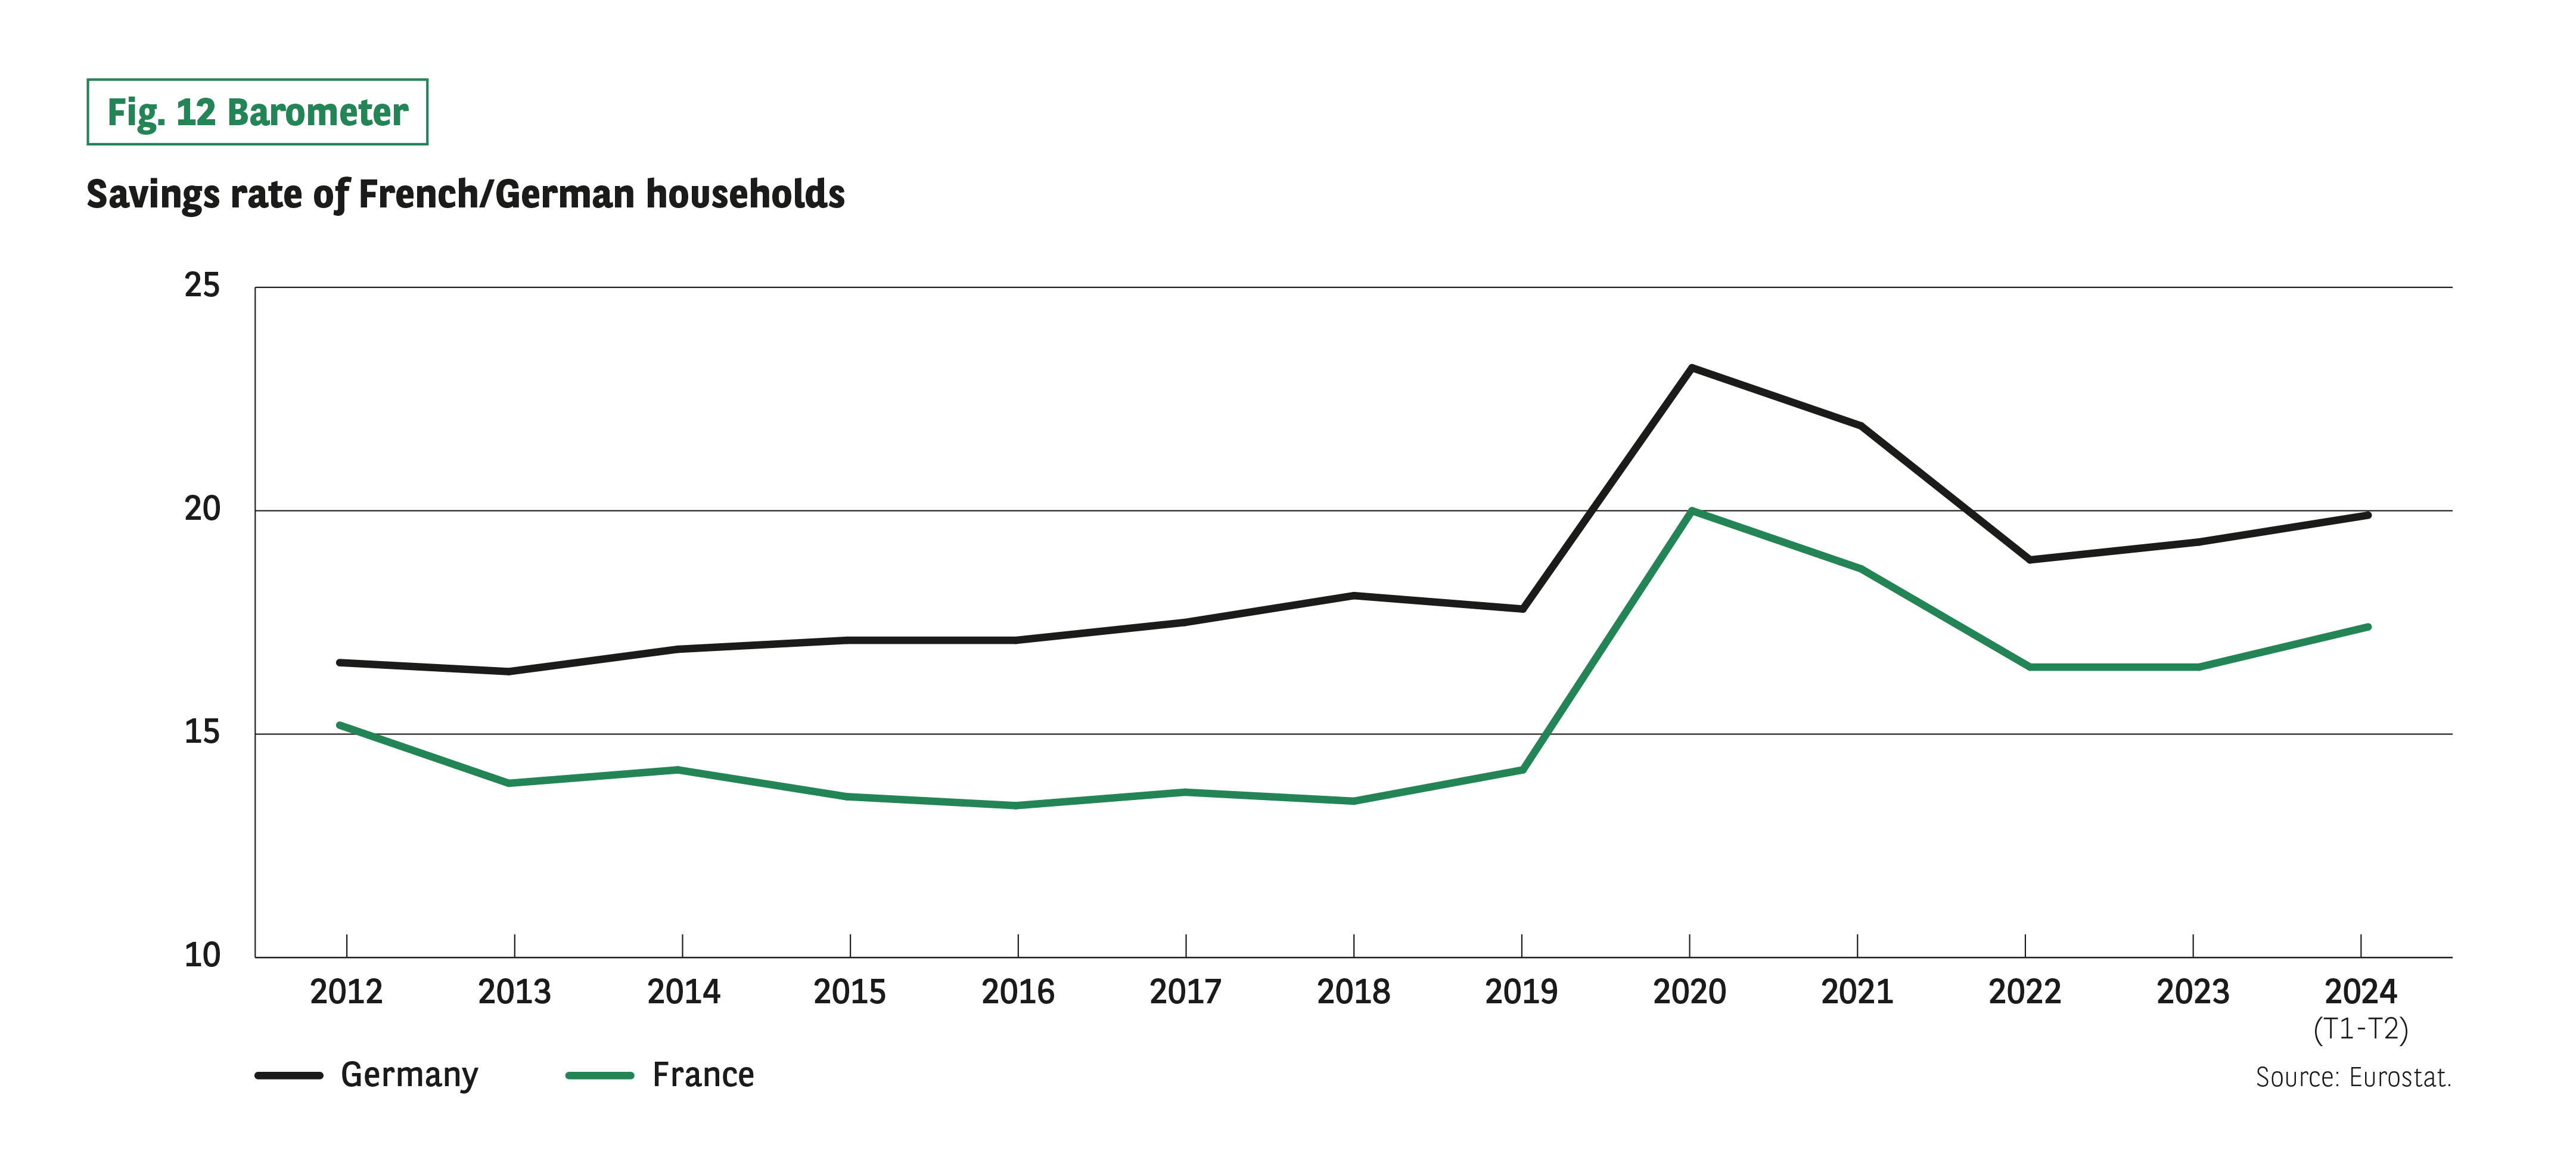 Context:
Comparison of household saving rates between 2012 and 2024 (Q1-Q2).
Visuals:
Two curves: Germany and France.
Visible numerical trends:
Germany: about 17% in 2012 → ~22% in 2020 → ~19–20% in 2024.
France: about 15% in 2012 → ~20% in 2020 → ~17% in 2024.
Main course:
Both countries experienced a sharp increase in 2020, followed by a partial decline.
Source: Eurostat.
Context:
Comparison of household saving rates between 2012 and 2024 (Q1-Q2).
Visuals:
Two curves: Germany and France.
Visible numerical trends:
Germany: about 17% in 2012 → ~22% in 2020 → ~19–20% in 2024.
France: about 15% in 2012 → ~20% in 2020 → ~17% in 2024.
Main course:
Both countries experienced a sharp increase in 2020, followed by a partial decline.
Source: Eurostat.
What can we gather from the actual savings rates of the two countries?
hese indicators reflect a precautionary stance tinged with a feeling of anxiety, the causes of which go back further than one might expect in the light of recent events, but in a slightly different way.
In Germany, the savings rate has been rising almost constantly over the last decade, aside from a slight dip in 2021 and 2022. From 16.5% in 2012, it has risen to 19.9% today. In France, it fell slightly between 2012 and 2019, from 15.2% to 14.2%. However, the last three years have seen it rise steadily to 17.4%.
A LEVEL OF CAUTION UNDERLINED BY THE DESIRE TO SAVE
Saving intentions provide another indication – one of the most valuable, in fact – of the uncertainty and gloom that have steadily engulfed both of these populations. Of course, if we look at the figures for 2024 alone, they remain almost unchanged from 2023, and are relatively high in Germany. However, compared with 2019, saving intentions in the two countries have risen more than in all the other nations covered by the Barometer (Germany +12 points, France +14 points). Meanwhile, the desire to consume has faded (-4 points in Germany) or increased only slightly (+1 point in France). This intention is confirmed by the actual consumption figures recorded in 2024, which are slightly down in Germany and up just 0.7% in France). In Germany, a desire to save more and consume less has translated into a collapse in spending intentions, which have fallen by 10 points since 2019.
*Belgium holds the dubious distinction of having spent 541 consecutive days without a sitting government in 2010-2011.