An activity that is more popular than ever, but with an image that leaves much to be desired


Consumption has always been at the heart of economic debate. Whether it rises or falls, it has a direct influence on a country’s economic health. However, climate change and the measures needed to address it have made consumption an increasingly controversial issue, to the point of being openly criticised. Nevertheless, it remains a core part of people’s daily lives, reflecting constantly evolving choices and behaviours. All of this begs the question: how do Europeans perceive consumption today? What is clear, first and foremost, is that their views are riddled with paradoxes.
EVER MORE CONSUMPTION…
Some arguments, particularly those revolving around the best way to combat climate change, centre around the need to reduce consumption. Taken as a whole, the Europeans interviewed for this latest Observatoire Cetelem do not believe that this is on the cards. Indeed, 7 out of 10 feel that consumption has generally increased over the last decade (Fig. 1).
This view is shared in all countries, with Portuguese consumers proving the most forthright (87%), while the Poles, but also the French and Germans, remain a little more reserved (66%, 69% and 69%). One must head east, where incomes are lower, to find more measured responses (58%).
Fig 1 – Societal perception of the level of consumption
Download this infographic for your presentations Context:
Question: “Today, would you say that in general, in society, we consume…?”
Three categories:
• More than 10 years ago
• No more and no less
• Less than 10 years ago
Data:
Germany: 69% more / 11% stable / 20% less
Belgium: 75% more / 9% stable / 16% less
Spain: 76% more / 9% stable / 15% less
France: 69% more / 14% stable / 17% less
Italy: 76% more / 8% stable / 16% less
Poland: 66% more / 18% stable / 16% less
Portugal: 87% more / 3% stable / 10% less
Romania: 72% more / 11% stable / 17% less
UK: 78% more / 11% stable / 11% less
Sweden: 78% more / 9% stable / 13% less
Overall: 73% more / 11% stable / 16% less
Main course:
The dominant perception is largely that of an increase in consumption.
Source: The Cetelem 2025 Observatory.
Context:
Question: “Today, would you say that in general, in society, we consume…?”
Three categories:
• More than 10 years ago
• No more and no less
• Less than 10 years ago
Data:
Germany: 69% more / 11% stable / 20% less
Belgium: 75% more / 9% stable / 16% less
Spain: 76% more / 9% stable / 15% less
France: 69% more / 14% stable / 17% less
Italy: 76% more / 8% stable / 16% less
Poland: 66% more / 18% stable / 16% less
Portugal: 87% more / 3% stable / 10% less
Romania: 72% more / 11% stable / 17% less
UK: 78% more / 11% stable / 11% less
Sweden: 78% more / 9% stable / 13% less
Overall: 73% more / 11% stable / 16% less
Main course:
The dominant perception is largely that of an increase in consumption.
Source: The Cetelem 2025 Observatory.
…ESPECIALLY BY OTHERS
When Europeans are asked to reflect on how their own consumption is changing, their responses are more tentative. Barely 4 out of 10 believe that it has increased over the last decade (Fig. 2). And this time around, the gaps between the countries are much less significant. More than 50% of Portuguese and Romanians feel that this is the case, while the Germans and the French, two populations that we discuss in greater detail in the Barometer, are once again more circumspect, with around 30% of respondents expressing this opinion. And generally speaking, the over-50s and those on the lowest incomes are the most likely to state that their consumption levels have seen little change.
This discrepancy between people’s perception of their personal circumstances and their view of society as a whole can be analysed in two ways. Resisting the temptation to consume more allows us to project a more virtuous image fuelled by the idea that we are contributing to sustainability. Of course, as the saying almost goes, hell is other people, especially those who over-consume. This virtuous attitude could also stem from a feeling of guilt that might prevent respondents from honestly declaring that their personal consumption has increased.
Fig 2 – Level of personal consumption compared to ten years ago
Download this infographic for your presentations Context:
The infographic presents the question:
“Personally, would you say that you consume globally…?”
Three possible answers:
• Less than 10 years ago
• No more and no less than 10 years ago
• More than 10 years ago
Visuals:
Stacked vertical bar chart for 10 countries + an “Ensemble” bar.
Each bar is divided into three colored segments with percentage.
Data:
Germany: 29% more / 28% stable / 43% less
Belgium: 37% more / 30% stable / 33% less
Spain: 44% more / 25% stable / 31% less
France: 32% more / 31% stable / 37% less
Italy: 43% more / 21% stable / 36% less
Poland: 44% more / 29% stable / 27% less
Portugal: 51% more / 18% stable / 31% less
Romania: 52% more / 19% stable / 29% less
UK: 40% more / 30% stable / 30% less
Sweden: 37% more / 23% stable / 40% less
Overall: 38% more / 27% stable / 35% less
Main course:
Responses vary greatly by country, with high proportions of “more than 10 years ago” in Portugal, Romania and Spain.
Source: The Cetelem 2025 Observatory.
Context:
The infographic presents the question:
“Personally, would you say that you consume globally…?”
Three possible answers:
• Less than 10 years ago
• No more and no less than 10 years ago
• More than 10 years ago
Visuals:
Stacked vertical bar chart for 10 countries + an “Ensemble” bar.
Each bar is divided into three colored segments with percentage.
Data:
Germany: 29% more / 28% stable / 43% less
Belgium: 37% more / 30% stable / 33% less
Spain: 44% more / 25% stable / 31% less
France: 32% more / 31% stable / 37% less
Italy: 43% more / 21% stable / 36% less
Poland: 44% more / 29% stable / 27% less
Portugal: 51% more / 18% stable / 31% less
Romania: 52% more / 19% stable / 29% less
UK: 40% more / 30% stable / 30% less
Sweden: 37% more / 23% stable / 40% less
Overall: 38% more / 27% stable / 35% less
Main course:
Responses vary greatly by country, with high proportions of “more than 10 years ago” in Portugal, Romania and Spain.
Source: The Cetelem 2025 Observatory.
Fig 3 – Evolution of total household expenditure
Download this infographic for your presentations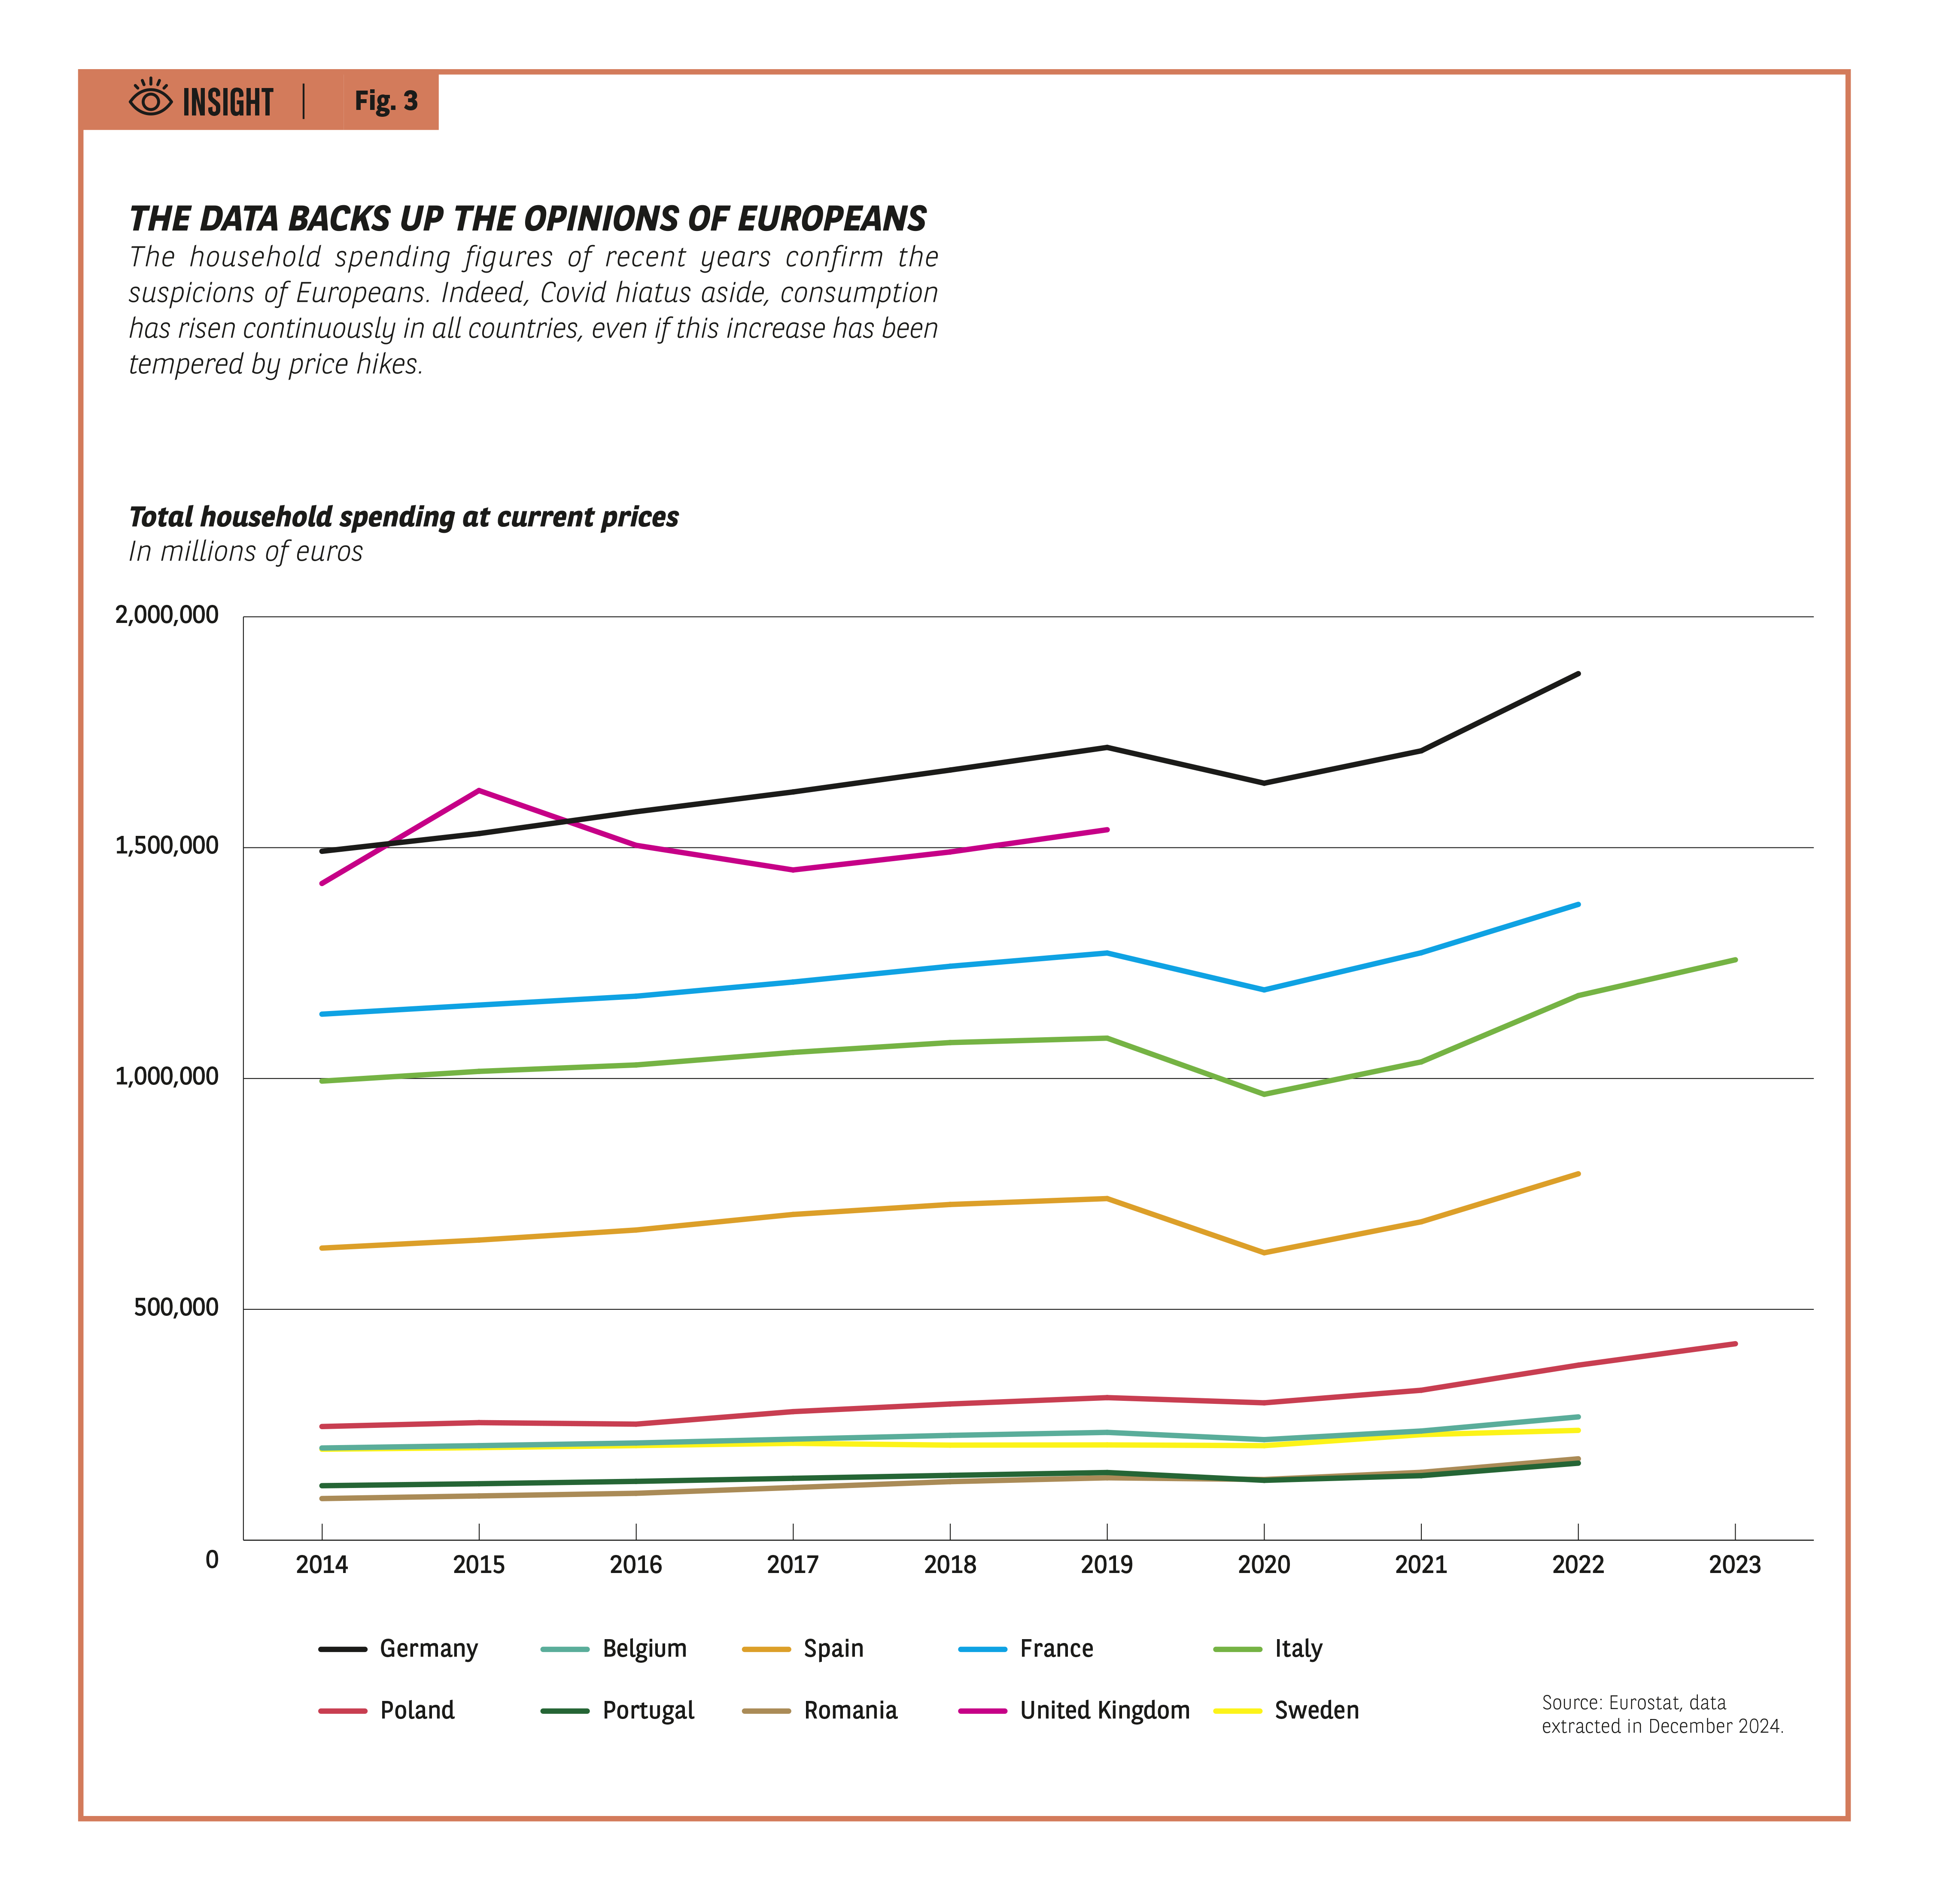 Context:
Line chart showing total household expenditure (in millions of euros) from 2014 to 2023.
Countries: Belgium, France, Germany, Italy, Poland, Portugal, Romania, Spain, Sweden, United Kingdom.
Key trends:
• General increase in all countries.
• Germany above €1,600,000 million, then close to €1,900,000 million in 2023.
• France: increase from ~€1,100,000 to ~€1,300,000 million.
• United Kingdom: between €1,400,000 and €1,600,000 million.
• Spain, Italy: moderate trends.
• Portugal, Poland and Romania have lower levels but are steadily rising.
Main course:
Spending is increasing in all countries, despite a dip in 2020.
Source: Eurostat, extraction December 2024.
Context:
Line chart showing total household expenditure (in millions of euros) from 2014 to 2023.
Countries: Belgium, France, Germany, Italy, Poland, Portugal, Romania, Spain, Sweden, United Kingdom.
Key trends:
• General increase in all countries.
• Germany above €1,600,000 million, then close to €1,900,000 million in 2023.
• France: increase from ~€1,100,000 to ~€1,300,000 million.
• United Kingdom: between €1,400,000 and €1,600,000 million.
• Spain, Italy: moderate trends.
• Portugal, Poland and Romania have lower levels but are steadily rising.
Main course:
Spending is increasing in all countries, despite a dip in 2020.
Source: Eurostat, extraction December 2024.
A REALITY COLOURED BY NEGATIVE PERCEPTIONS…
The fact that 6 out of 10 Europeans have a negative image of consumption could be down to the feelings of guilt it might generate (Fig. 4). These sentiments are shared by a majority of people in all countries except for Poland, where only 4 out of 10 experience such guilt. The responses of the Latin countries, including Portugal, France, Romania and Italy, suggest that these perceptions are also cultural in nature and linked to people’s relationship with money and how they spend it. It should also be noted that residents of large towns and cities hold less negative views overall.
Fig 4 – Negative perception of the word consumption by country
Download this infographic for your presentations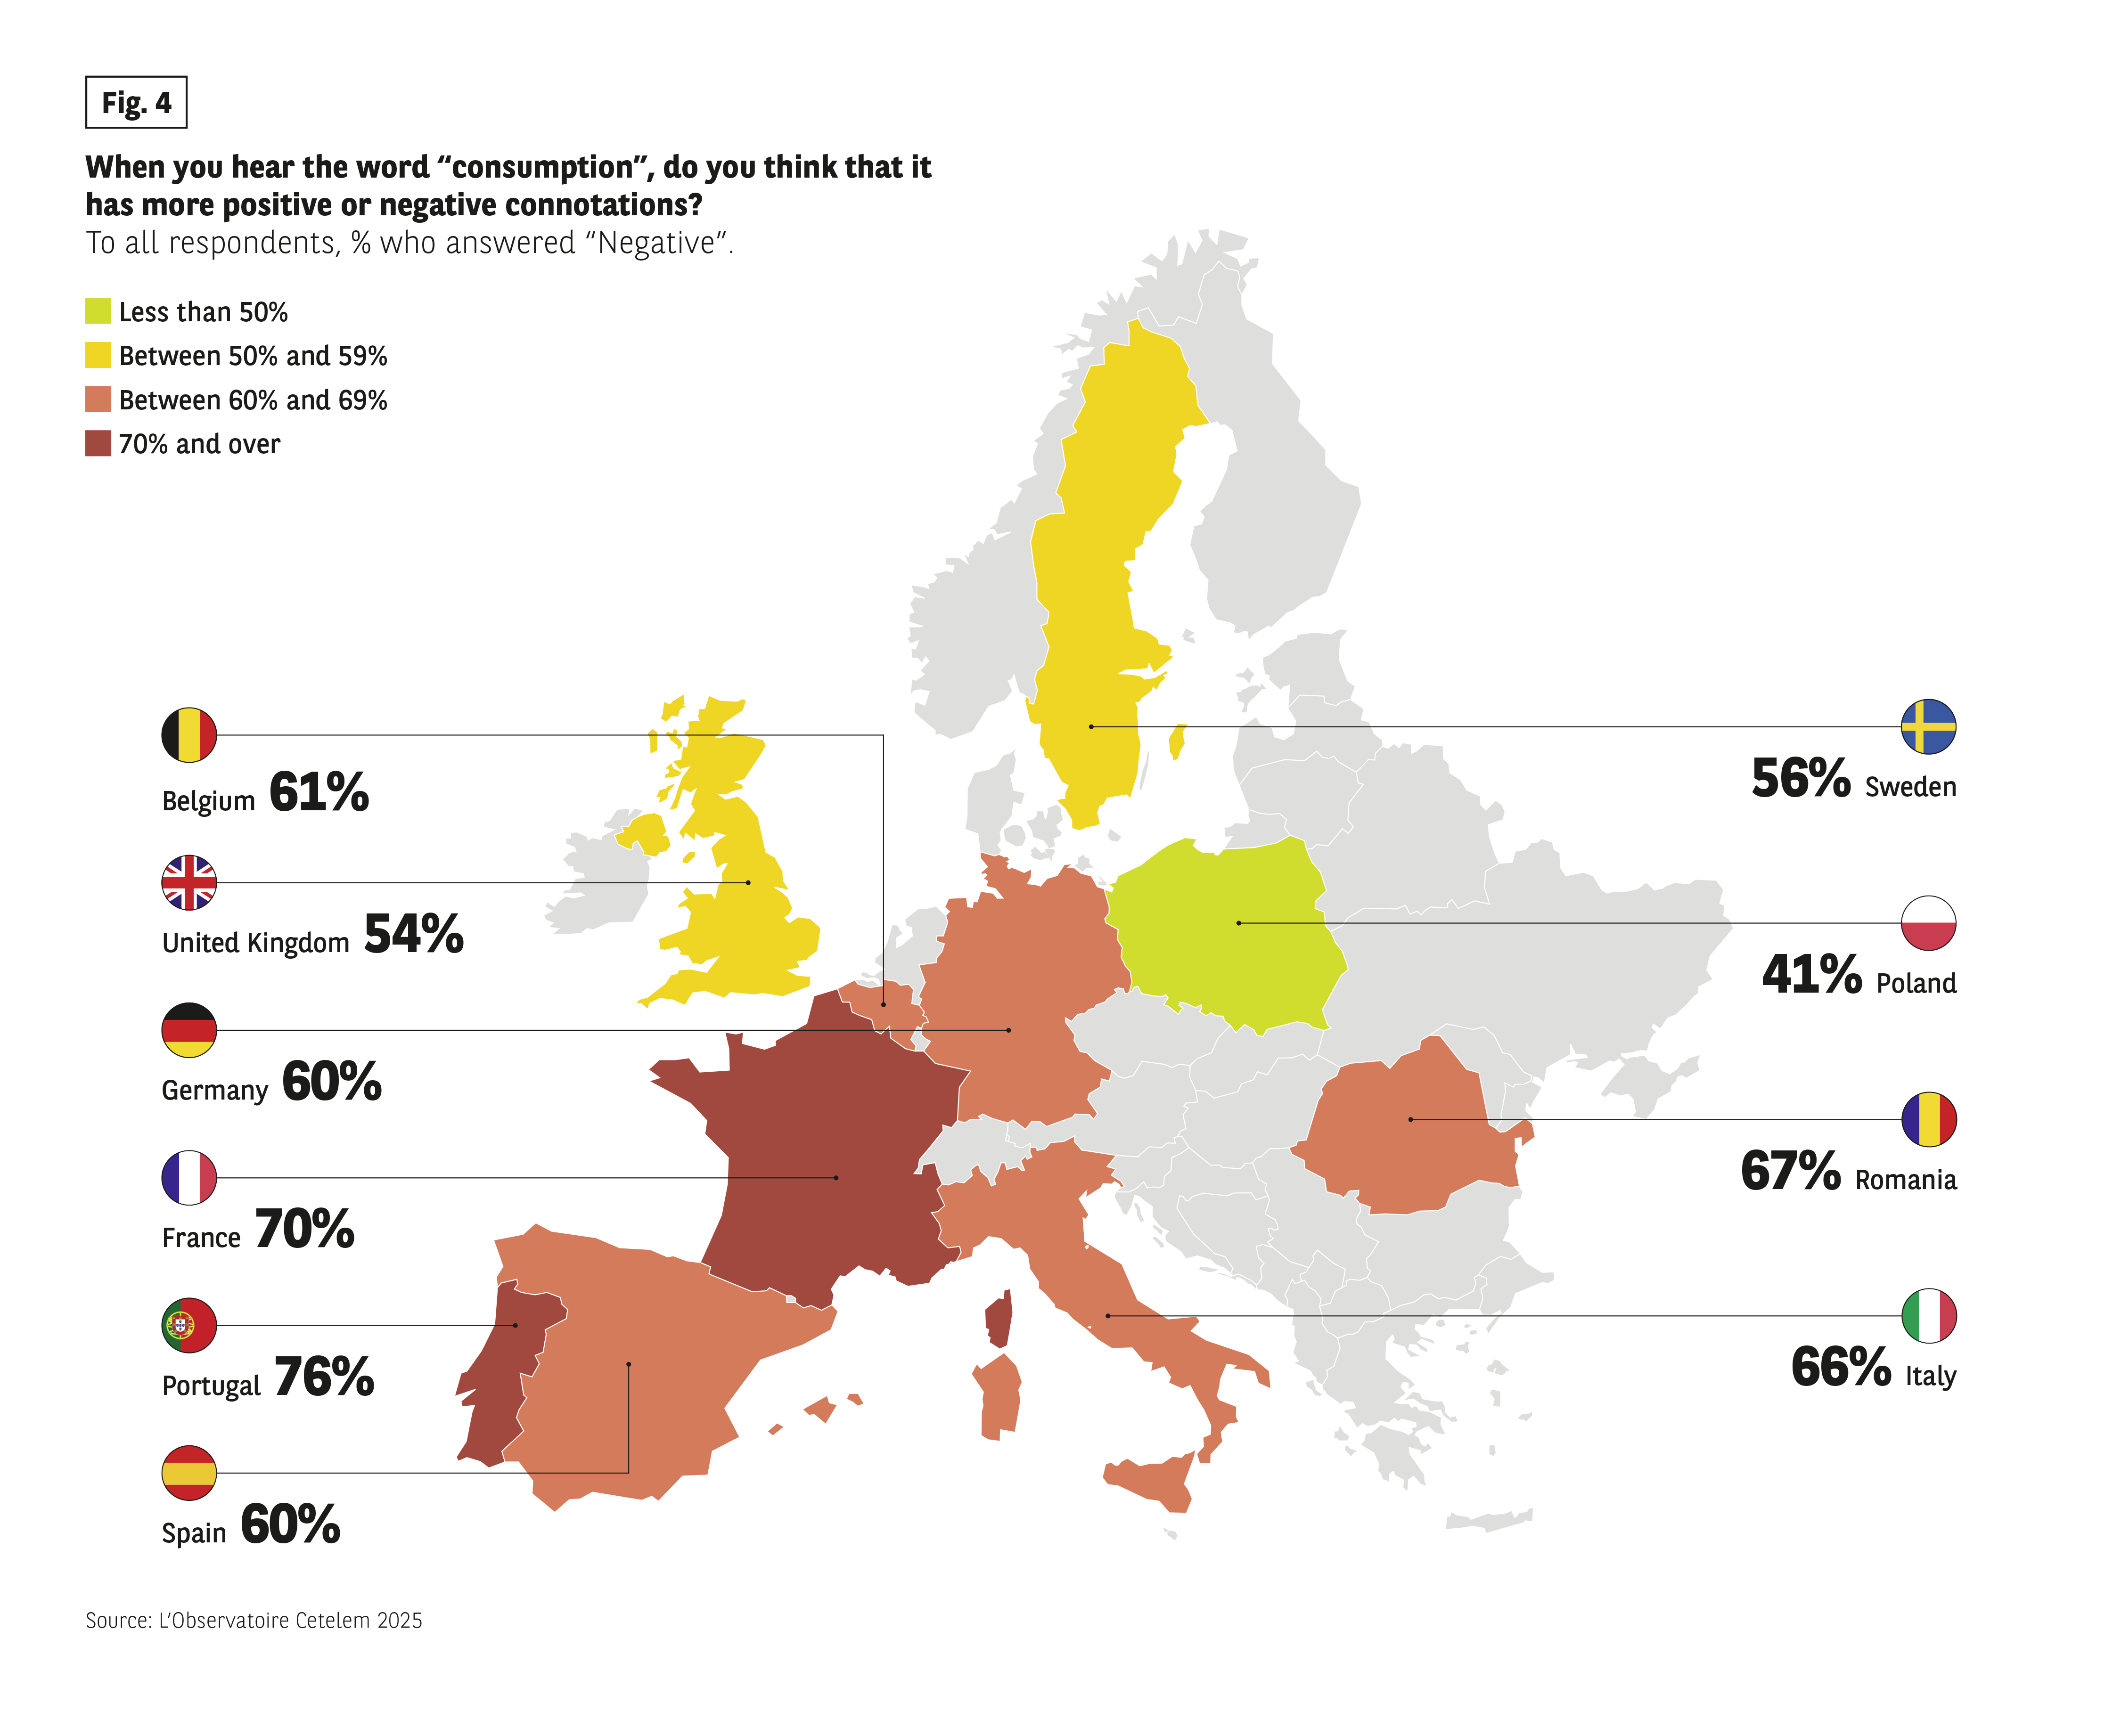 Context:
Question: “When you hear the word consumption, would you say that it inspires you to do things that are more positive or negative?”
Values: Percentage of “negative” responses.
Data:
• Belgium: 61%
• United Kingdom: 54%
• Germany: 60%
• France: 70%
• Portugal: 76%
• Spain: 60%
• Sweden: 56%
• Poland: 41%
• Romania: 67%
• Italy: 66%
Main course:
The negative perception exceeds 60% in the majority of countries.
Source: The Cetelem 2025 Observatory.
Context:
Question: “When you hear the word consumption, would you say that it inspires you to do things that are more positive or negative?”
Values: Percentage of “negative” responses.
Data:
• Belgium: 61%
• United Kingdom: 54%
• Germany: 60%
• France: 70%
• Portugal: 76%
• Spain: 60%
• Sweden: 56%
• Poland: 41%
• Romania: 67%
• Italy: 66%
Main course:
The negative perception exceeds 60% in the majority of countries.
Source: The Cetelem 2025 Observatory.
…FUELLED BY THE NOTIONS OF WASTAGE AND EXTRAVAGANCE
The words Europeans associate with the macroeconomic function of modern consumption are a direct, clear and unmistakable reflection of their disdain. Indeed, wastage and extravagance are the most frequently cited terms. Advocates of deconsumption will doubtless see this as a source of hope, as will those with moralistic tendencies. Some respond with more positive terms, but in much smaller proportions (Fig. 5).
Fig 5 – Word that best describes current consumption
Download this infographic for your presentations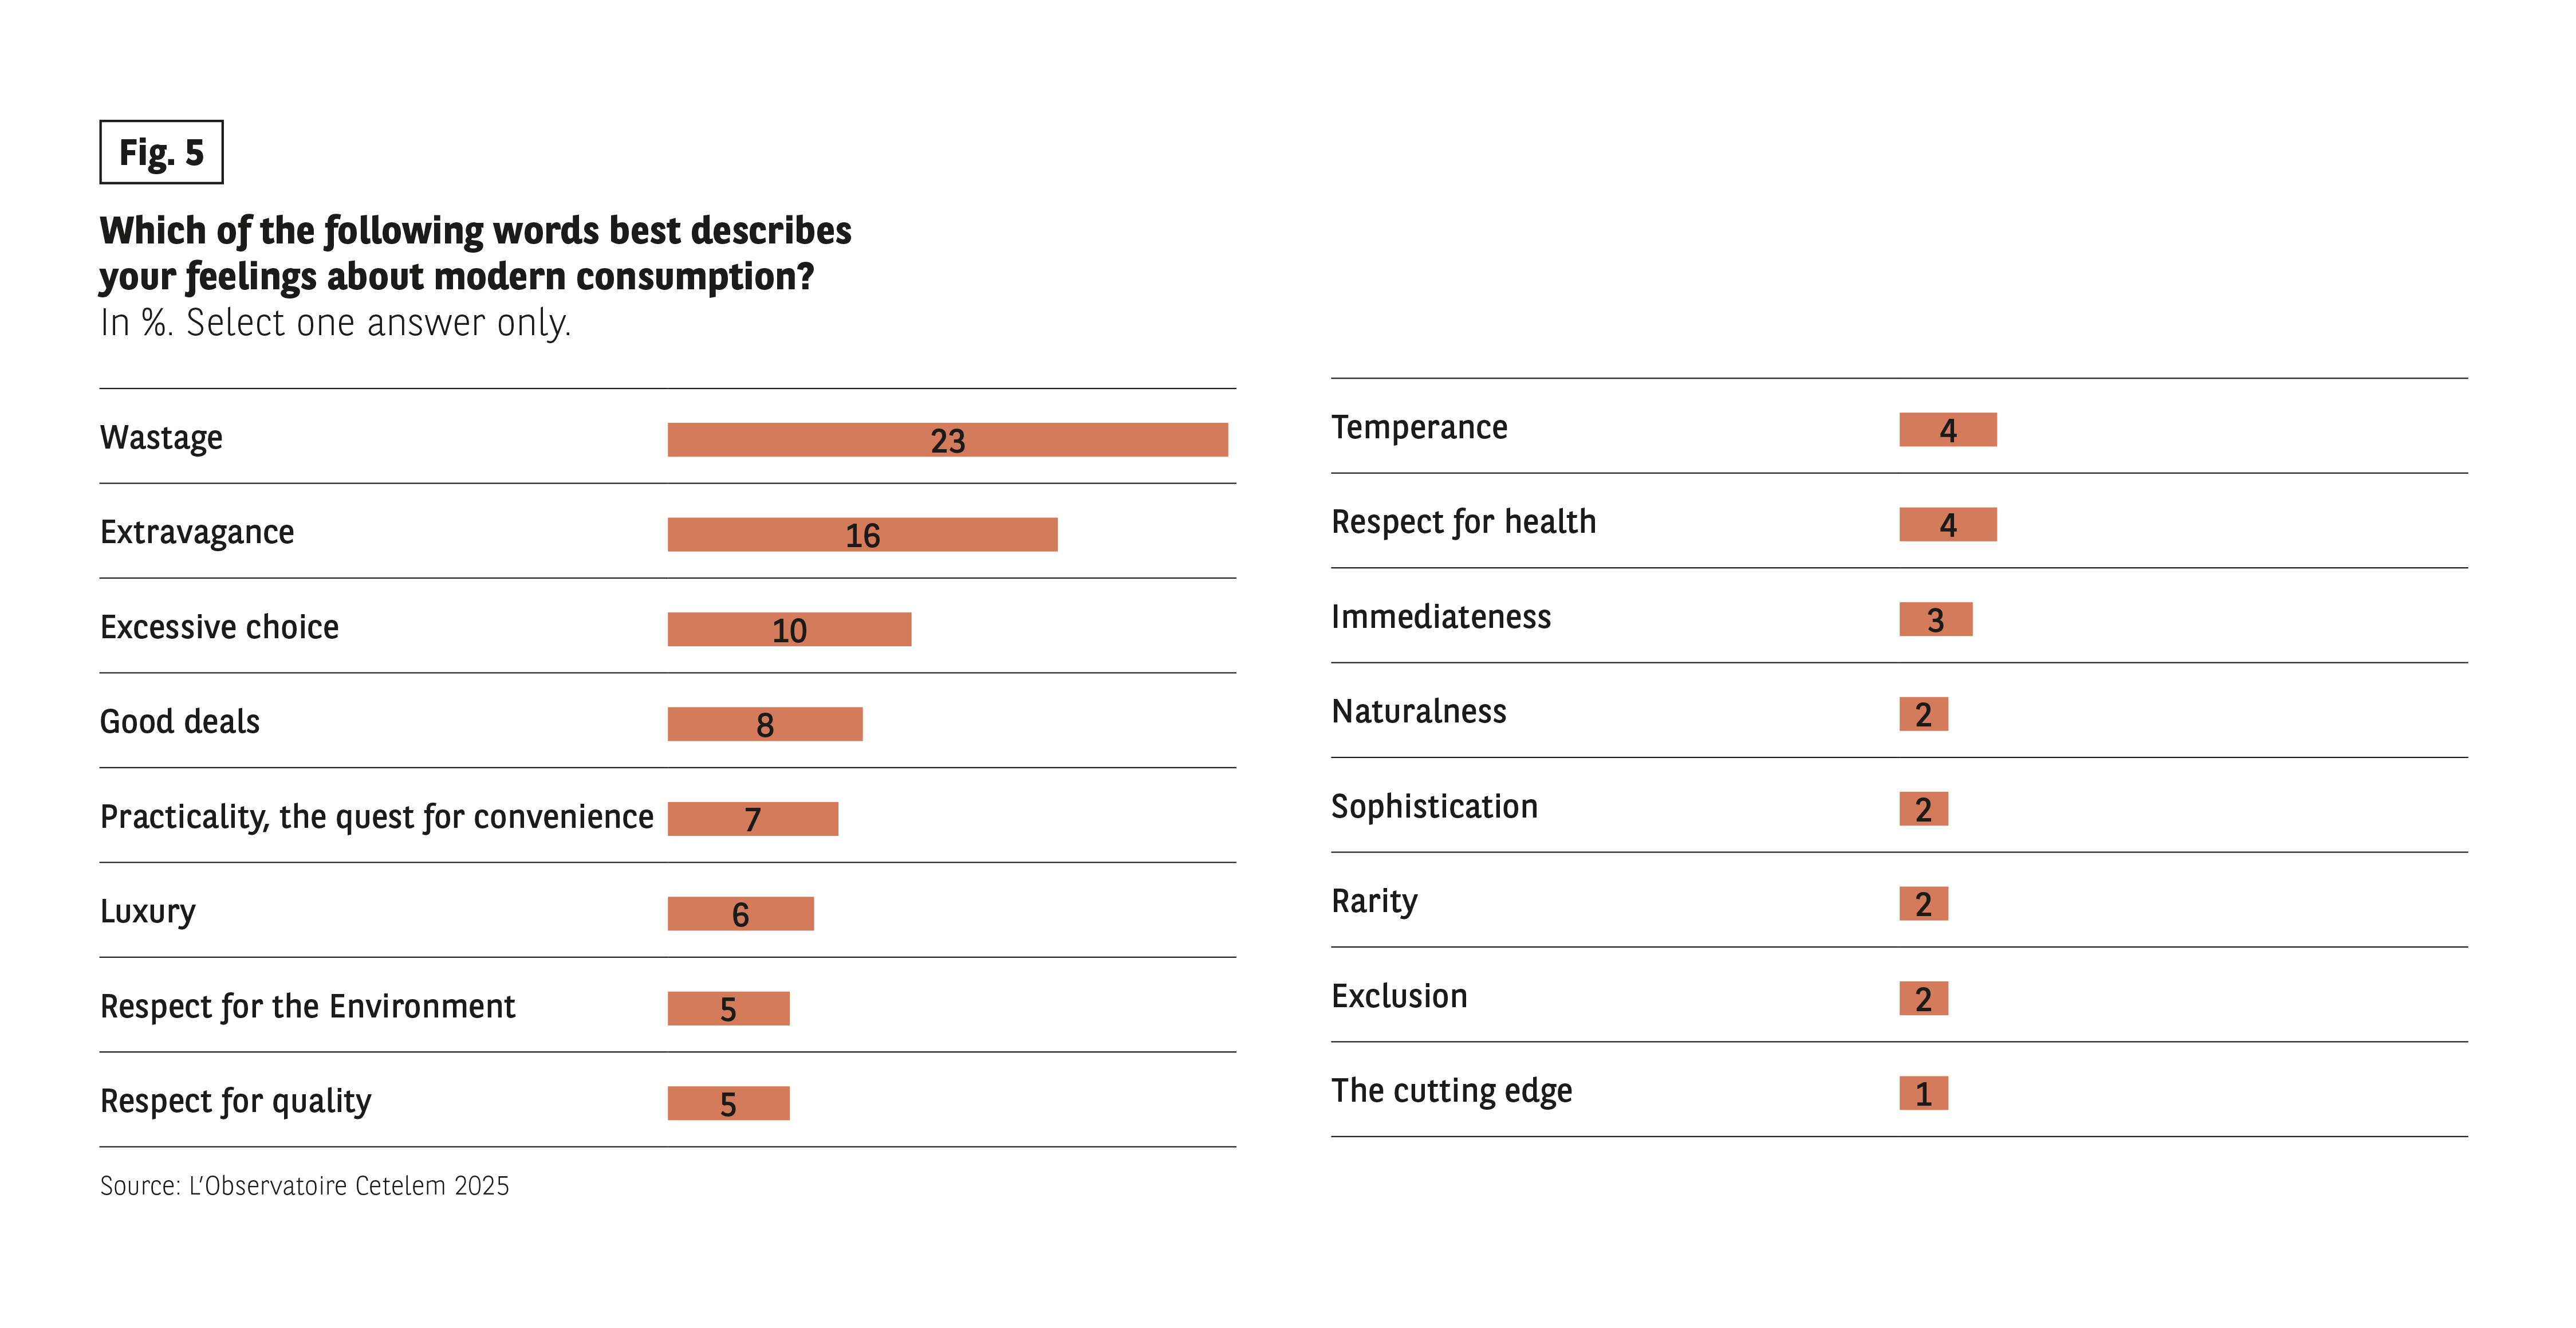 Context:
Question: “Which of the following words best describes your vision of consumption as it is practiced today?”
There is only one possible answer.
Data:
• Waste: 23%
• Excess: 16%
• Hyper choice: 10%
• Good deals: 8%
• Practicality / comfort: 7%
• Luxury: 6%
• Environmentally friendly: 5%
• Respect for quality: 5%
• Sobriety: 4%
• Respect for health: 4%
• Immediate: 3%
• Naturalness: 2%
• Sophistication: 2%
• Rarity: 2%
• Exclusion: 2%
• Forward-thinking: 1%
Main course:
“Waste” and “excess” are the two words that are mostly used.
Source: The Cetelem 2025 Observatory.
Context:
Question: “Which of the following words best describes your vision of consumption as it is practiced today?”
There is only one possible answer.
Data:
• Waste: 23%
• Excess: 16%
• Hyper choice: 10%
• Good deals: 8%
• Practicality / comfort: 7%
• Luxury: 6%
• Environmentally friendly: 5%
• Respect for quality: 5%
• Sobriety: 4%
• Respect for health: 4%
• Immediate: 3%
• Naturalness: 2%
• Sophistication: 2%
• Rarity: 2%
• Exclusion: 2%
• Forward-thinking: 1%
Main course:
“Waste” and “excess” are the two words that are mostly used.
Source: The Cetelem 2025 Observatory.