Personal consumption is under control


CONSUMING WISELY: A QUESTION OF BALANCE
While consumption may be marred with a negative image and described in disparaging terms, Europeans believe they have a degree of control over it. With an average score of 5.3 out of 10, they feel that they consume neither too much nor too little, but just the right amount, like shrewd strategists making carefully considered spending choices. No country scores less than 5 out of 10, with the Romanians and British standing out for their propensity to make more purchases. Age and living environment are two factors that make a significant difference to the results. Younger people and city dwellers consider themselves to be bigger spenders (Fig. 6).
Fig 6 – General trend to buy more or less by country
Download this infographic for your presentations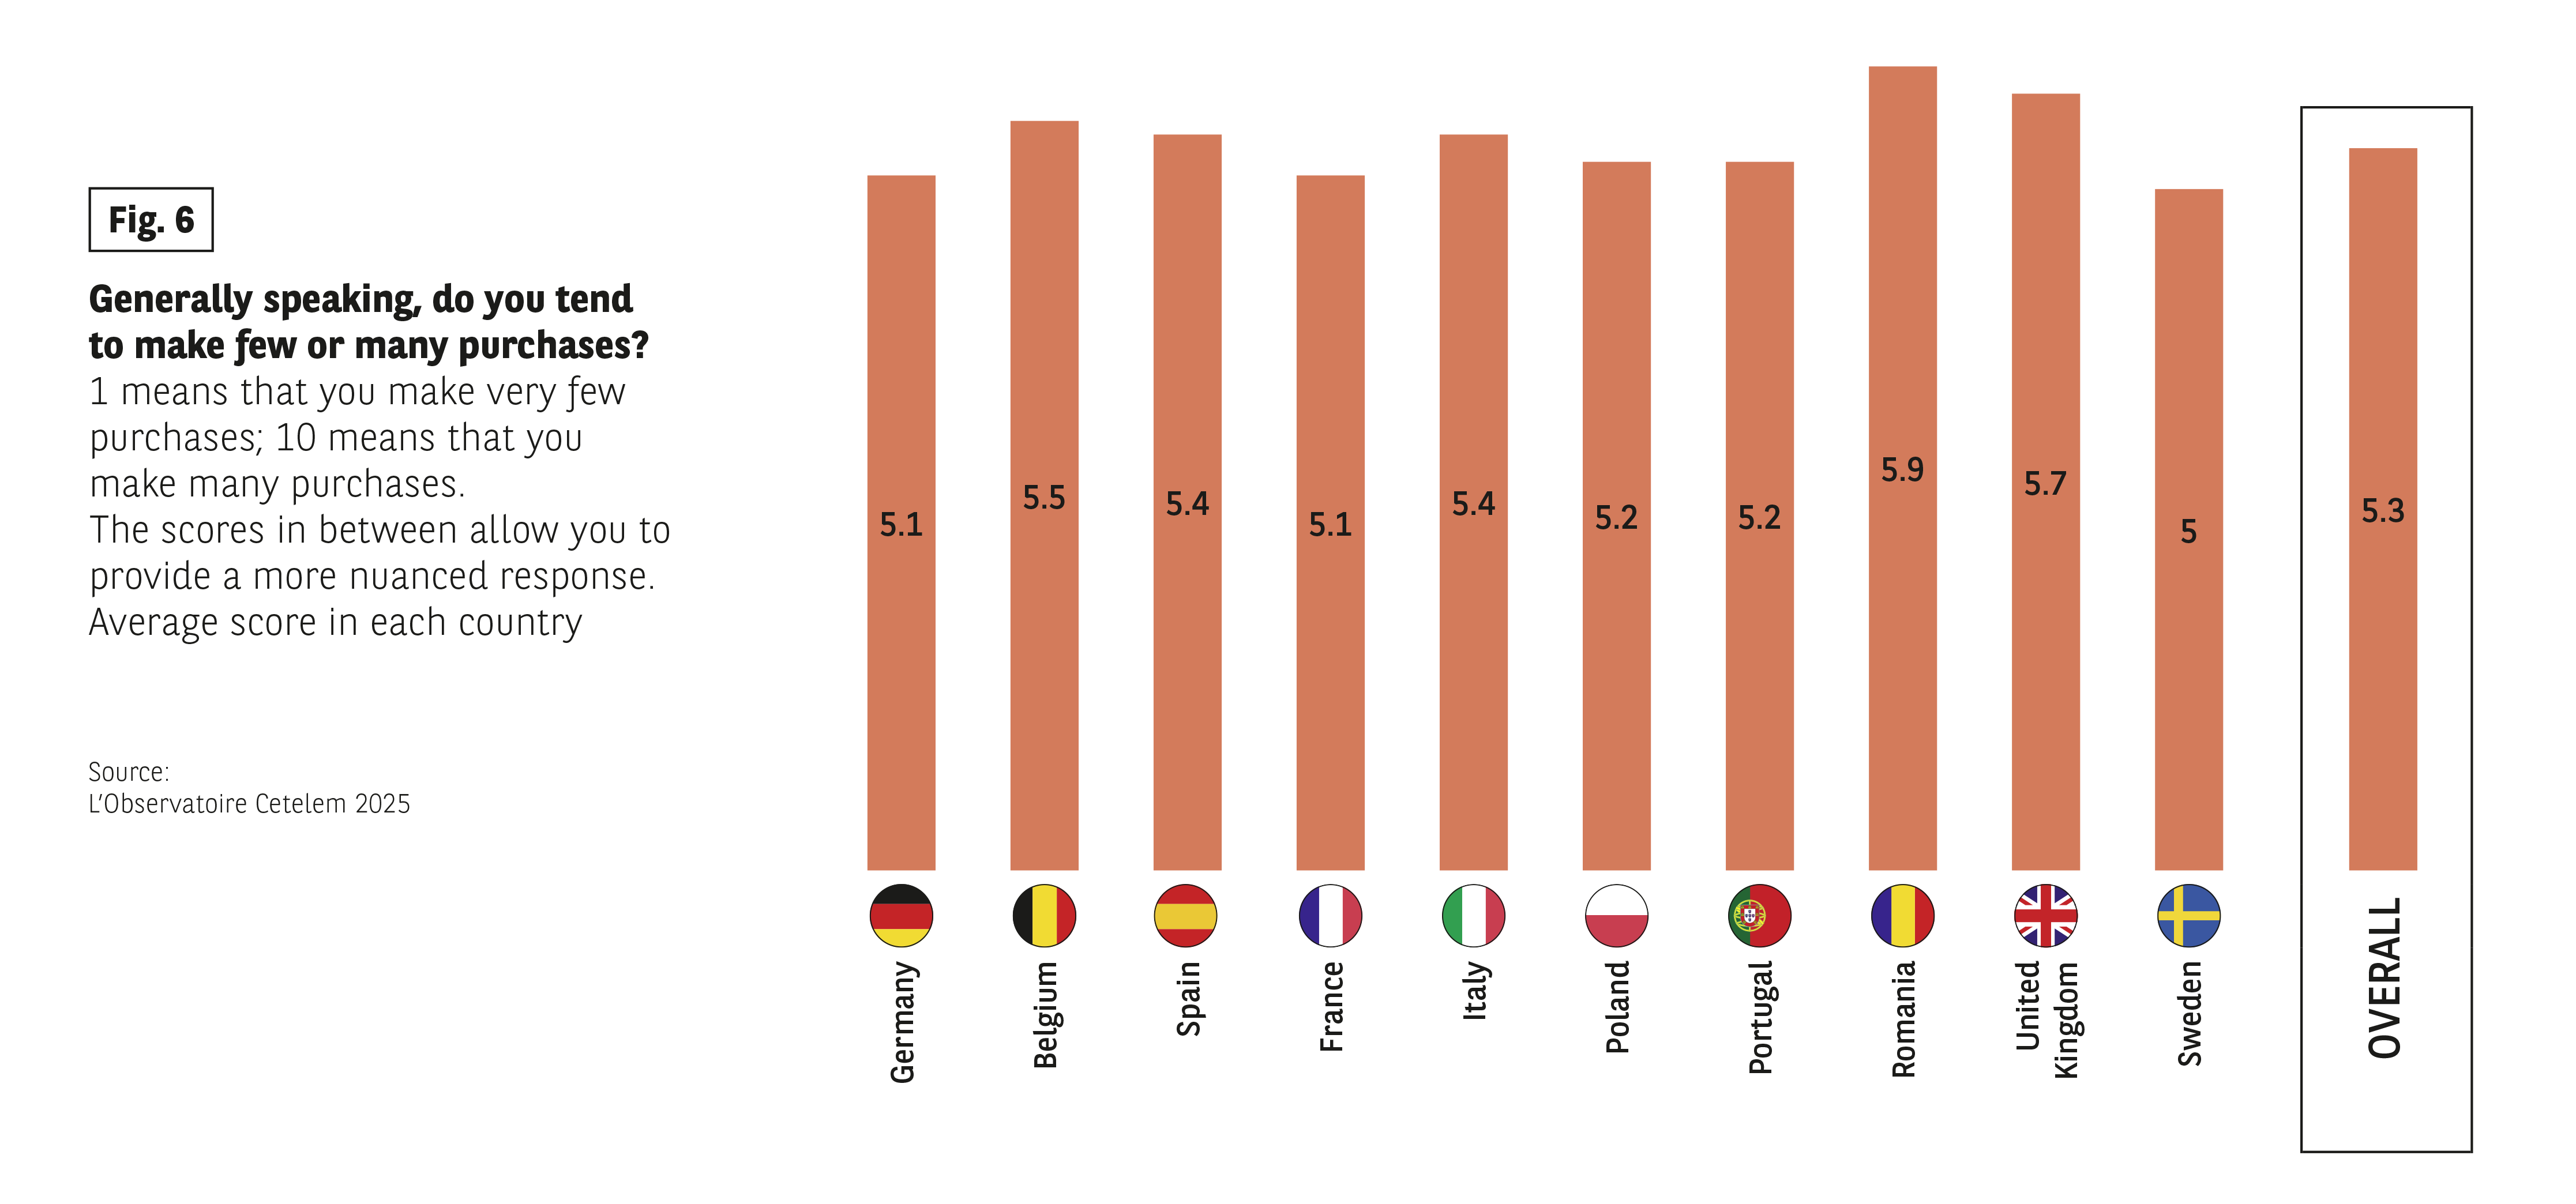 Context:
Question: “Generally speaking, do you tend to buy a few or a lot of things?”
Scale from 1 (very little) to 10 (a lot).
Data presented: average score per country.
Data:
• Germany: 5.1
• Belgium: 5.5
• Spain: 5.4
• France: 5.1
• Italy: 5.4
• Poland: 5.2
• Portugal: 5.9
• Romania: 5.7
• United Kingdom: 5
• Sweden: 5.3
• Overall: 5.3
Main course:
The scores are close to 5–6, showing an average tendency to buy neither a little nor a lot.
Source: The Cetelem 2025 Observatory.
Context:
Question: “Generally speaking, do you tend to buy a few or a lot of things?”
Scale from 1 (very little) to 10 (a lot).
Data presented: average score per country.
Data:
• Germany: 5.1
• Belgium: 5.5
• Spain: 5.4
• France: 5.1
• Italy: 5.4
• Poland: 5.2
• Portugal: 5.9
• Romania: 5.7
• United Kingdom: 5
• Sweden: 5.3
• Overall: 5.3
Main course:
The scores are close to 5–6, showing an average tendency to buy neither a little nor a lot.
Source: The Cetelem 2025 Observatory.
ALL EXPENSES ARE UNDER CLOSE CONTROL
This balanced approach to consumption is matched by people’s very high overall level of satisfaction with their ability to control their expenditure in all areas. Indeed, 8 out of 10 Europeans, and in some cases even more, consider themselves to have good or excellent control over every type of expense put to them (Fig. 7). This is also an area in which the expertise of older individuals wins out over the enthusiasm of the young. Likewise, having a higher income makes it easier to establish such control.
Fig 7 – Feeling in control of different types of expenses
Download this infographic for your presentations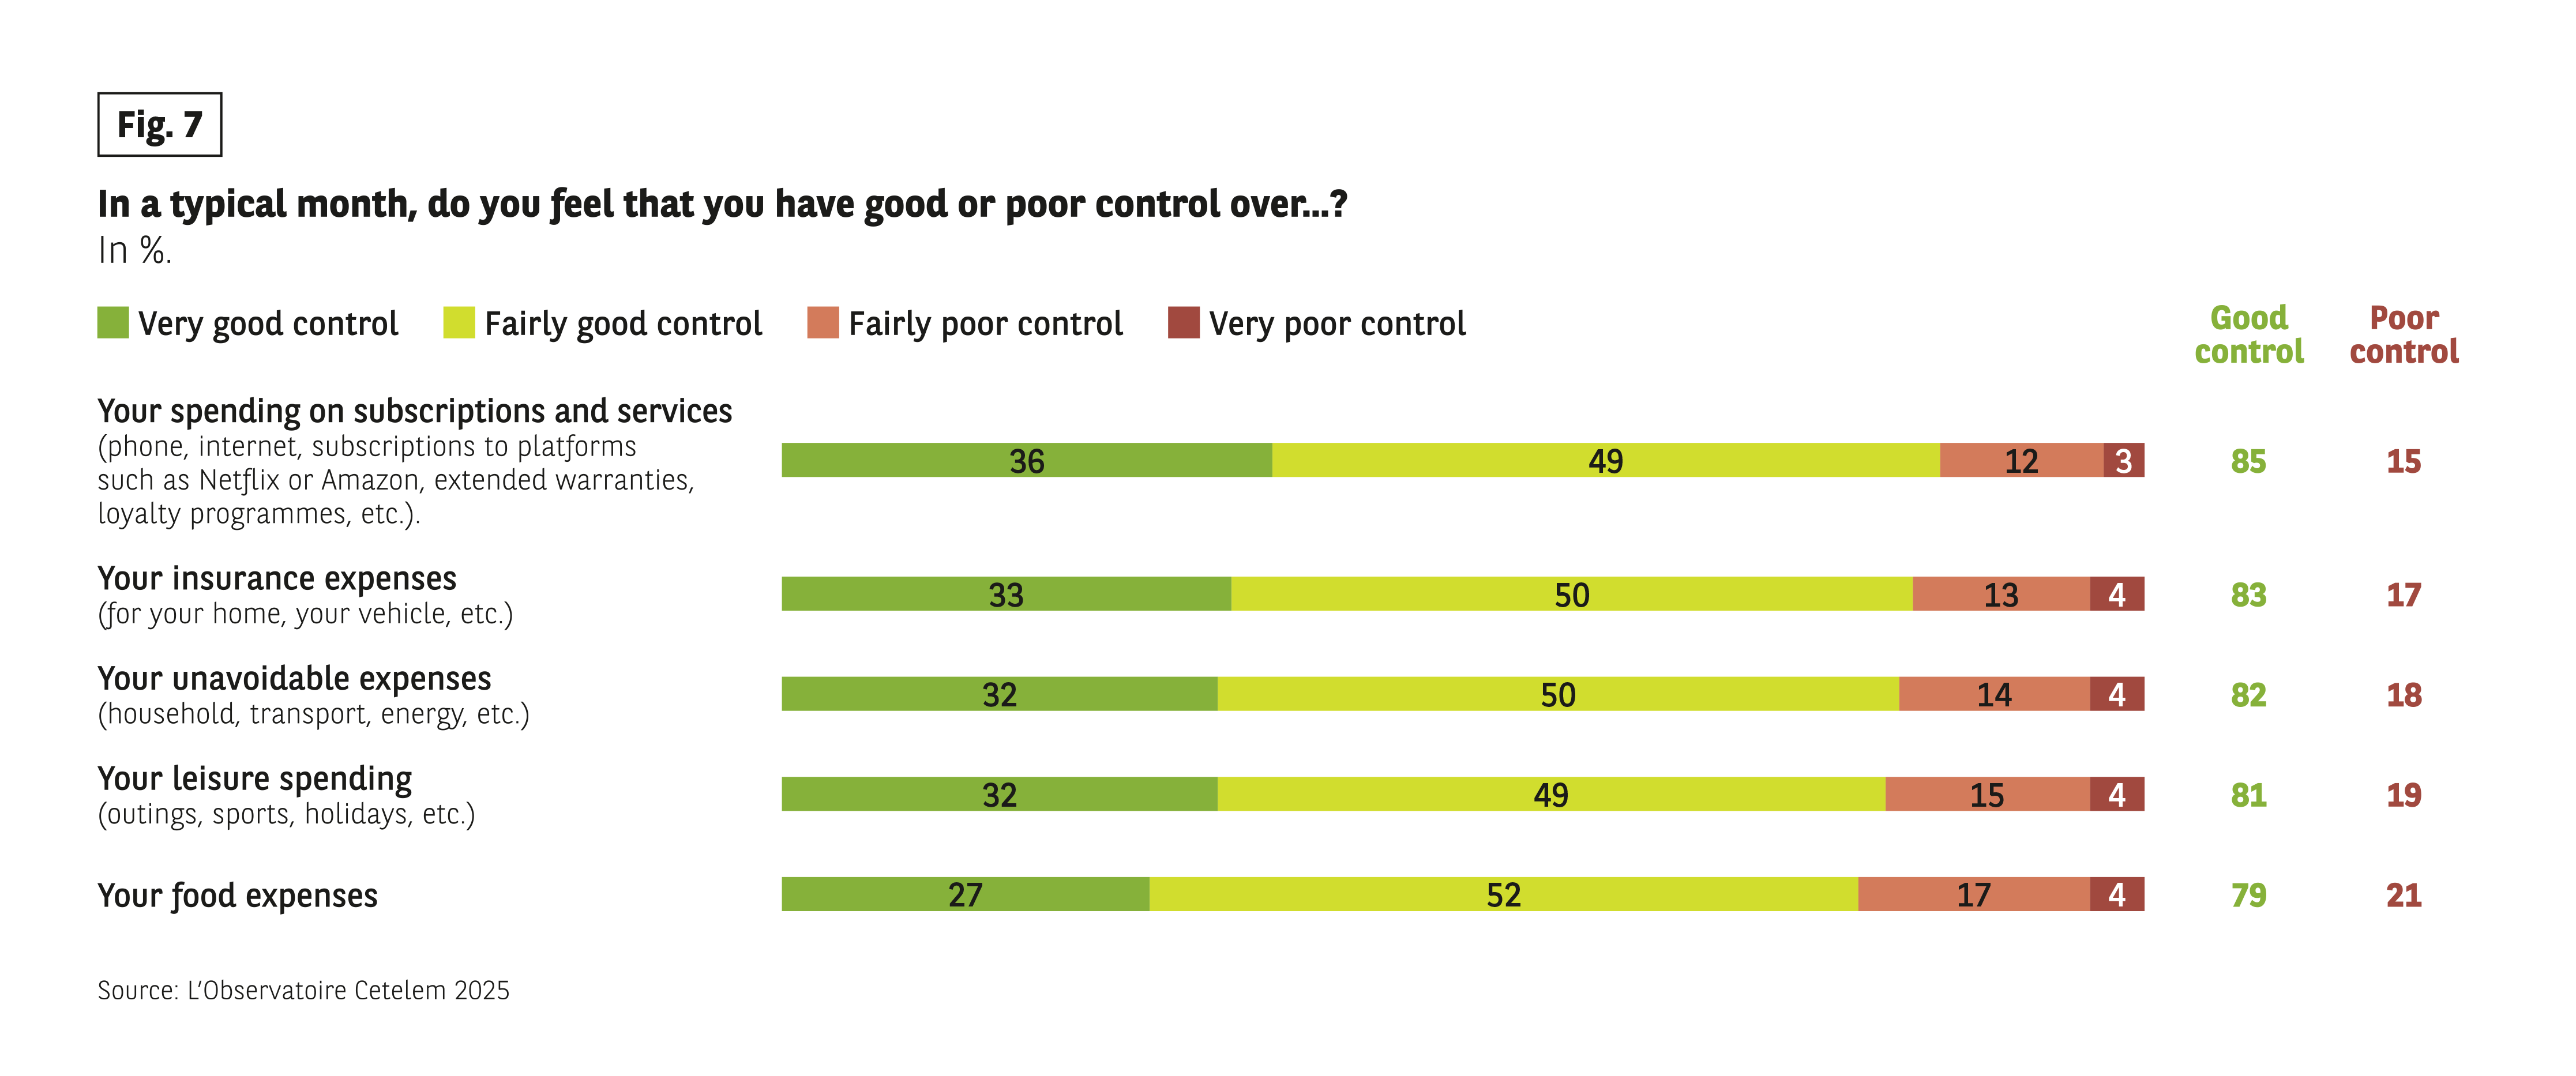 Context:
Question: “In the course of a usual month, do you feel that you have a good or bad mastery…?”
Categories:
Very good / Rather good / Rather bad / Very bad.
Data (Mastering = sum of the first two; evil = sum of the last two):
• Subscriptions and services: 36% very good, 49% somewhat good, 12% somewhat bad, 3% very badly → 85% good / 15% bad
• Insurance: 33%, 50%, 13%, 4% → 83% good / 17% bad
• Constrained expenses: 32%, 50%, 14%, 4% → 82% good / 18% bad
• Hobbies: 32%, 49%, 15%, 4% → 81% good / 19% bad
• Food expenditure: 27%, 52%, 17%, 4% → 79% good / 21% poor
Main course:
Perceived control is high overall, but slightly lower for food expenditure.
Source: The Cetelem 2025 Observatory.
Context:
Question: “In the course of a usual month, do you feel that you have a good or bad mastery…?”
Categories:
Very good / Rather good / Rather bad / Very bad.
Data (Mastering = sum of the first two; evil = sum of the last two):
• Subscriptions and services: 36% very good, 49% somewhat good, 12% somewhat bad, 3% very badly → 85% good / 15% bad
• Insurance: 33%, 50%, 13%, 4% → 83% good / 17% bad
• Constrained expenses: 32%, 50%, 14%, 4% → 82% good / 18% bad
• Hobbies: 32%, 49%, 15%, 4% → 81% good / 19% bad
• Food expenditure: 27%, 52%, 17%, 4% → 79% good / 21% poor
Main course:
Perceived control is high overall, but slightly lower for food expenditure.
Source: The Cetelem 2025 Observatory.
A SENSE OF PRIDE IN CONTROLLING SPENDING
The ability to shrewdly manage one’s consumption budget is widely seen as a source of pride. It is no surprise to find that the feeling of being able to manage one’s budget dominates the ranking (83%), particularly in Italy, Sweden and Portugal (Fig. 8). Older consumers are more likely to take pride in expertly managing their expenses.
The knowledge that one is taking advantage of bargains or good deals receives a comparable score (82%), again with a bias towards the aforementioned countries and age category.
Consuming responsibly and treating oneself obtain similar scores (77%), proving that, in the eyes of Europeans, the two are not incompatible and can coexist as part of a consumption strategy that consumers can be proud of. This is just one of the dualities this study reveals, more on which later. The Italians and Portuguese place the most value on responsible consumption, while the Swedes, French and Italians are once again the most focused on pride and enjoyment.
Fig 8 – Aspects of consumption that make you proud
Download this infographic for your presentations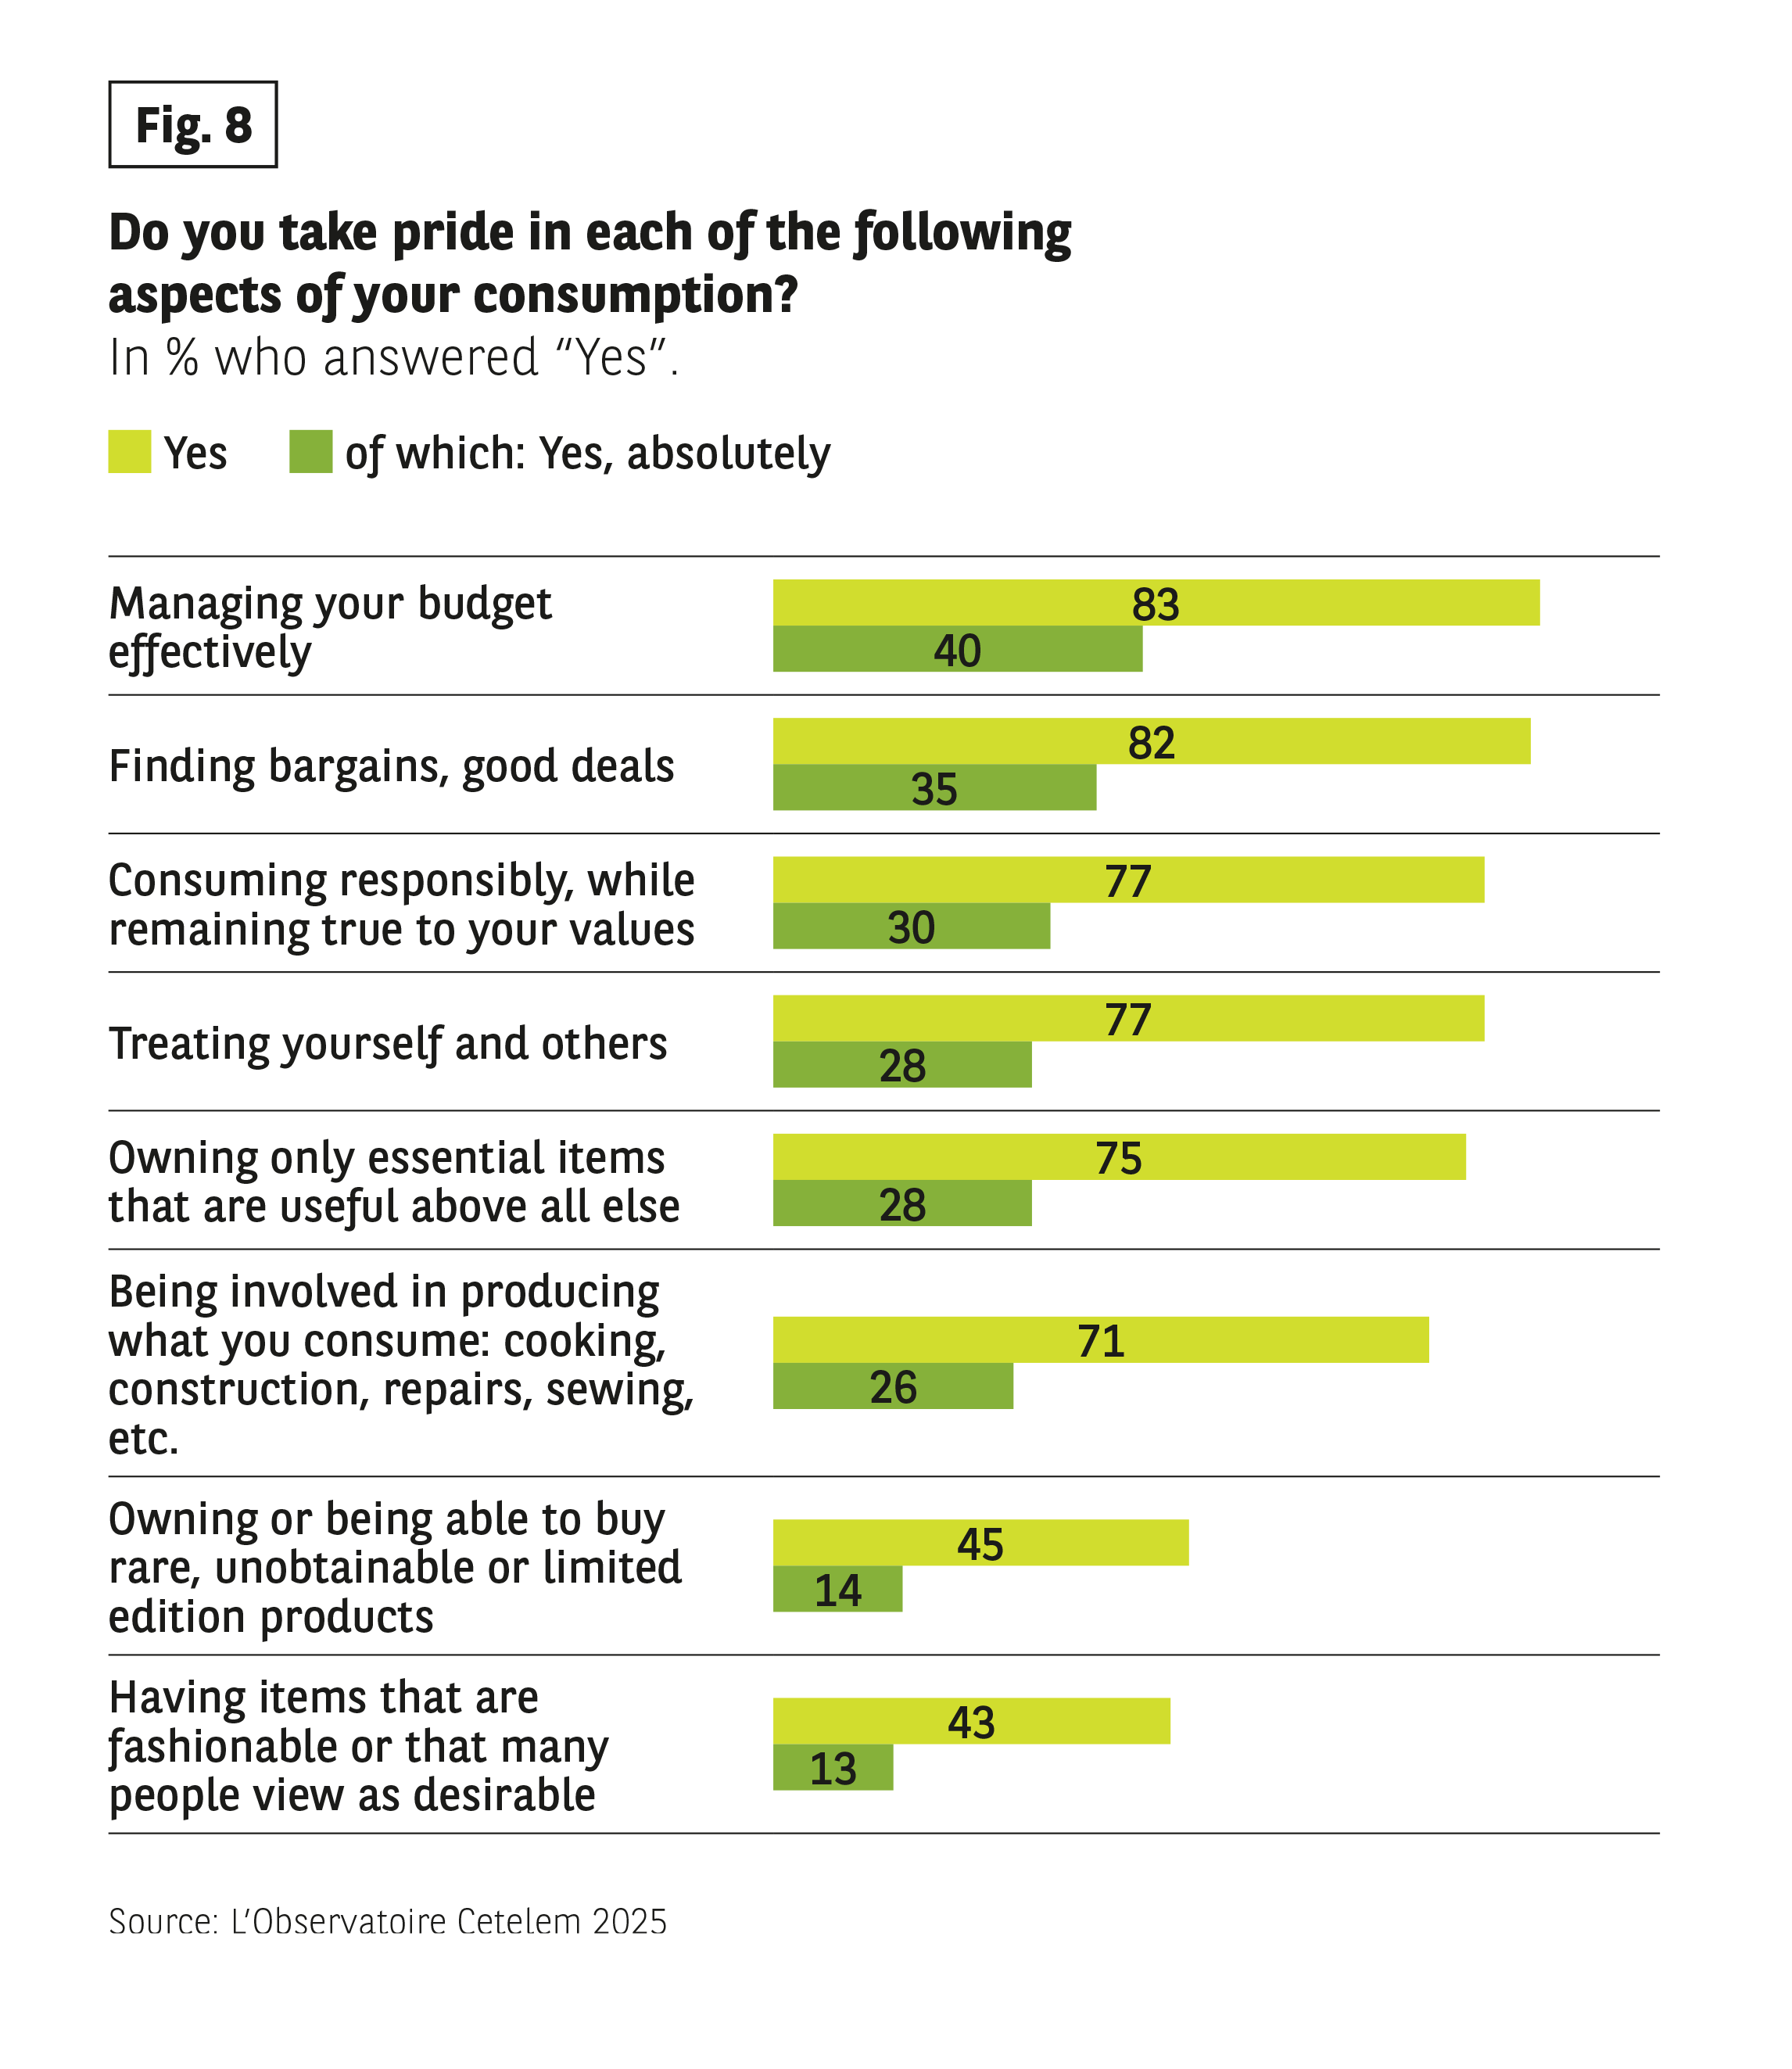 Context:
Question: “Can each of the following aspects of consumption make you proud or not?”
Data (Yes / Of which yes absolutely):
• Managing your budget effectively: 83% / 40%
• Doing good business: 82% / 35%
• Consume responsibly: 77% / 30%
• Indulging oneself or making someone happy: 77% / 28%
• Have the minimum useful amount: 75% / 28%
• Being involved in the finalization of one’s consumption: 71% / 26%
• Owning rare or limited-edition products: 45% / 14%
• Having trendy things: 43% / 13%
Main course:
The strongest sources of pride are budget management and good deals.
Source: The Cetelem 2025 Observatory.
Context:
Question: “Can each of the following aspects of consumption make you proud or not?”
Data (Yes / Of which yes absolutely):
• Managing your budget effectively: 83% / 40%
• Doing good business: 82% / 35%
• Consume responsibly: 77% / 30%
• Indulging oneself or making someone happy: 77% / 28%
• Have the minimum useful amount: 75% / 28%
• Being involved in the finalization of one’s consumption: 71% / 26%
• Owning rare or limited-edition products: 45% / 14%
• Having trendy things: 43% / 13%
Main course:
The strongest sources of pride are budget management and good deals.
Source: The Cetelem 2025 Observatory.
A MULTIFACETED APPROACH
While the inflation crisis appears to be firmly behind us, Europeans continue to view price as one of the main components of sensible, well-managed consumption (Fig. 9). 6 out of 10 state that they take price into account before making a purchase, a figure even higher than a decade ago. This is particularly true in France and Italy, but also in Belgium and the UK. The over-50s are significantly more likely than younger people to pay attention to price.
The ability to manage one’s consumption also depends on factors that add different, but equally important, nuances to the picture. Indeed, 6 out of 10 Europeans want more personalised services. This focus on service – to which we will return subsequently – is a significant development of the last decade. It has been driven chiefly by the rapid growth of e-commerce and by marketing that uses powerful algorithms to better cater for the needs of consumers, and even to anticipate or create them, by offering perfectly tailored offers, financing solutions and tools.
The third highest priority of consumers is health (57%), a result partially rooted in the impact of Covid-19, which has had a lasting effect on behaviours and consumption alike. A previous edition of L’Observatoire Cetelem spotlighted the development of contactless technology. By placing health near the top of the list, and environmental issues not far behind, Europeans confirm the importance they place on these issues, and probably irreversibly so. If we bear in mind the recent public health crisis, it is no surprise to observe that health is very important to the over-50s and those who live in big cities.
Fig 9 – More sought-after consumption criteria than ten years ago
Download this infographic for your presentations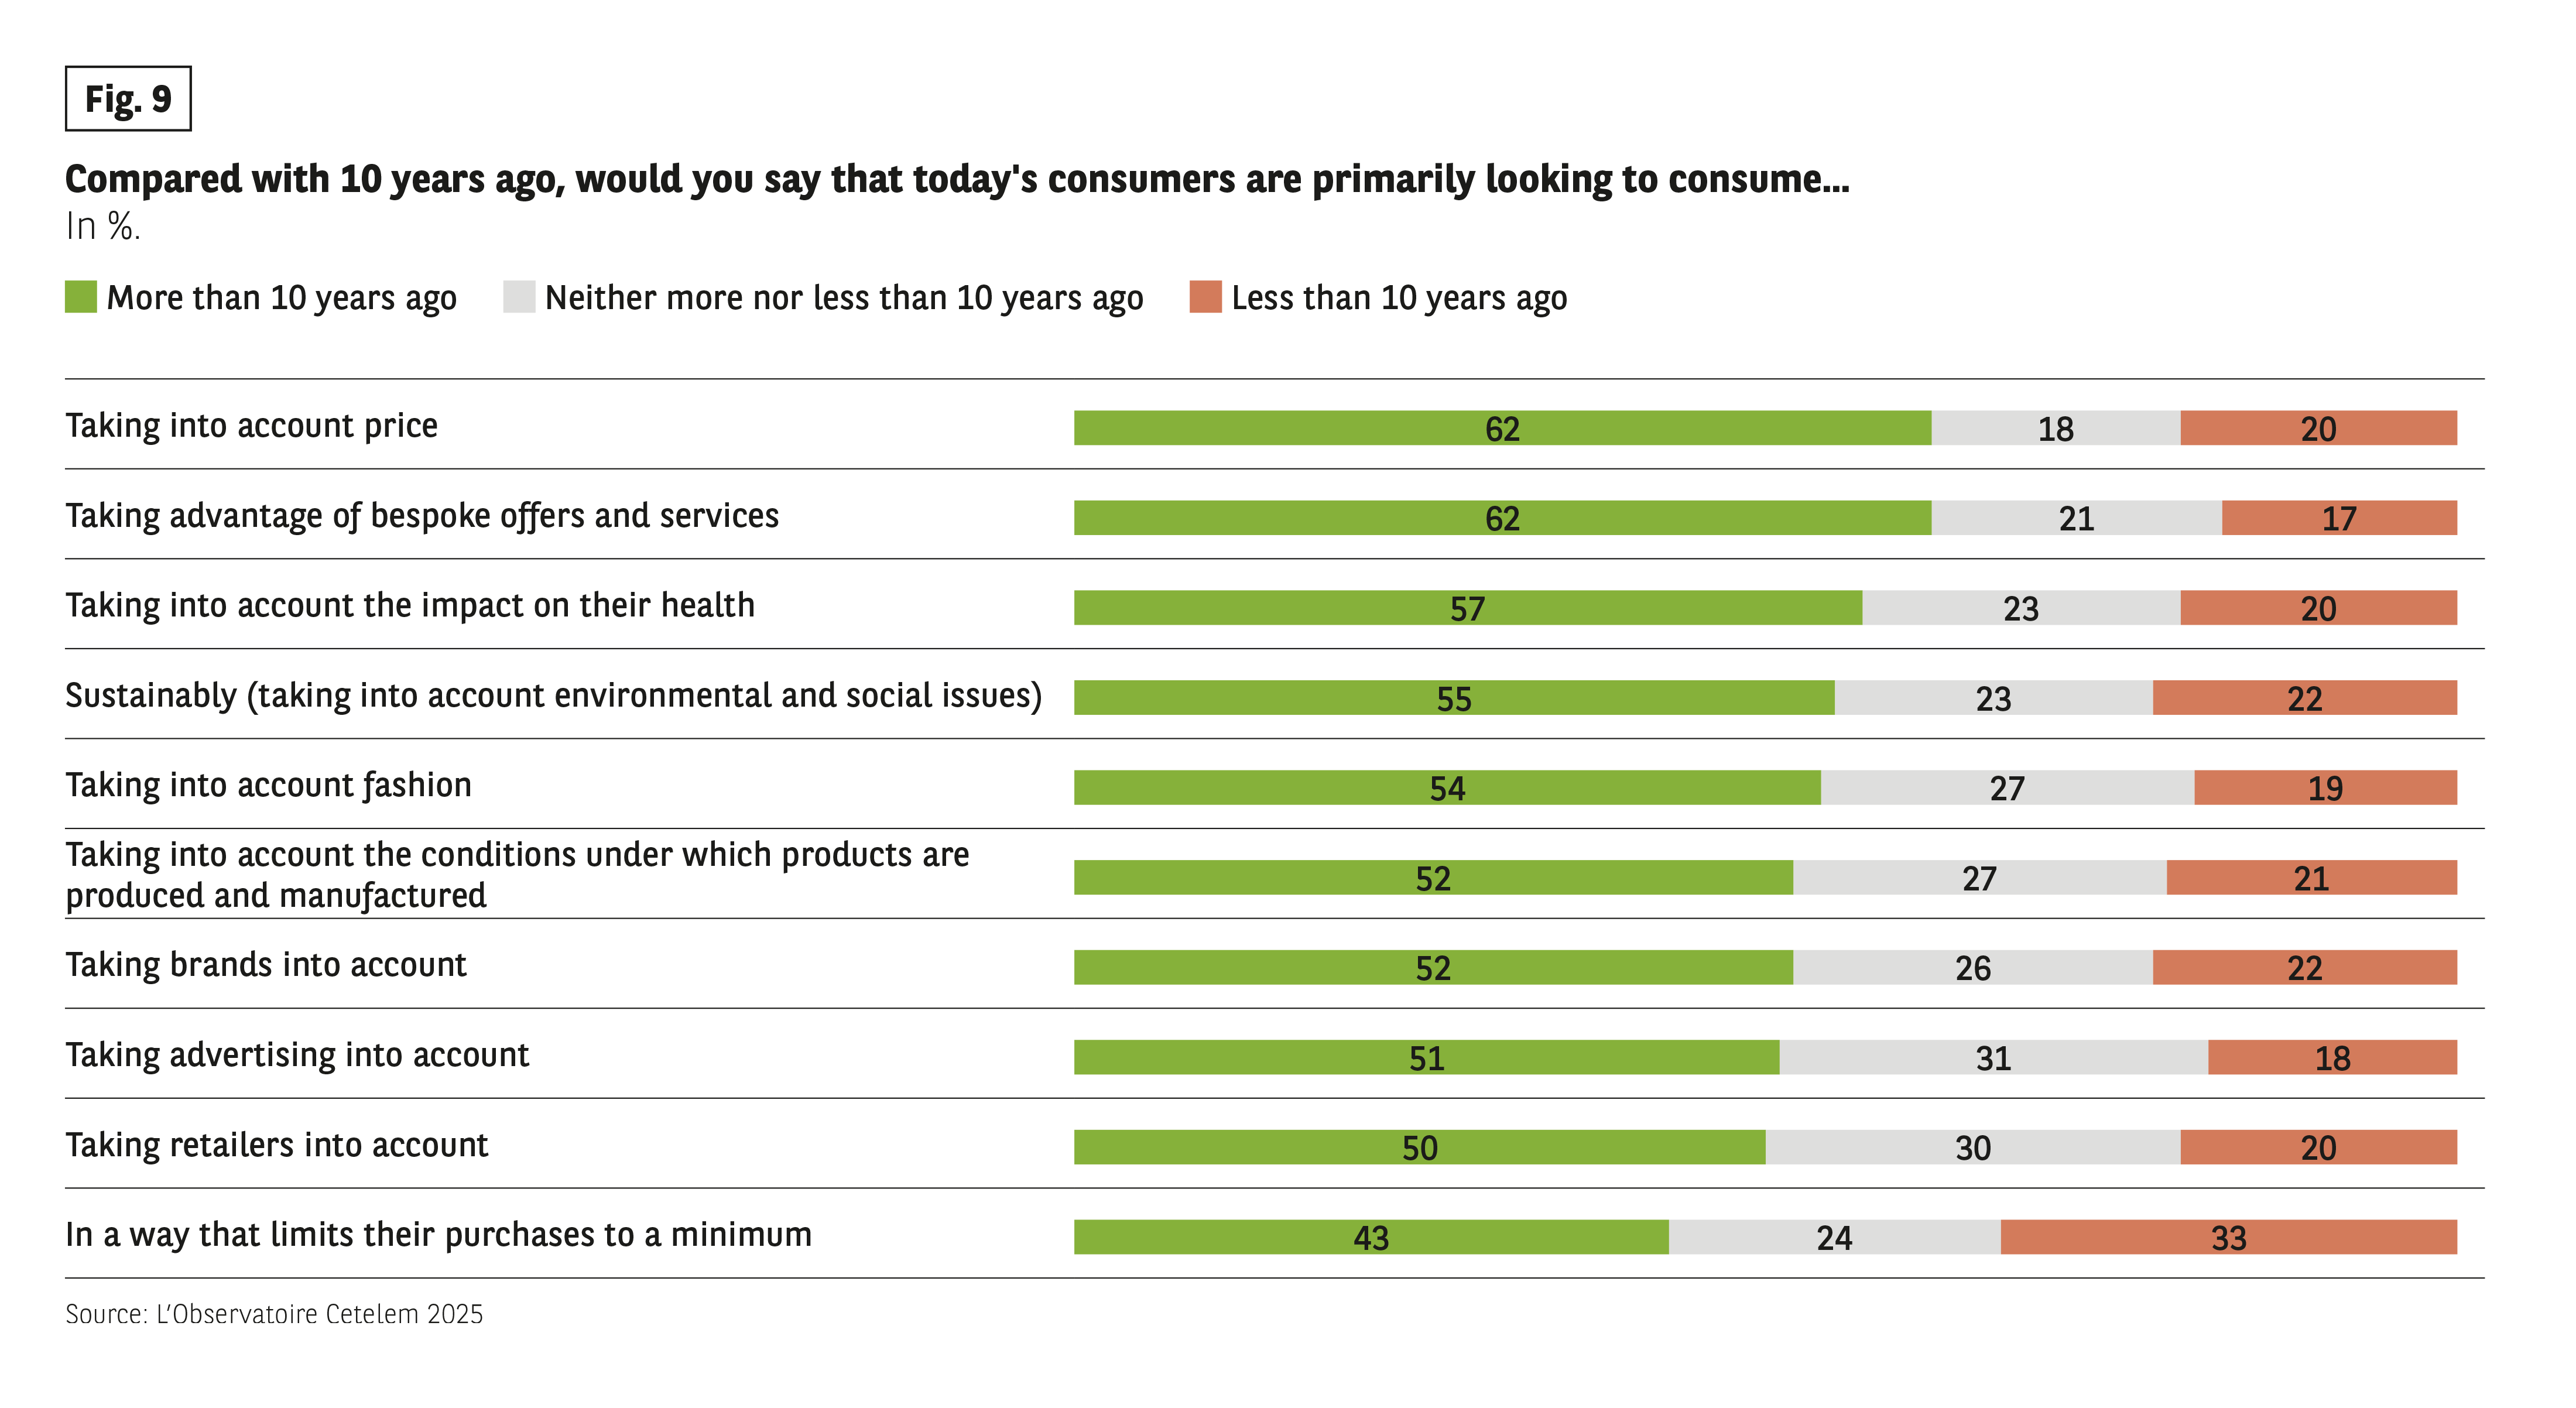 Context:
Question: “Today, compared to 10 years ago, would you say that consumers are primarily looking to consume…?”
Categories:
• More than 10 years ago (green)
• No more and no less (grey)
• Less than 10 years ago (orange)
Data (share “more than 10 years ago”):
• Taking into account prices: 62%
• Personalized offers/services: 62%
• Health effects: 57%
• Durability: 55%
• Modes: 54%
• Production conditions: 52%
• Brands: 52%
• Ads: 51%
• Brands: 50%
• Limit their purchases: 43%
The percentages “stable” and “less” are also visible but are not all explained here.
Main course:
Economic and personalization considerations top the list of increased concerns.
Source: The Cetelem 2025 Observatory.
Context:
Question: “Today, compared to 10 years ago, would you say that consumers are primarily looking to consume…?”
Categories:
• More than 10 years ago (green)
• No more and no less (grey)
• Less than 10 years ago (orange)
Data (share “more than 10 years ago”):
• Taking into account prices: 62%
• Personalized offers/services: 62%
• Health effects: 57%
• Durability: 55%
• Modes: 54%
• Production conditions: 52%
• Brands: 52%
• Ads: 51%
• Brands: 50%
• Limit their purchases: 43%
The percentages “stable” and “less” are also visible but are not all explained here.
Main course:
Economic and personalization considerations top the list of increased concerns.
Source: The Cetelem 2025 Observatory.