Unashamed enjoyment

THINKING OF ONESELF
Could European consumers be described as two-faced or lacking in self-awareness? Are they flagrantly contradicting themselves? One might be inclined to think so, considering the terms in which they describe their overall perception of consumption today, with “wastage” topping the list, and those they associate with consumption in general.
Judging from the two most popular terms, “enjoyment” and “wellbeing”, 7 out of 10 people see consumption as a positive that makes them “feel good”, regardless of their income or social status. As we shall see in part three, this positivity seems to coincide with a gradual shift towards non-material purchases, with various services, leisure activities and music/ video streaming platforms having become firmly established by the end of the Covid crisis. When it comes to enjoyment, the British top the ranking, albeit with a relatively conservativescore of 61%, while the Portuguese and French are the least likely to consider any notion of wellbeing (Fig. 10).
Not far behind in the list of terms highlighted by Europeans are economic growth, necessity and employment, underlining their belief that consumption has a more functional purpose. These macro-oriented perspectives balance out the more micro-centric concerns that top the list. One should also note that all the terms relating to the environment can be found mid-way down the ranking.
Fig 10 – Positive perception of words associated with consumption
Download this infographic for your presentations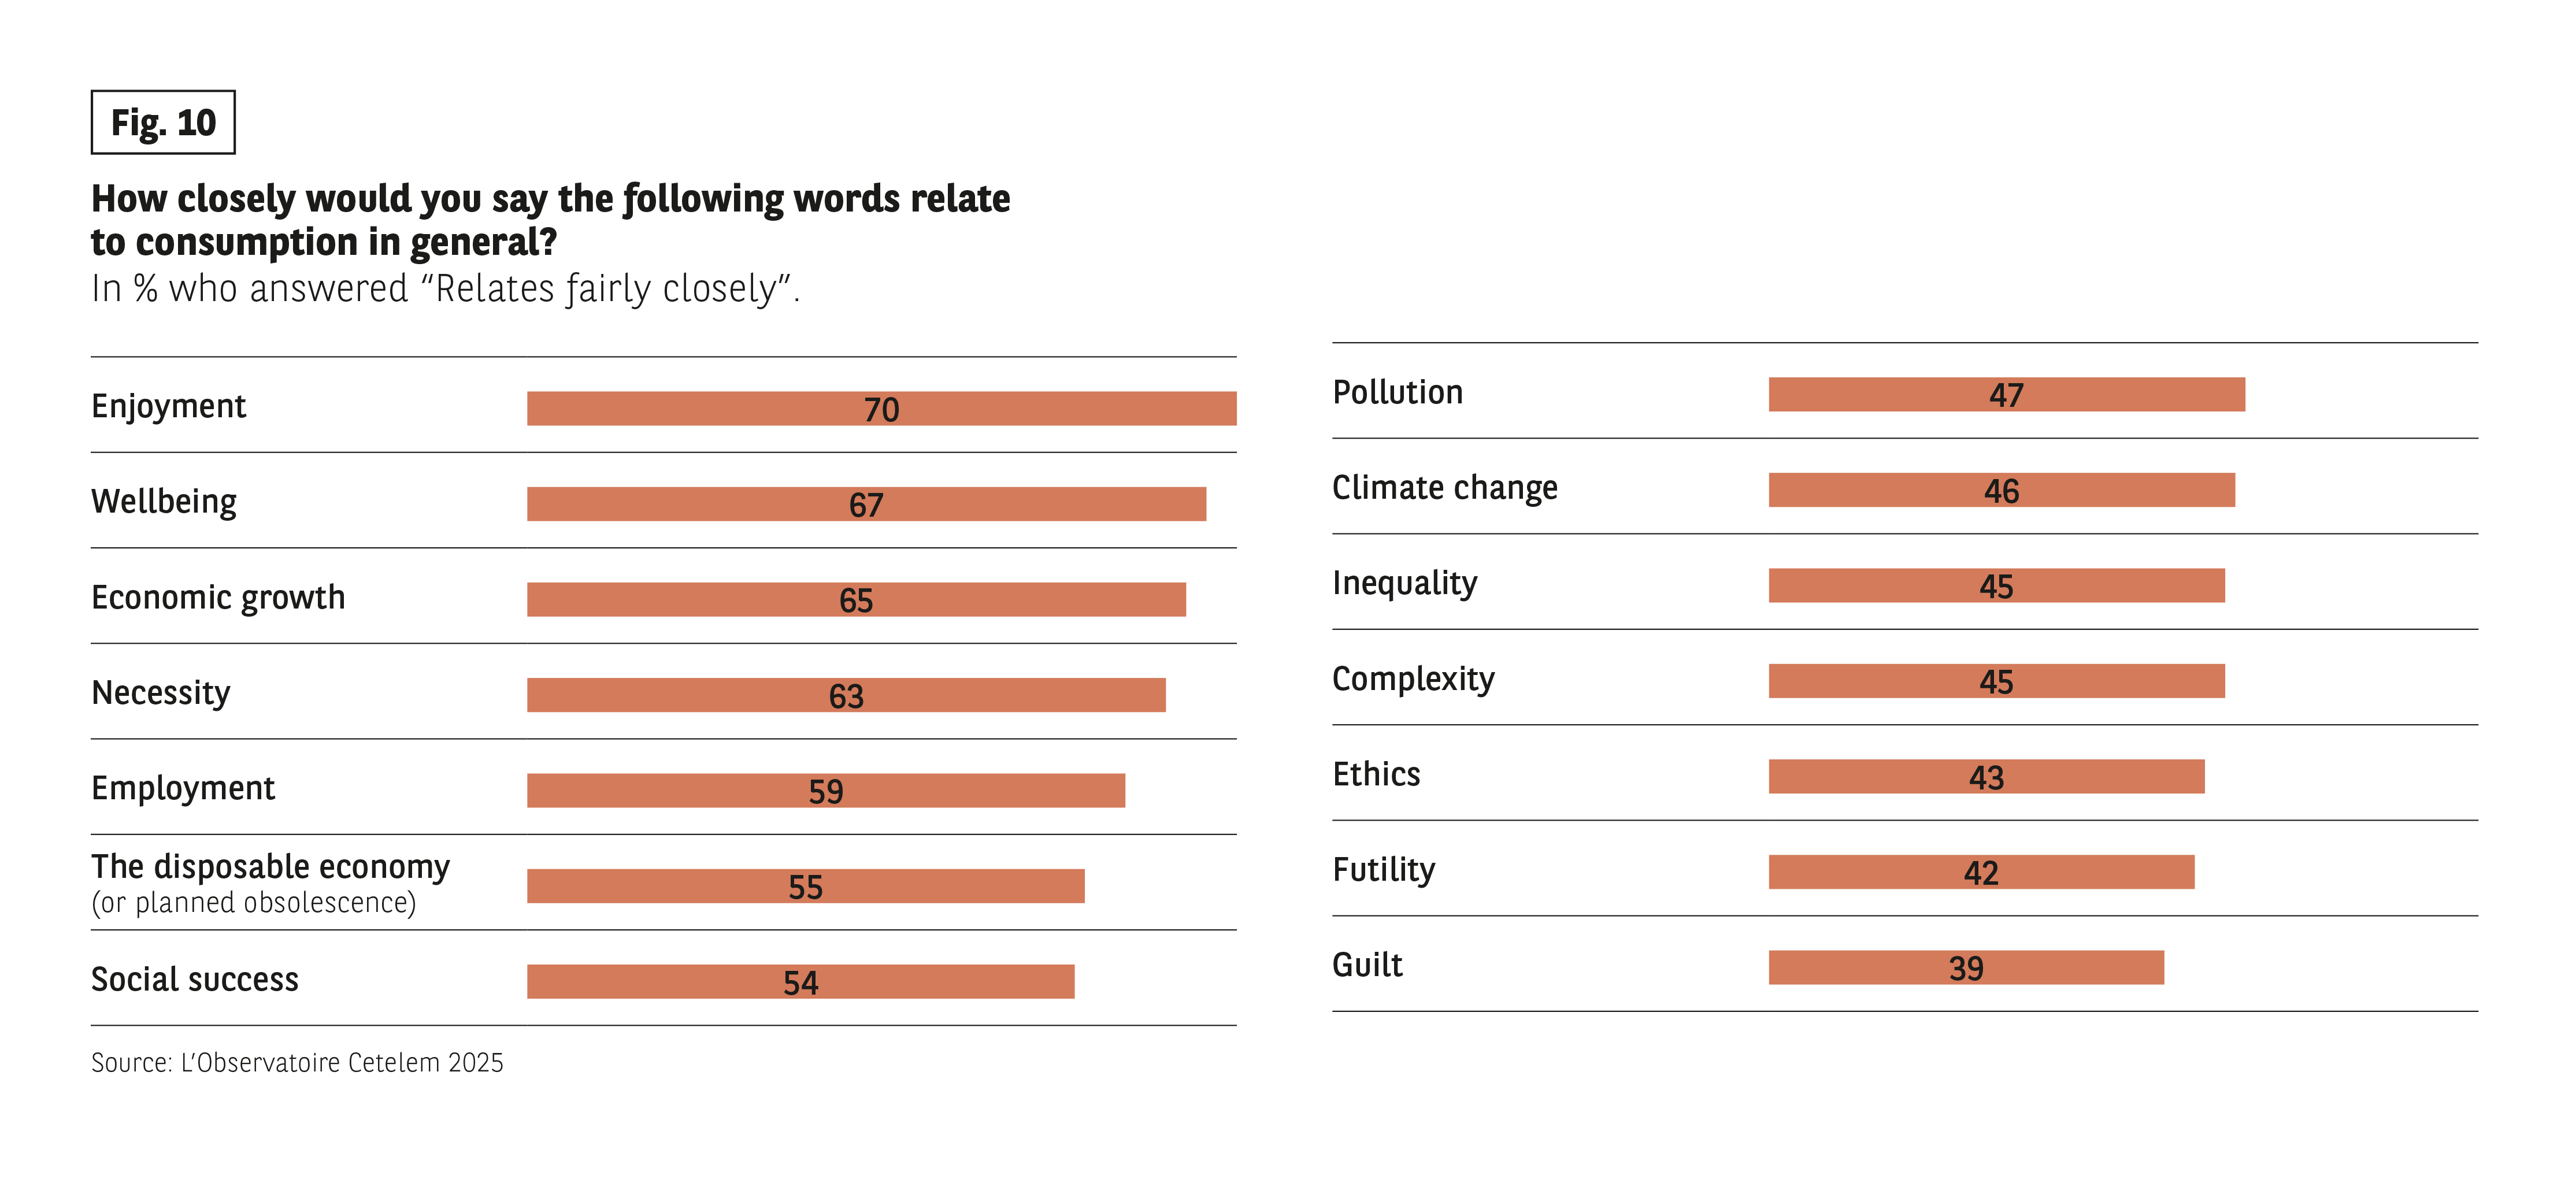 Context:
Question: “Would you say that each of the following words is associated rather well or rather poorly with consumption in general?”
Percentages indicate “pairs pretty well.”
Data:
• Pleasure: 70%
• Living well: 67%
• Economic growth: 65%
• Need: 63%
• Employment: 59%
• Savings from disposables: 55%
• Social success: 54%
• Pollution: 47%
• Climate change: 46%
• Inequality: 45%
• Complexity: 45%
• Ethics: 43%
• Futility: 42%
• Guilt: 39%
Main course:
The associations of “pleasure”, “good living” and “economic growth” are the most positive, while “guilt” is the least positive.
Source: The Cetelem 2025 Observatory.
Context:
Question: “Would you say that each of the following words is associated rather well or rather poorly with consumption in general?”
Percentages indicate “pairs pretty well.”
Data:
• Pleasure: 70%
• Living well: 67%
• Economic growth: 65%
• Need: 63%
• Employment: 59%
• Savings from disposables: 55%
• Social success: 54%
• Pollution: 47%
• Climate change: 46%
• Inequality: 45%
• Complexity: 45%
• Ethics: 43%
• Futility: 42%
• Guilt: 39%
Main course:
The associations of “pleasure”, “good living” and “economic growth” are the most positive, while “guilt” is the least positive.
Source: The Cetelem 2025 Observatory.
ENJOYABLY PERSONAL REASONS
If we delve deeper into what really motivates Europeans when they make a purchase, we discover that hedonistic thinking is still the leading driver. The desire to treat oneself and enjoy greater comfort occupy the top two spots, having been cited by more than 8 out of 10 Europeans. The appeal of ownership and maintaining one’s quality of life score almost as highly, with the former topping the ranking in Romania, the UK and Italy, and the latter in Poland. Self-actualisation is another objective pursued through consumerism, but to a somewhat lesser degree (Fig. 11).
Fig 11 – What consumers are looking to achieve with their purchases
Download this infographic for your presentations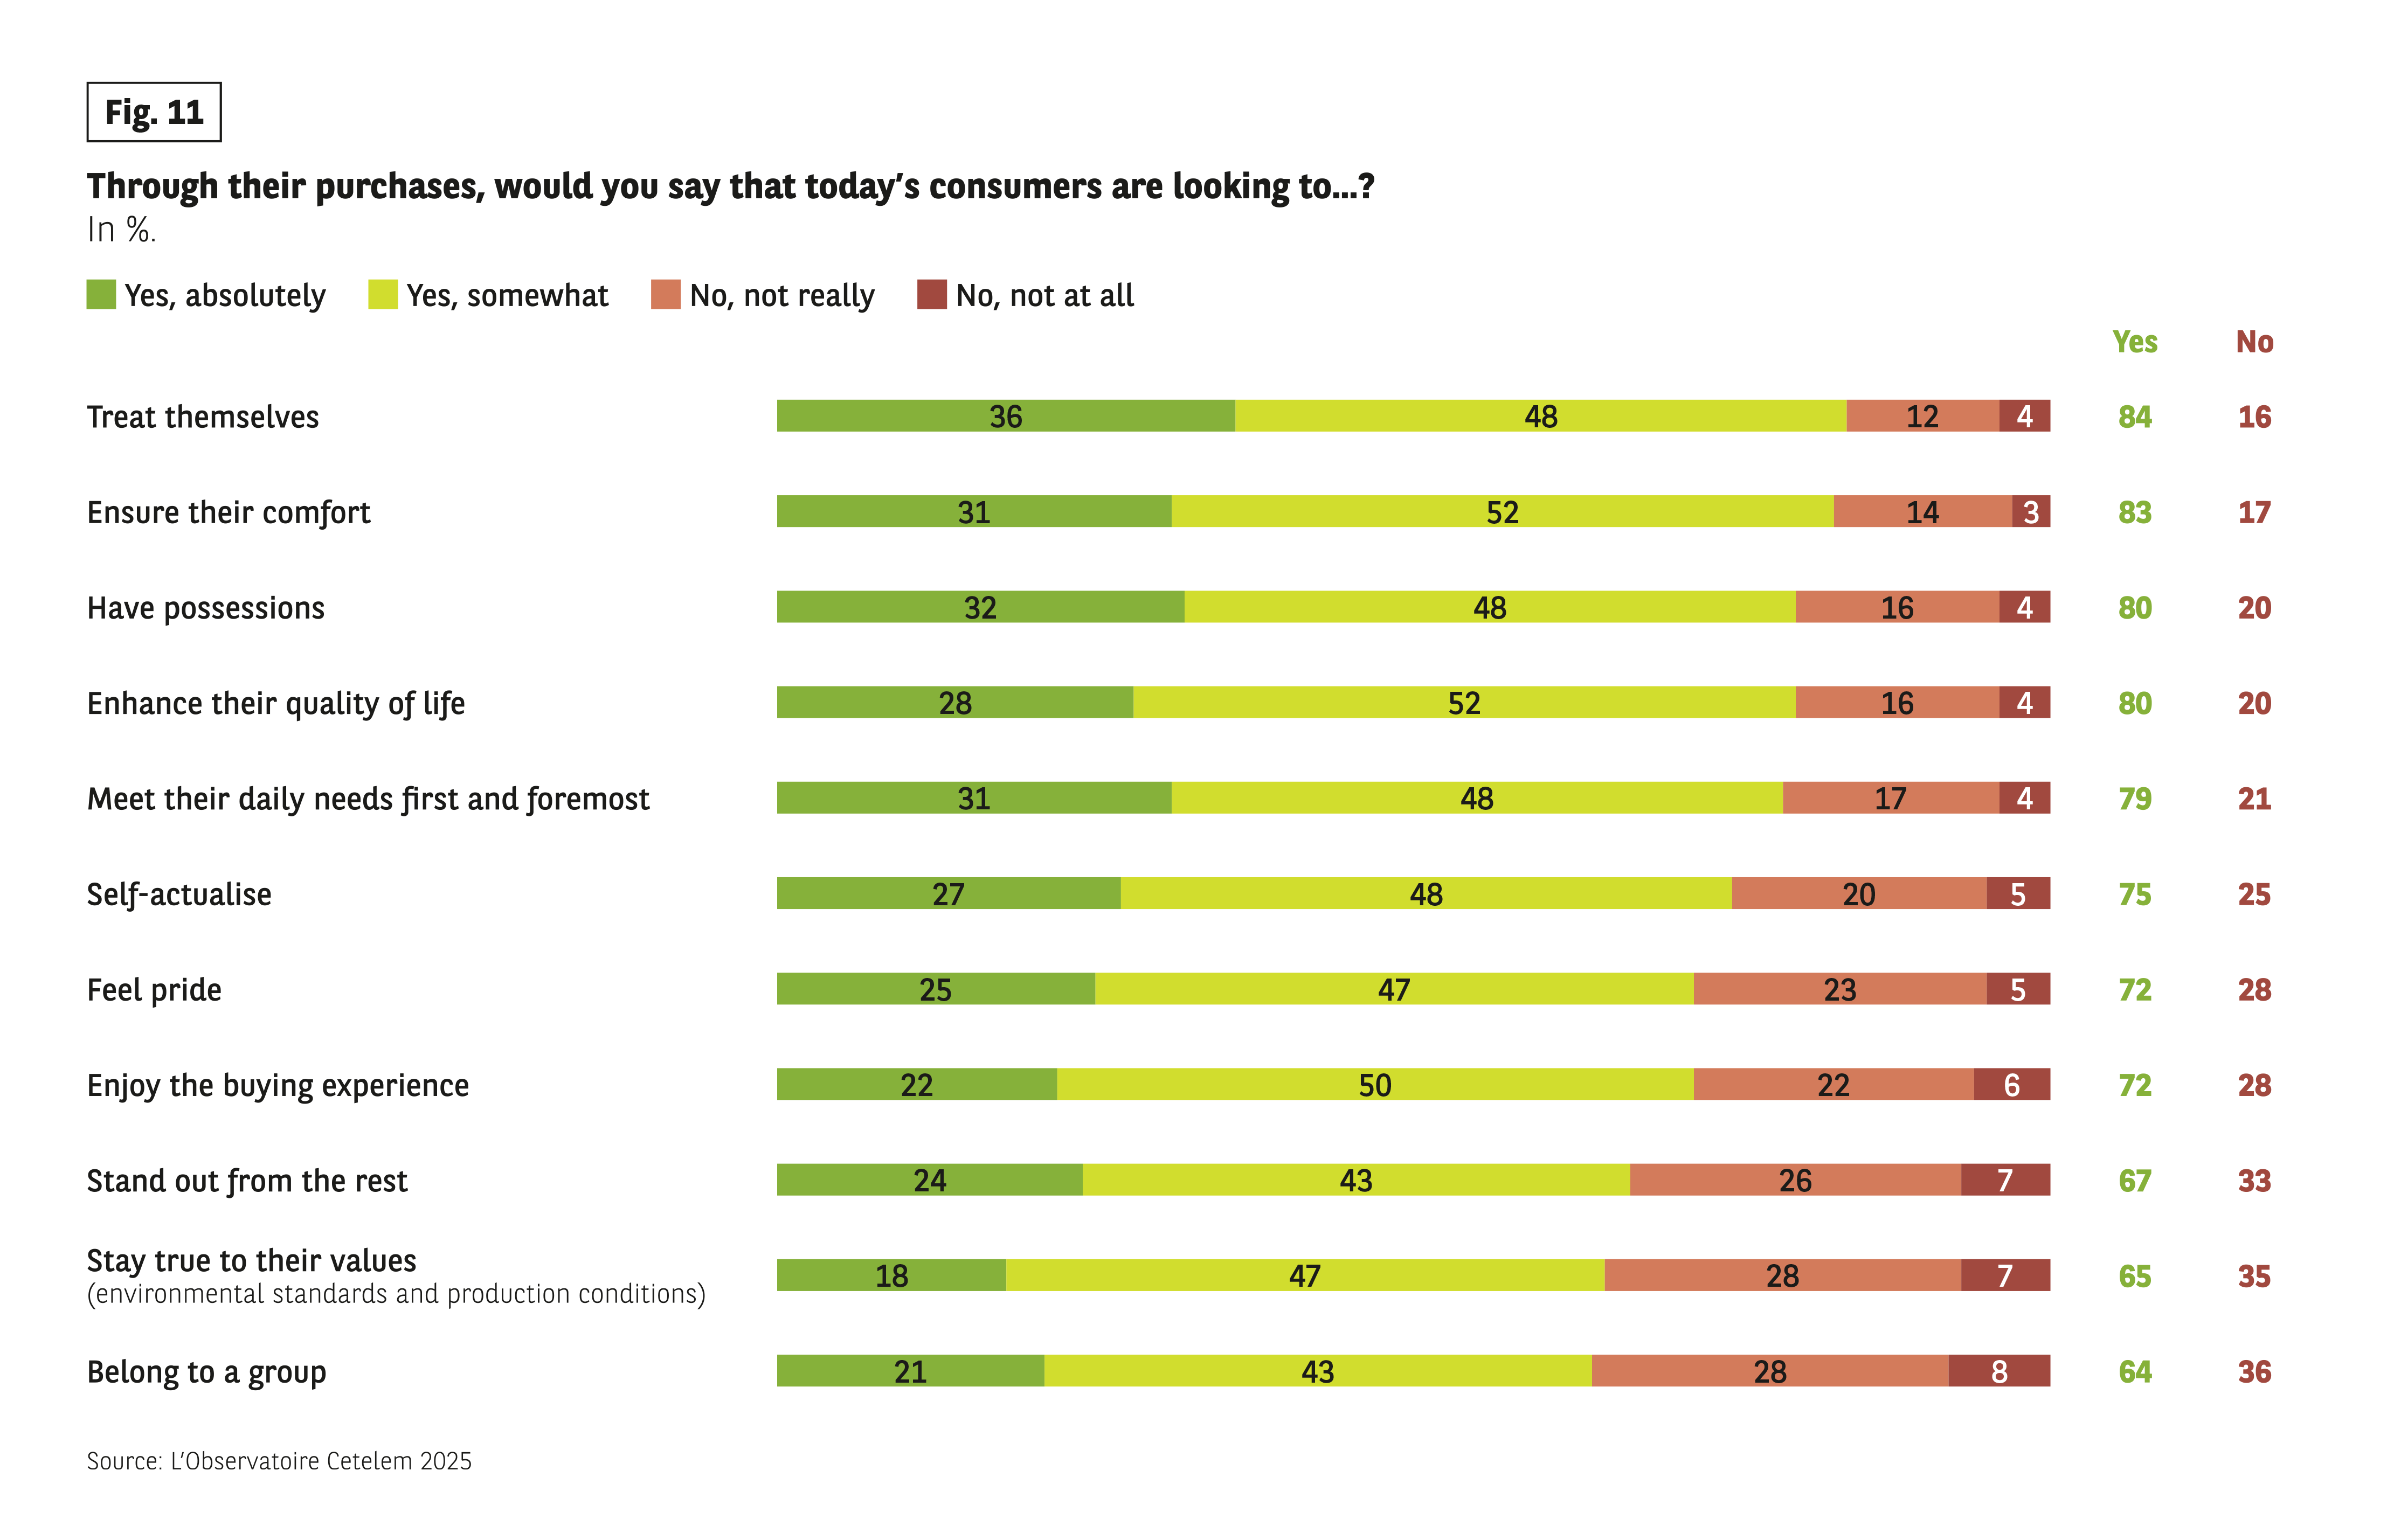 Context:
Question: “Would you say that consumers today are looking for a way to make purchases of…?”
Data (Yes Definitely / Yes Somewhat / No Rather Not / No Not at All → Total Yes / Total No):
• Treat yourself: 36 / 48 / 12 / 4 → 84 / 16
• Keeping them comfortable: 31 / 52 / 14 / 3 → 83 / 17
• Owning things: 32 / 48 / 16 / 4 → 80 / 20
• Control their quality of life: 28 / 52 / 16 / 4 → 80 / 20
• Meet daily needs: 31 / 48 / 17 / 4 → 79 / 21
• Value: 27 / 48 / 20 / 5 → 75 / 25
• Feel proud: 25 / 47 / 23 / 5 → 72 / 28
• Live an experience: 22 / 50 / 22 / 6 → 72 / 28
• Stand out: 24 / 43 / 26 / 7 → 67 / 33
• Be in tune with their values: 18 / 47 / 28 / 7 → 65 / 35
• Belong to a group: 21 / 43 / 28 / 8 → 64 / 36
Source: The Cetelem 2025 Observatory.
Context:
Question: “Would you say that consumers today are looking for a way to make purchases of…?”
Data (Yes Definitely / Yes Somewhat / No Rather Not / No Not at All → Total Yes / Total No):
• Treat yourself: 36 / 48 / 12 / 4 → 84 / 16
• Keeping them comfortable: 31 / 52 / 14 / 3 → 83 / 17
• Owning things: 32 / 48 / 16 / 4 → 80 / 20
• Control their quality of life: 28 / 52 / 16 / 4 → 80 / 20
• Meet daily needs: 31 / 48 / 17 / 4 → 79 / 21
• Value: 27 / 48 / 20 / 5 → 75 / 25
• Feel proud: 25 / 47 / 23 / 5 → 72 / 28
• Live an experience: 22 / 50 / 22 / 6 → 72 / 28
• Stand out: 24 / 43 / 26 / 7 → 67 / 33
• Be in tune with their values: 18 / 47 / 28 / 7 → 65 / 35
• Belong to a group: 21 / 43 / 28 / 8 → 64 / 36
Source: The Cetelem 2025 Observatory.
CONSUMING AT ONE’S LEISURE
How does this desire to treat oneself translate? First and foremost, it means escaping from the day to day. A third of Europeans choose primarily to travel or to treat themselves to a getaway. However, the responses provided paint a fairly mixed picture, with the Swedes and Italians (44% and 42%) being very keen on the idea, while the Poles and Romanians (24% and 25%) are happier to stay at home.
While clothing and food occupy the next two positions, reflecting the primacy of “necessary” consumption, the desire to go out, buy a smartphone or purchase an entertainment product reflects a fondness for “fun” purchases (Fig. 12).
Fig 12 – Products that provide the most pleasure when buying
Download this infographic for your presentations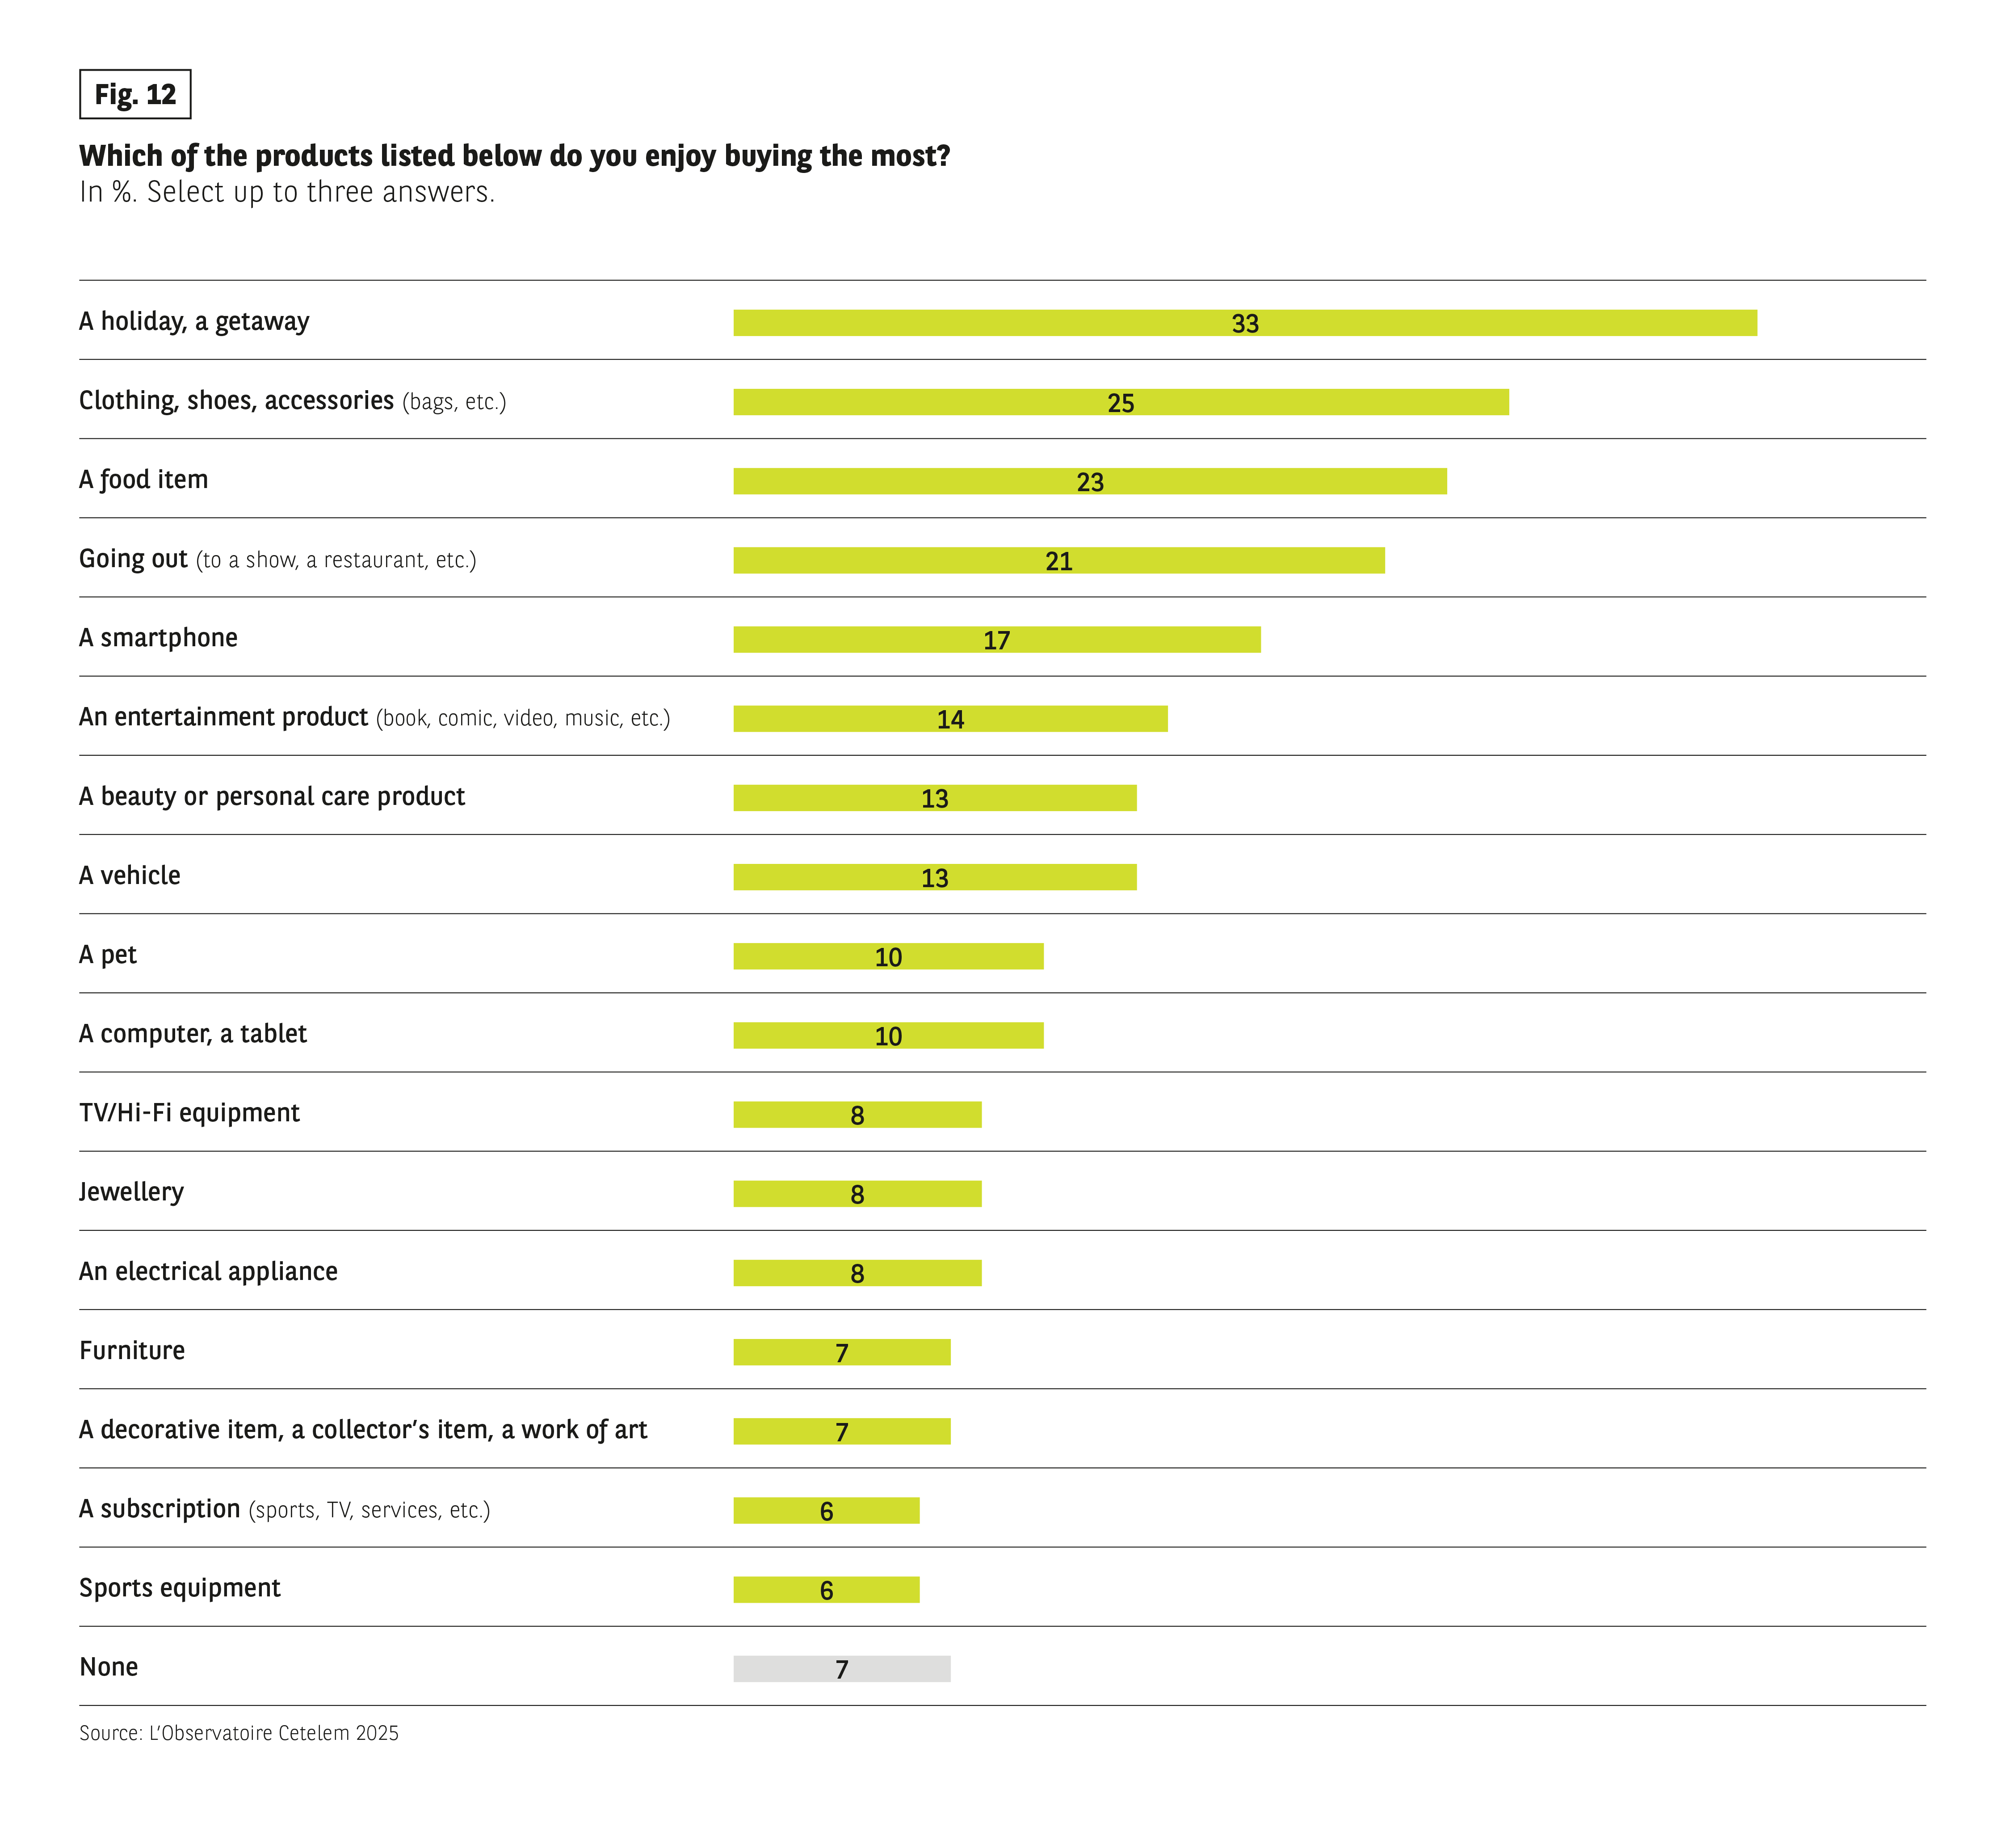 Question: “Which of the following products do you enjoy the most when buying?”
Three possible answers.
Data:
• Travel/getaway: 33%
• Clothing / shoes / accessory: 25%
• Food product: 23%
• Output: 21%
• Smartphone: 17%
• Entertainment (books, comics, video, etc.): 14%
• Beauty / care: 13%
• Vehicle: 13%
• Pet: 10%
• Computer/tablet: 10%
• TV / hi-fi equipment: 8%
• Jewelry: 8%
• Household appliances: 8%
• Furnished : 7%
• Decorative object / collection / art: 7%
• Subscription: 6%
• Sports equipment: 6%
• None: 7%
Source: The Cetelem 2025 Observatory.
Question: “Which of the following products do you enjoy the most when buying?”
Three possible answers.
Data:
• Travel/getaway: 33%
• Clothing / shoes / accessory: 25%
• Food product: 23%
• Output: 21%
• Smartphone: 17%
• Entertainment (books, comics, video, etc.): 14%
• Beauty / care: 13%
• Vehicle: 13%
• Pet: 10%
• Computer/tablet: 10%
• TV / hi-fi equipment: 8%
• Jewelry: 8%
• Household appliances: 8%
• Furnished : 7%
• Decorative object / collection / art: 7%
• Subscription: 6%
• Sports equipment: 6%
• None: 7%
Source: The Cetelem 2025 Observatory.
Fig 13 – Evolution of passenger air transport by country since 2014
Download this infographic for your presentations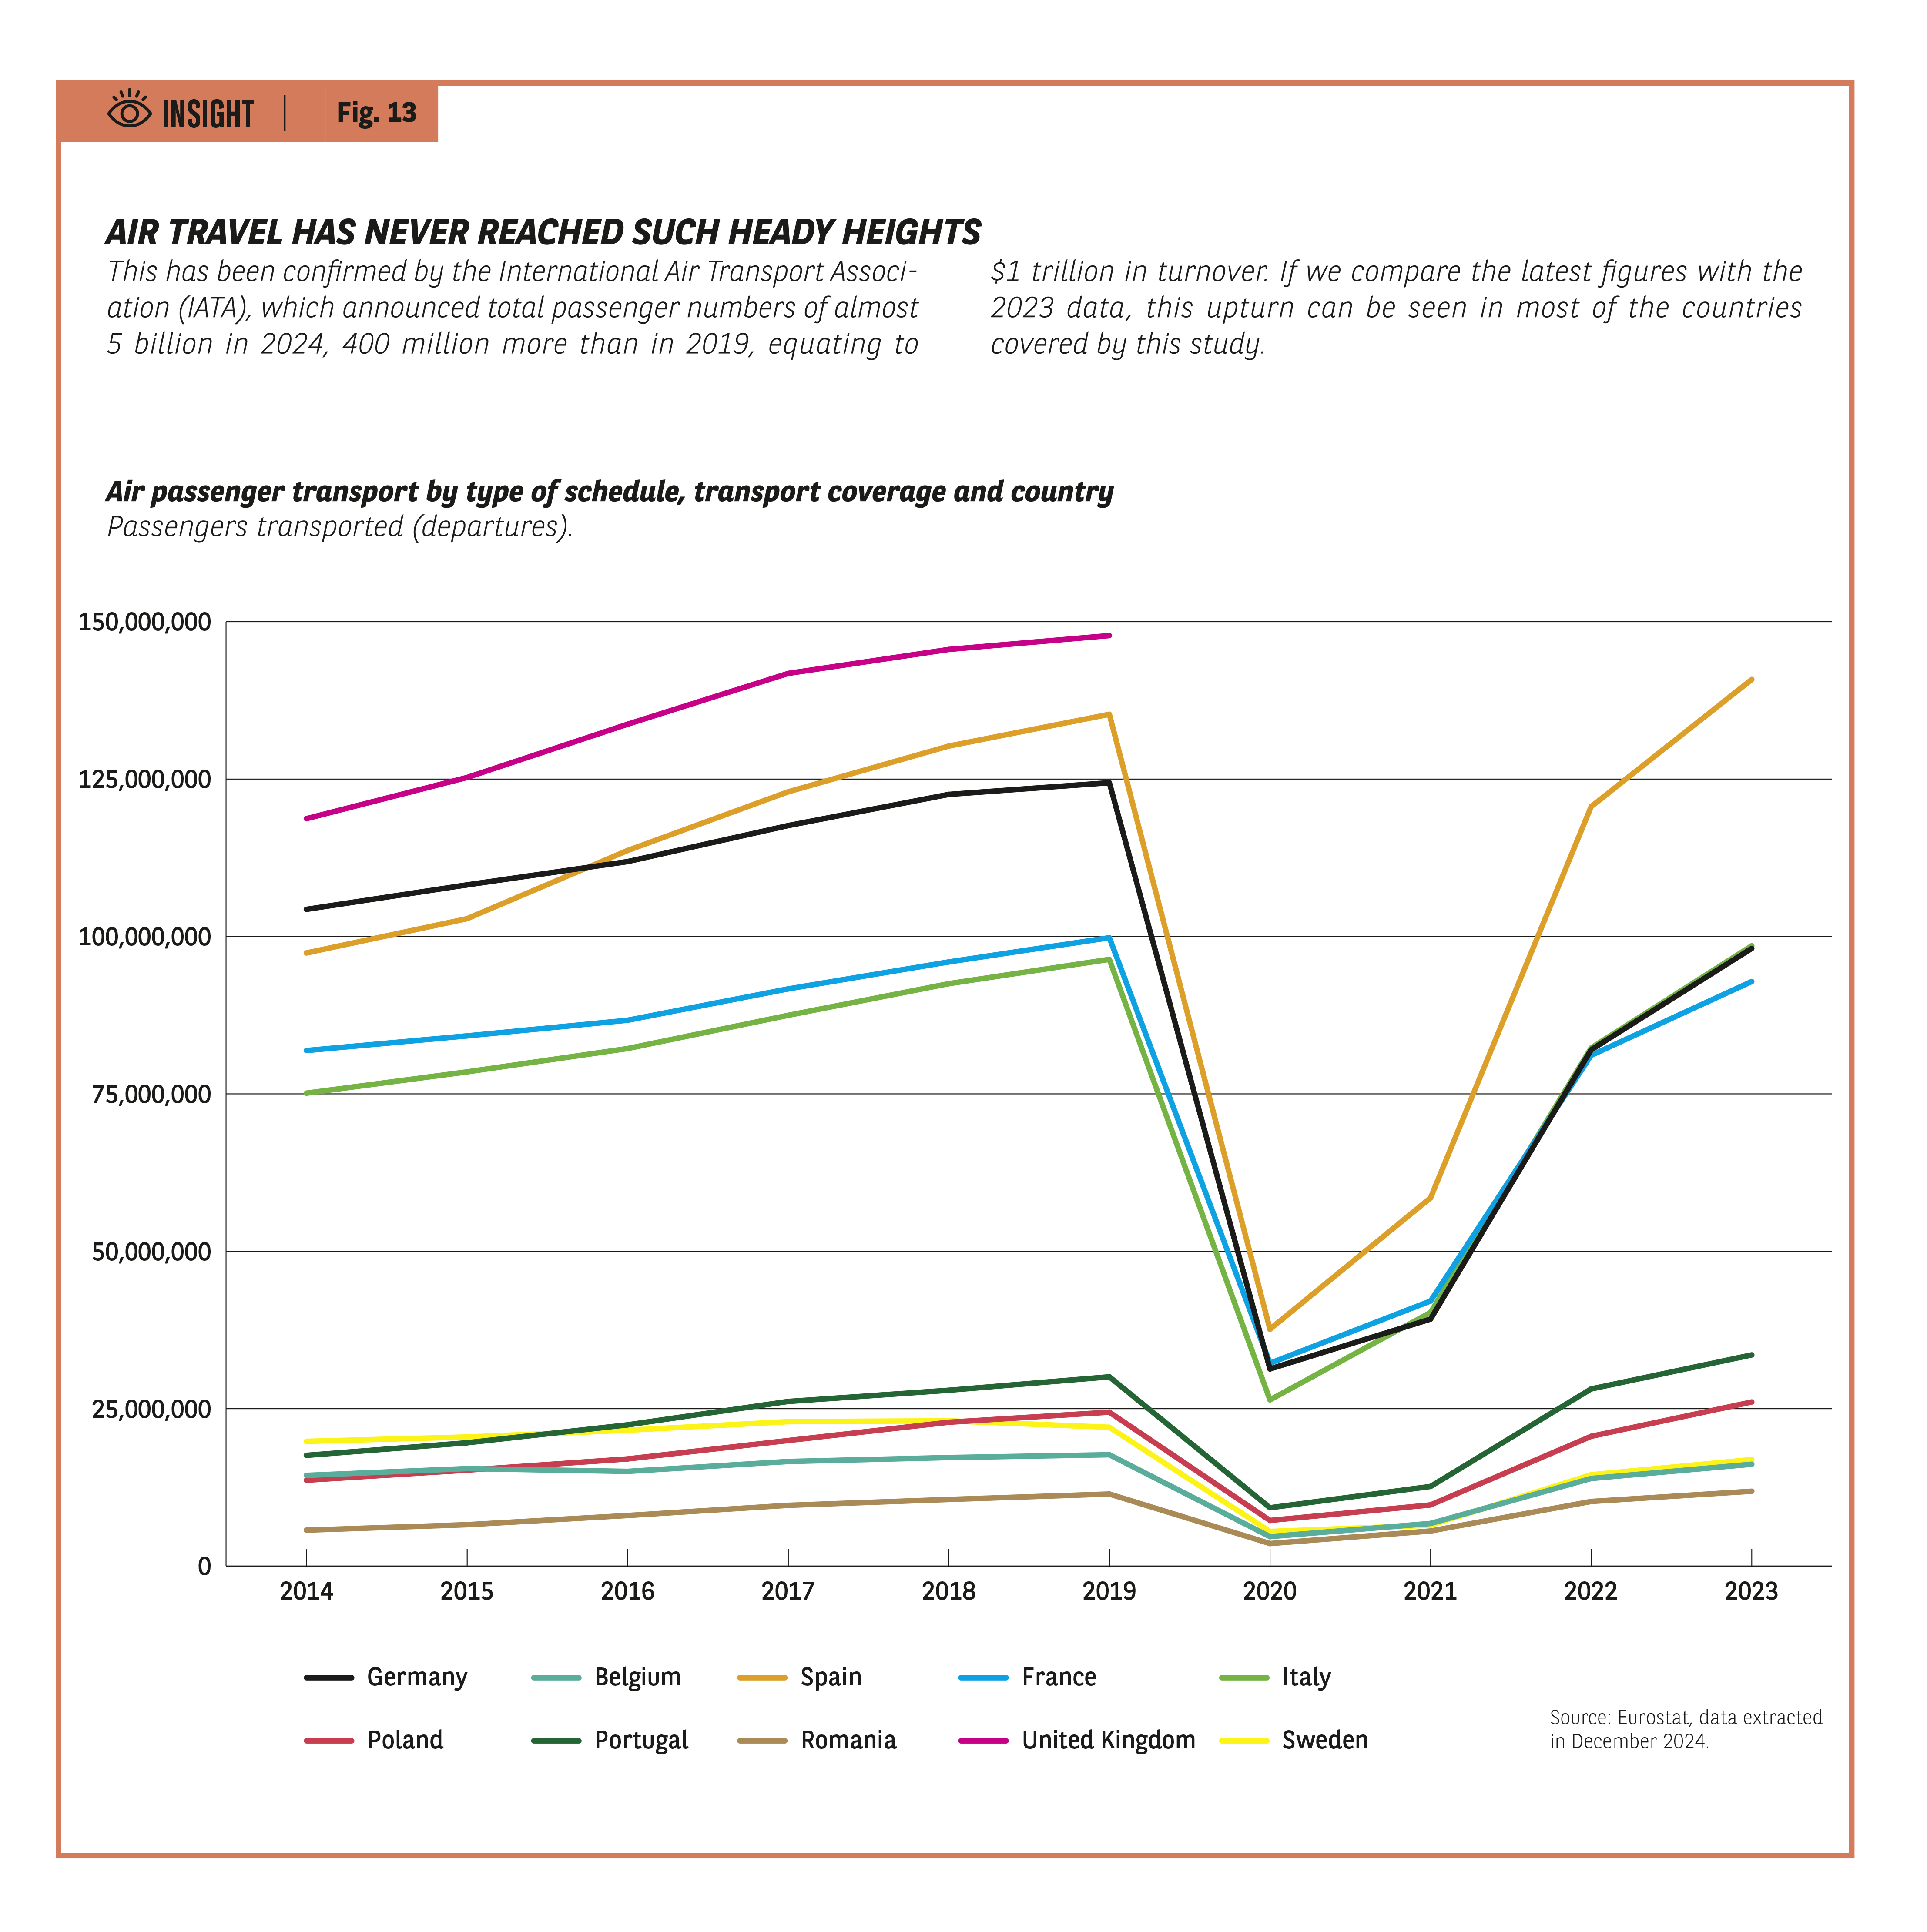 Line chart representing the annual volume of passengers carried (departures), 2014–2023.
Trends:
• Gradual increase until 2019.
• Very marked drop in 2020.
• Strong recovery 2021–2023.
• Spain and the United Kingdom are among the highest.
• Poland, Portugal, Romania and Sweden have the lowest values.
Source: Eurostat, extraction December 2024.
Line chart representing the annual volume of passengers carried (departures), 2014–2023.
Trends:
• Gradual increase until 2019.
• Very marked drop in 2020.
• Strong recovery 2021–2023.
• Spain and the United Kingdom are among the highest.
• Poland, Portugal, Romania and Sweden have the lowest values.
Source: Eurostat, extraction December 2024.
Fig 14 – Hotel nights by country since 2014
Download this infographic for your presentations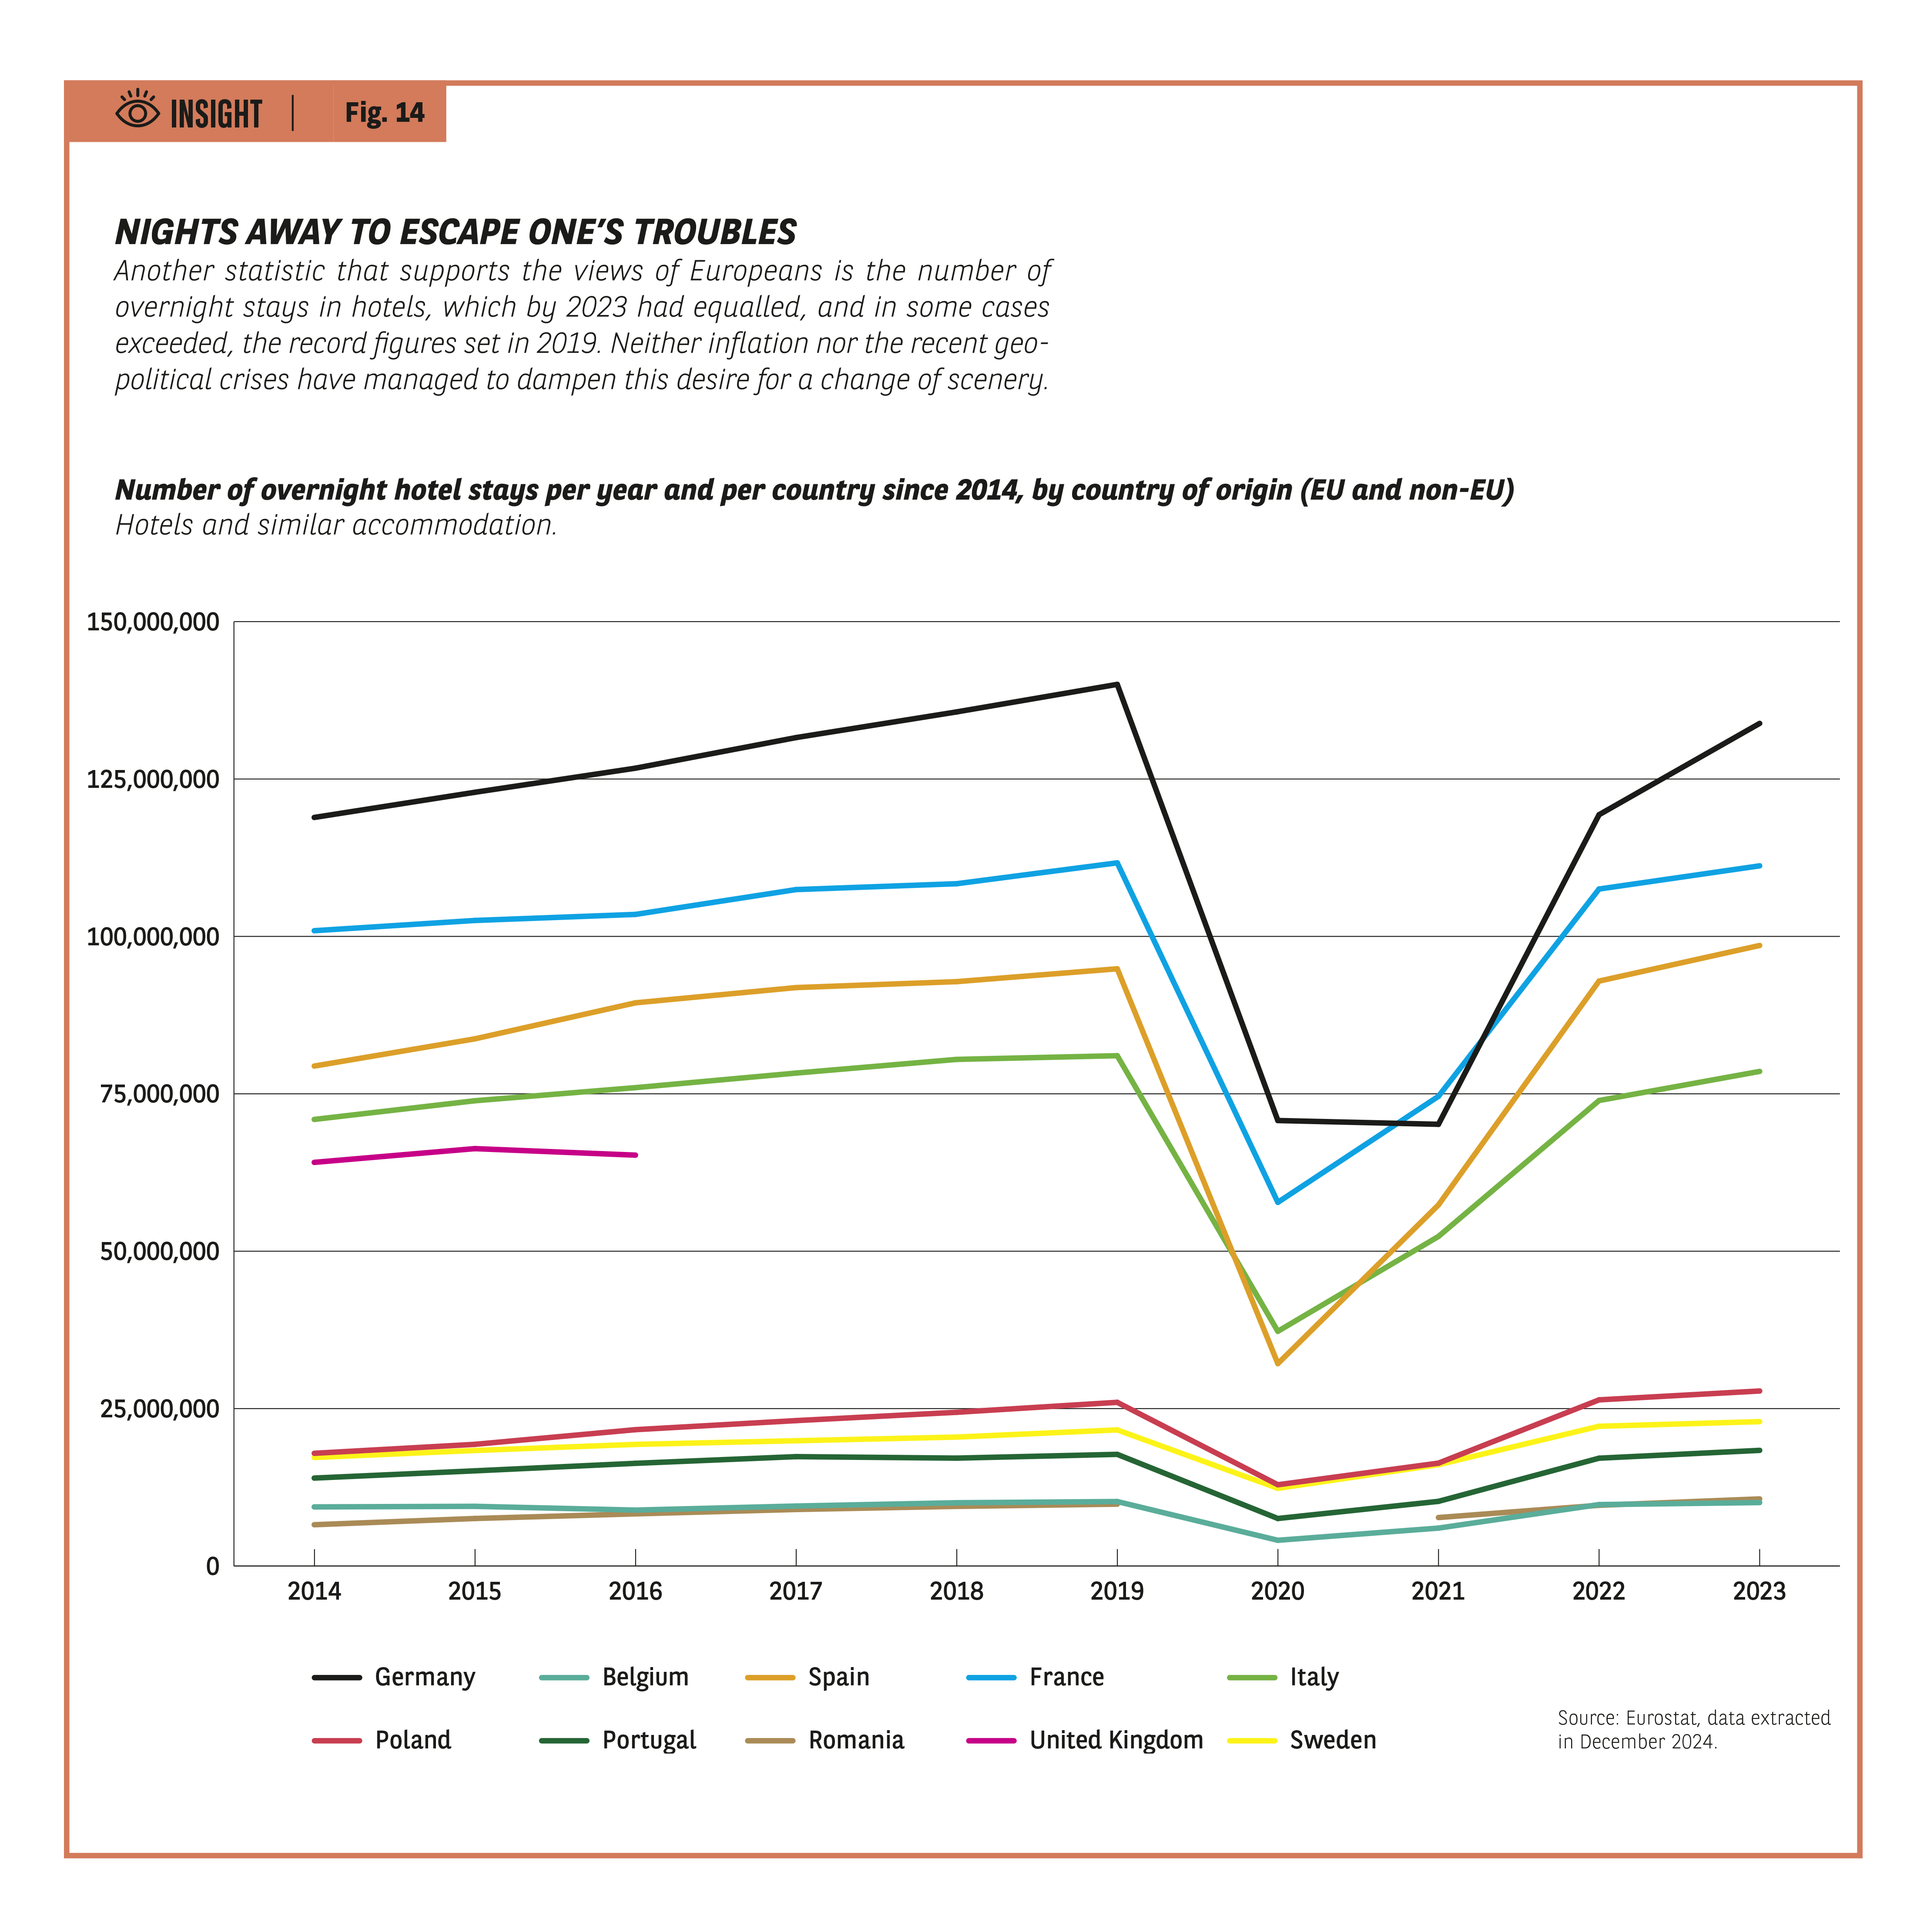 Line graph showing the number of nights spent in hotels and similar accommodation, by country.
Trends:
• Increase until 2019.
• Significant drop in 2020.
• Rapid rebound 2021–2023.
• Germany and France have the highest volumes, followed by Spain and Italy.
Source: Eurostat, extraction December 2024.
Line graph showing the number of nights spent in hotels and similar accommodation, by country.
Trends:
• Increase until 2019.
• Significant drop in 2020.
• Rapid rebound 2021–2023.
• Germany and France have the highest volumes, followed by Spain and Italy.
Source: Eurostat, extraction December 2024.
KEY DATA
- 7 out of 10 Europeans believe that consumption has increased over the last years
- 4 out of 10 feel that their own consumption has increased
- 8 out of 10 believe they are in control of the key expense items
- 8 out of 10 take pride in managing their budget effectively
- 7 out of 10 associate consumption with enjoyment and wellbeing