Increasingly service-oriented consumption


NON-MATERIAL ITEMS HOLD EVER GREATER APPEAL
The stated desire of Europeans to consume differently is also reflected in the nature of the purchases they make. Indeed, they express a keenness to make more non-material than material purchases (43% vs. 37%).
Whether we are talking about the former or the latter, there are significant variations between the countries. In contrast to the disregard for material items shown by the French (30%) and to a lesser extent the Germans (32%), 1 in 2 Romanians are keen to buy something tangible. When it comes to non-material consumption, the Franco-German pairing are again similarly inclined to curb their spending, while the Spanish, Swedes and Portuguese are ready to splash out (Fig. 26).
Younger respondents are almost twice as likely as their elders to state that they have increased their spending in both of these categories. And one must head to the big cities to see a sharp rise in intangible expenditure, providing confirmation if any were needed that the services available to city dwellers have been a resounding success.
Fig 26 – Consumption of tangible and intangible goods
Download this infographic for your presentations Context
The graph shows the share of respondents who believe they consume more than ten years ago, according to two categories.
Visuals
Vertical bars by country: one for tangible goods, one for intangible goods.
Main data (values “more than 10 years ago”)
Examples:
• Germany: material 32%, intangible 36%.
• Belgium: 36% vs. 40%.
• Spain: 41% vs. 52%.
• France: 30% vs. 37%.
• Italy: 39% vs. 47%.
• Poland: 46% vs. 44%.
• Portugal: 46% vs. 49%.
• Romania: 49% vs. 47%.
• United Kingdom: 35% vs. 43%.
• Sweden: 35% vs. 49%.
• Overall: 37% vs. 43%
Synthetic reading
Intangible consumption is increasing more strongly than material consumption in the majority of countries.
Context
The graph shows the share of respondents who believe they consume more than ten years ago, according to two categories.
Visuals
Vertical bars by country: one for tangible goods, one for intangible goods.
Main data (values “more than 10 years ago”)
Examples:
• Germany: material 32%, intangible 36%.
• Belgium: 36% vs. 40%.
• Spain: 41% vs. 52%.
• France: 30% vs. 37%.
• Italy: 39% vs. 47%.
• Poland: 46% vs. 44%.
• Portugal: 46% vs. 49%.
• Romania: 49% vs. 47%.
• United Kingdom: 35% vs. 43%.
• Sweden: 35% vs. 49%.
• Overall: 37% vs. 43%
Synthetic reading
Intangible consumption is increasing more strongly than material consumption in the majority of countries.
SPENDING ON NON-MATERIAL ITEMS HAS RISEN SIGNIFICANTLY
This shift on the part of Europeans towards more intangible consumption is reflected in the results of the various business sectors concerned. This can be traced back to recent technological advances in information technology, not least the launch of the iPhone by Steve Jobs on 9 January 2007 and the creation of the Internet a few years earlier.
While the Covid crisis was a high point for many of the services on offer, their dominance of the consumer landscape has continued over the last few years, despite inflation. Music and video streaming platforms, home delivery services and Airbnb-style rentals are almost universally experiencing growth, in all the countries covered by the Observatoire. Even air travel, a sector that is probably singled out more than any other for the harm it does to the environment, is returning to pre-Covid levels, setting new records in the process.
To give an example, intentions to purchase a subscription to a video streaming platform over the next 12 months confirm that the trend towards immaterial consumption has a bright future ahead of it. In all countries, with the exception of Portugal and even more so Germany, these intentions have risen sharply. Moreover, since 2019 they have increased markedly in all the countries surveyed, with an average rise of 14 points (Fig. 27).
Fig 27 – Intent to subscribe to a video platform
Download this infographic for your presentations Context
The figure shows the proportion of citizens considering a paid subscription within 12 months.
Visuals
Ten curves, one per country, covering Obs2019 to Obs2025.
General trends
All the curves are progressing over the period, with an average increase of +14 points.
Developments by country (2019-2025 variation)
• Germany: +14 points
• Belgium: +16
• Spain: +14
• France: +13
• Italy: +13
• Poland: +20
• Portugal: +9
• Romania: +12
• United Kingdom: +13
• Sweden: +16
Synthetic reading
The trend is towards a continuous increase in the intention to subscribe, with a marked increase in Poland.
Context
The figure shows the proportion of citizens considering a paid subscription within 12 months.
Visuals
Ten curves, one per country, covering Obs2019 to Obs2025.
General trends
All the curves are progressing over the period, with an average increase of +14 points.
Developments by country (2019-2025 variation)
• Germany: +14 points
• Belgium: +16
• Spain: +14
• France: +13
• Italy: +13
• Poland: +20
• Portugal: +9
• Romania: +12
• United Kingdom: +13
• Sweden: +16
Synthetic reading
The trend is towards a continuous increase in the intention to subscribe, with a marked increase in Poland.
Fig 28 – Purchases of films and series by country 2020-2023
Download this infographic for your presentations Context
Graph showing the percentage of citizens who have bought at least one film or series online in the last three months.
Visuals
Curves for Germany, Belgium, Spain, France, Italy, Poland, Portugal, Romania, Sweden.
Key trends
• Sweden: peak around 45% in 2021, then sharp decline.
• Germany: around 26% in 2020, then down and then up again in 2023.
• Other countries: moderate increases.
Context
Graph showing the percentage of citizens who have bought at least one film or series online in the last three months.
Visuals
Curves for Germany, Belgium, Spain, France, Italy, Poland, Portugal, Romania, Sweden.
Key trends
• Sweden: peak around 45% in 2021, then sharp decline.
• Germany: around 26% in 2020, then down and then up again in 2023.
• Other countries: moderate increases.
Fig 29 – Home Restaurant Delivery 2020-2024
Download this infographic for your presentations Context
Percentage of citizens who have made an online purchase of meals in the last three months.
Visuals
Curves from 2020 to 2024.
Trends
• General increase in all countries.
• Spain and Belgium have the highest levels.
• Steady growth in France, Portugal, Romania and Poland.
Context
Percentage of citizens who have made an online purchase of meals in the last three months.
Visuals
Curves from 2020 to 2024.
Trends
• General increase in all countries.
• Spain and Belgium have the highest levels.
• Steady growth in France, Portugal, Romania and Poland.
Fig 30 – Music purchases by country 2020-2023
Download this infographic for your presentations Context
The figure shows the evolution of the percentage of citizens who have made at least one online music purchase in the last three months, for ten European countries, between 2020 and 2023.
Visuals
Line chart with ten curves corresponding to: Germany, Belgium, Spain, France, Italy, Poland, Portugal, Romania, Sweden.
Vertical axis: Percentages (0 to 50%).
Horizontal axis: years 2020, 2021, 2022, 2023.
No decorative elements useful to the information.
Context
The figure shows the evolution of the percentage of citizens who have made at least one online music purchase in the last three months, for ten European countries, between 2020 and 2023.
Visuals
Line chart with ten curves corresponding to: Germany, Belgium, Spain, France, Italy, Poland, Portugal, Romania, Sweden.
Vertical axis: Percentages (0 to 50%).
Horizontal axis: years 2020, 2021, 2022, 2023.
No decorative elements useful to the information.
Fig 31 – Accommodation rental 2020-2023
Download this infographic for your presentations Context
The graph shows the share of citizens who have rented accommodation online at least once in the last three months, from 2020 to 2023, in ten countries.
Visuals
Curves for: Germany, Belgium, Spain, France, Italy, Poland, Portugal, Romania, Sweden.
Country data (consistent visual estimates)
• Germany: ~5% (2020), ~3% (2021), ~4% (2022), ~5% (2023).
• Belgium: ~7% (2020), ~7% (2021), ~9% (2022), ~10% (2023).
• Spain: ~3% (2020), ~5% (2021), ~7% (2022), ~8.2% (2023).
• France: ~2.5% (2020), ~7% (2021), ~11% (2022), ~13% (2023).
• Italy: ~4% (2020), ~2% (2021), ~4.5% (2022), ~6.3% (2023).
• Poland: ~0.6% (2020), ~1% (2021), ~1.8% (2022), ~2% (2023).
• Portugal: ~3% (2020), ~2.5% (2021), ~4.3% (2022), ~5.5% (2023).
• Romania: ~0.4% (2020), ~0.7% (2021), ~2% (2022), ~3.6% (2023).
• Sweden: ~3.5% (2020), ~3% (2021), ~4.2% (2022), ~5% (2023).
Synthetic reading
France, Belgium and Portugal are making strong progress. The lowest levels remain in Poland and Romania.
Context
The graph shows the share of citizens who have rented accommodation online at least once in the last three months, from 2020 to 2023, in ten countries.
Visuals
Curves for: Germany, Belgium, Spain, France, Italy, Poland, Portugal, Romania, Sweden.
Country data (consistent visual estimates)
• Germany: ~5% (2020), ~3% (2021), ~4% (2022), ~5% (2023).
• Belgium: ~7% (2020), ~7% (2021), ~9% (2022), ~10% (2023).
• Spain: ~3% (2020), ~5% (2021), ~7% (2022), ~8.2% (2023).
• France: ~2.5% (2020), ~7% (2021), ~11% (2022), ~13% (2023).
• Italy: ~4% (2020), ~2% (2021), ~4.5% (2022), ~6.3% (2023).
• Poland: ~0.6% (2020), ~1% (2021), ~1.8% (2022), ~2% (2023).
• Portugal: ~3% (2020), ~2.5% (2021), ~4.3% (2022), ~5.5% (2023).
• Romania: ~0.4% (2020), ~0.7% (2021), ~2% (2022), ~3.6% (2023).
• Sweden: ~3.5% (2020), ~3% (2021), ~4.2% (2022), ~5% (2023).
Synthetic reading
France, Belgium and Portugal are making strong progress. The lowest levels remain in Poland and Romania.
Fig 32 – Passenger Air Transportation 2014-2023
Download this infographic for your presentations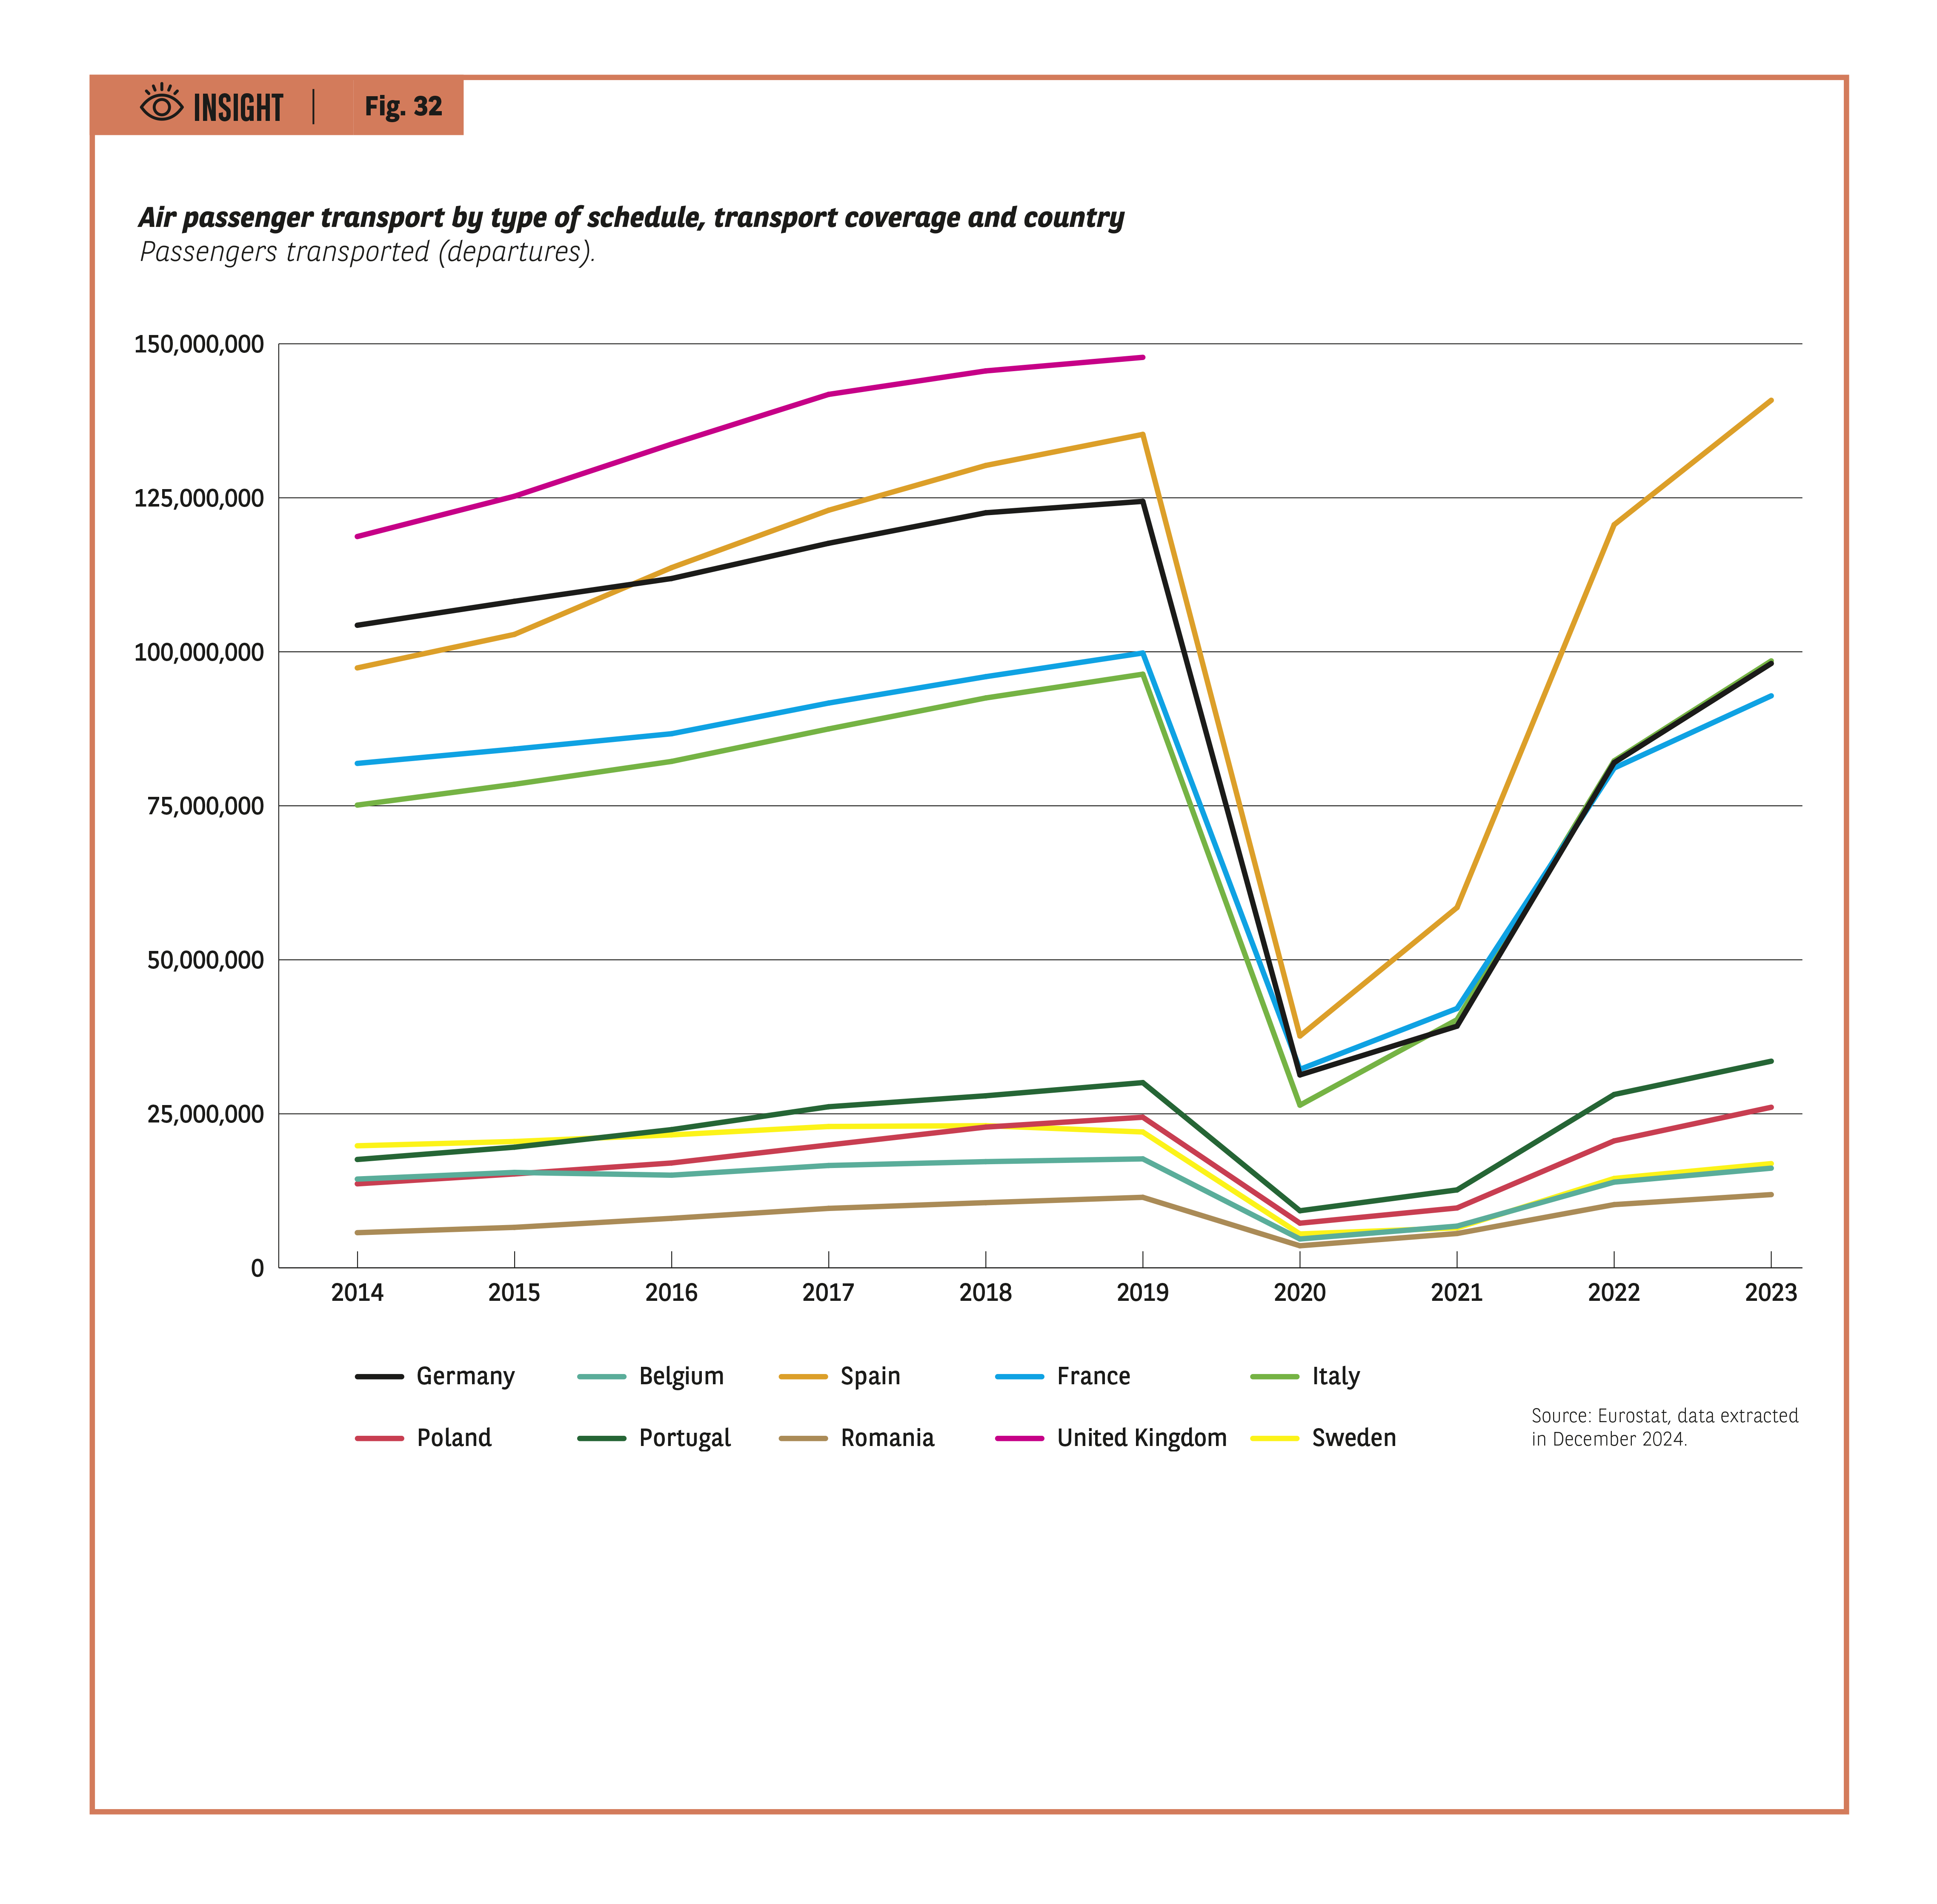 Context
Number of passengers (departures) carried by country, 2014–2023 series. Strong collapse in 2020 and then recovery.
Visuals
Ten curves: Belgium, France, Germany, Italy, Poland, Portugal, Romania, Spain, Sweden, United Kingdom.
Data by country (relative levels: million passengers)
• Germany: ~115 M (2014) → ~135 M (2019) → ~30 M (2020) → rise ~85 M (2023).
• Belgium: ~17 M (2014) → ~26 M (2019) → fall ~8 M (2020) → ~22 M (2023).
• Spain: ~100 M (2014) → ~130 M (2019, peak) → ~35 M (2020) → ~145 M (2023).
• France: ~80 M (2014) → ~100 M (2019) → ~30 M (2020) → ~95 M (2023).
• Italy: ~75 M (2014) → ~100 M (2019) → ~25 M (2020) → ~100 M (2023).
• Poland: ~10 M (2014) → ~25 M (2019) → ~5 M (2020) → ~20 M (2023).
• Portugal: ~12 M (2014) → ~25 M (2019) → ~7 M (2020) → ~27 M (2023).
• Romania: ~7 M (2014) → ~15 M (2019) → ~3 M (2020) → ~13 M (2023).
• United Kingdom: ~120 M (2014) → ~150 M (2019, high) → ~40 M (2020) → ~130 M (2023).
• Sweden: ~18 M (2014) → ~25 M (2019) → ~8 M (2020) → ~20 M (2023).
Synthetic reading
All the curves show growth until 2019, a sharp break in 2020, then a strong but uneven recovery.
Context
Number of passengers (departures) carried by country, 2014–2023 series. Strong collapse in 2020 and then recovery.
Visuals
Ten curves: Belgium, France, Germany, Italy, Poland, Portugal, Romania, Spain, Sweden, United Kingdom.
Data by country (relative levels: million passengers)
• Germany: ~115 M (2014) → ~135 M (2019) → ~30 M (2020) → rise ~85 M (2023).
• Belgium: ~17 M (2014) → ~26 M (2019) → fall ~8 M (2020) → ~22 M (2023).
• Spain: ~100 M (2014) → ~130 M (2019, peak) → ~35 M (2020) → ~145 M (2023).
• France: ~80 M (2014) → ~100 M (2019) → ~30 M (2020) → ~95 M (2023).
• Italy: ~75 M (2014) → ~100 M (2019) → ~25 M (2020) → ~100 M (2023).
• Poland: ~10 M (2014) → ~25 M (2019) → ~5 M (2020) → ~20 M (2023).
• Portugal: ~12 M (2014) → ~25 M (2019) → ~7 M (2020) → ~27 M (2023).
• Romania: ~7 M (2014) → ~15 M (2019) → ~3 M (2020) → ~13 M (2023).
• United Kingdom: ~120 M (2014) → ~150 M (2019, high) → ~40 M (2020) → ~130 M (2023).
• Sweden: ~18 M (2014) → ~25 M (2019) → ~8 M (2020) → ~20 M (2023).
Synthetic reading
All the curves show growth until 2019, a sharp break in 2020, then a strong but uneven recovery.
Fig 33 – Turnover of the information and communication sector
Download this infographic for your presentations Context
Turnover index (base 100 in 2021) for ten European countries.
Visuals
Curves comparing the evolution from 2014 to 2023.
Data by country (approximate indices)
• Germany: ~90 (2014), ~95 (2019), 100 (2021), ~115 (2023).
• Belgium: ~75 (2014), ~90 (2019), 100 (2021), ~118 (2023).
• Spain: ~85 (2014), ~95 (2019), 100 (2021), ~112 (2023).
• France: ~78 (2014), ~92 (2019), 100 (2021), ~118 (2023).
• Italy: ~95 (2014), ~98 (2019), 100 (2021), ~110 (2023).
• Poland: ~70 (2014), ~88 (2019), 100 (2021), ~130 (2023).
• Portugal: ~75 (2014), ~85 (2019), 100 (2021), ~110 (2023).
• Romania: ~50 (2014), ~75 (2019), 100 (2021), ~145 (2023, strongest growth).
• Sweden: ~60 (2014), ~95 (2019), 100 (2021), ~120 (2023).
Synthetic reading
Sustained growth in all countries, more marked in Romania and Poland.
Context
Turnover index (base 100 in 2021) for ten European countries.
Visuals
Curves comparing the evolution from 2014 to 2023.
Data by country (approximate indices)
• Germany: ~90 (2014), ~95 (2019), 100 (2021), ~115 (2023).
• Belgium: ~75 (2014), ~90 (2019), 100 (2021), ~118 (2023).
• Spain: ~85 (2014), ~95 (2019), 100 (2021), ~112 (2023).
• France: ~78 (2014), ~92 (2019), 100 (2021), ~118 (2023).
• Italy: ~95 (2014), ~98 (2019), 100 (2021), ~110 (2023).
• Poland: ~70 (2014), ~88 (2019), 100 (2021), ~130 (2023).
• Portugal: ~75 (2014), ~85 (2019), 100 (2021), ~110 (2023).
• Romania: ~50 (2014), ~75 (2019), 100 (2021), ~145 (2023, strongest growth).
• Sweden: ~60 (2014), ~95 (2019), 100 (2021), ~120 (2023).
Synthetic reading
Sustained growth in all countries, more marked in Romania and Poland.
Fig 34 – Netflix Worldwide Revenue 2002-2023
Download this infographic for your presentations Context
Netflix’s global revenue growth in millions of dollars.
Visuals
Vertical histogram, one bar per year.
Data
Selection:
• 2002: $150.8 million
• 2010: $2,162.6 million
• 2015: $6,779.5 million
• 2018: $15,794.3M
• 2020: $24,996 million
• 2021: $29,697.8M
• 2022: $31,615.5M
• 2023: $33,723M
Synthetic reading
The progression is almost continuous, with very rapid growth from 2010 onwards.
Source: Statista 2024
Context
Netflix’s global revenue growth in millions of dollars.
Visuals
Vertical histogram, one bar per year.
Data
Selection:
• 2002: $150.8 million
• 2010: $2,162.6 million
• 2015: $6,779.5 million
• 2018: $15,794.3M
• 2020: $24,996 million
• 2021: $29,697.8M
• 2022: $31,615.5M
• 2023: $33,723M
Synthetic reading
The progression is almost continuous, with very rapid growth from 2010 onwards.
Source: Statista 2024
Fig 35 – 36 – Uber Eats revenue 2017-2023 and Spotify Revenue 2013-2023
Download this infographic for your presentations Context for Uber Eat’s revenues
Revenue in billions of US dollars.
Data
• 2017 : 0,6
• 2018 : 1,5
• 2019 : 1,9
• 2020 : 4,8
• 2021 : 8,3
• 2022 : 10,9
• 2023 : 12,2
Synthetic reading
Sustained growth, notable acceleration between 2020 and 2021.
Context for Spotify turnover
Context for Uber Eat’s revenues
Revenue in billions of US dollars.
Data
• 2017 : 0,6
• 2018 : 1,5
• 2019 : 1,9
• 2020 : 4,8
• 2021 : 8,3
• 2022 : 10,9
• 2023 : 12,2
Synthetic reading
Sustained growth, notable acceleration between 2020 and 2021.
Context for Spotify turnover