Not as privileged as you might think


In the eyes of the general public, and sometimes the media, senior citizens are the age group with the greatest purchasing power, benefiting from the ‘wealth’ they have accumulated over the years. The Observatoire Cetelem reveals a somewhat different reality, in which the distinction between income and wealth is crucial. It also highlights the links between generations on this subject, with seniors paying particular attention to helping their descendants as well as their forebears.
RELATIVELY HIGH INCOMES
When it comes to income, seniors are not quite the privileged generation you might think. After the age of 65, often the pivotal retirement age, incomes fall significantly in all the countries included in this survey. According to the OECD, 80% are below the national average, with a significant poverty rate, as high as 14.9% in the UK.
There is a significant gap compared to the 25-49 age group, a period of life that often sees professional careers take off. On the other hand, as with all age groups, senior citizens’ incomes have risen in recent years.
There are major differences between countries when it comes to pensions paid to retired people. The amounts vary according to the different schemes, the extent of capitalisation and existing deductions.
Fig 43 – Income by age and country in 2024
Download this infographic for your presentations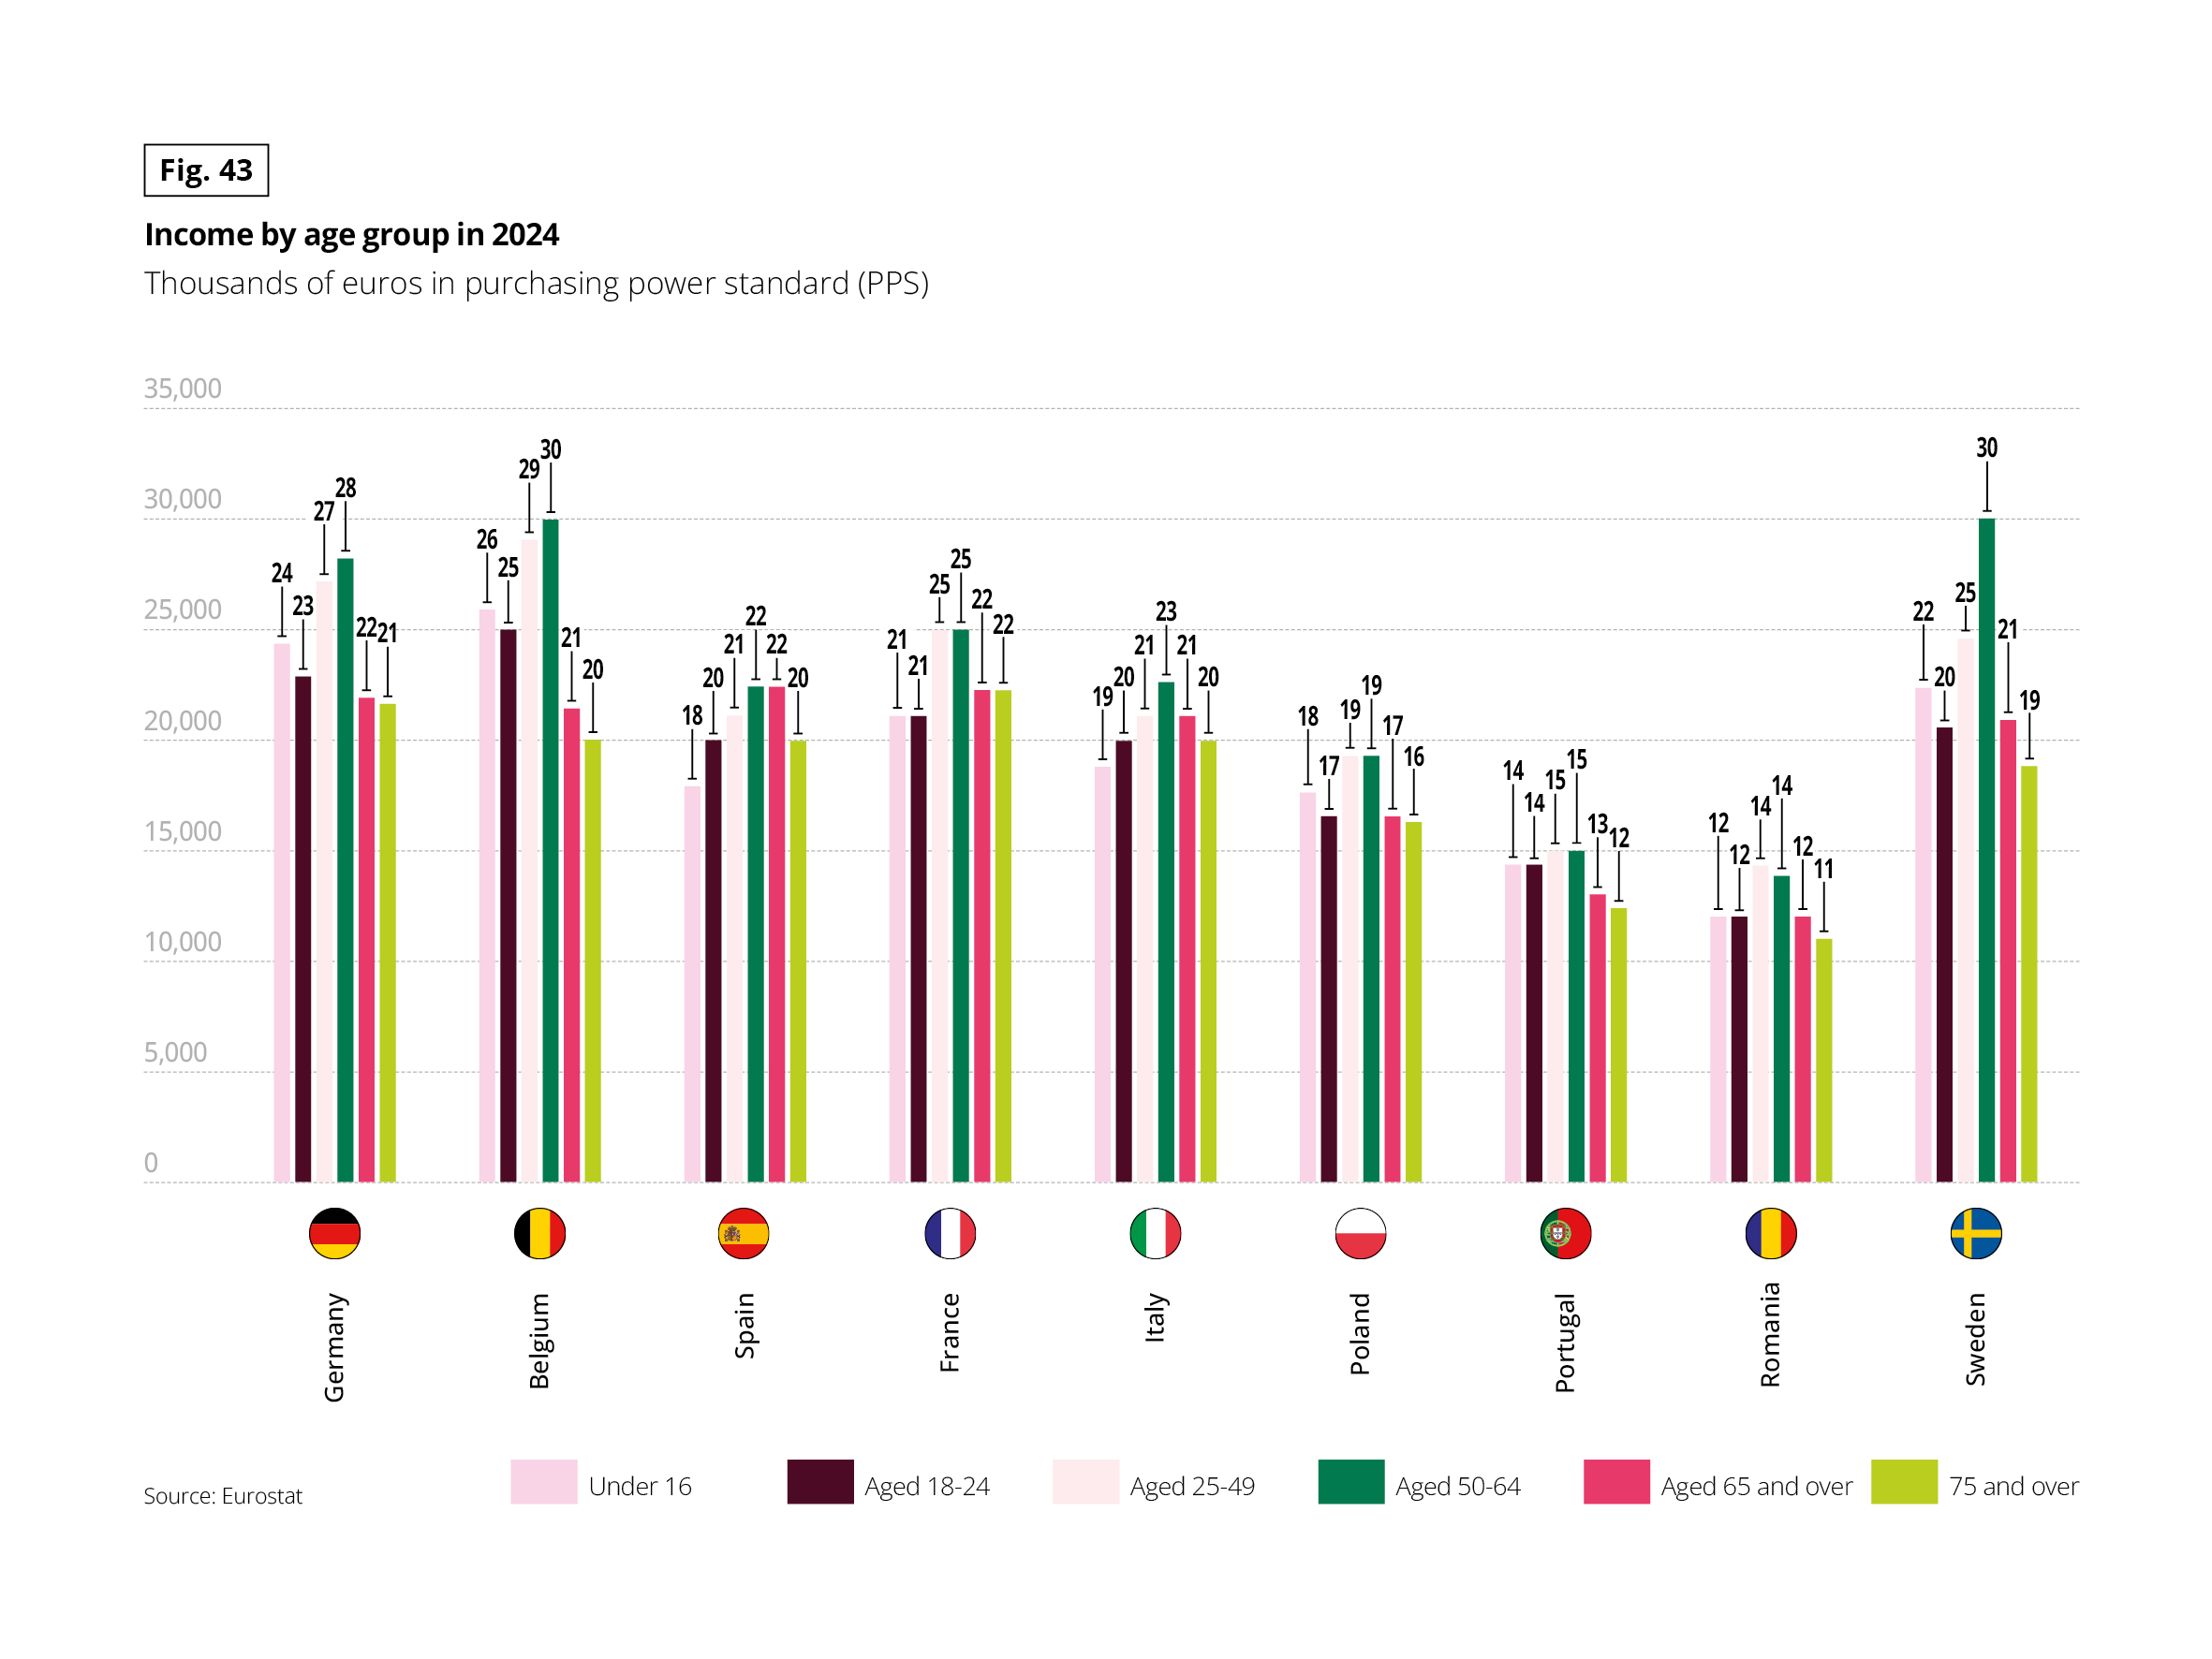 This graph presents income by age group in 2024, expressed in thousands of euros in PPP, for several European countries.
Fig 44 – Average pension amount by country
Download this infographic for your presentations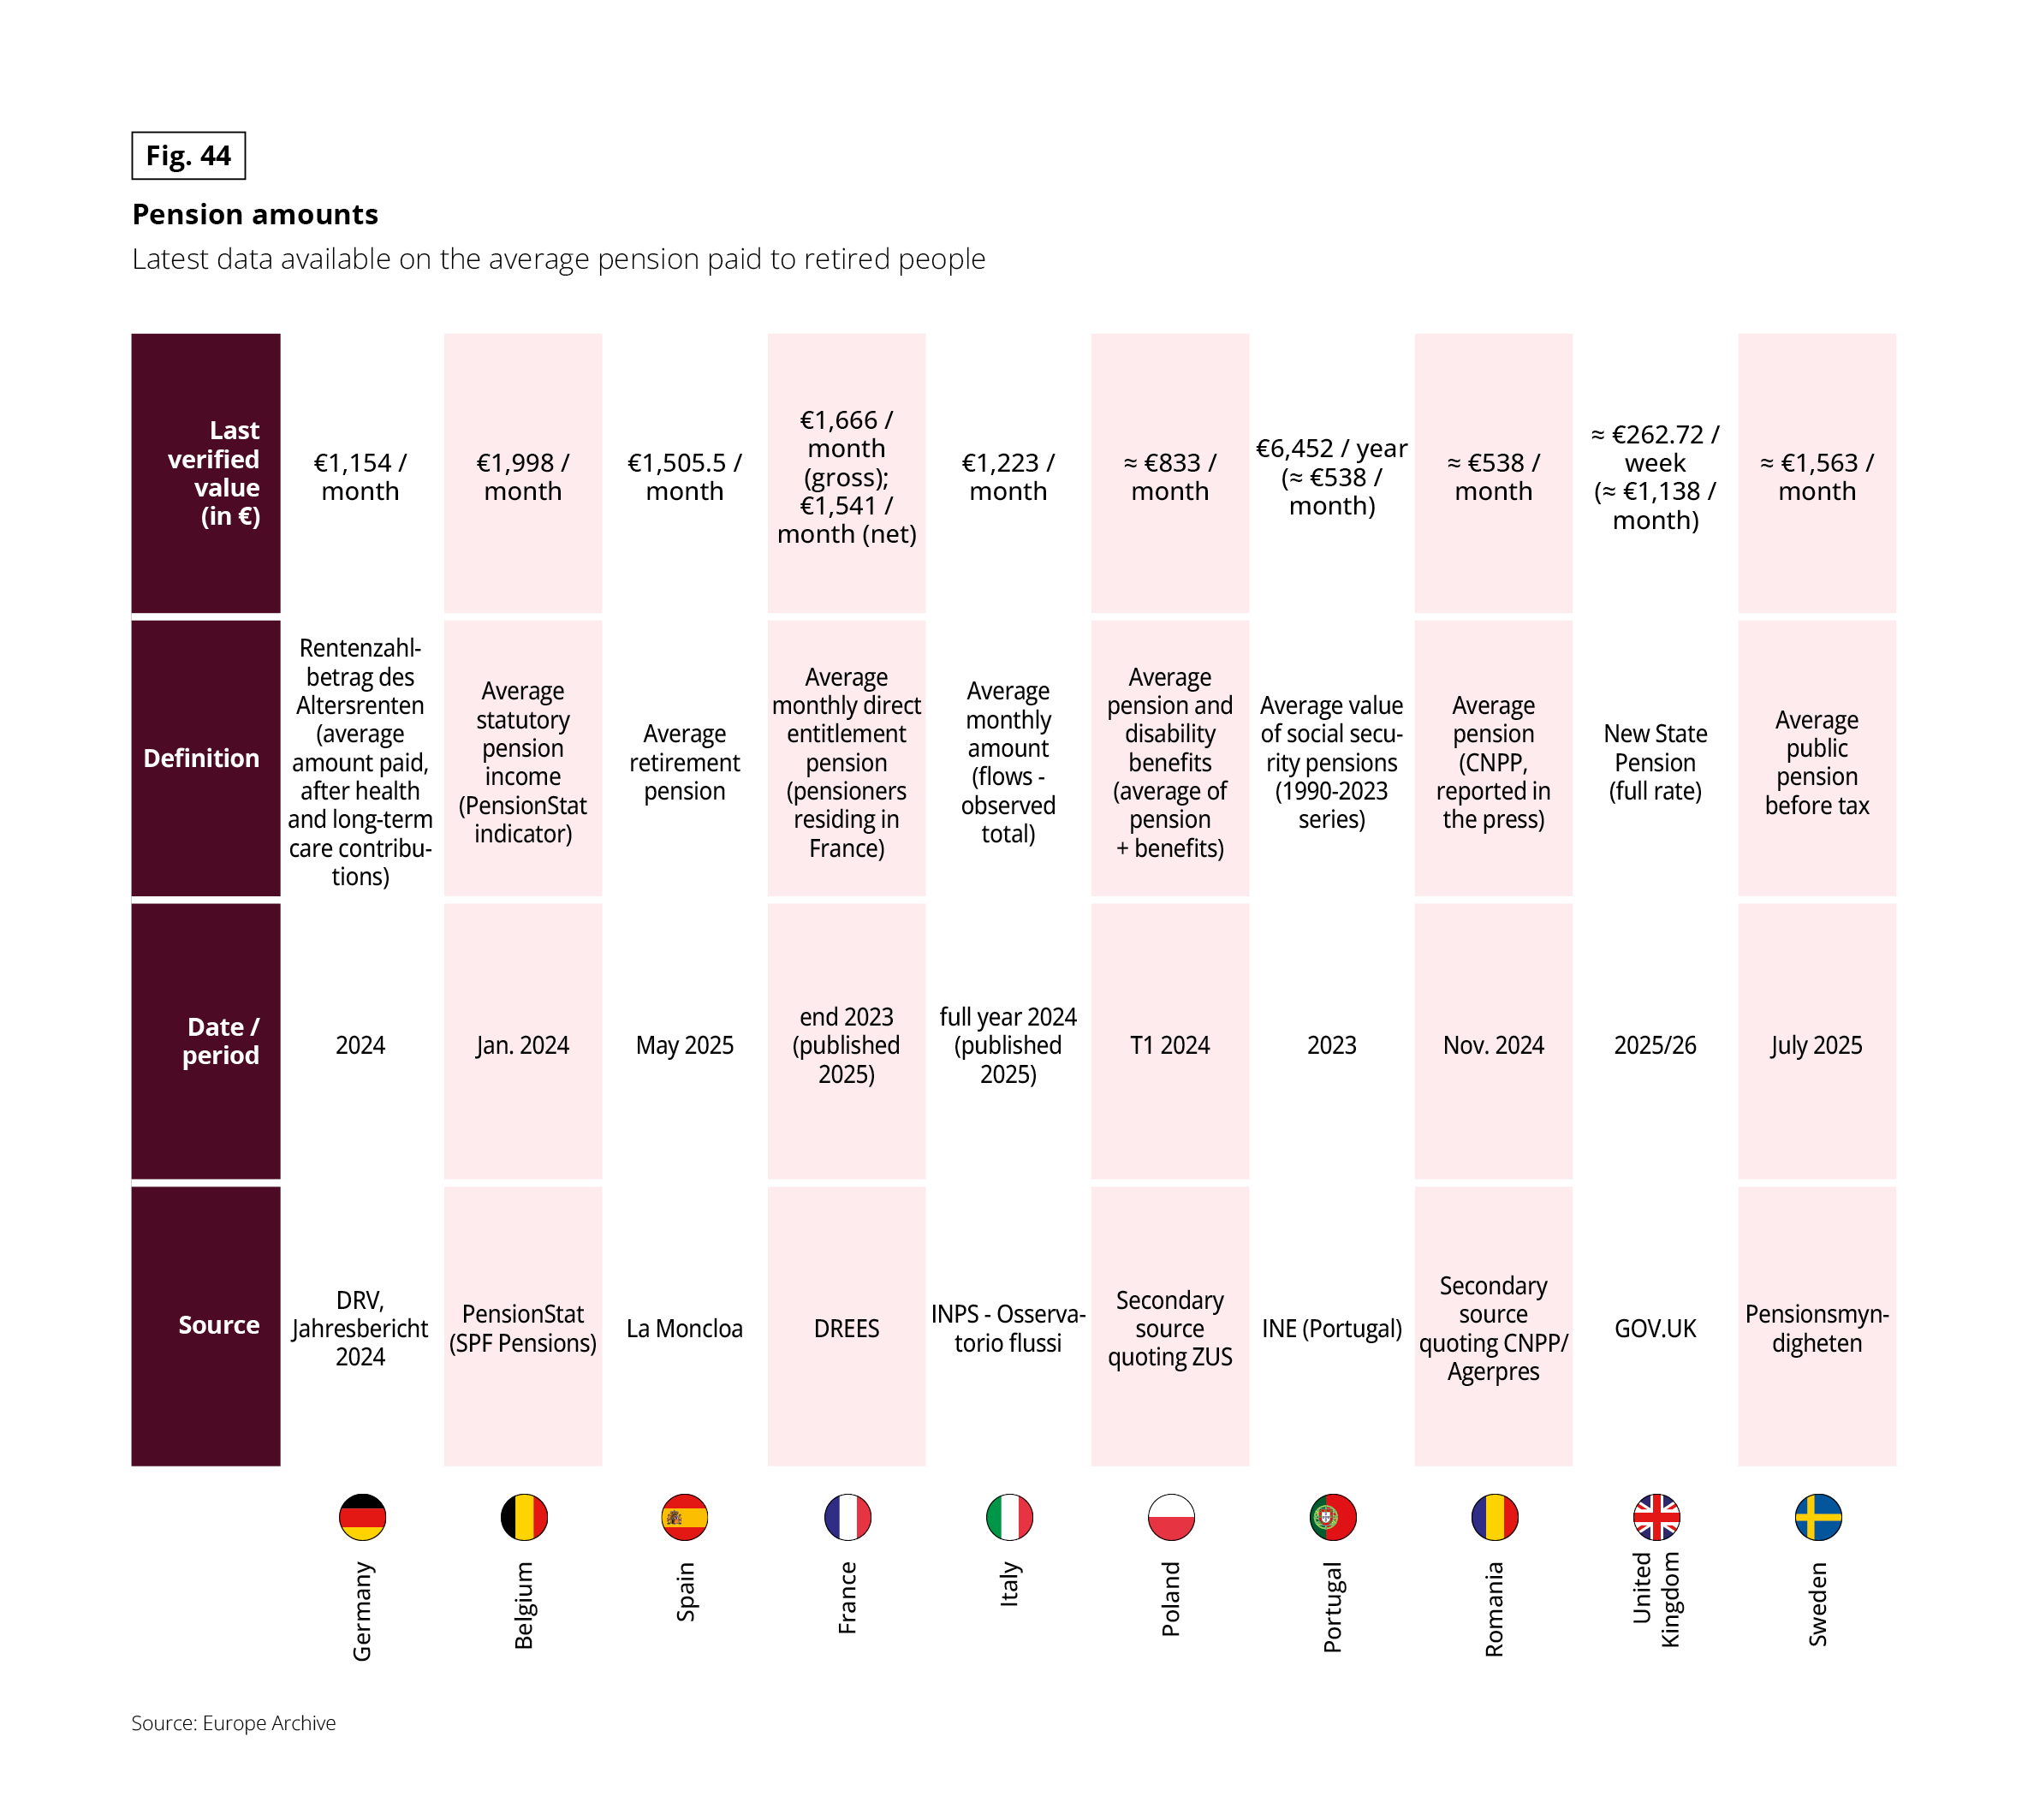 This table presents average pension amounts in different European countries, based on the latest available data.
THE WEIGHT OF REAL ESTATE
When it comes to wealth and assets, the situation varies from country to country, with Belgium being an “El Dorado” for senior citizens. With age, wealth gradually rises, often thanks to the acquisition of a home. This explains the marked difference between the under-35s and 55-64 year olds.
After the symbolic age of 65, the wealth of senior citizens tends to decrease as a result of them making more frequent and larger gifts, as well as transfers following the death of one of the spouses. This reduction also stems from the fact that consumption levels are being upheld while incomes are falling.
Fig 45 – Median net wealth by age
Download this infographic for your presentations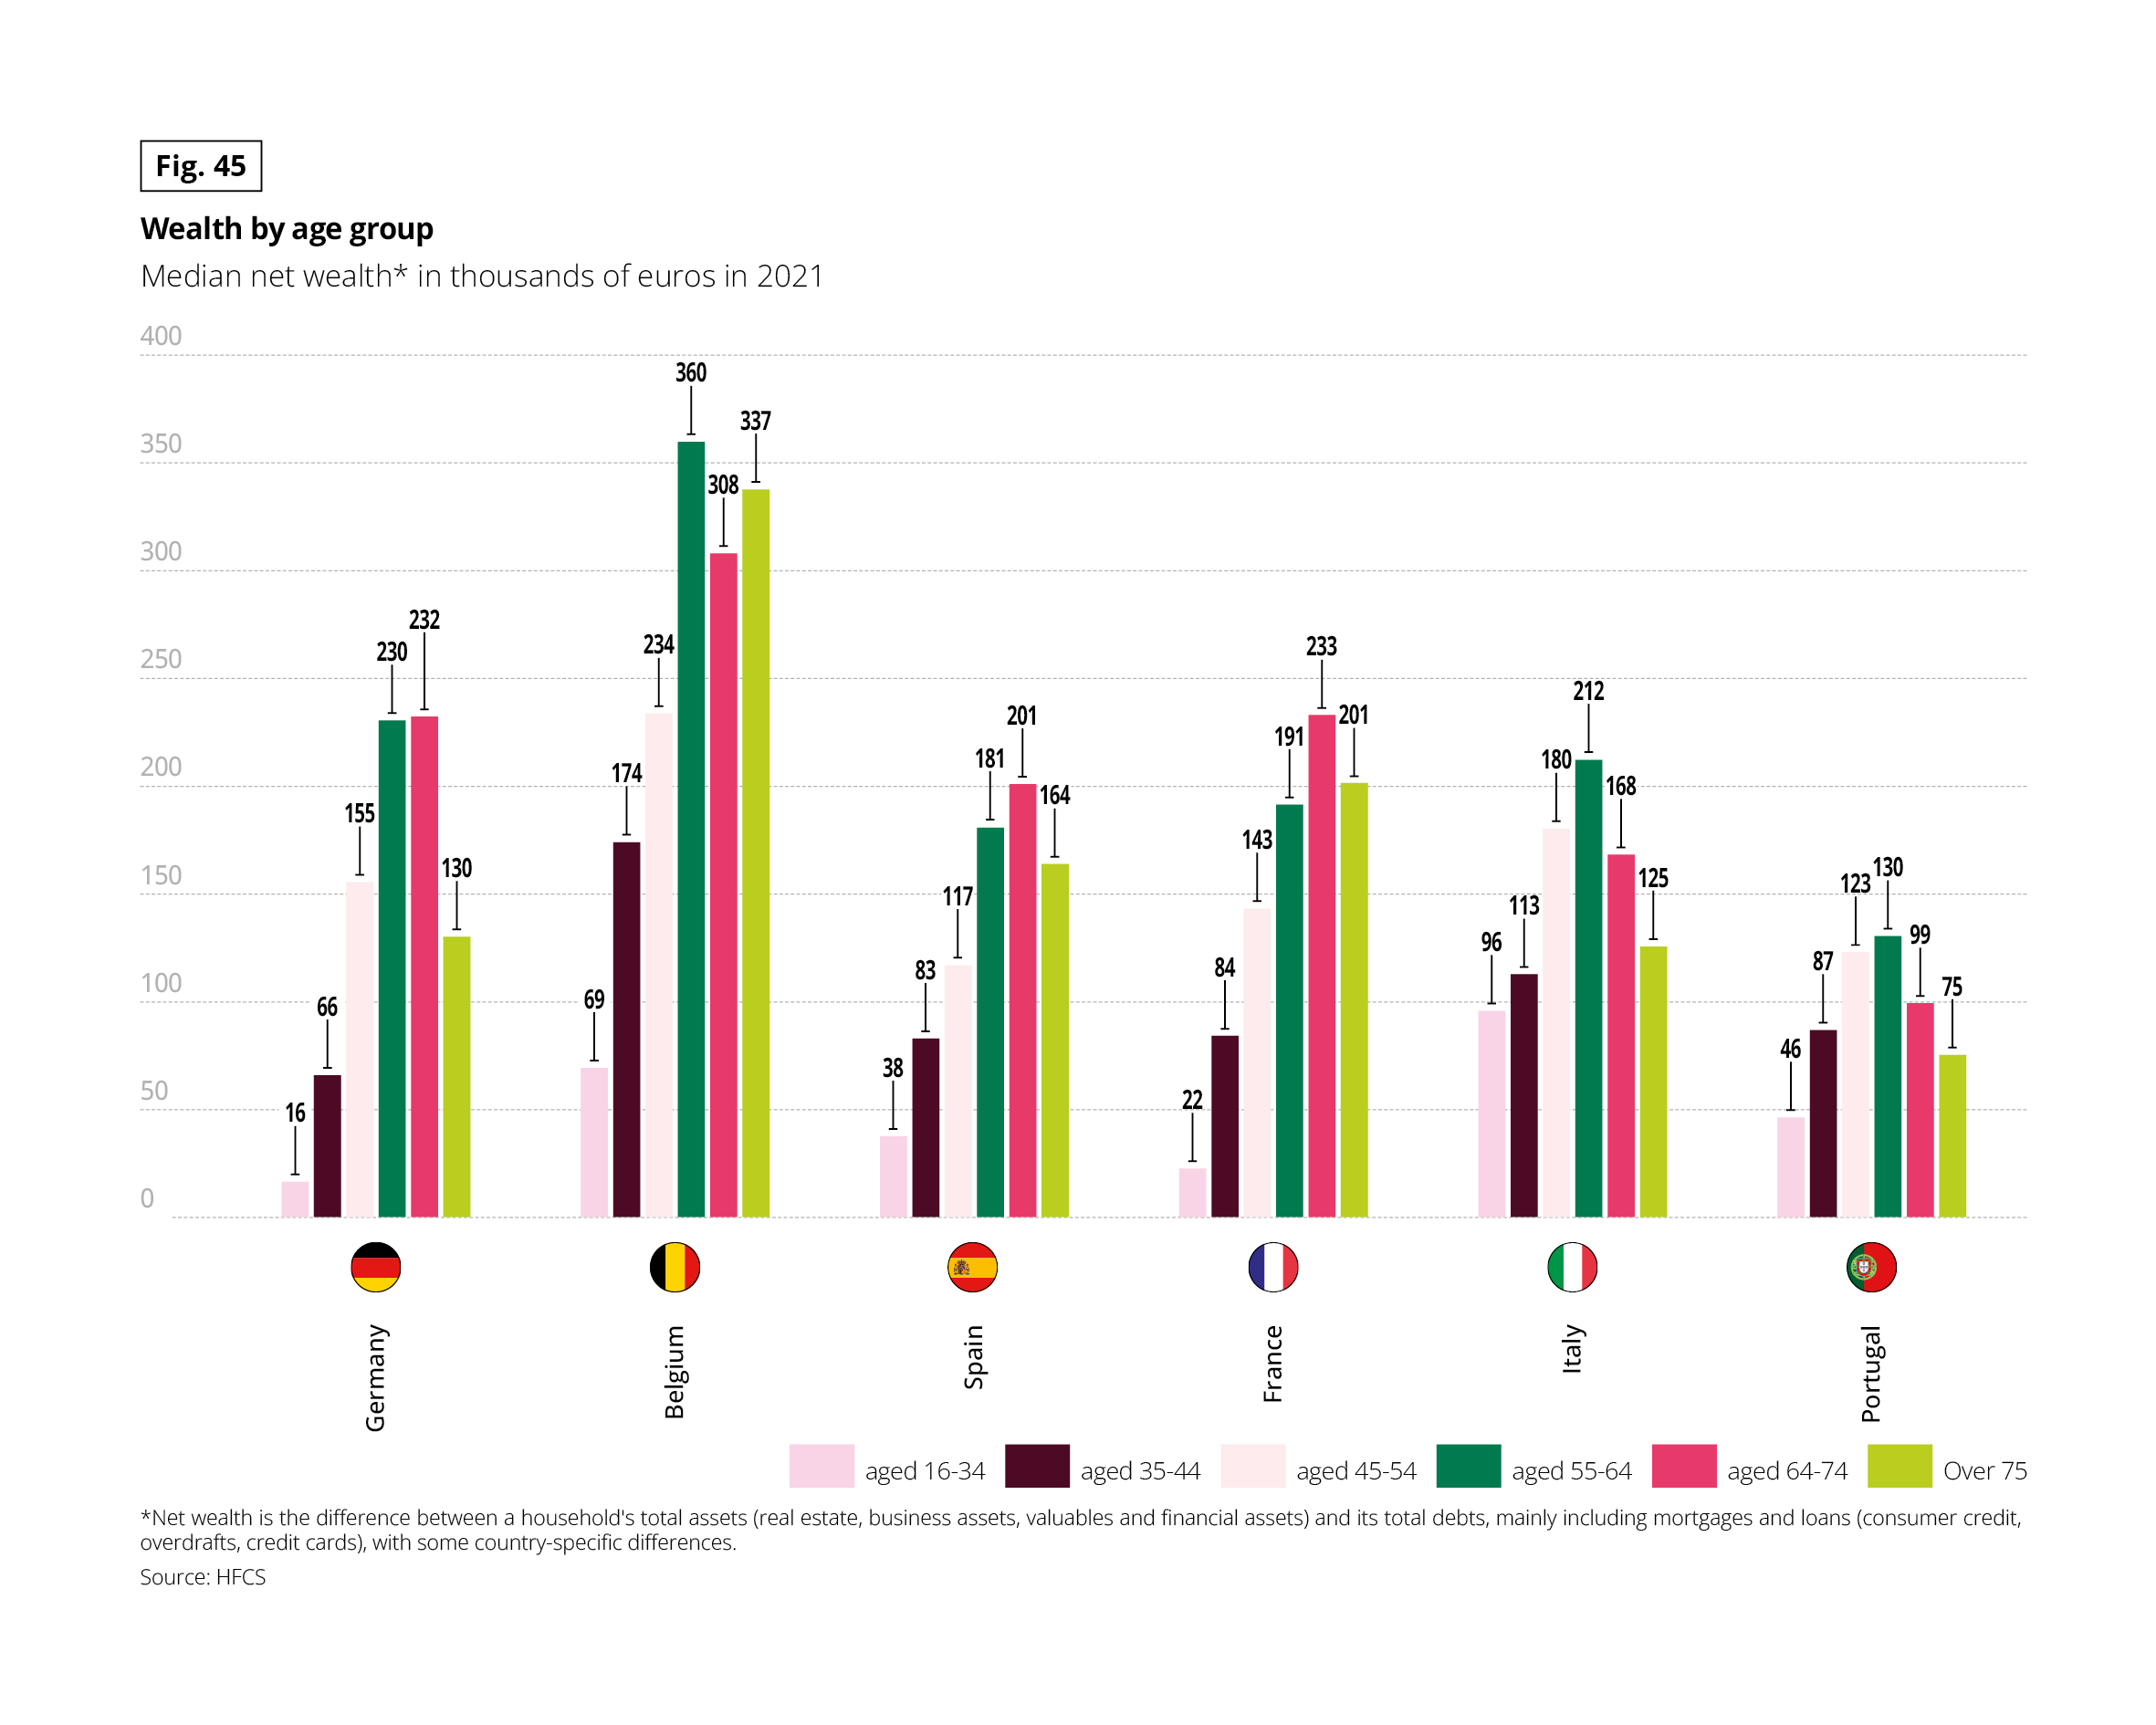 This table presents average pension amounts in different European countries, based on the latest available data.
The amounts are expressed in euros per month or per year, depending on the country. Examples of values displayed:
• Germany: 1,154 euros per month
• Belgium: 1,998 euros per month
• Spain: 1,505.5 euros per month
• France: 1,666 euros per month (gross), 1,541 euros per month (net)
• Italy: 1,223 euros per month
• Poland: approximately 833 euros per month
• Portugal: 6,452 euros per year, or approximately 538 euros per month
• Romania: approximately 538 euros per month
• United Kingdom: approximately 262.72 euros per week, or approximately 1,138 euros per month
• Sweden: approximately 1,563 euros per month
For each country, the table specifies the definition used, the reference period, and the institutional source.
Source: Europe Archive.
This table presents average pension amounts in different European countries, based on the latest available data.
The amounts are expressed in euros per month or per year, depending on the country. Examples of values displayed:
• Germany: 1,154 euros per month
• Belgium: 1,998 euros per month
• Spain: 1,505.5 euros per month
• France: 1,666 euros per month (gross), 1,541 euros per month (net)
• Italy: 1,223 euros per month
• Poland: approximately 833 euros per month
• Portugal: 6,452 euros per year, or approximately 538 euros per month
• Romania: approximately 538 euros per month
• United Kingdom: approximately 262.72 euros per week, or approximately 1,138 euros per month
• Sweden: approximately 1,563 euros per month
For each country, the table specifies the definition used, the reference period, and the institutional source.
Source: Europe Archive.
SENIORS OWN MORE PROPERTY THAN PREVIOUS GENERATIONS
Fig 46 – Evolution of homeownership rate by age
Download this infographic for your presentations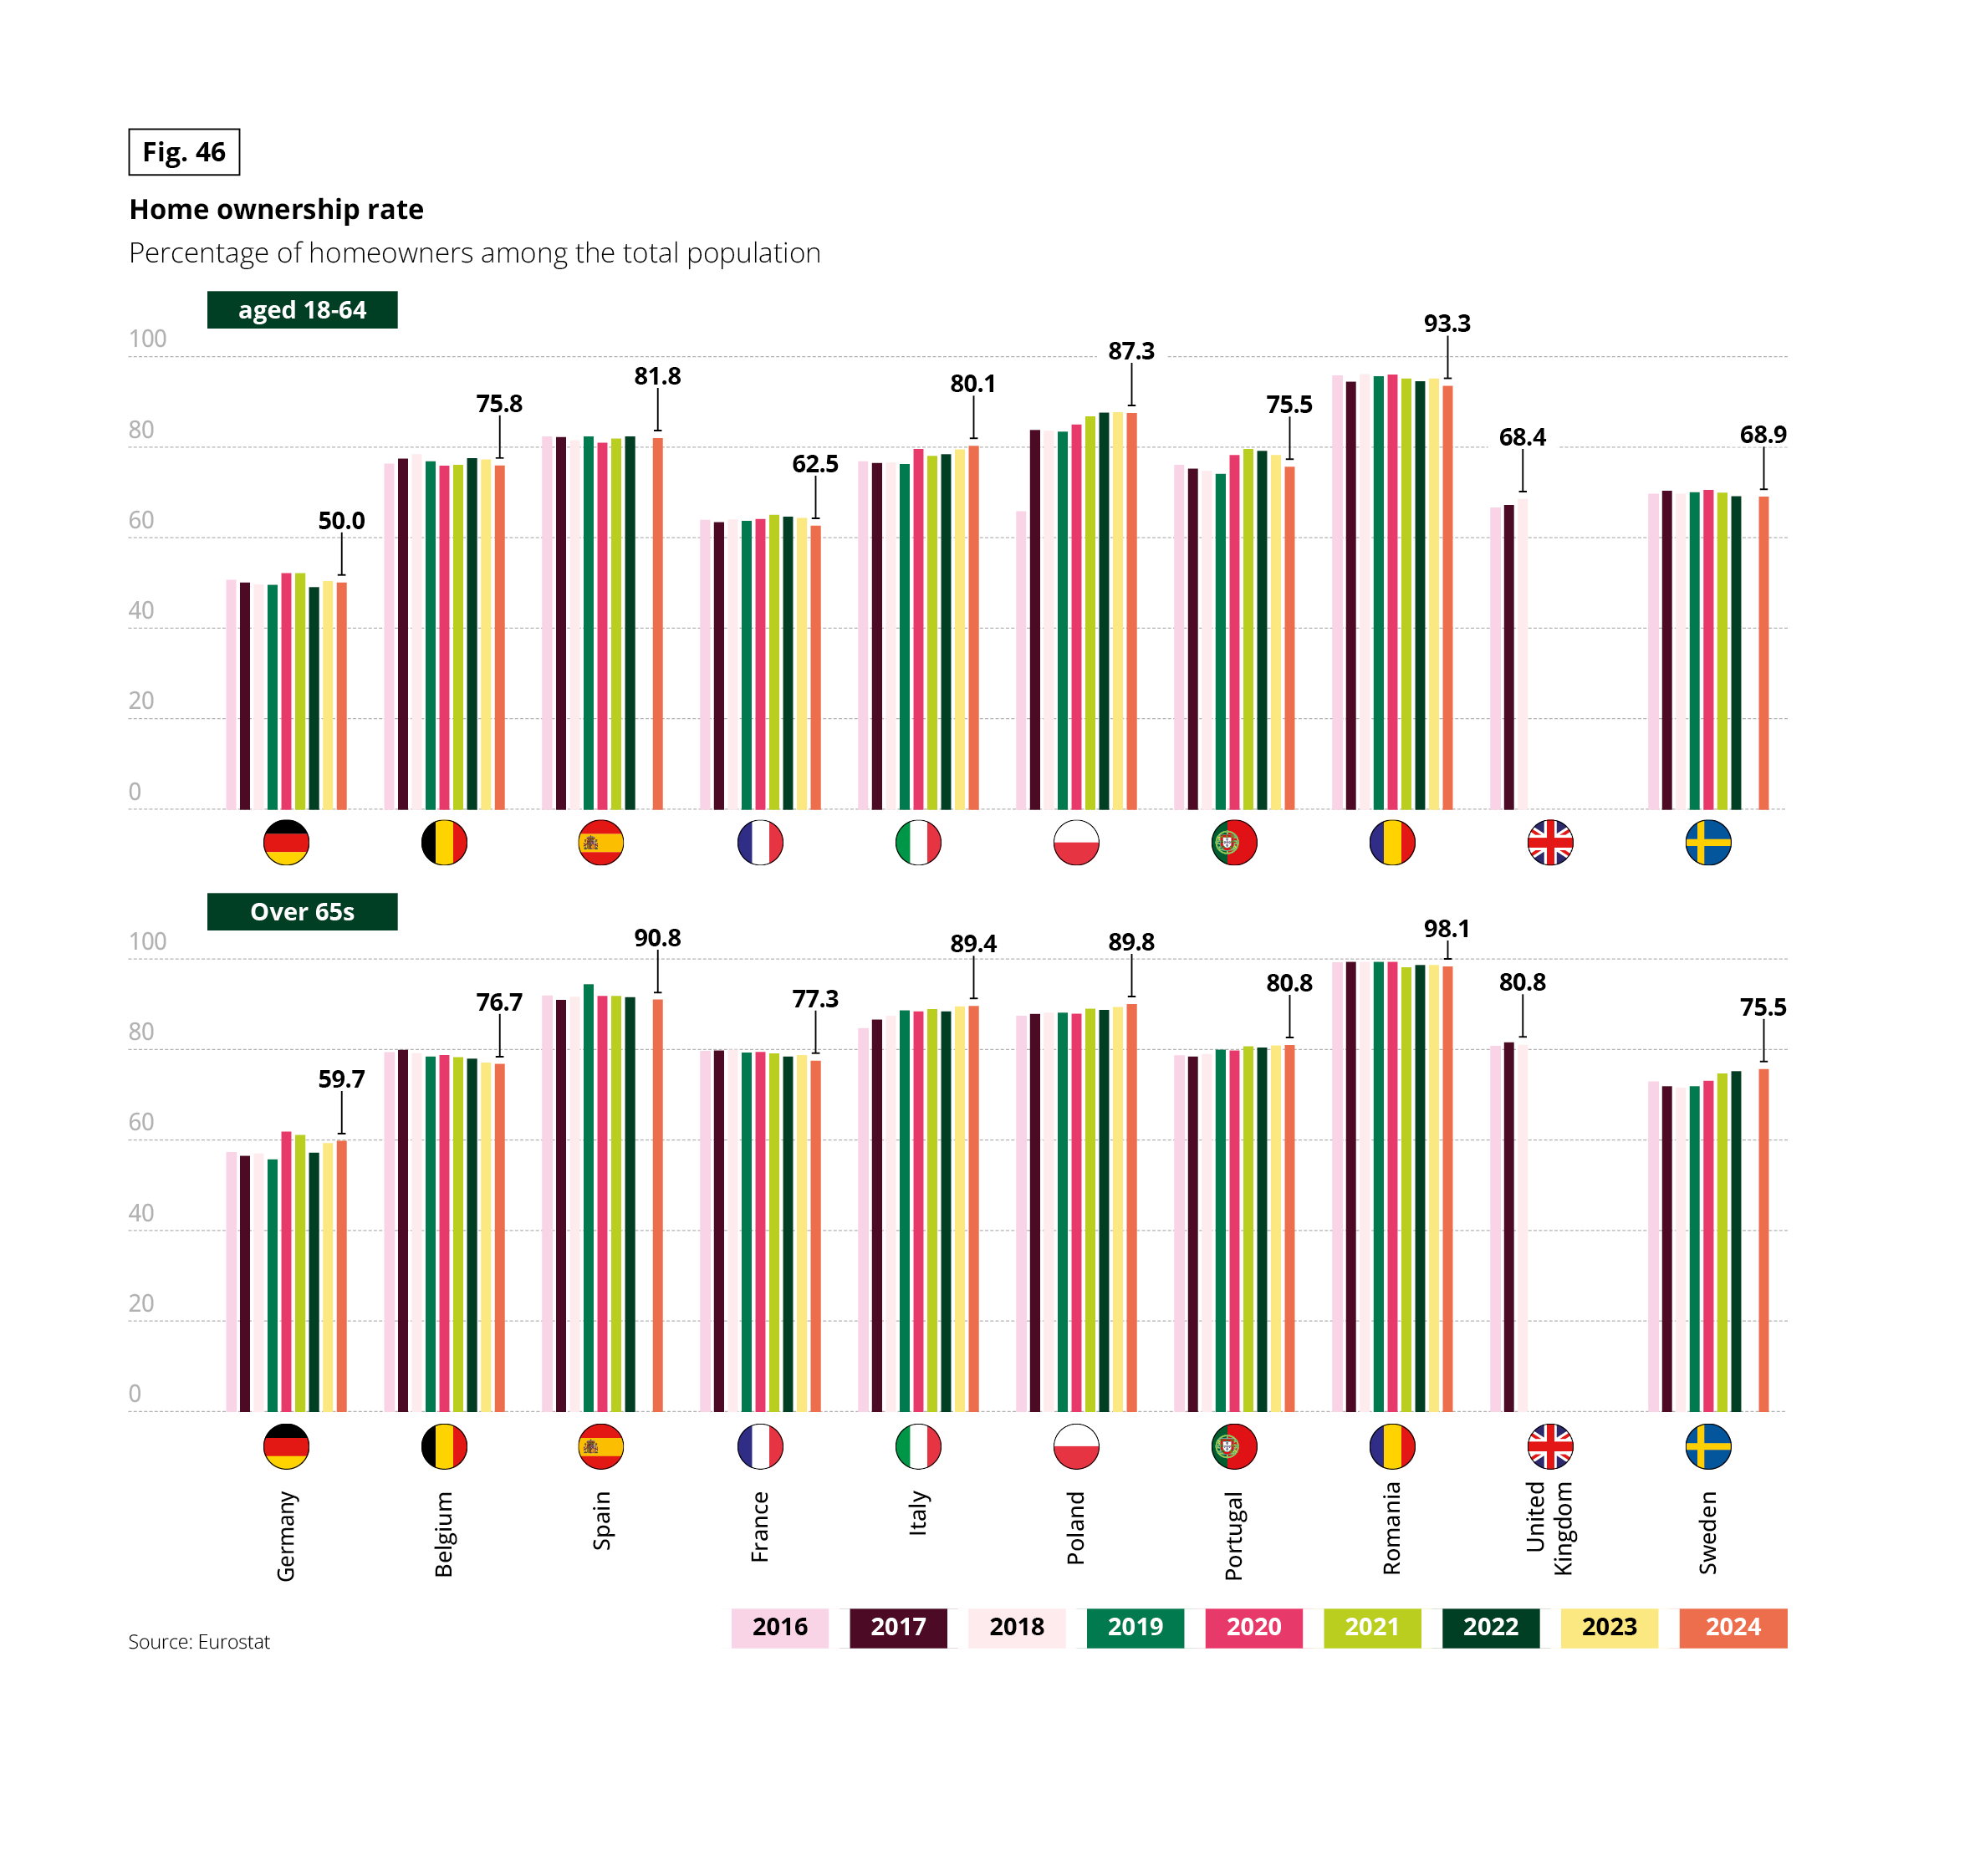 This graph presents the evolution of the homeownership rate in the total population, as a percentage, by two age groups: 18-64 and 65 and over.
The data are presented for several European countries from 2016 to 2024. Among 18-64-year-olds, the rates vary by country, with high levels in Romania and Spain, exceeding 80%. Among those 65 and over, the rates are generally higher than for working-age individuals, reaching over 90% in some countries like Romania.
Source: Eurostat.
This graph presents the evolution of the homeownership rate in the total population, as a percentage, by two age groups: 18-64 and 65 and over.
The data are presented for several European countries from 2016 to 2024. Among 18-64-year-olds, the rates vary by country, with high levels in Romania and Spain, exceeding 80%. Among those 65 and over, the rates are generally higher than for working-age individuals, reaching over 90% in some countries like Romania.
Source: Eurostat.
SAVING: GOOD INTENTIONS GOING ASTRAY
While senior citizens’ incomes are declining over time, their savings rate is rising. First of all, it should be remembered that the savings rate in Europe has risen steadily in most European countries, peaking during the health crisis.
Fig 47 – Annual household savings rate
Download this infographic for your presentations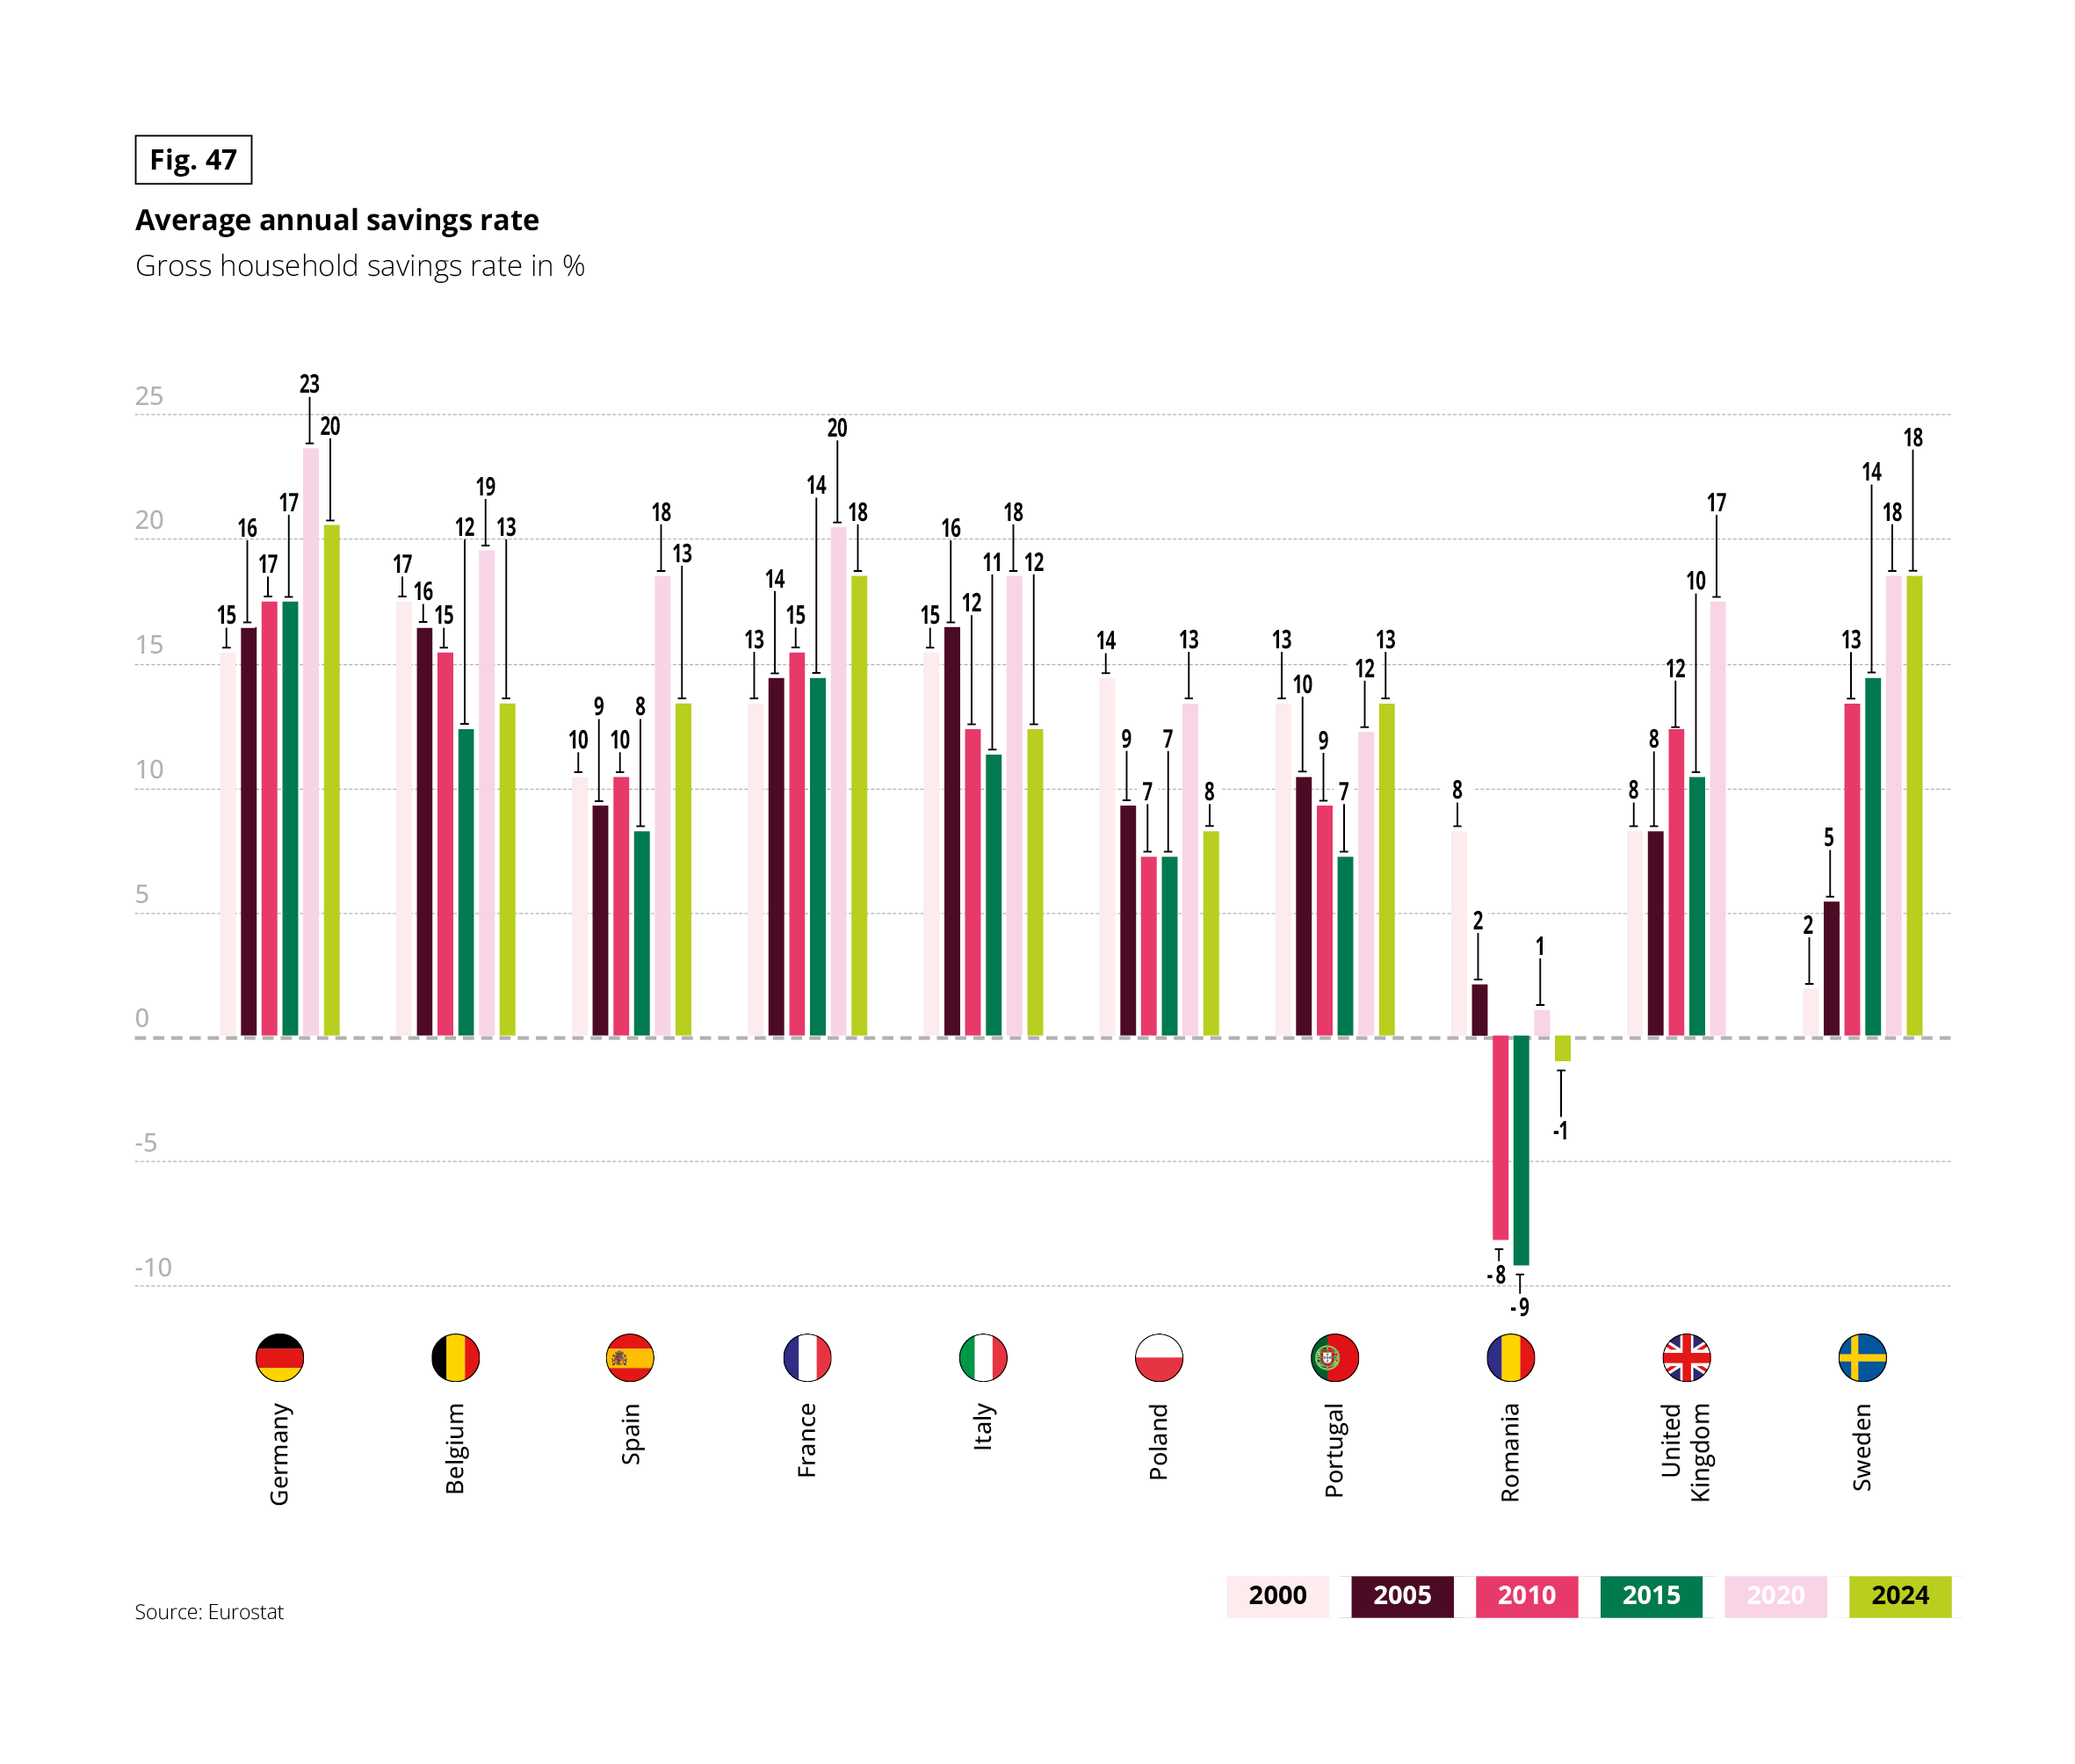 This graph presents the annual gross household savings rate, expressed as a percentage, for several European countries between 2000 and 2024.
A close look at these rates by generation shows that seniors are strong savers, although not the most inclined to put money aside. While in the Iberian Peninsula, the ‘old’ are the ones who save the most, this is not the case in Germany and Belgium, where the youngest are the most active in terms of saving.
As we age, our needs and the way we use our money change as a result of the drop in income we mentioned earlier. Spending less and helping more make up a new pair of financial priorities (see below). Therefore, it is not surprising that fewer European seniors said they wanted to increase their savings over the next 12 months, compared to younger generations. 64% of 60- to 75-year-olds had no plans to increase their savings, compared with 36% of 18- to 59-year-olds.
Fig 48 – Savings rate by age in 2024
Download this infographic for your presentations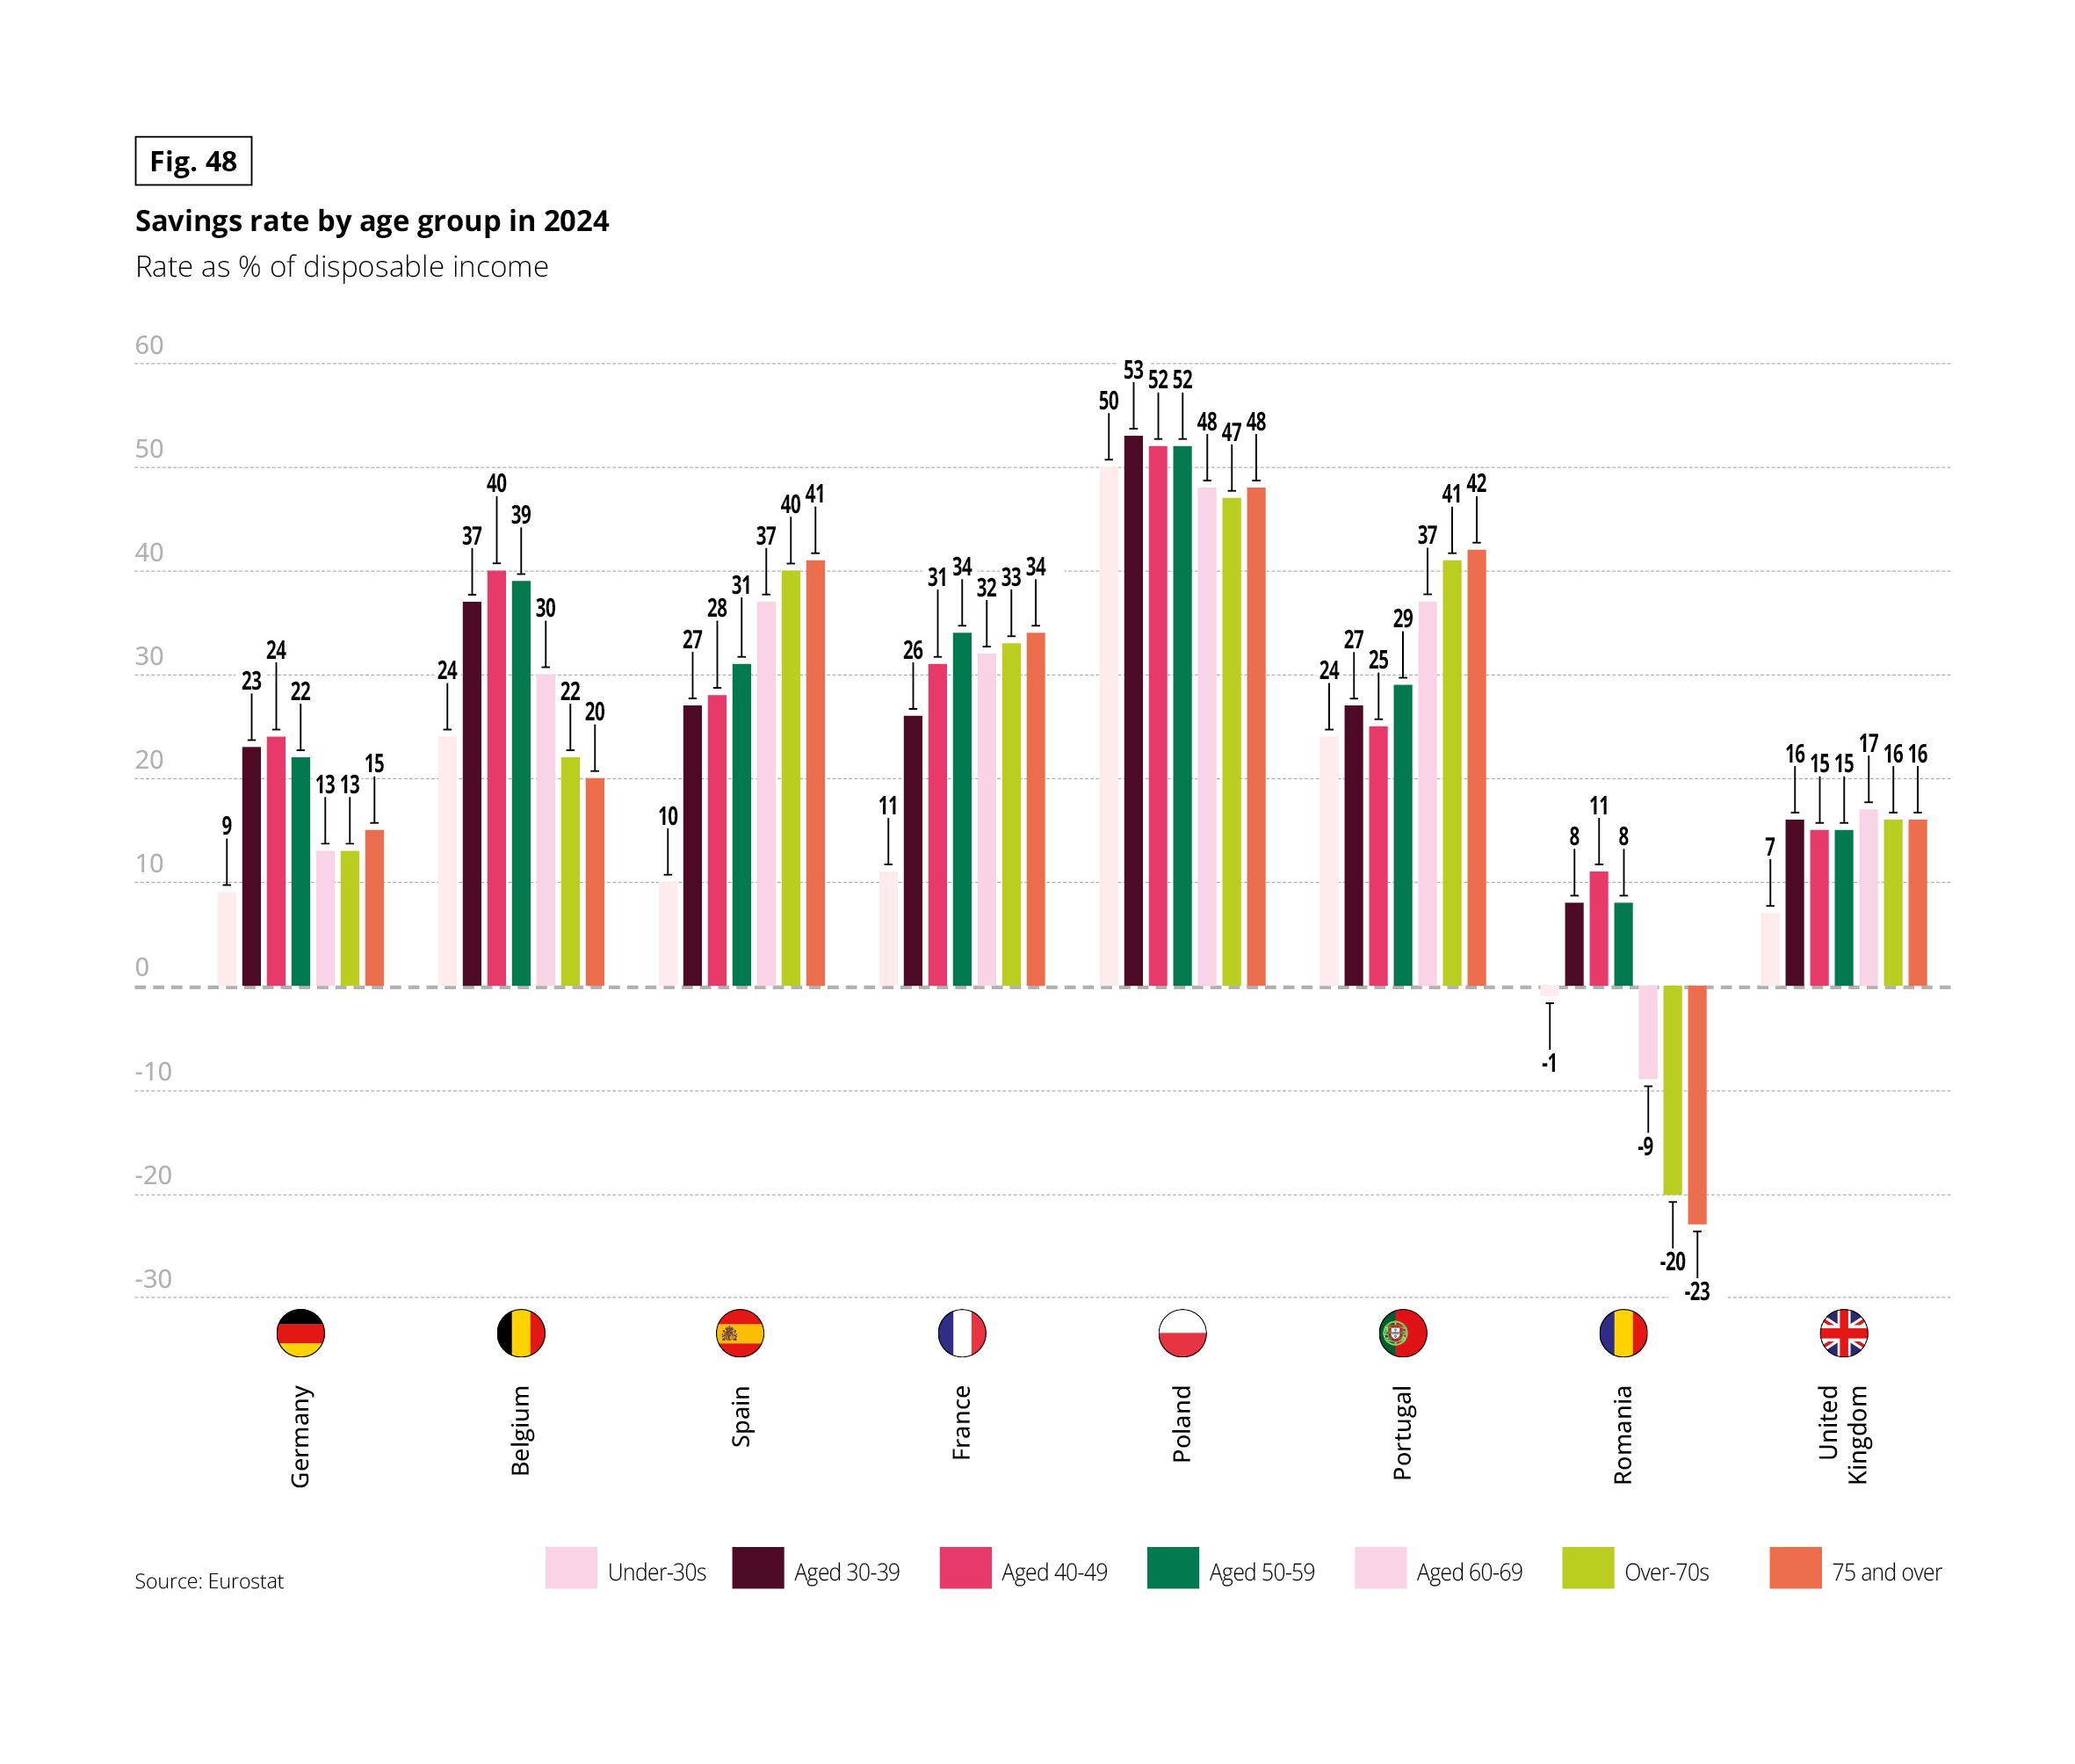 This graph presents the savings rate in 2024, expressed as a percentage of disposable income, by age group and European country.
The age groups represented are: under 30, 30-39, 40-49, 50-59, 60-69, 70 and over, and 75 and over.
In Germany, the savings rate varies from approximately 9% among those under 30 to 24% among those 40-49 years old. In Belgium, the 50-59 age group reaches approximately 40%, while those 75 and over are around 18%. In Poland, the rates are high for all age groups, around 48-53%. Romania presents negative rates for those 60 and over, ranging from -9% to -23%.
Source: Eurostat.
This graph presents the savings rate in 2024, expressed as a percentage of disposable income, by age group and European country.
The age groups represented are: under 30, 30-39, 40-49, 50-59, 60-69, 70 and over, and 75 and over.
In Germany, the savings rate varies from approximately 9% among those under 30 to 24% among those 40-49 years old. In Belgium, the 50-59 age group reaches approximately 40%, while those 75 and over are around 18%. In Poland, the rates are high for all age groups, around 48-53%. Romania presents negative rates for those 60 and over, ranging from -9% to -23%.
Source: Eurostat.
Fig 49 – Composition of the savings rate in 2024
Download this infographic for your presentations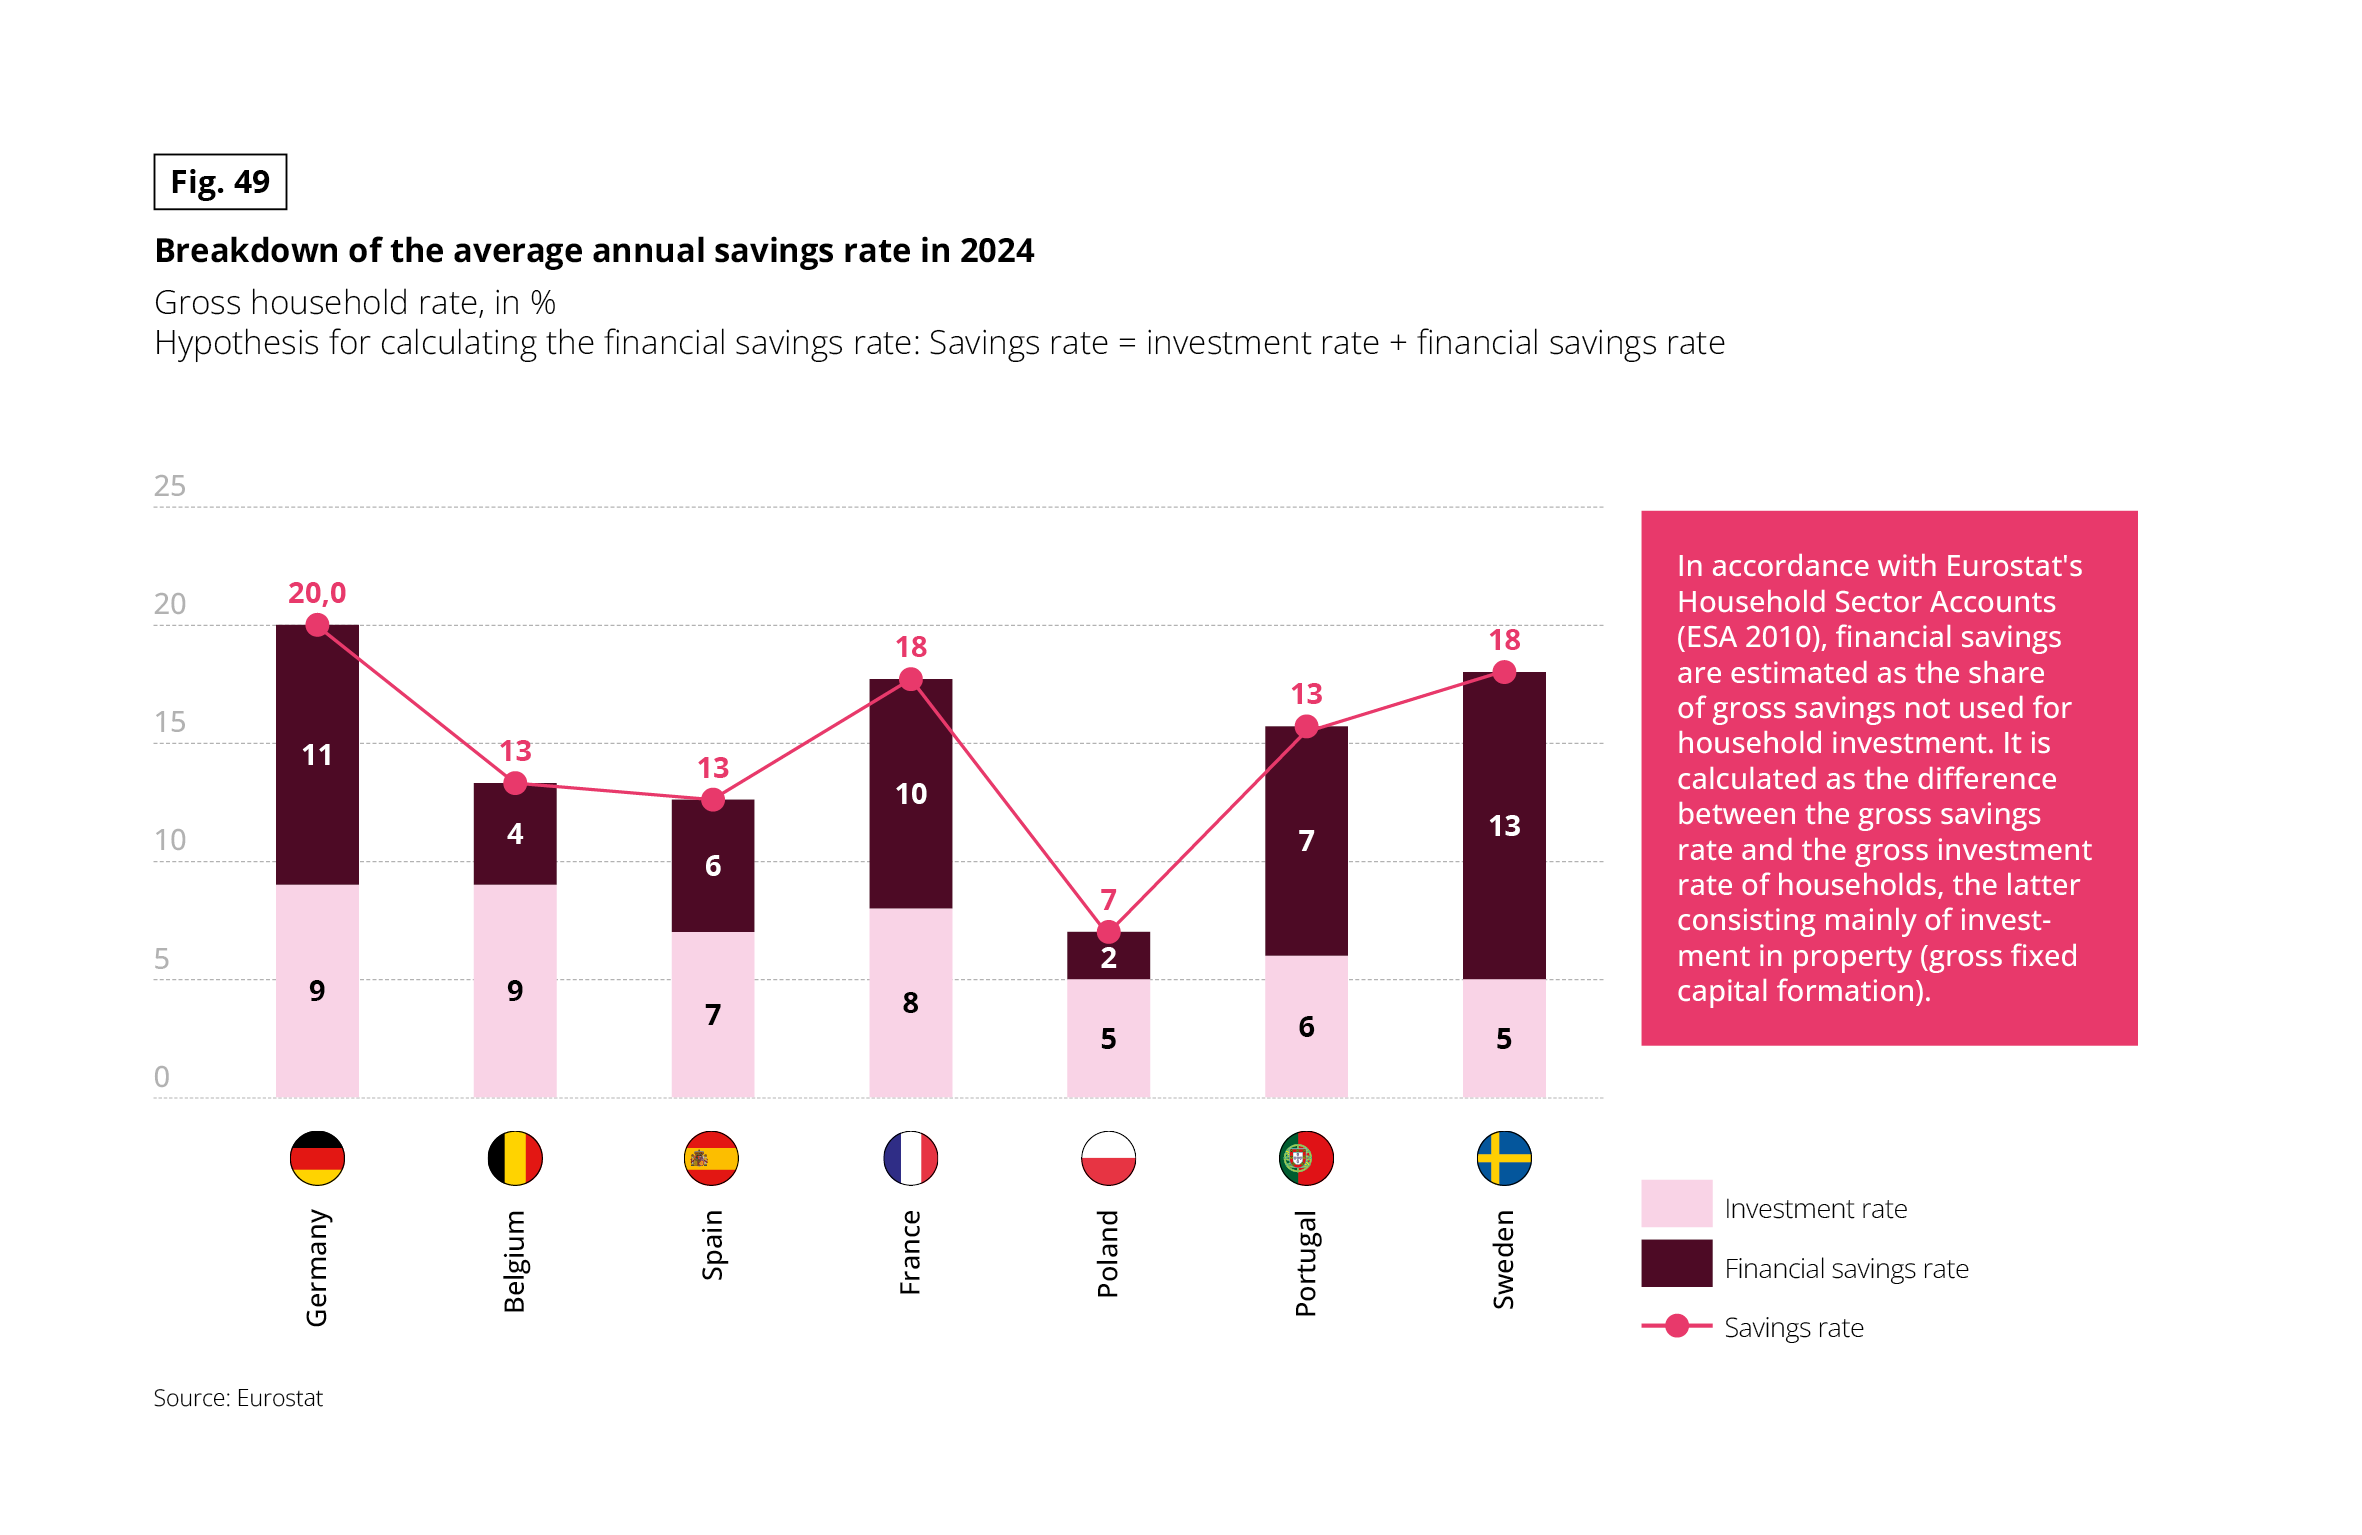 This graph presents the breakdown of the average annual savings rate in 2024, expressed as a percentage, for several European countries.
PREDICTING FUTURE SAVINGS RATES: AN UNCERTAIN EXERCISE
Looking to the longer term, anticipating how the savings rate will evolve is no easy task. In France, for example, it stood at around 14% at the time of the health crisis, and has now risen to almost 19%. Furthermore, it has not fallen over the last three years as economists repeatedly forecast. Measures such as taxing transitions could encourage senior citizens to “deflate” their savings to help younger generations. We might then project a rate between these two limits of 14% and 19% by 2030, in other words 17.5%. However, what will happen in the meantime with geopolitical crises, economic trends, society’s anxiety and the many other factors that have a direct impact on the savings rate? These factors are hard to predict, so it is difficult to be certain that this forecast will come true.
INVESTMENTS TO PREPARE FOR THE FUTURE
While housing is often the largest component of seniors’ assets, it is not the only financial lever they use to prepare for the future. 6 out of 10 senior citizens said they had made at least one investment for their retirement, with choices varying from country to country. 30% had become homeowners, with the British and Belgians the most likely to invest in property. 21% had succumbed to the charms of life insurance, particularly Polish and French life insurance. 20% had taken out a retirement savings plan, especially the neighbouring countries on the Iberian Peninsula. 18% had bought shares or bonds, following the Germans’ example.
Fig 50 – Financial investments of seniors by country
Download this infographic for your presentations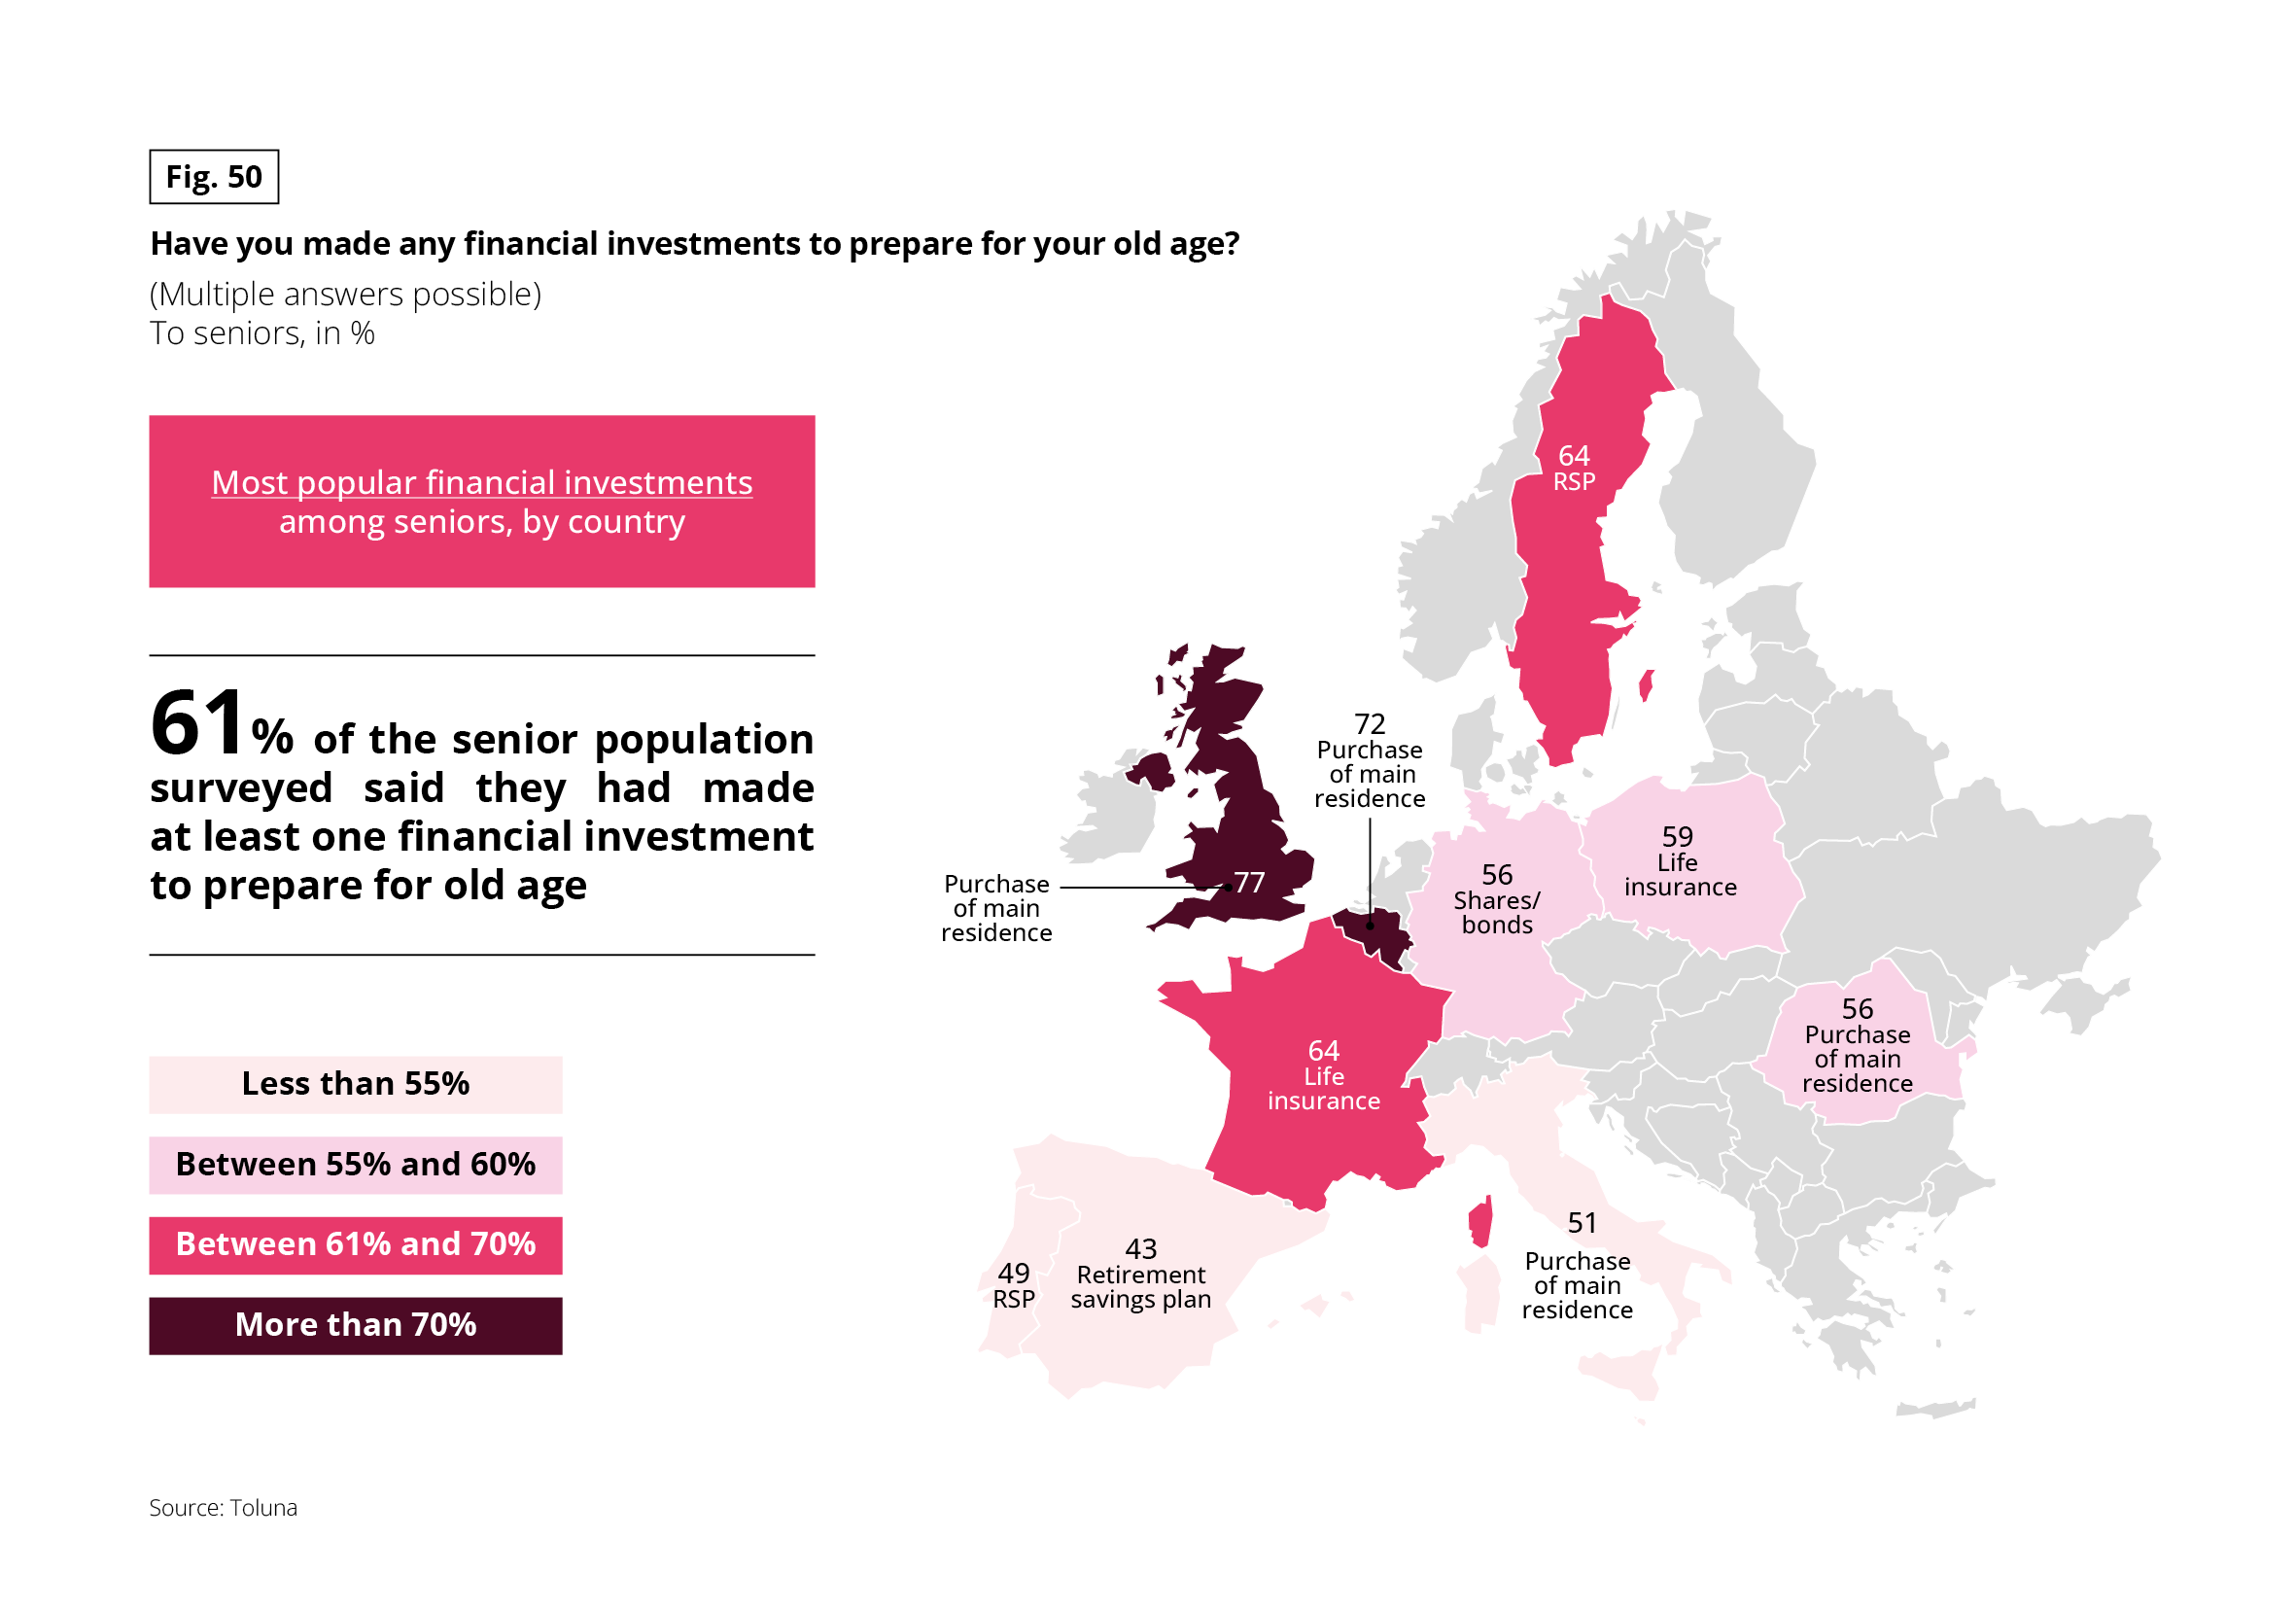 This map presents the percentage of seniors who declare having made at least one financial investment to prepare for their old age.