Growing interest in digital technology


MULTIPLE CONSUMPTION AREAS
In the space of ten years, the number of shoppers in various consumption areas has changed significantly, influenced by the growth of online shopping. In Europe, 15% of purchases are now made online, with Germany, Poland and the UK leading the way in digital consumption. In France, since 2016, e-commerce sales have more than doubled.
Seniors have not been “left behind” by this trend, as the results of this Observatoire Cetelem show. Over the last ten years, we have seen a tectonic shift in their consumption patterns. Their purchases in hypermarkets and supermarkets are down significantly when it comes to food and clothing.
It should be noted that in France, the major hypermarket chains remain popular with consumers, particularly senior citizens, although their market share is declining. Local shops, which are multiplying in urban formats, are holding up well when it comes to food purchases.
On a different note, specialist superstores are experiencing some erosion in the fields of electrical appliances, furniture and home decoration.
Over the last 10 years, the Internet has become particularly active in the areas of electrical appliances, clothing, furniture and decorative items. This growth is particularly marked in the UK and Sweden, and more widely in Europe’s major cities.
Fig 33 – Preferred shopping places for seniors
Download this infographic for your presentations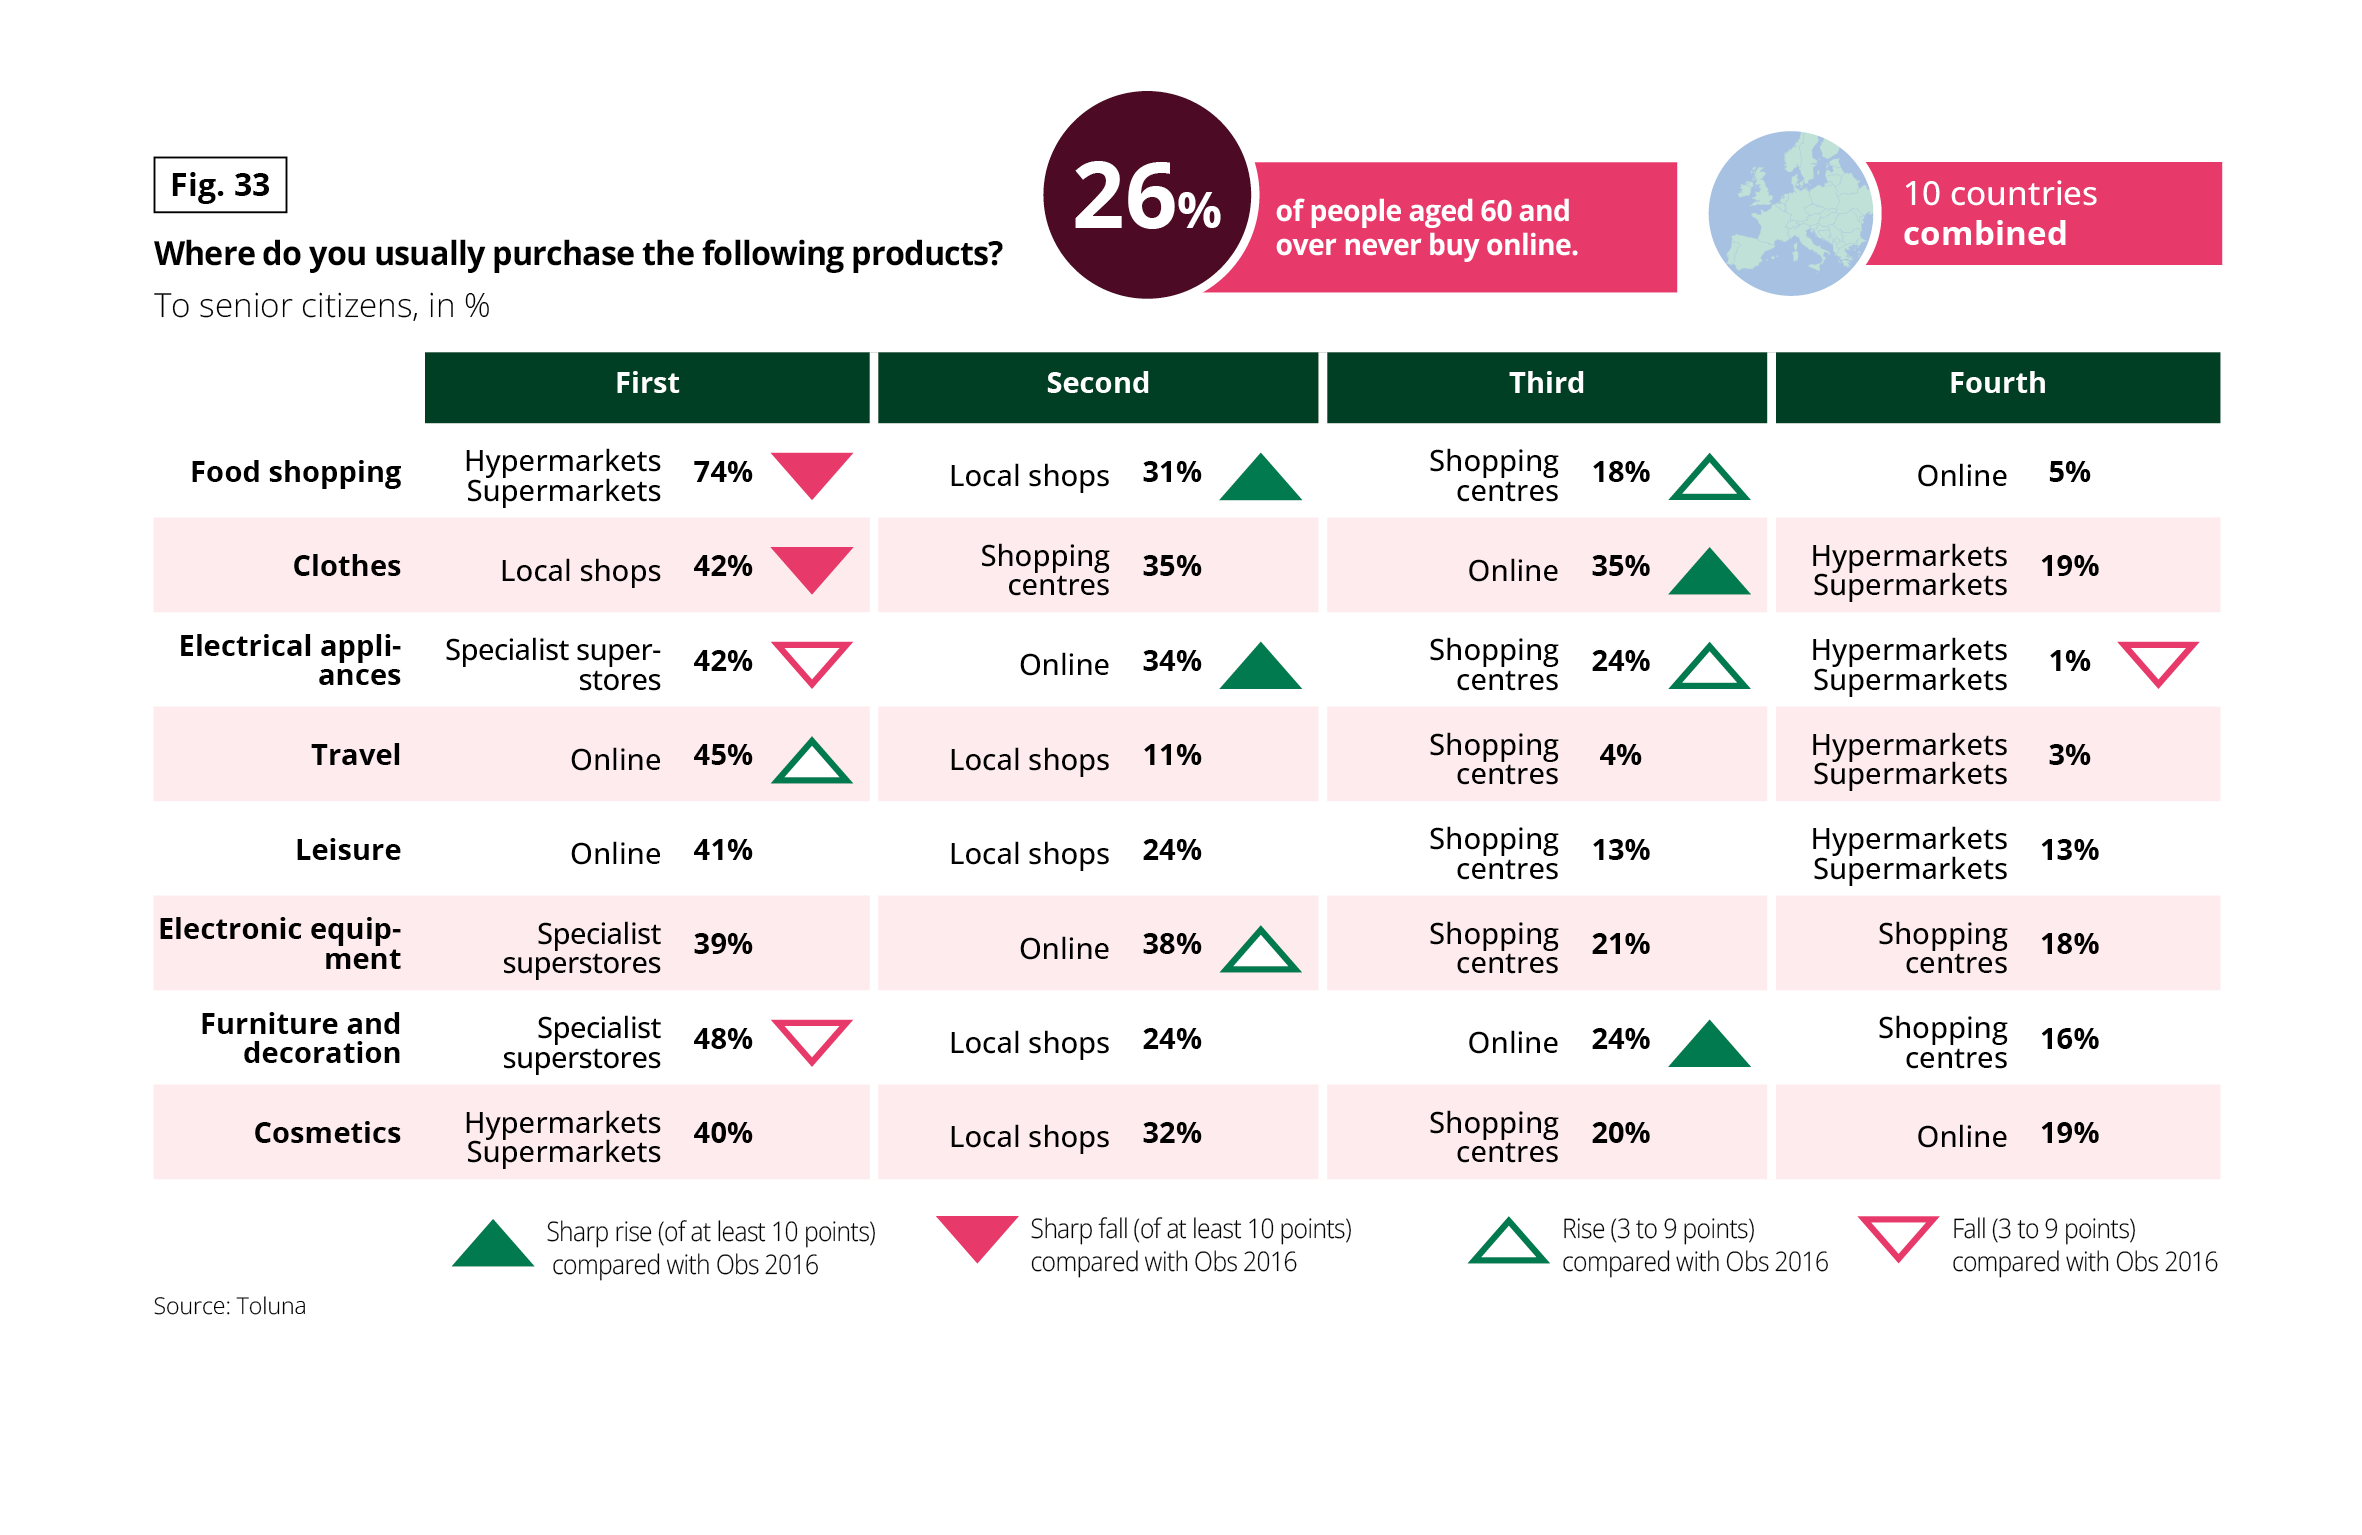 This infographic presents the places where seniors most often buy different types of products, expressed as a percentage. The results are organized by product and frequency: first, second, third, and fourth place of purchase.
A summary box indicates that 26% of people aged 60 and over never shop online, for all ten countries studied.
Food purchases
First: hypermarkets and supermarkets, 74%
Second: local commerce, 31%
Third: shopping centers, 18%
Fourth: internet, 5%
Clothing
First: local commerce, 42%
Second: shopping centers, 35%
Third: internet, 35%
Fourth: hypermarkets and supermarkets, 19%
Electromenager
First: specialized large surfaces, 42%
Second: internet, 34%
Third: shopping centers, 24%
Fourth: hypermarkets and supermarkets, 1%
Travel
First: internet, 45%
Second: local commerce, 11%
Third: shopping centers, 4%
Fourth: hypermarkets and supermarkets, 3%
Leisure
First: internet, 41%
Second: local commerce, 24%
Third: shopping centers, 13%
Fourth: hypermarkets and supermarkets, 13%
Electronic equipment
First: specialized large surfaces, 39%
Second: internet, 38%
Third: shopping centers, 21%
Fourth: shopping centers, 18%
Furniture and decoration
First: specialized large surfaces, 48%
Second: local commerce, 24%
Third: internet, 24%
Fourth: shopping centers, 16%
Cosmetic products
First: hypermarkets and supermarkets, 40%
Second: local commerce, 32%
Third: shopping centers, 20%
Fourth: internet, 19%
Source: Toluna.
This infographic presents the places where seniors most often buy different types of products, expressed as a percentage. The results are organized by product and frequency: first, second, third, and fourth place of purchase.
A summary box indicates that 26% of people aged 60 and over never shop online, for all ten countries studied.
Food purchases
First: hypermarkets and supermarkets, 74%
Second: local commerce, 31%
Third: shopping centers, 18%
Fourth: internet, 5%
Clothing
First: local commerce, 42%
Second: shopping centers, 35%
Third: internet, 35%
Fourth: hypermarkets and supermarkets, 19%
Electromenager
First: specialized large surfaces, 42%
Second: internet, 34%
Third: shopping centers, 24%
Fourth: hypermarkets and supermarkets, 1%
Travel
First: internet, 45%
Second: local commerce, 11%
Third: shopping centers, 4%
Fourth: hypermarkets and supermarkets, 3%
Leisure
First: internet, 41%
Second: local commerce, 24%
Third: shopping centers, 13%
Fourth: hypermarkets and supermarkets, 13%
Electronic equipment
First: specialized large surfaces, 39%
Second: internet, 38%
Third: shopping centers, 21%
Fourth: shopping centers, 18%
Furniture and decoration
First: specialized large surfaces, 48%
Second: local commerce, 24%
Third: internet, 24%
Fourth: shopping centers, 16%
Cosmetic products
First: hypermarkets and supermarkets, 40%
Second: local commerce, 32%
Third: shopping centers, 20%
Fourth: internet, 19%
Source: Toluna.
THE SPECTACULAR GROWTH OF E-COMMERCE
According to Shopify, global e-commerce sales reached $6 trillion in 2024 and are projected to hit $8 trillion in 2028, with growth of 7% to 8% over this period. In Europe, in just over 15 years, this turnover has multiplied by just over 5, representing 898 billion euros in 2025 (source: European E-commerce report).
The top five European economies (Germany, Spain, France, Italy and the United Kingdom) will also see strong growth, with total e-commerce sales rising from €389 billion in 2024 to €565 billion in 2029.
Fig 34 – Evolution of European e-commerce turnover
Download this infographic for your presentations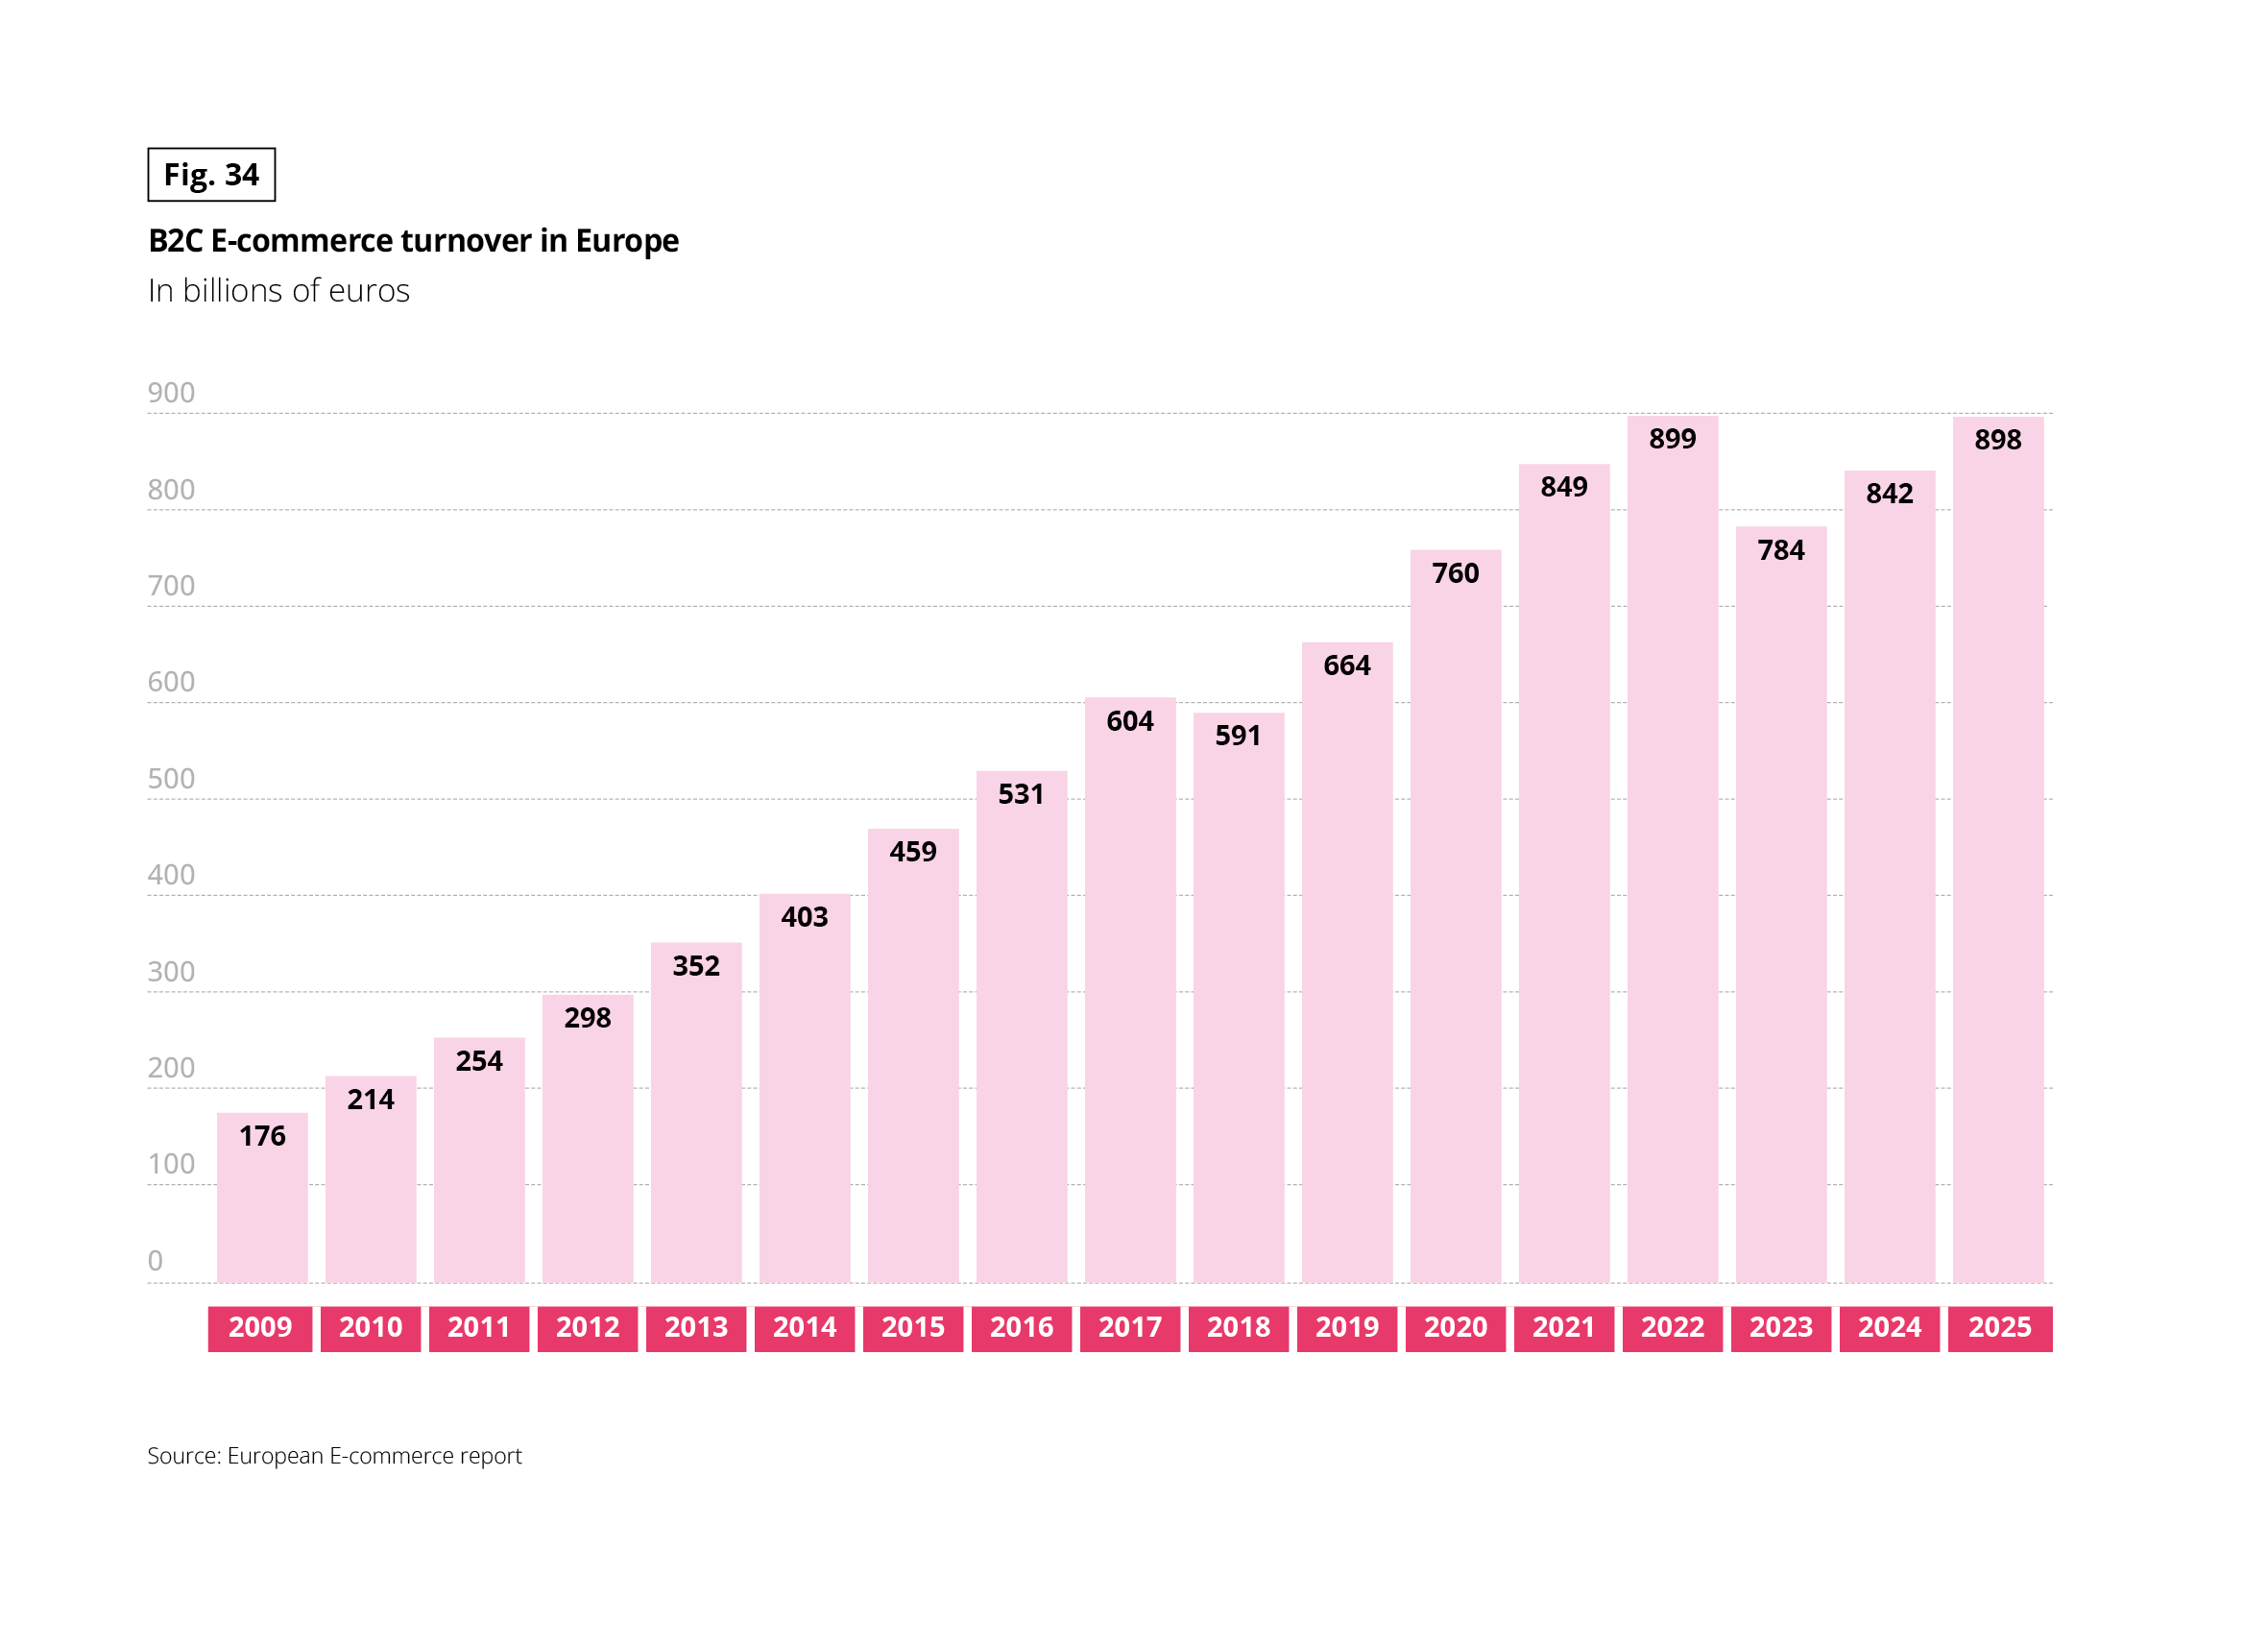 This infographic presents the evolution of B2C e-commerce turnover in Europe, expressed in billions of euros, from 2009 to 2025.
Main values:
2009: 176
2012: 298
2015: 459
2017: 604
2018: 591
2019: 664
2020: 760
2021: 849
2022: 899
2023: 784
2024: 842
2025: 898
The main information is a global increase in turnover over the period, with recent fluctuations.
Source: European E-commerce Report.
This infographic presents the evolution of B2C e-commerce turnover in Europe, expressed in billions of euros, from 2009 to 2025.
Main values:
2009: 176
2012: 298
2015: 459
2017: 604
2018: 591
2019: 664
2020: 760
2021: 849
2022: 899
2023: 784
2024: 842
2025: 898
The main information is a global increase in turnover over the period, with recent fluctuations.
Source: European E-commerce Report.
FRANCE IN DIGITAL FORM
In 2023, France became Europe’s leading e-commerce nation, having displayed steady growth in this sector since 2012. Gender is not a distinguishing factor when it comes to online shopping, but age is. Younger generations are the most active in this area, but after the age of 50, the practice is also widespread.
Six out of ten people aged between 60 and 74 had made at least one online purchase in the last 12 months.
From a socio-professional point of view, all categories used e-commerce, with intermediary professions, executives and senior professionals at the forefront.
Fig 35 – E-commerce turnover by country
Download this infographic for your presentations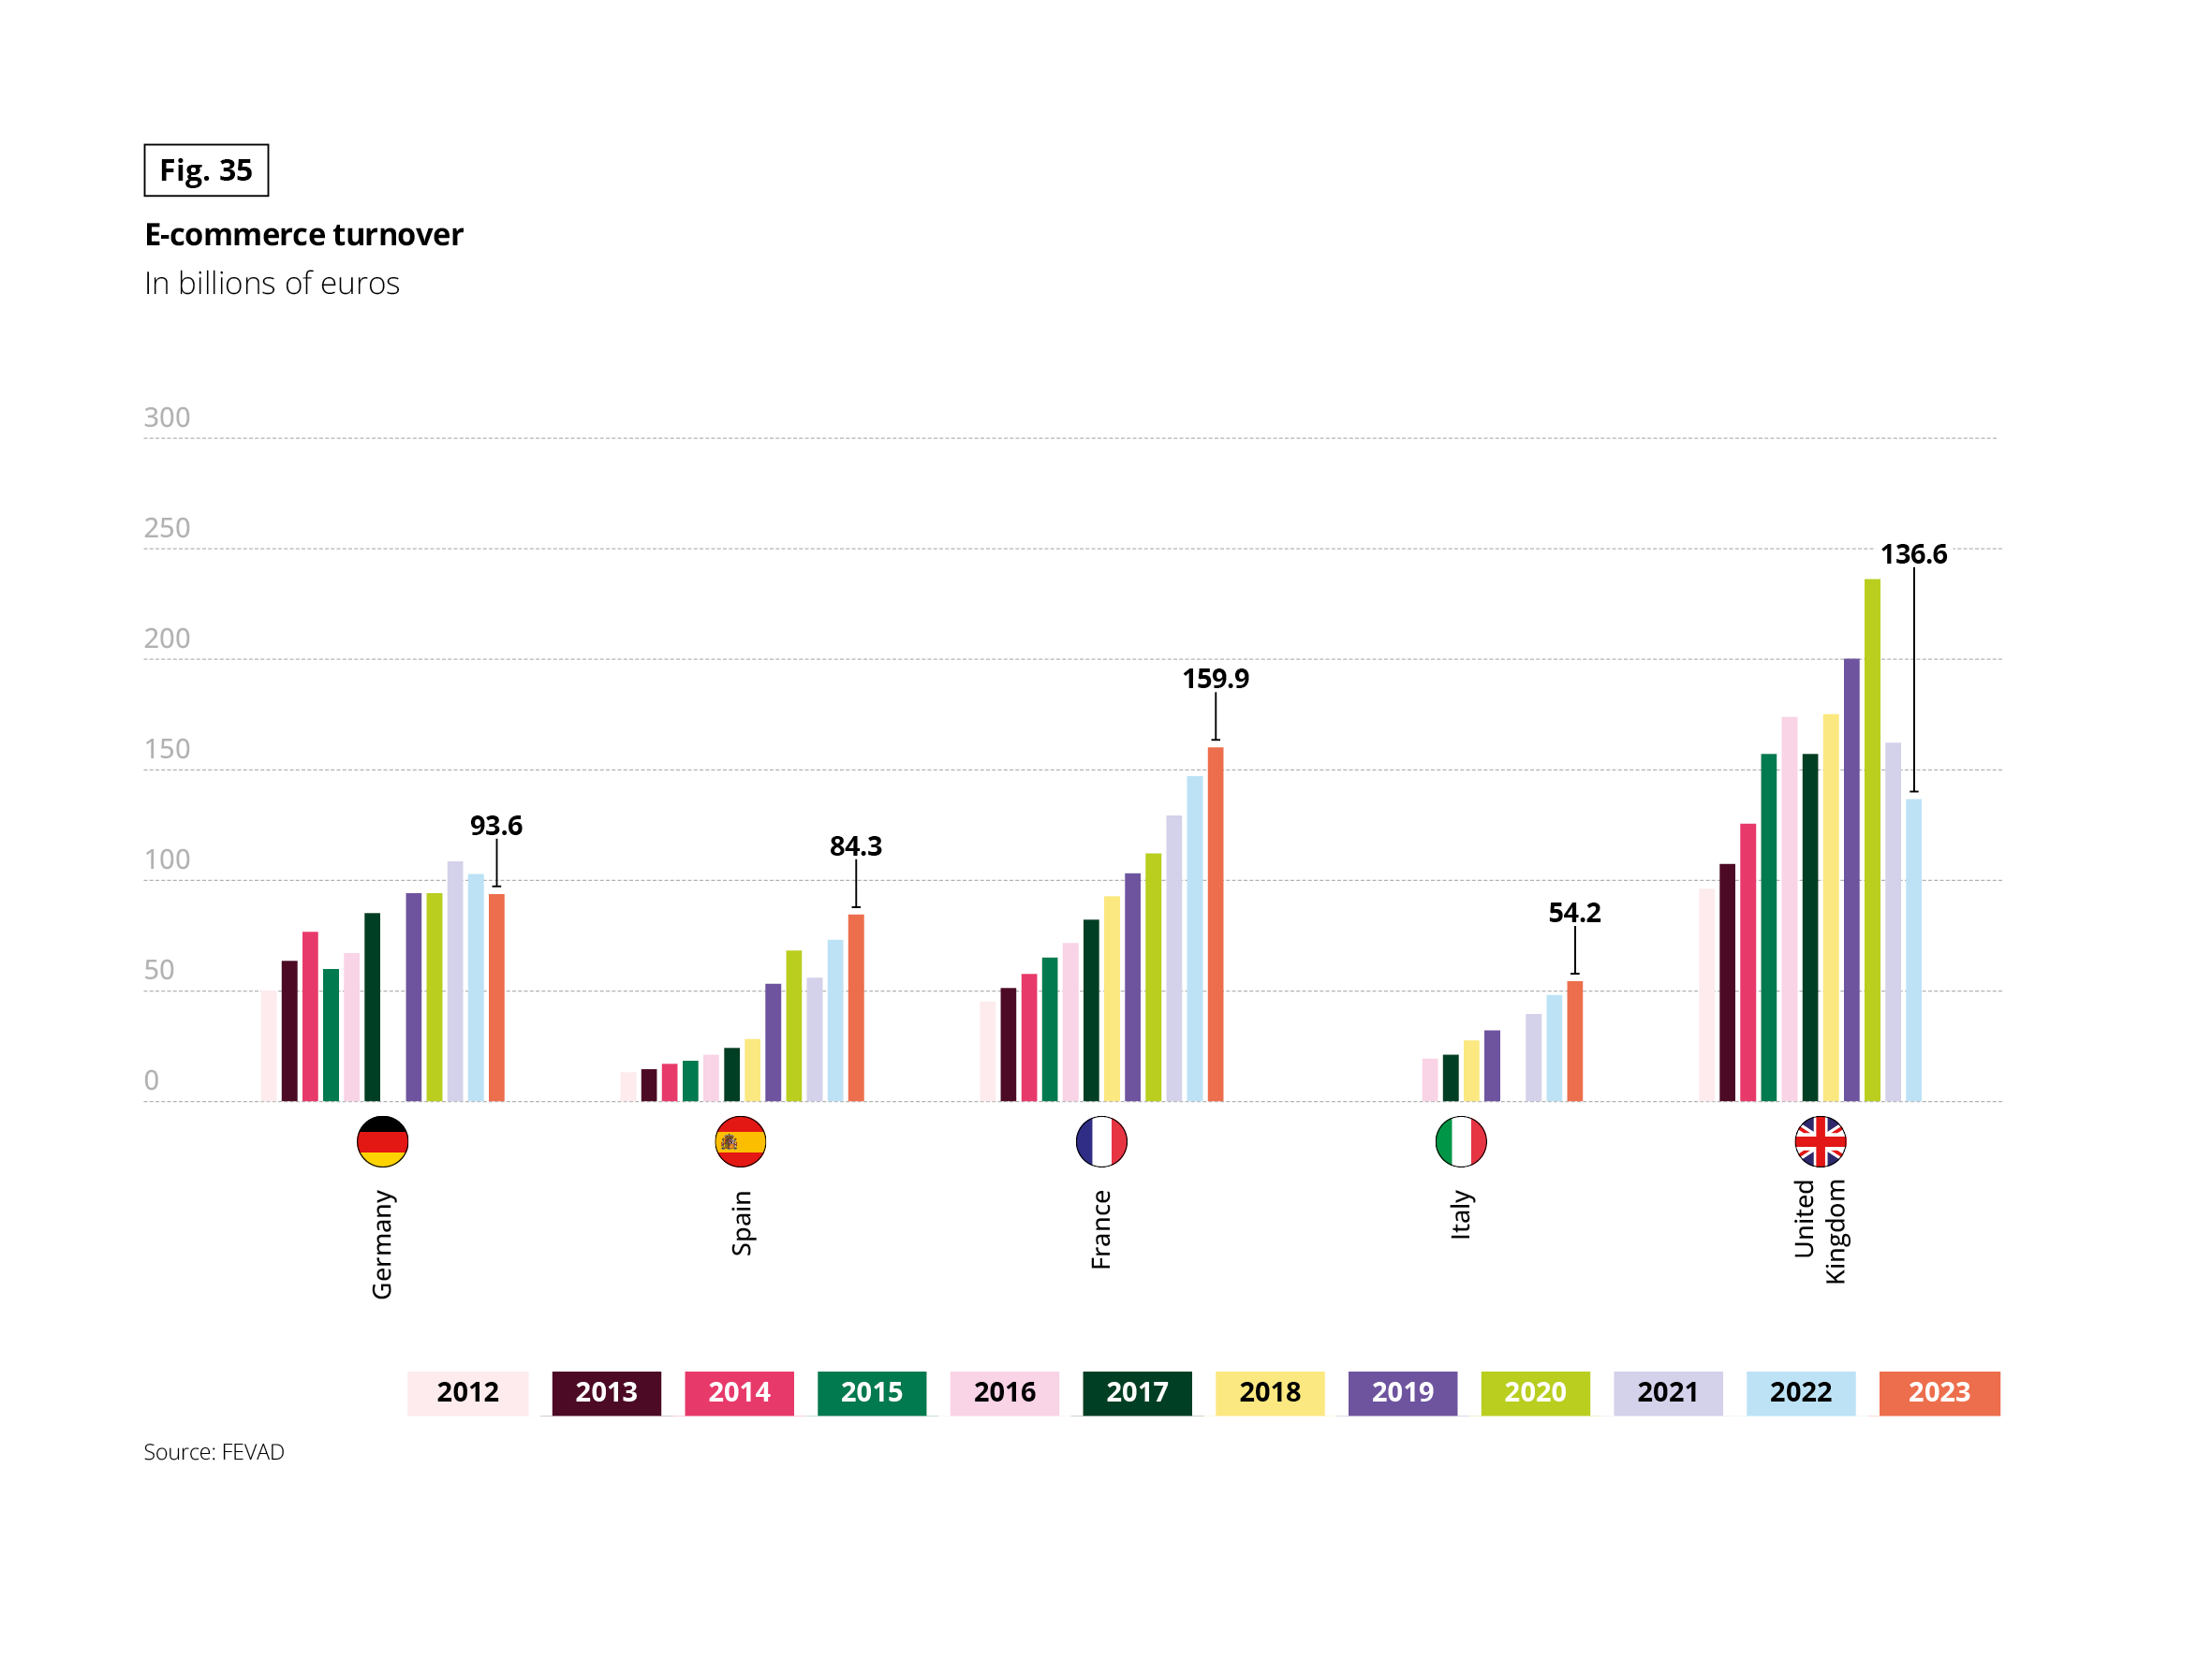 This infographic compares e-commerce turnover, in billions of euros, for five European countries between 2012 and 2023: Germany, Spain, France, Italy, and the United Kingdom.
Highlighted values for 2023:
Germany: 93.6 billion euros
Spain: 84.3 billion euros
France: 159.9 billion euros
Italy: 54.2 billion euros
United Kingdom: 136.6 billion euros
The main information is a marked growth in e-commerce turnover in each of the observed countries over the period.
Source: FEVAD.
This infographic compares e-commerce turnover, in billions of euros, for five European countries between 2012 and 2023: Germany, Spain, France, Italy, and the United Kingdom.
Highlighted values for 2023:
Germany: 93.6 billion euros
Spain: 84.3 billion euros
France: 159.9 billion euros
Italy: 54.2 billion euros
United Kingdom: 136.6 billion euros
The main information is a marked growth in e-commerce turnover in each of the observed countries over the period.
Source: FEVAD.
Fig 36 – Profile of online buyers in France
Download this infographic for your presentations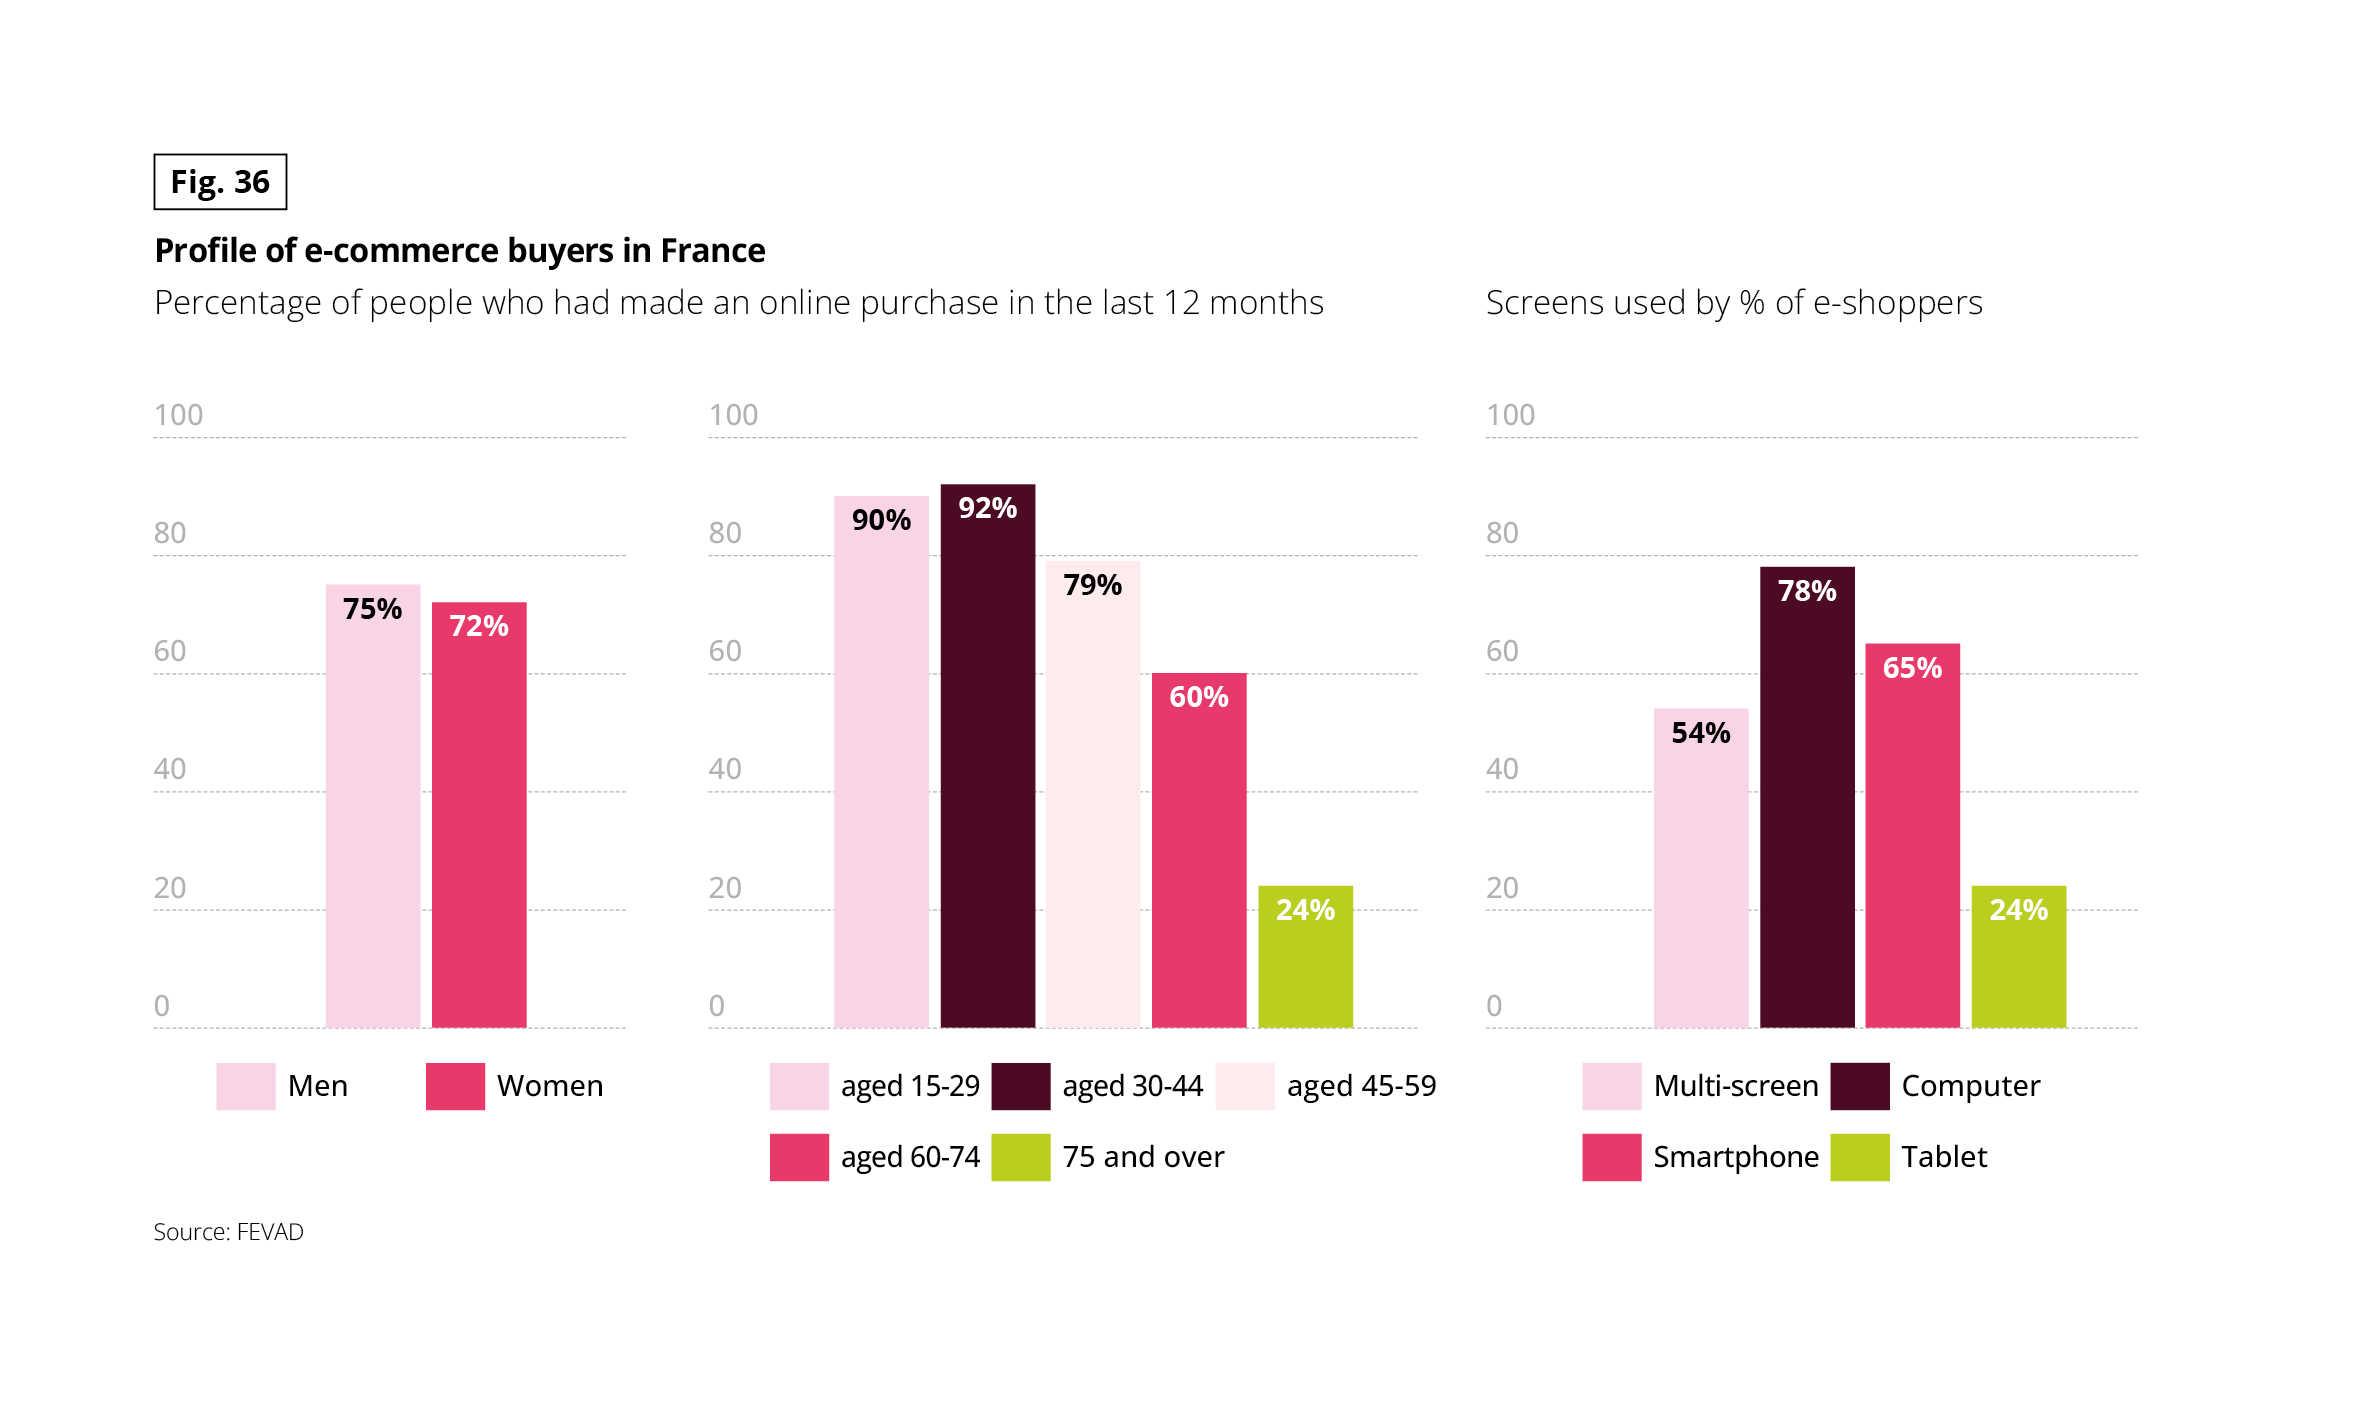 This infographic presents the profile of e-commerce buyers in France according to three dimensions: sex, age, and type of screen used. The data corresponds to the rate of people who have made at least one online purchase in the last 12 months.
By sex:
Men: 75%
Women: 72%
By age:
15-29 years: 90%
30-44 years: 92%
45-59 years: 79%
60-74 years: 60%
75 years and over: 24%
By screens used by e-buyers:
Computer: 78%
Phone: 65%
Multi-screen: 54%
Tablet: 24%
Source: FEVAD.
This infographic presents the profile of e-commerce buyers in France according to three dimensions: sex, age, and type of screen used. The data corresponds to the rate of people who have made at least one online purchase in the last 12 months.
By sex:
Men: 75%
Women: 72%
By age:
15-29 years: 90%
30-44 years: 92%
45-59 years: 79%
60-74 years: 60%
75 years and over: 24%
By screens used by e-buyers:
Computer: 78%
Phone: 65%
Multi-screen: 54%
Tablet: 24%
Source: FEVAD.
Fig 37 – Online purchases by socio-professional category
Download this infographic for your presentations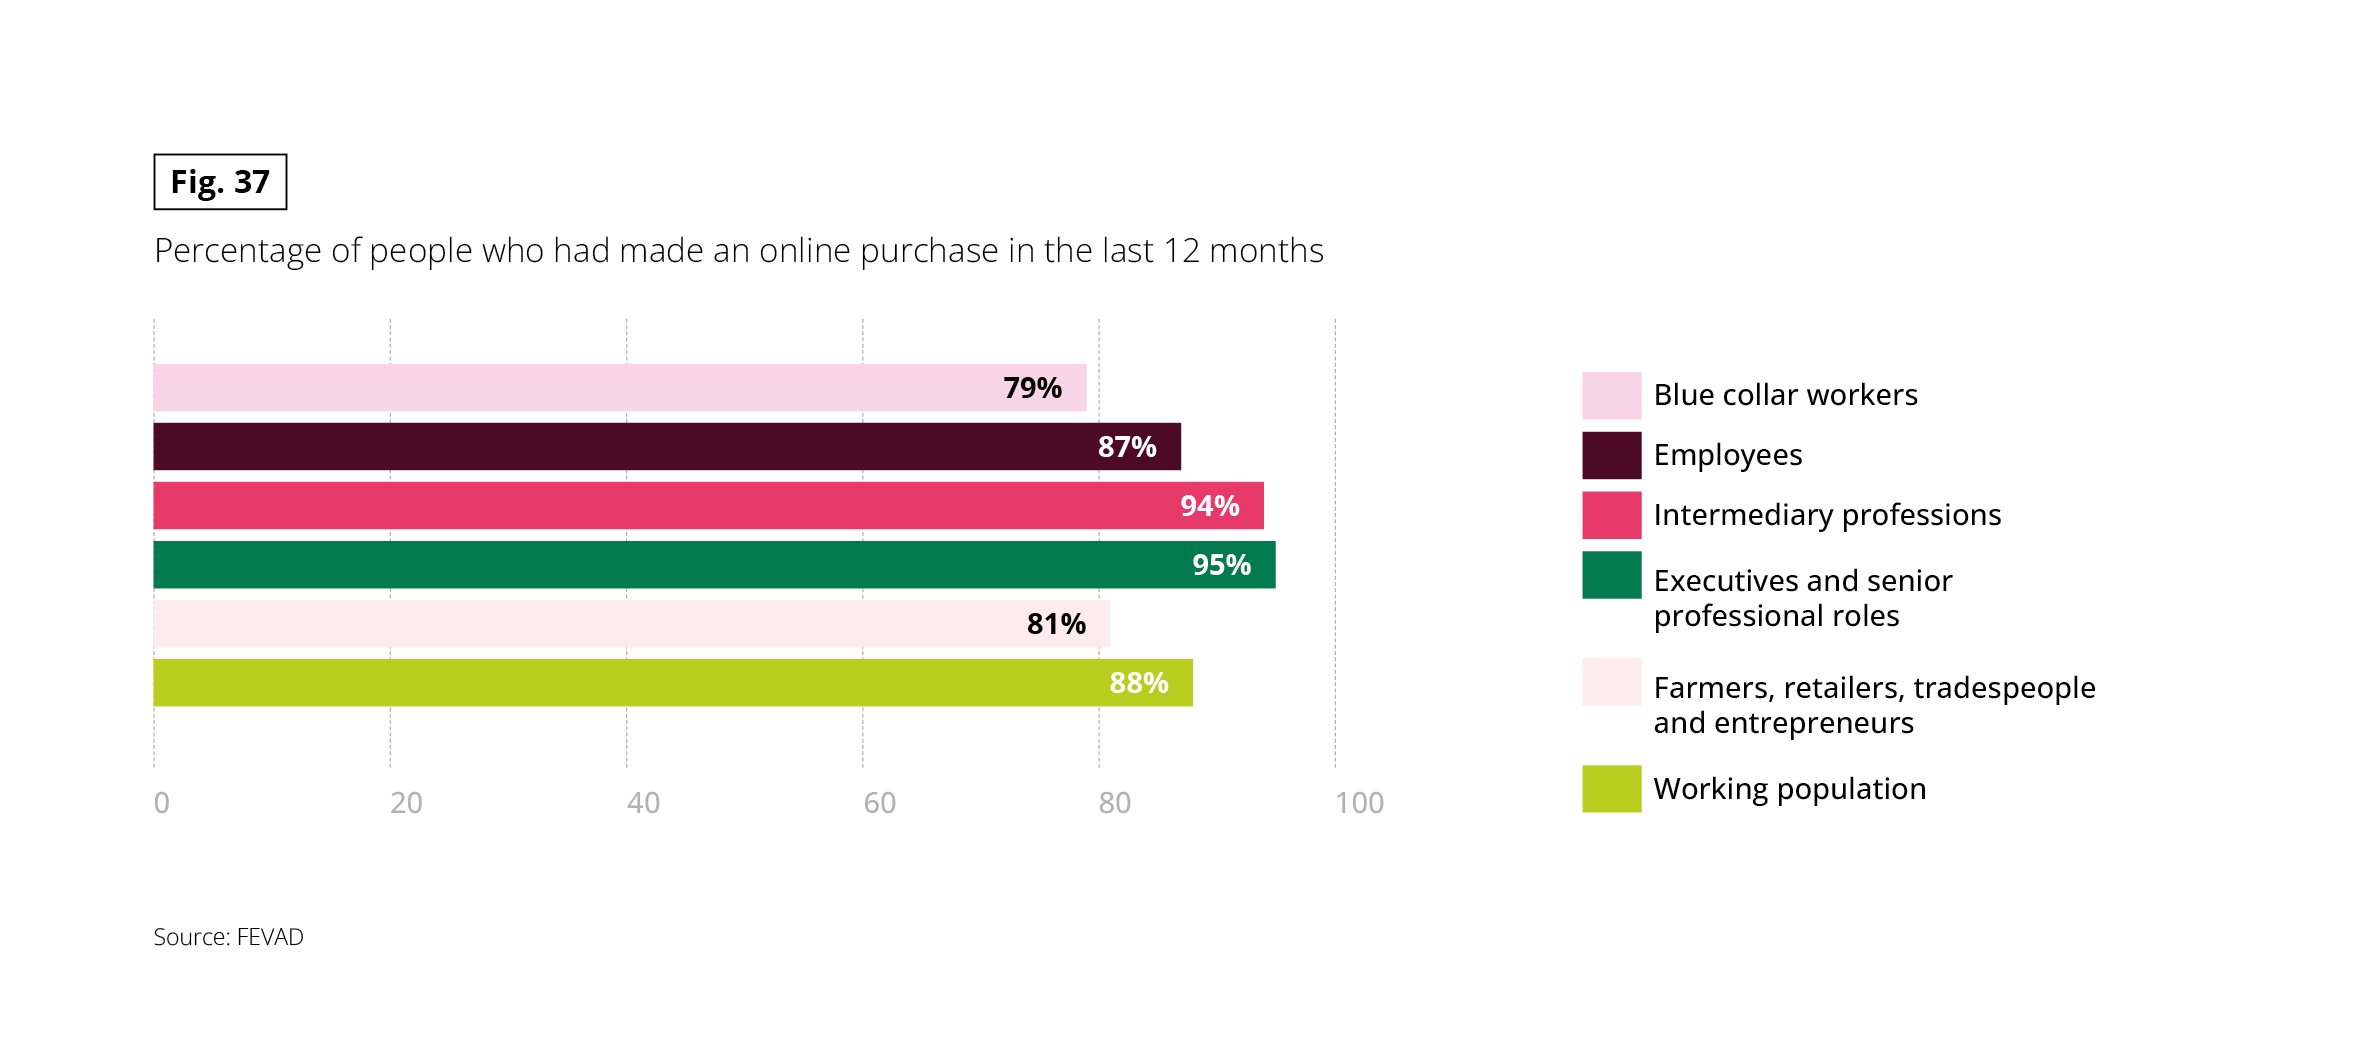 This infographic presents the rate of people who have made an online purchase in the last 12 months, expressed as a percentage, according to socio-professional category.
SEARCHING FOR INFORMATION ONLINE
The preference for physical points of sale is confirmed by the purchasing habits of senior citizens. To compare products, there is nothing like visiting points of sale. 8 out of 10 senior citizens stroll the aisles of shops to get an idea of what they want. However, the digitisation of purchasing habits has made significant progress since the 2016 study.
This is particularly the case when it comes to searching for comments posted online by consumers. It is also worth noting that artificial intelligence is becoming a reality, with 1 in 5 senior citizens claiming to be using its capabilities. Whether for health or consumption, the over-60s are positive about the use of new technologies, even the most advanced ones.
Fig 38 – Pre-purchase information practices by age
Download this infographic for your presentations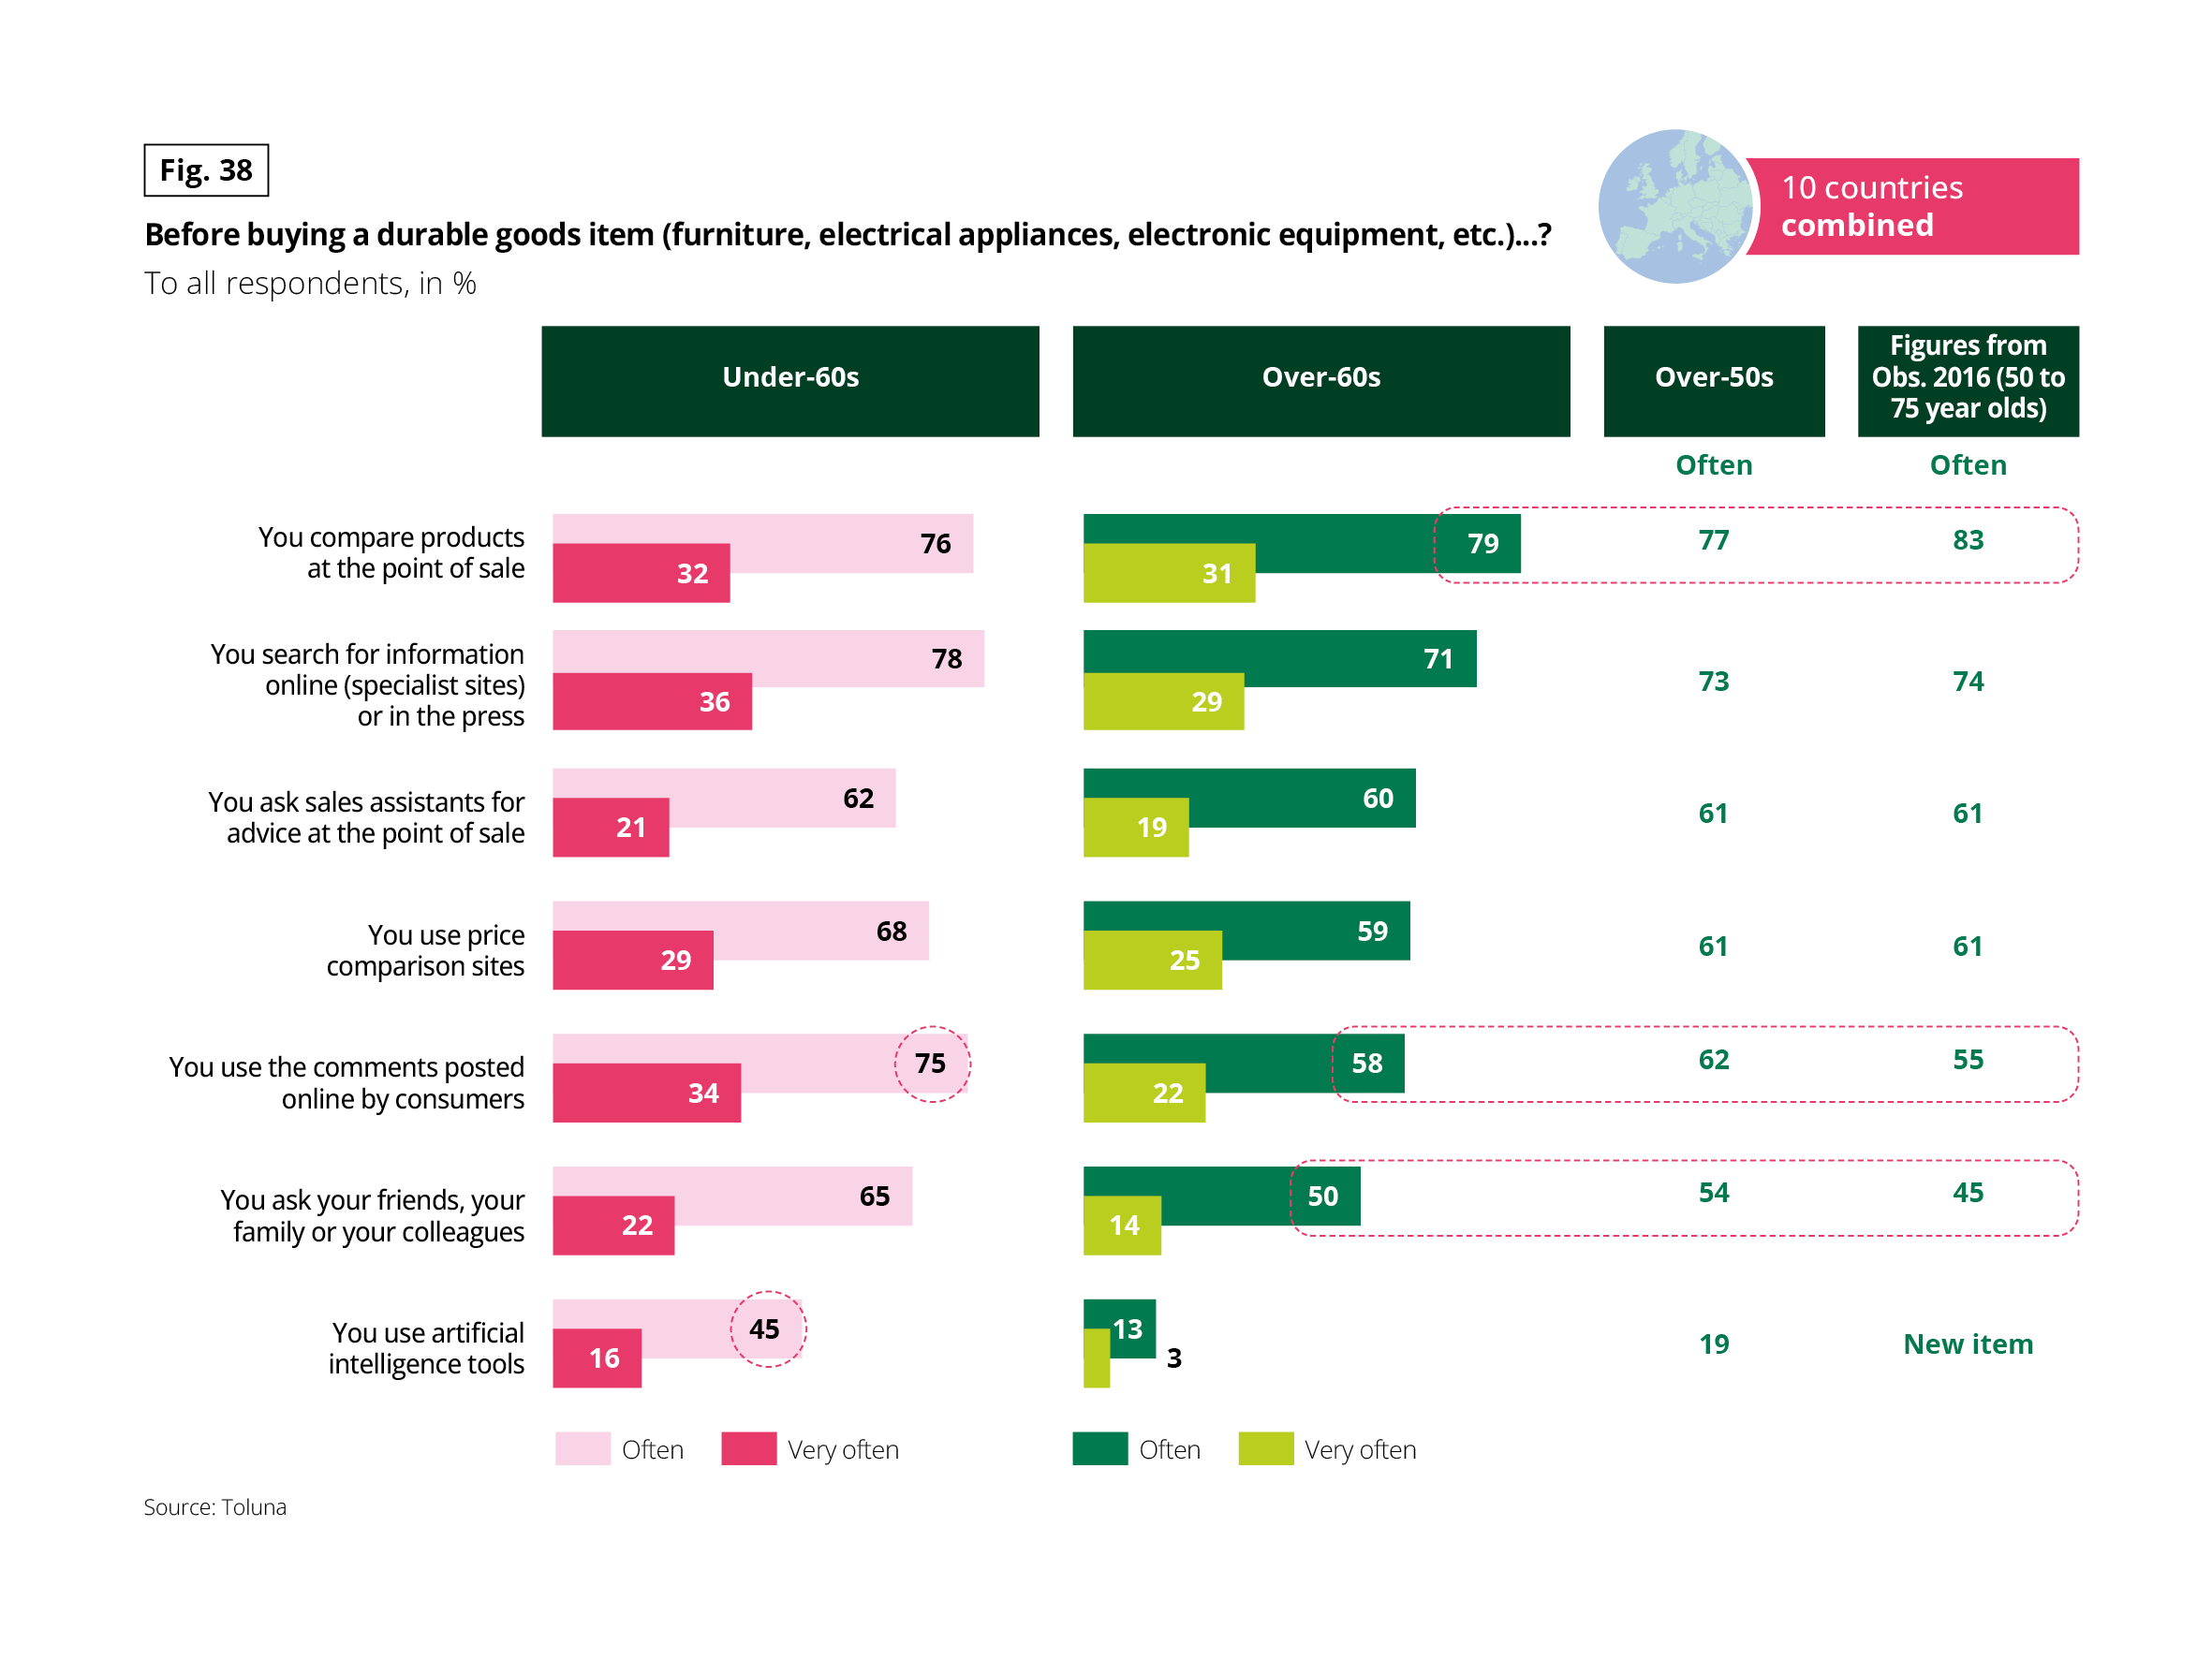 This graph compares the practices used before purchasing a piece of equipment according to age, expressed as a percentage of “often” and “very often” responses.
Among those under 60, the most frequent practices are: researching information online or in the press (78%), comparing products in-store (76%), and consulting online reviews (75%). 45% claim to use artificial intelligence tools, with 16% using them very often.
Among those 60 and older, the dominant practices are comparing products in-store (79%) and researching information online or in the press (71%). The use of artificial intelligence is reported by 13%, with 3% using it very often.
The dotted frames indicate comparisons with previous data or other age groups.
Source: Toluna.
This graph compares the practices used before purchasing a piece of equipment according to age, expressed as a percentage of “often” and “very often” responses.
Among those under 60, the most frequent practices are: researching information online or in the press (78%), comparing products in-store (76%), and consulting online reviews (75%). 45% claim to use artificial intelligence tools, with 16% using them very often.
Among those 60 and older, the dominant practices are comparing products in-store (79%) and researching information online or in the press (71%). The use of artificial intelligence is reported by 13%, with 3% using it very often.
The dotted frames indicate comparisons with previous data or other age groups.
Source: Toluna.
USING THE WEB FOR LEISURE FIRST AND FOREMOST
When they go online, 45% of seniors are most likely to spend on travel. The Swedes, the British and the Italians stood out in this ranking for this type of purchase. The second type of purchase most frequently made online confirms seniors’ digital approach to leisure-related consumption.
Electronic equipment, clothing and electrical appliances attracted just over a third of online buyers, particularly in the UK and Germany. Whatever the type of purchase, French seniors always scored below the European average.
Fig 39 – Online purchases by seniors by product
Download this infographic for your presentations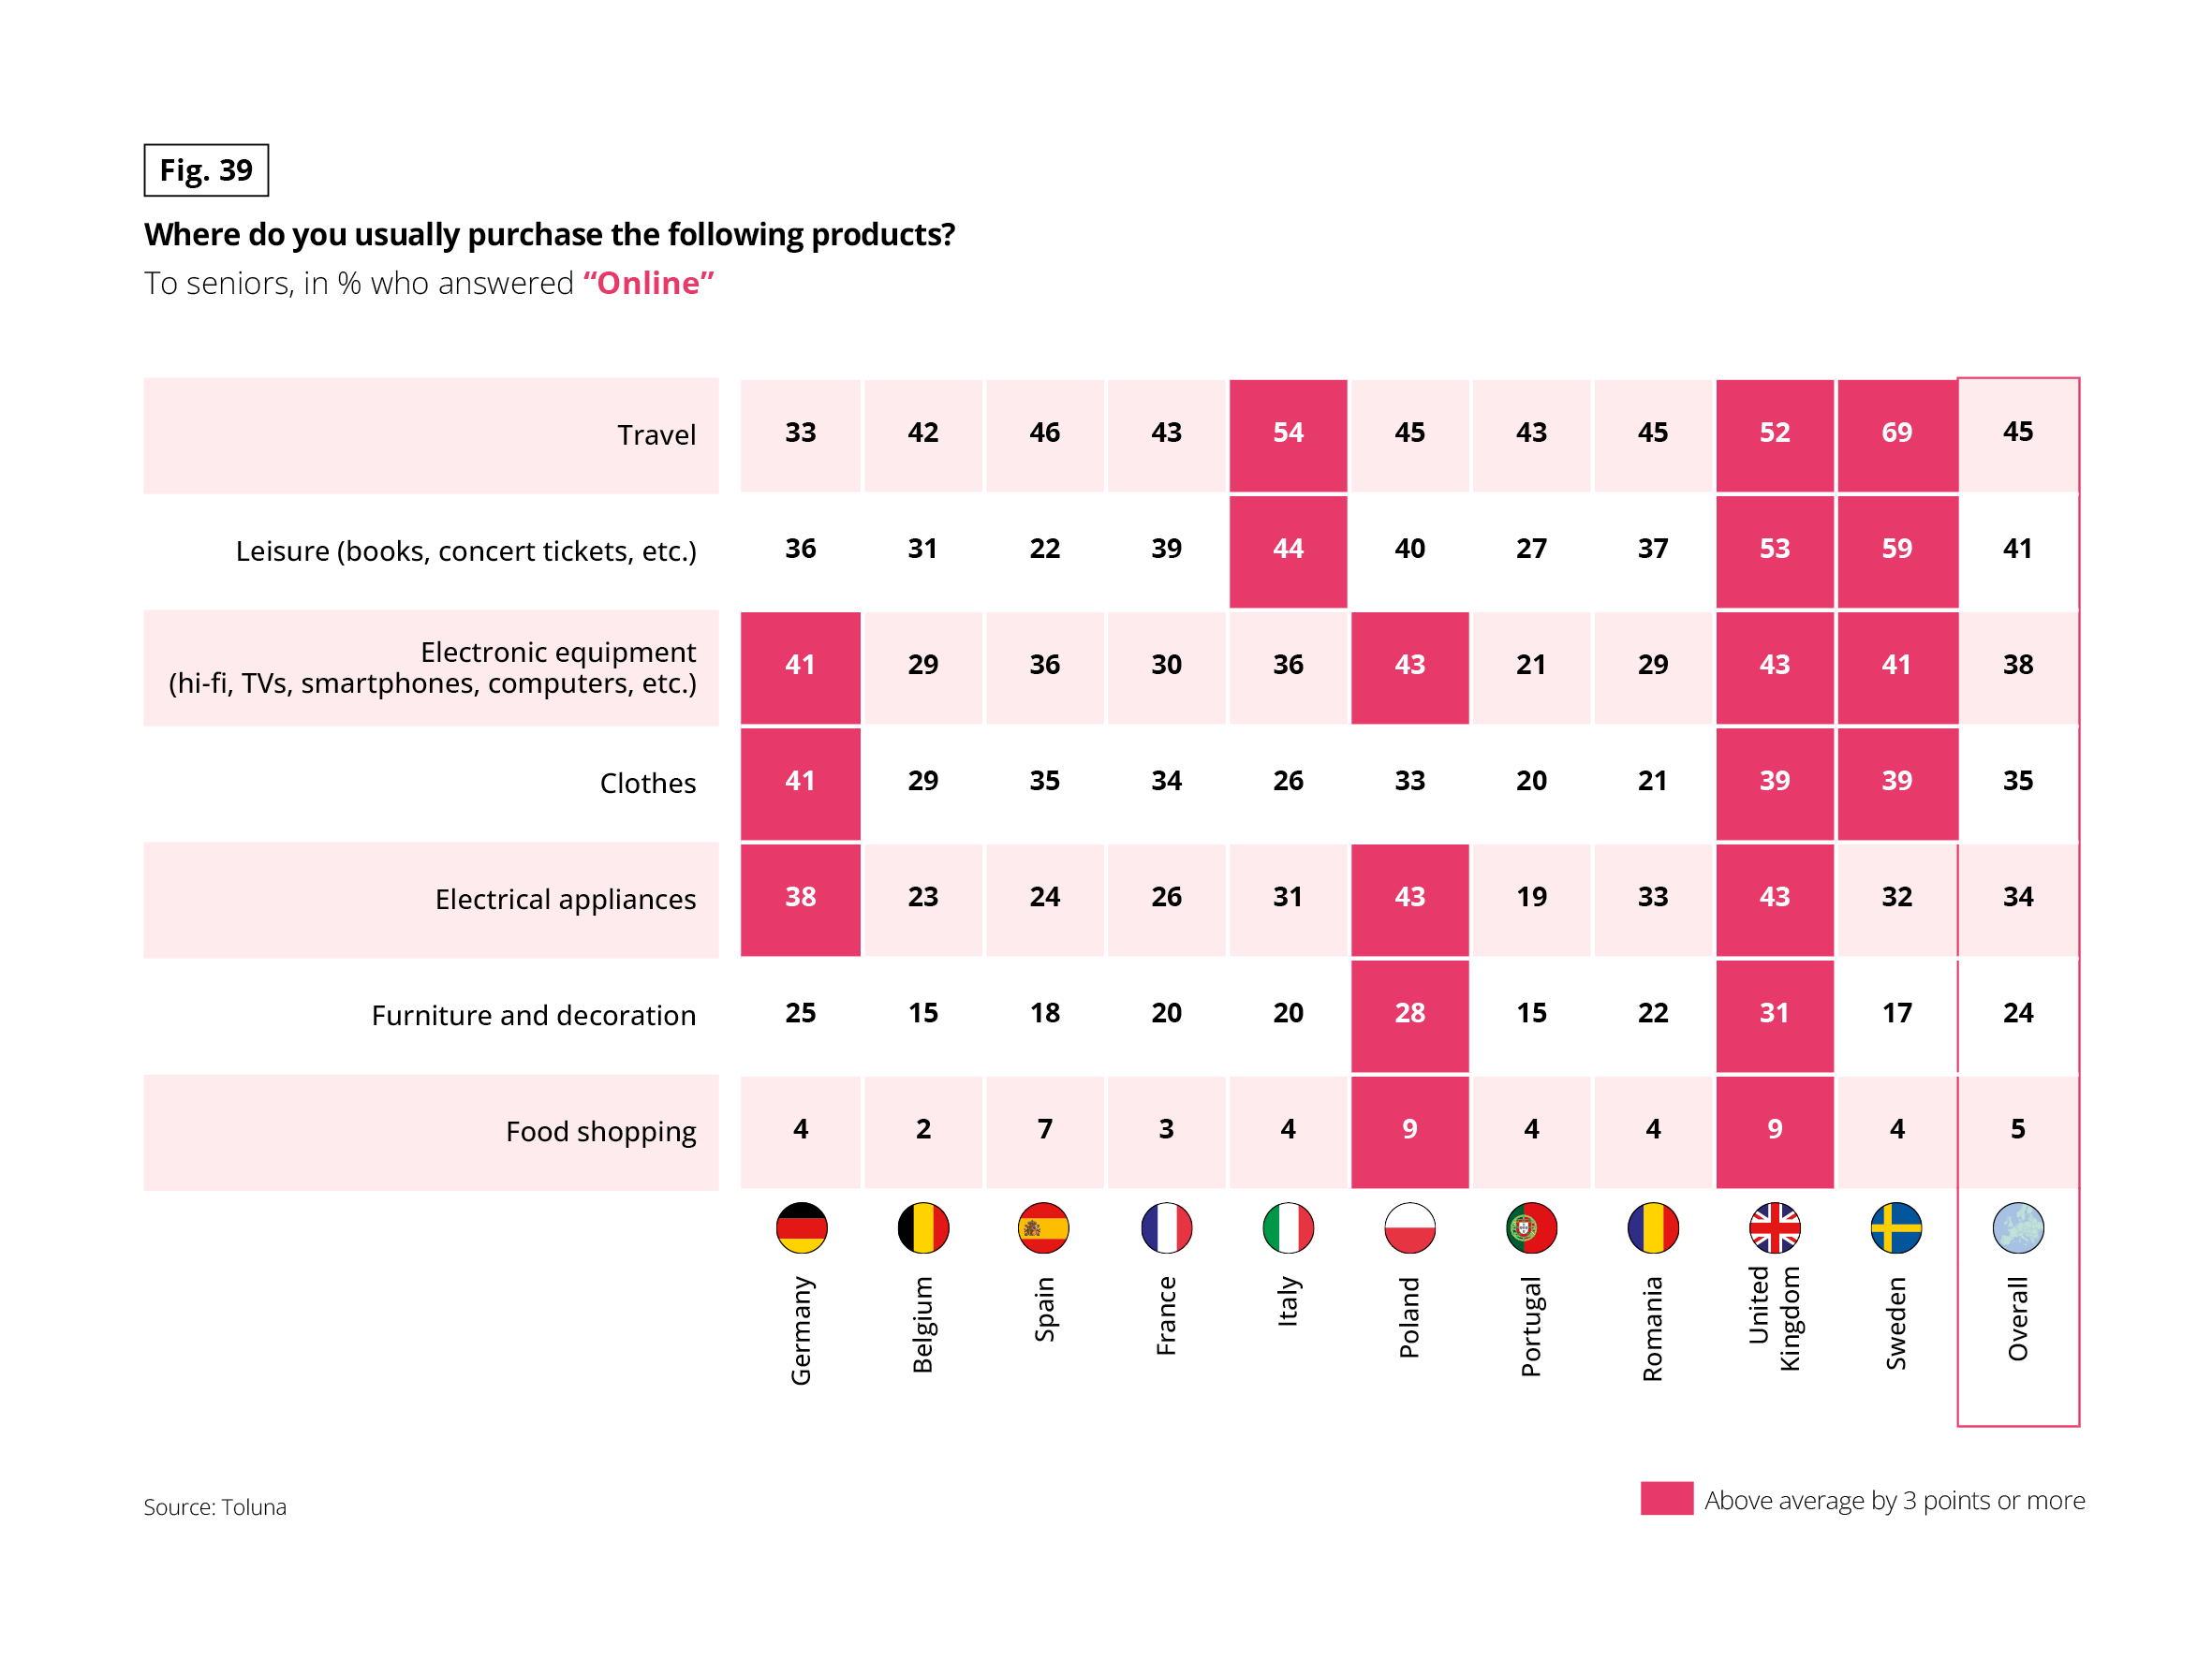 This table presents, for seniors, the share of purchases made online according to the type of product and country, expressed as a percentage.
Online purchases primarily concern travel, with high values in the United Kingdom (52%), Sweden (69%), and Italy (54%). Leisure activities come next, with 59% in Sweden and 53% in the United Kingdom. For electronic equipment, rates vary from 21% in Portugal to 43% in Poland and the United Kingdom. Food purchases remain low in all countries, ranging from 2% to 9%.
Source: Toluna.
This table presents, for seniors, the share of purchases made online according to the type of product and country, expressed as a percentage.
Online purchases primarily concern travel, with high values in the United Kingdom (52%), Sweden (69%), and Italy (54%). Leisure activities come next, with 59% in Sweden and 53% in the United Kingdom. For electronic equipment, rates vary from 21% in Portugal to 43% in Poland and the United Kingdom. Food purchases remain low in all countries, ranging from 2% to 9%.
Source: Toluna.
Fig 40 – Share of e-commerce by age in Europe
Download this infographic for your presentations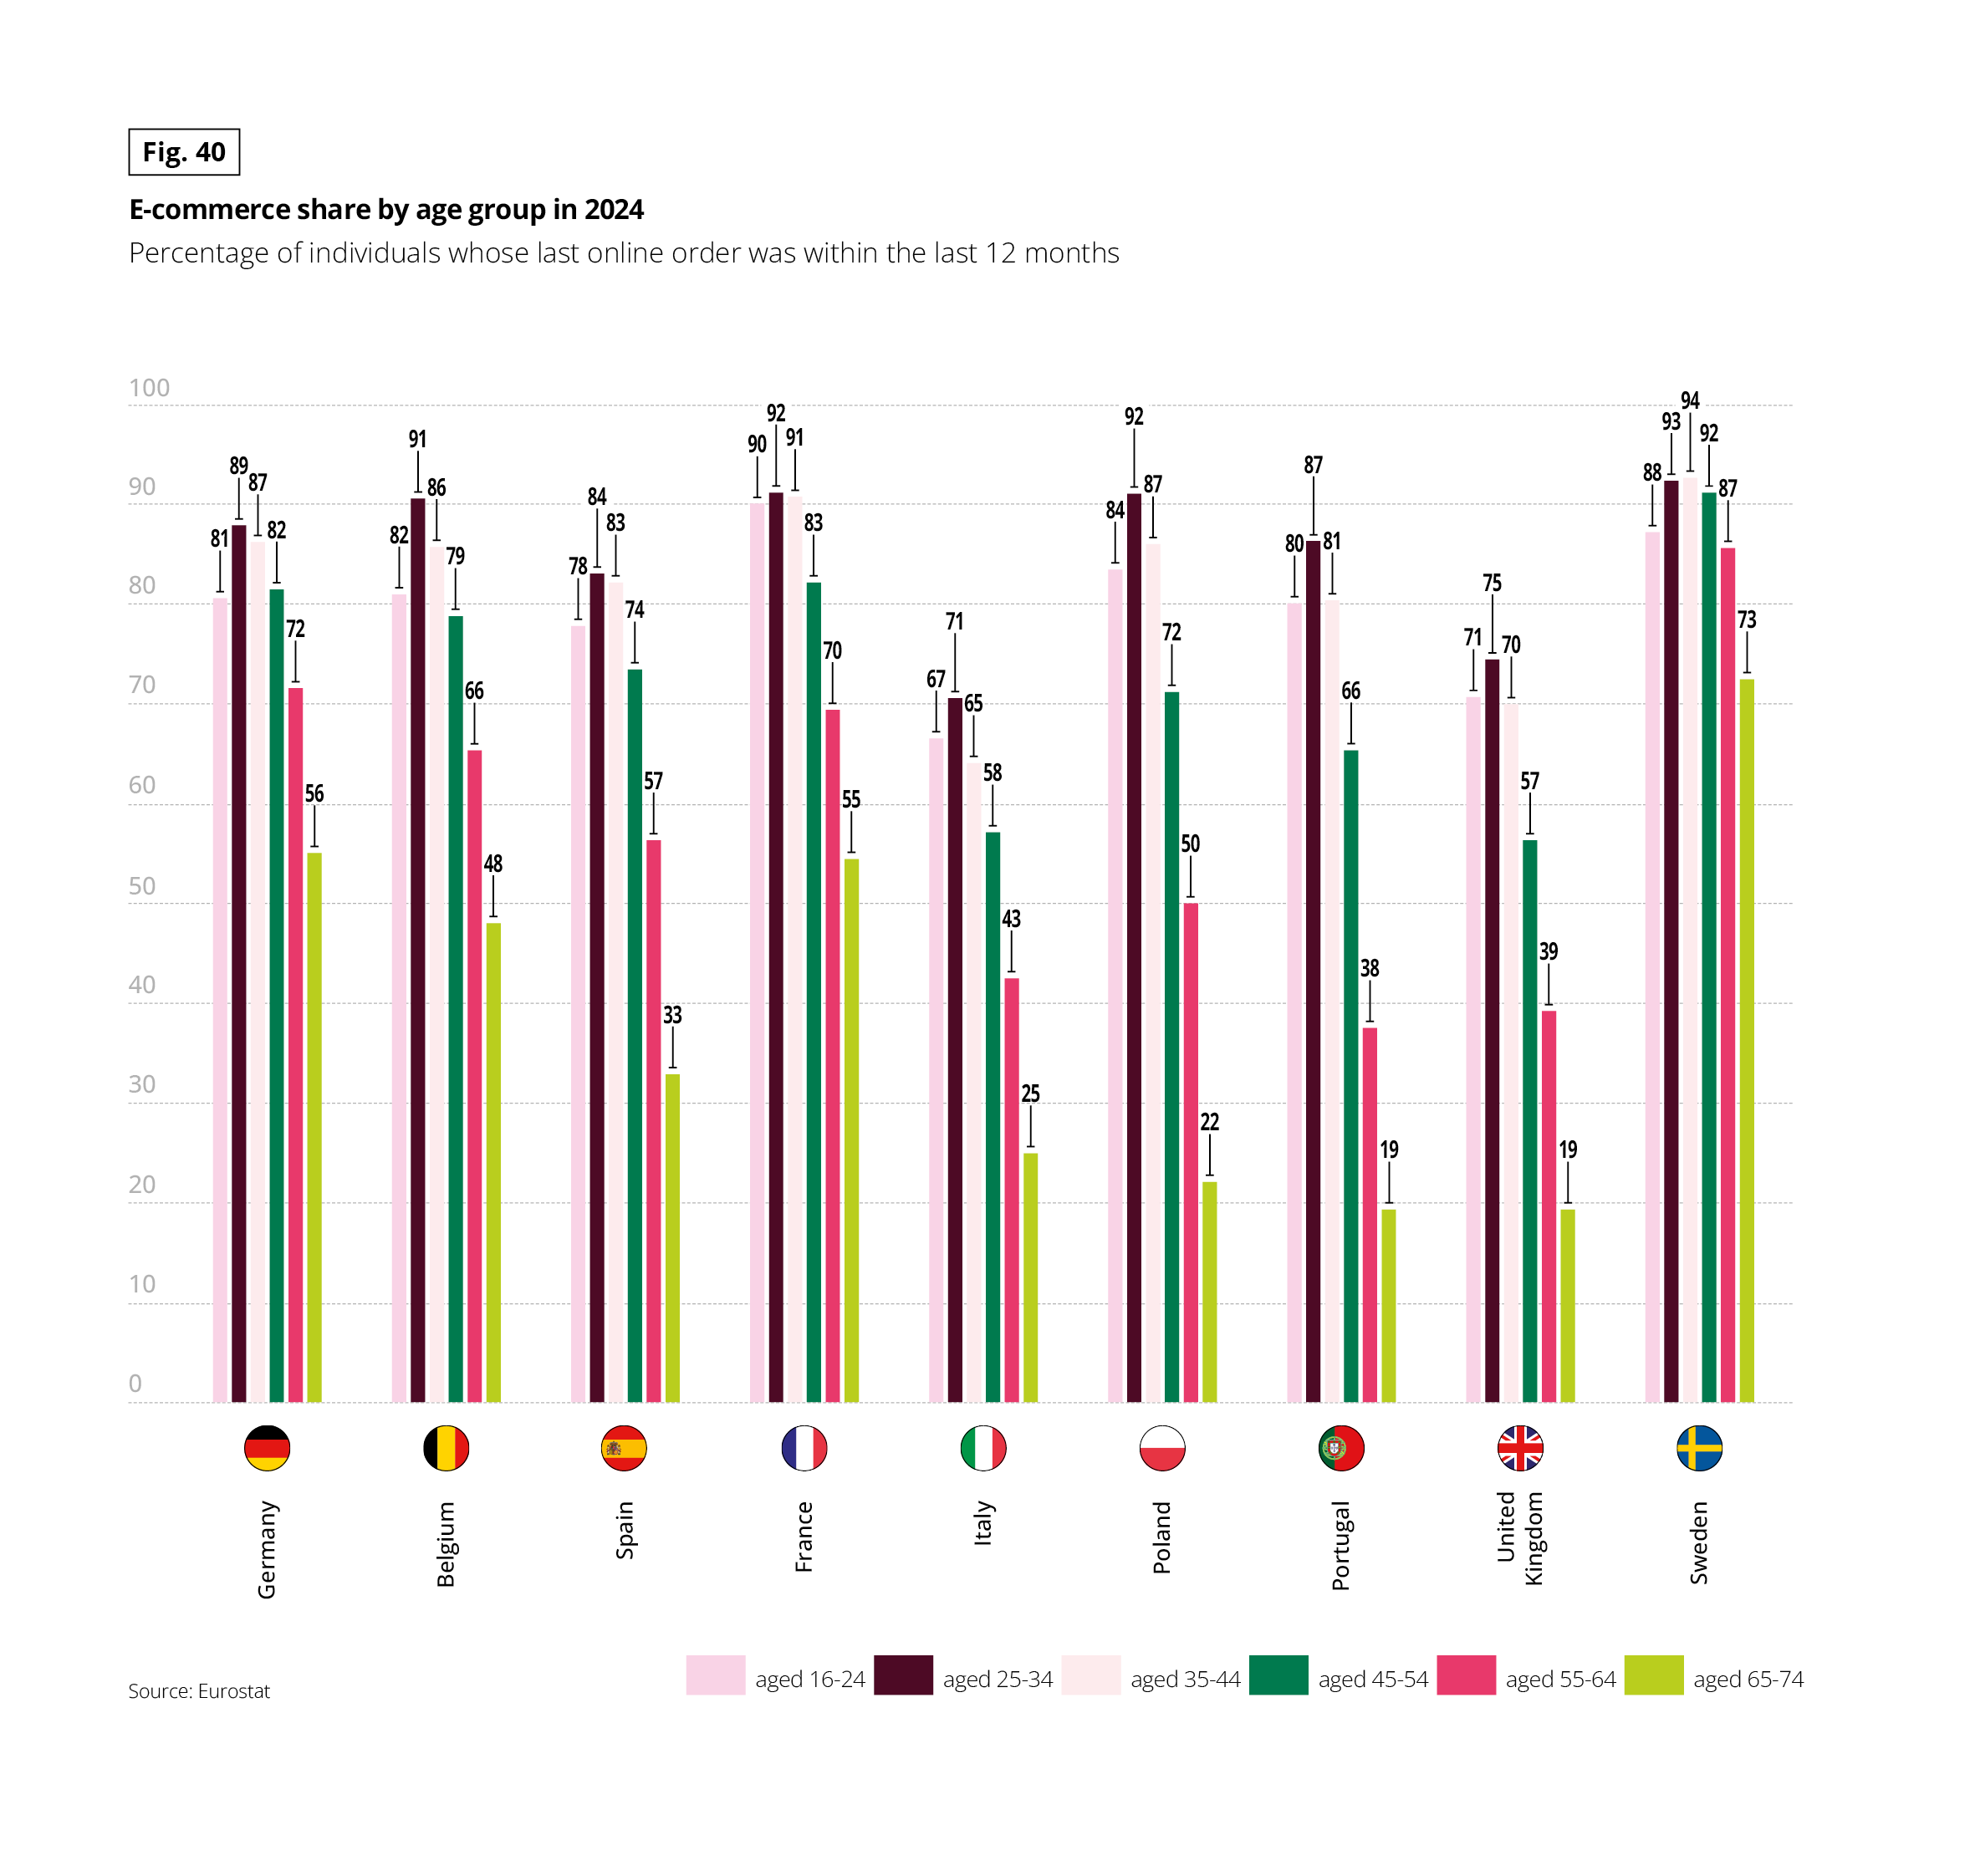 This graph shows the share of individuals who made an online purchase in the last 12 months, by age group and country in 2024.
NEW TECHNOLOGY: STILL A LITTLE CAUTIOUS
While the increasing digital awareness of seniors when it comes to consumption is very real, associating the older generation with the term “geek” seems, by their own admission, highly presumptuous. Only 15% consider themselves digitally hyper-connected, a figure that has fallen since 2016. The Poles are the most addicted to new technology, while the Germans are still unaware of it.
This low percentage of hyper-connected seniors masks a more complex reality, with digital behaviour being more firmly rooted.
Over the last 10 years, intense connectedness appears to have become commonplace for all generations. Most importantly, the share of regular Internet users among seniors is much higher. 4 out of 10 used digital technology for utilitarian purposes and 3 out of 10 for leisure.
Fig 41 – Seniors declaring themselves hyper-connected
Download this infographic for your presentations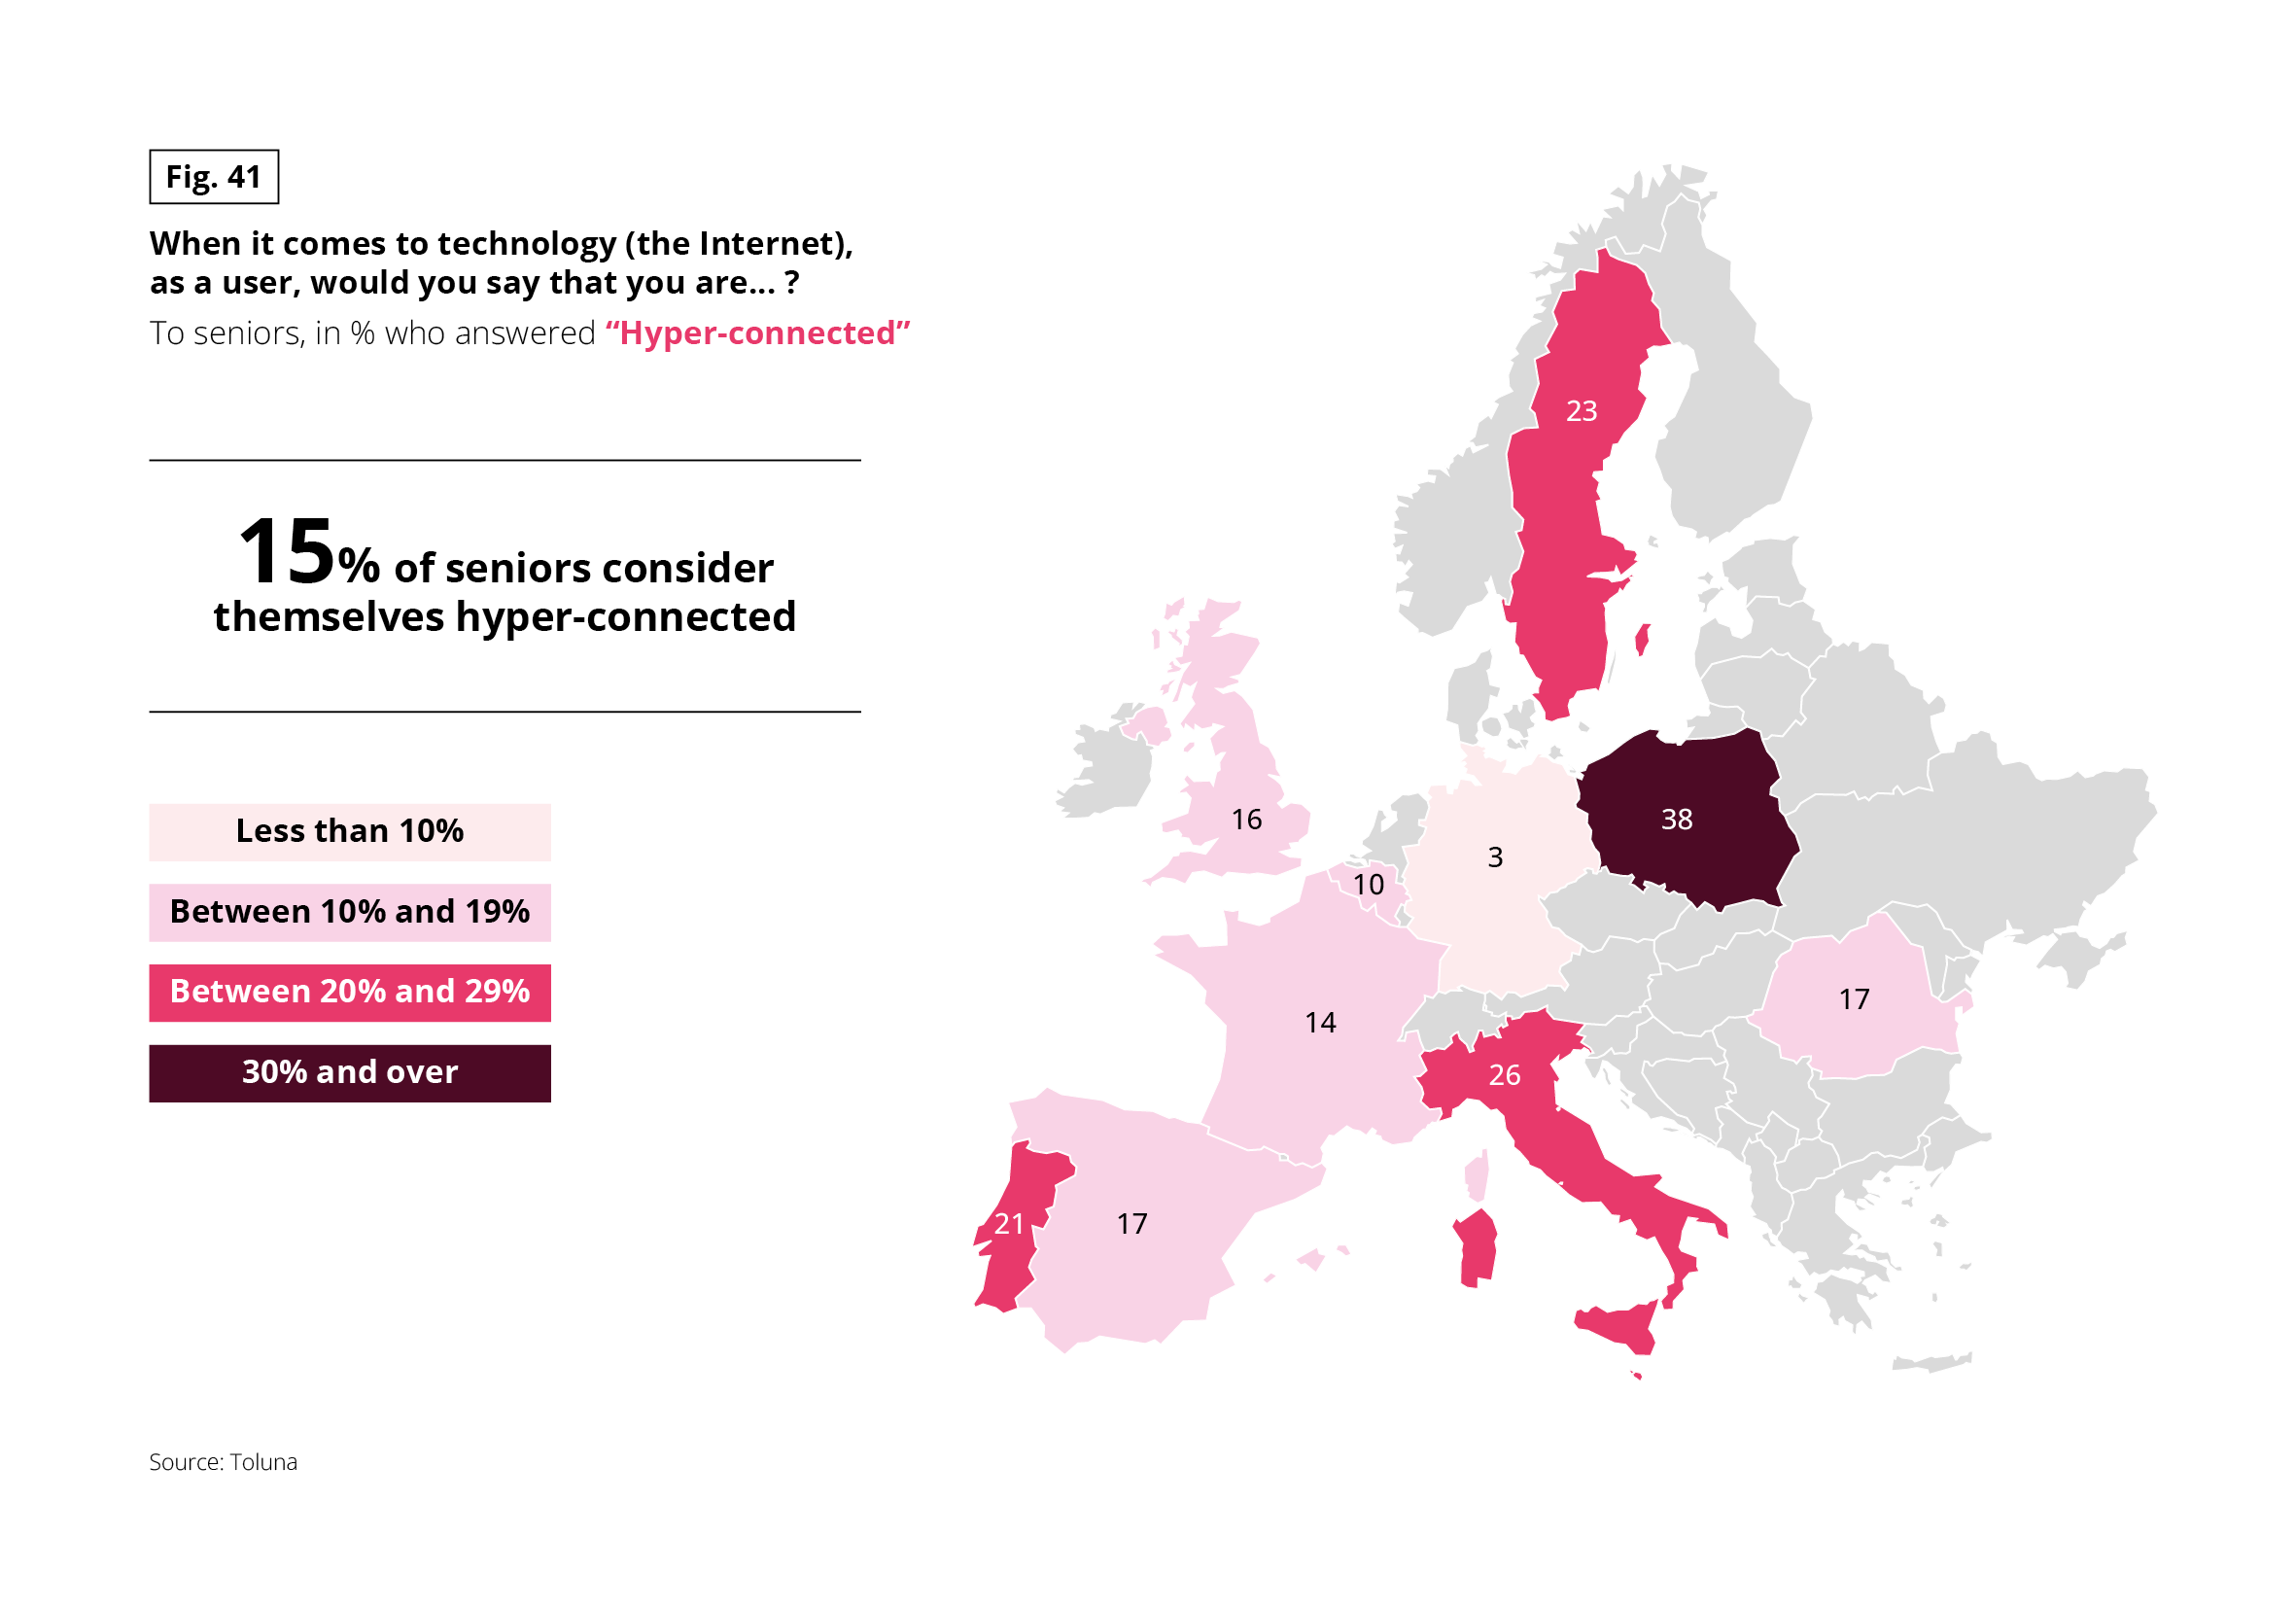 This map indicates the proportion of seniors declaring themselves “hyper-connected” in different European countries.
The overall average is 15%. The highest values are observed in Poland (38%), Italy (26%), Sweden (23%), and Portugal (21%). The lowest levels appear in France (3%) and Belgium (10%). Spain and the United Kingdom show 17% and 16%, respectively.
Source: Toluna.
This map indicates the proportion of seniors declaring themselves “hyper-connected” in different European countries.
The overall average is 15%. The highest values are observed in Poland (38%), Italy (26%), Sweden (23%), and Portugal (21%). The lowest levels appear in France (3%) and Belgium (10%). Spain and the United Kingdom show 17% and 16%, respectively.
Source: Toluna.
CONTRASTING DIGITAL BENEFITS
Might this be due to a relative detachment from digital technology? The fact remains that seniors have difficulty forming a clear, overall picture of their contribution. When it comes to information, education, culture, the economy and, to a certain extent, health, their opinion is positive. In other areas, they have difficulty assessing consequences.
When it comes to consumption patterns, they recognise both the benefits and the negative effects of digital tools. Depending on the country and the different aspects considered, opinions fluctuated and were more or less mixed, geographically speaking. The French, Belgians and Germans make up a sceptical trio. The Portuguese, Spanish, Italians, Poles and Romanians come together in an enthusiastic quintet. The Swedes and the British are aligned in expressing a mixed point of view.
Fig 42 – Perception of digital effects by country
Download this infographic for your presentations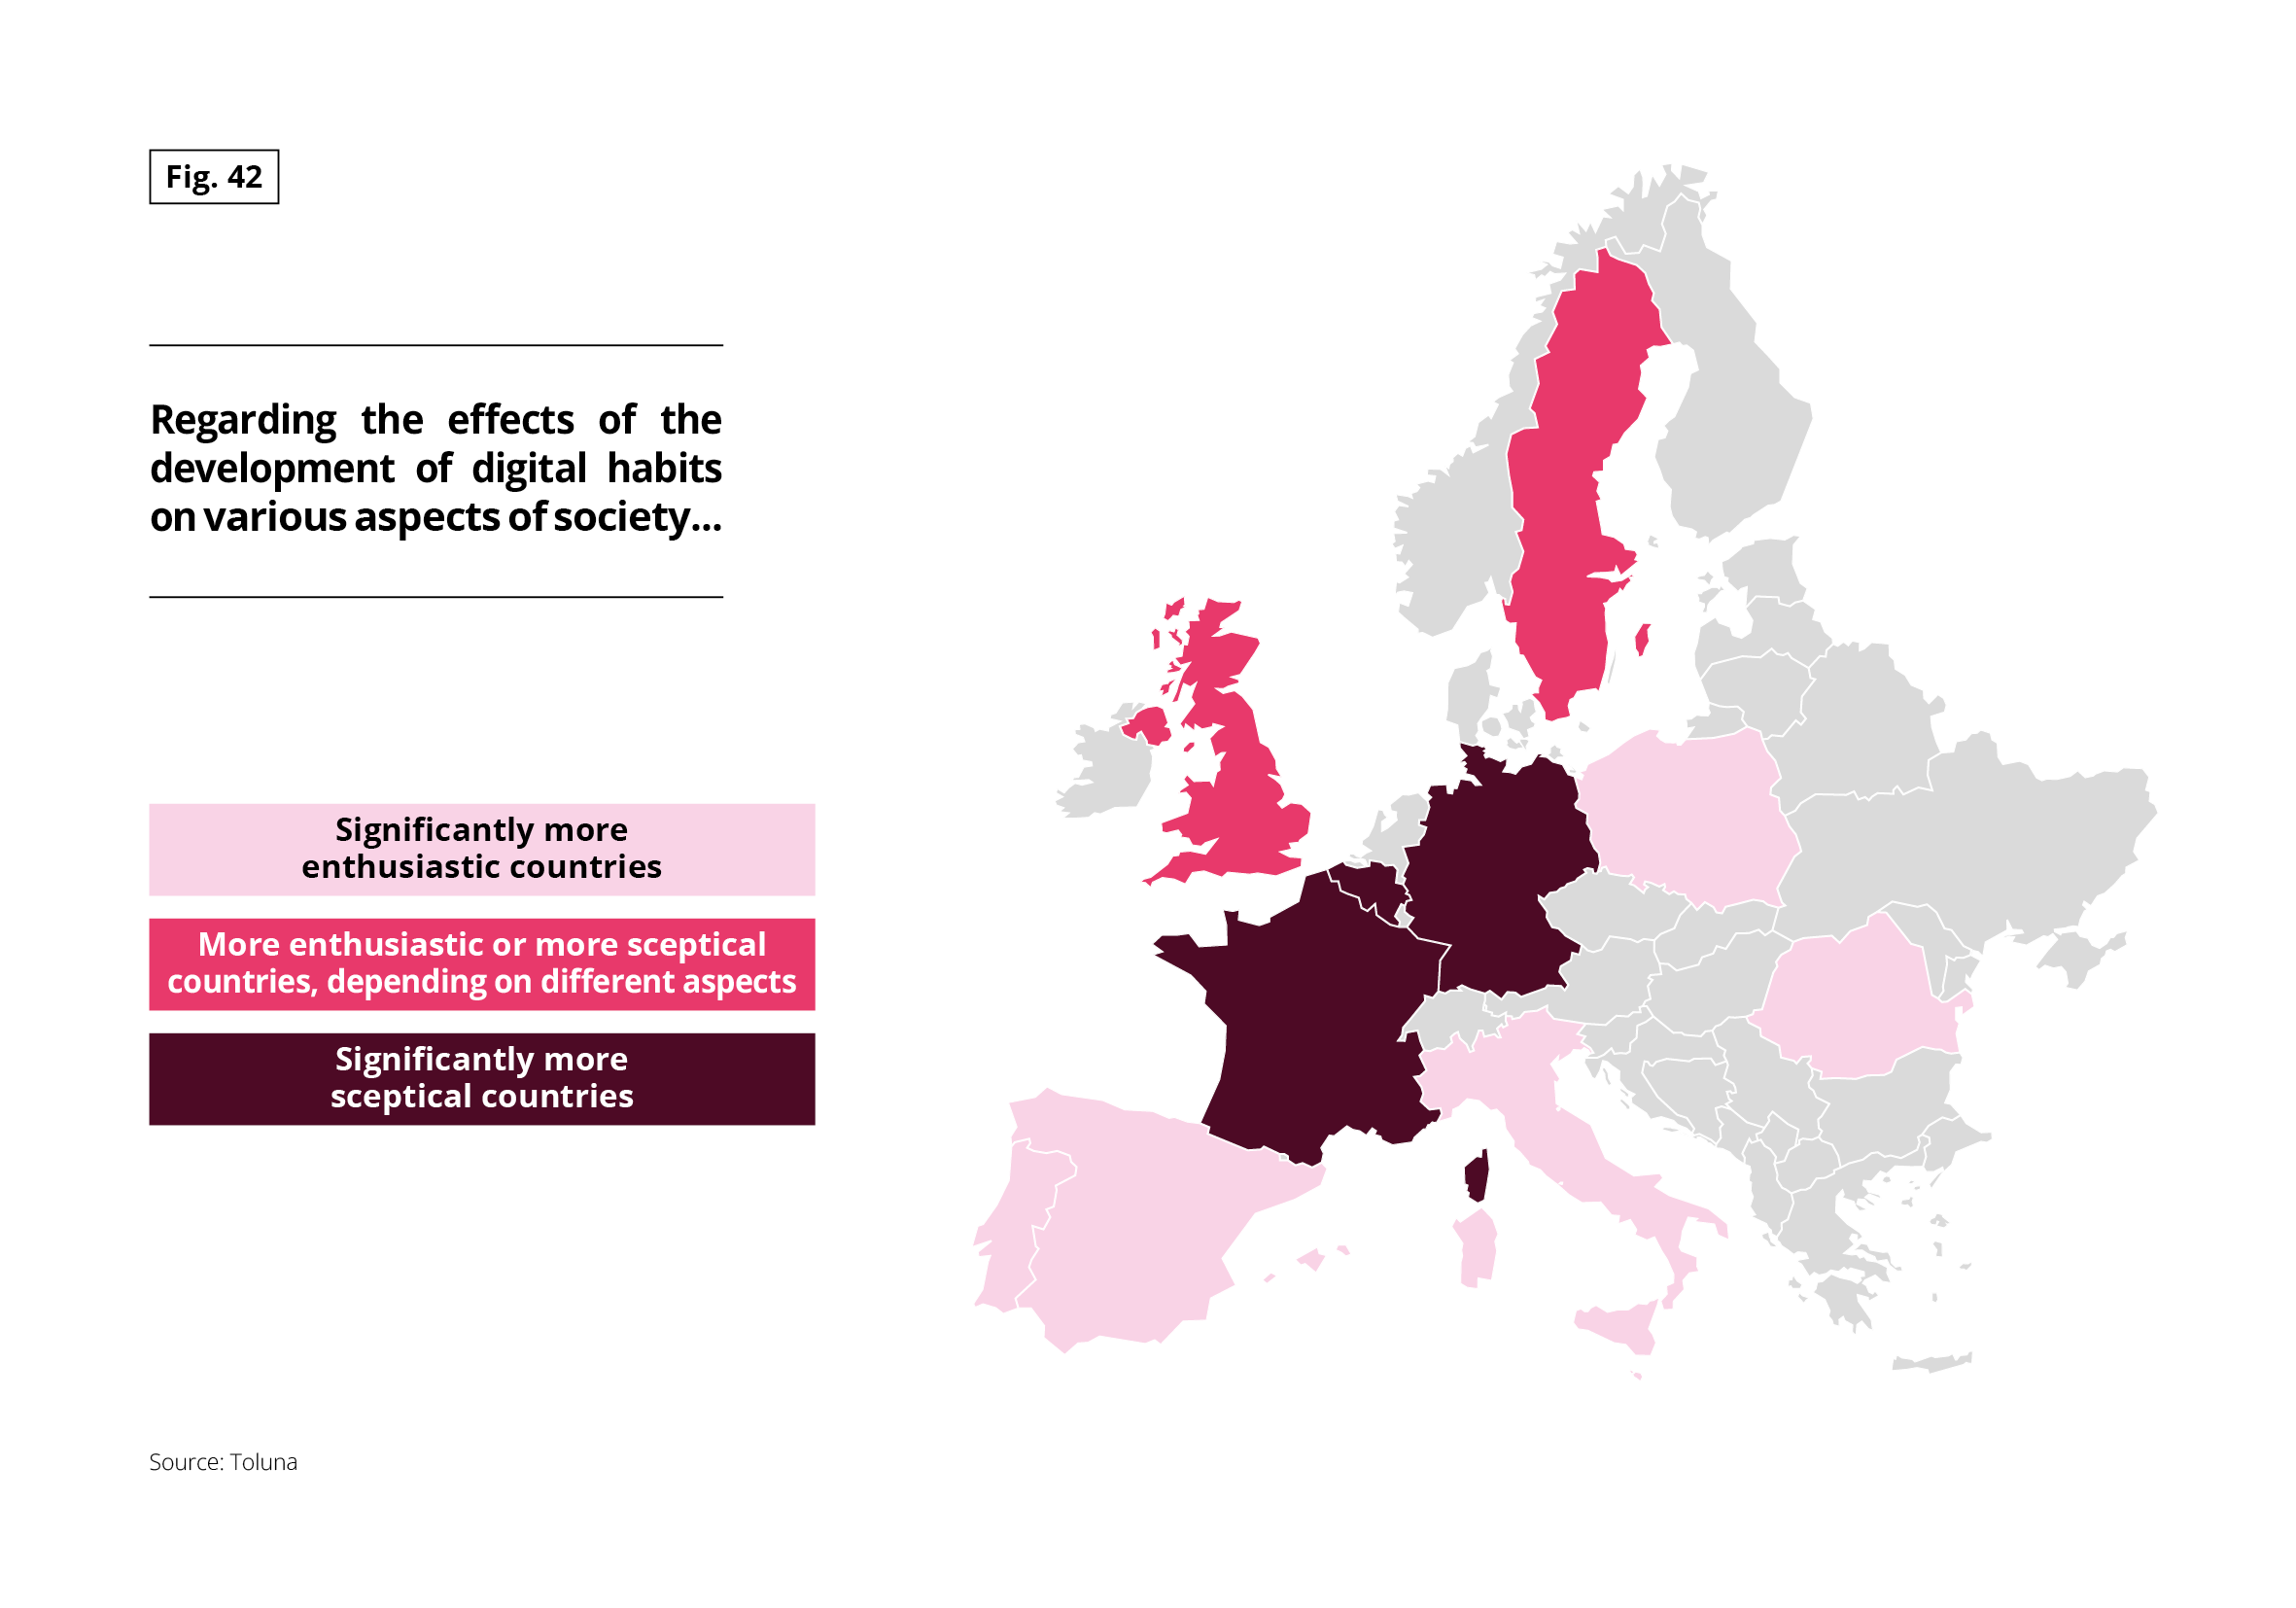 This map represents the perception of the effects of digital development on various aspects of society in several European countries. Three categories are indicated by a color code: countries significantly more enthusiastic, countries with variable perceptions depending on the aspect, and countries significantly more skeptical.
Key figures
- For 8 out of 10 seniors price is the main purchasing criterion
- 7 out of 10 regularly spend time on leisure activities
- 8 out of 10 go to the shops to get an idea before buying
- 1 in 5 often use AI before buying a durable goods item
- 4 out of 10 buy travel and leisure online, the leading purchasing channel for these two sectors