Senior citizens’ consumption patterns


Over the last 10 years, online consumption has grown steadily, sometimes profoundly challenging the weight and development of traditional retail channels, such as those used by brands. Faced with this structural change, has consumer behaviour changed among senior citizens? This Observatoire Cetelem 2026 shows that in the space of a decade, they have diversified their consumption outlets and have not been left by the digital wayside – quite the opposite. Furthermore, their consumption is going digital, particularly when it comes to the leisure activities they enjoy so much.
OLDER AGE, LOWER SPENDING
When we look at consumption across generations, we see a bell-shaped curve, also known mathematically as a Gaussian curve. In all the countries covered by this Observatoire Cetelem for 2016, consumption takes this shape, with the under-30s and senior citizens at opposite ends of the spectrum.
For the former, their income is not yet sufficient for them to adopt a sustained consumerist attitude. For the latter, many of their needs have been met, so there is no longer any need for them to frequently untie their purse strings. In the UK and Poland, senior citizens even spend less than the under-30s.
Fig 22 – Average household expenditure by age
Download this infographic for your presentations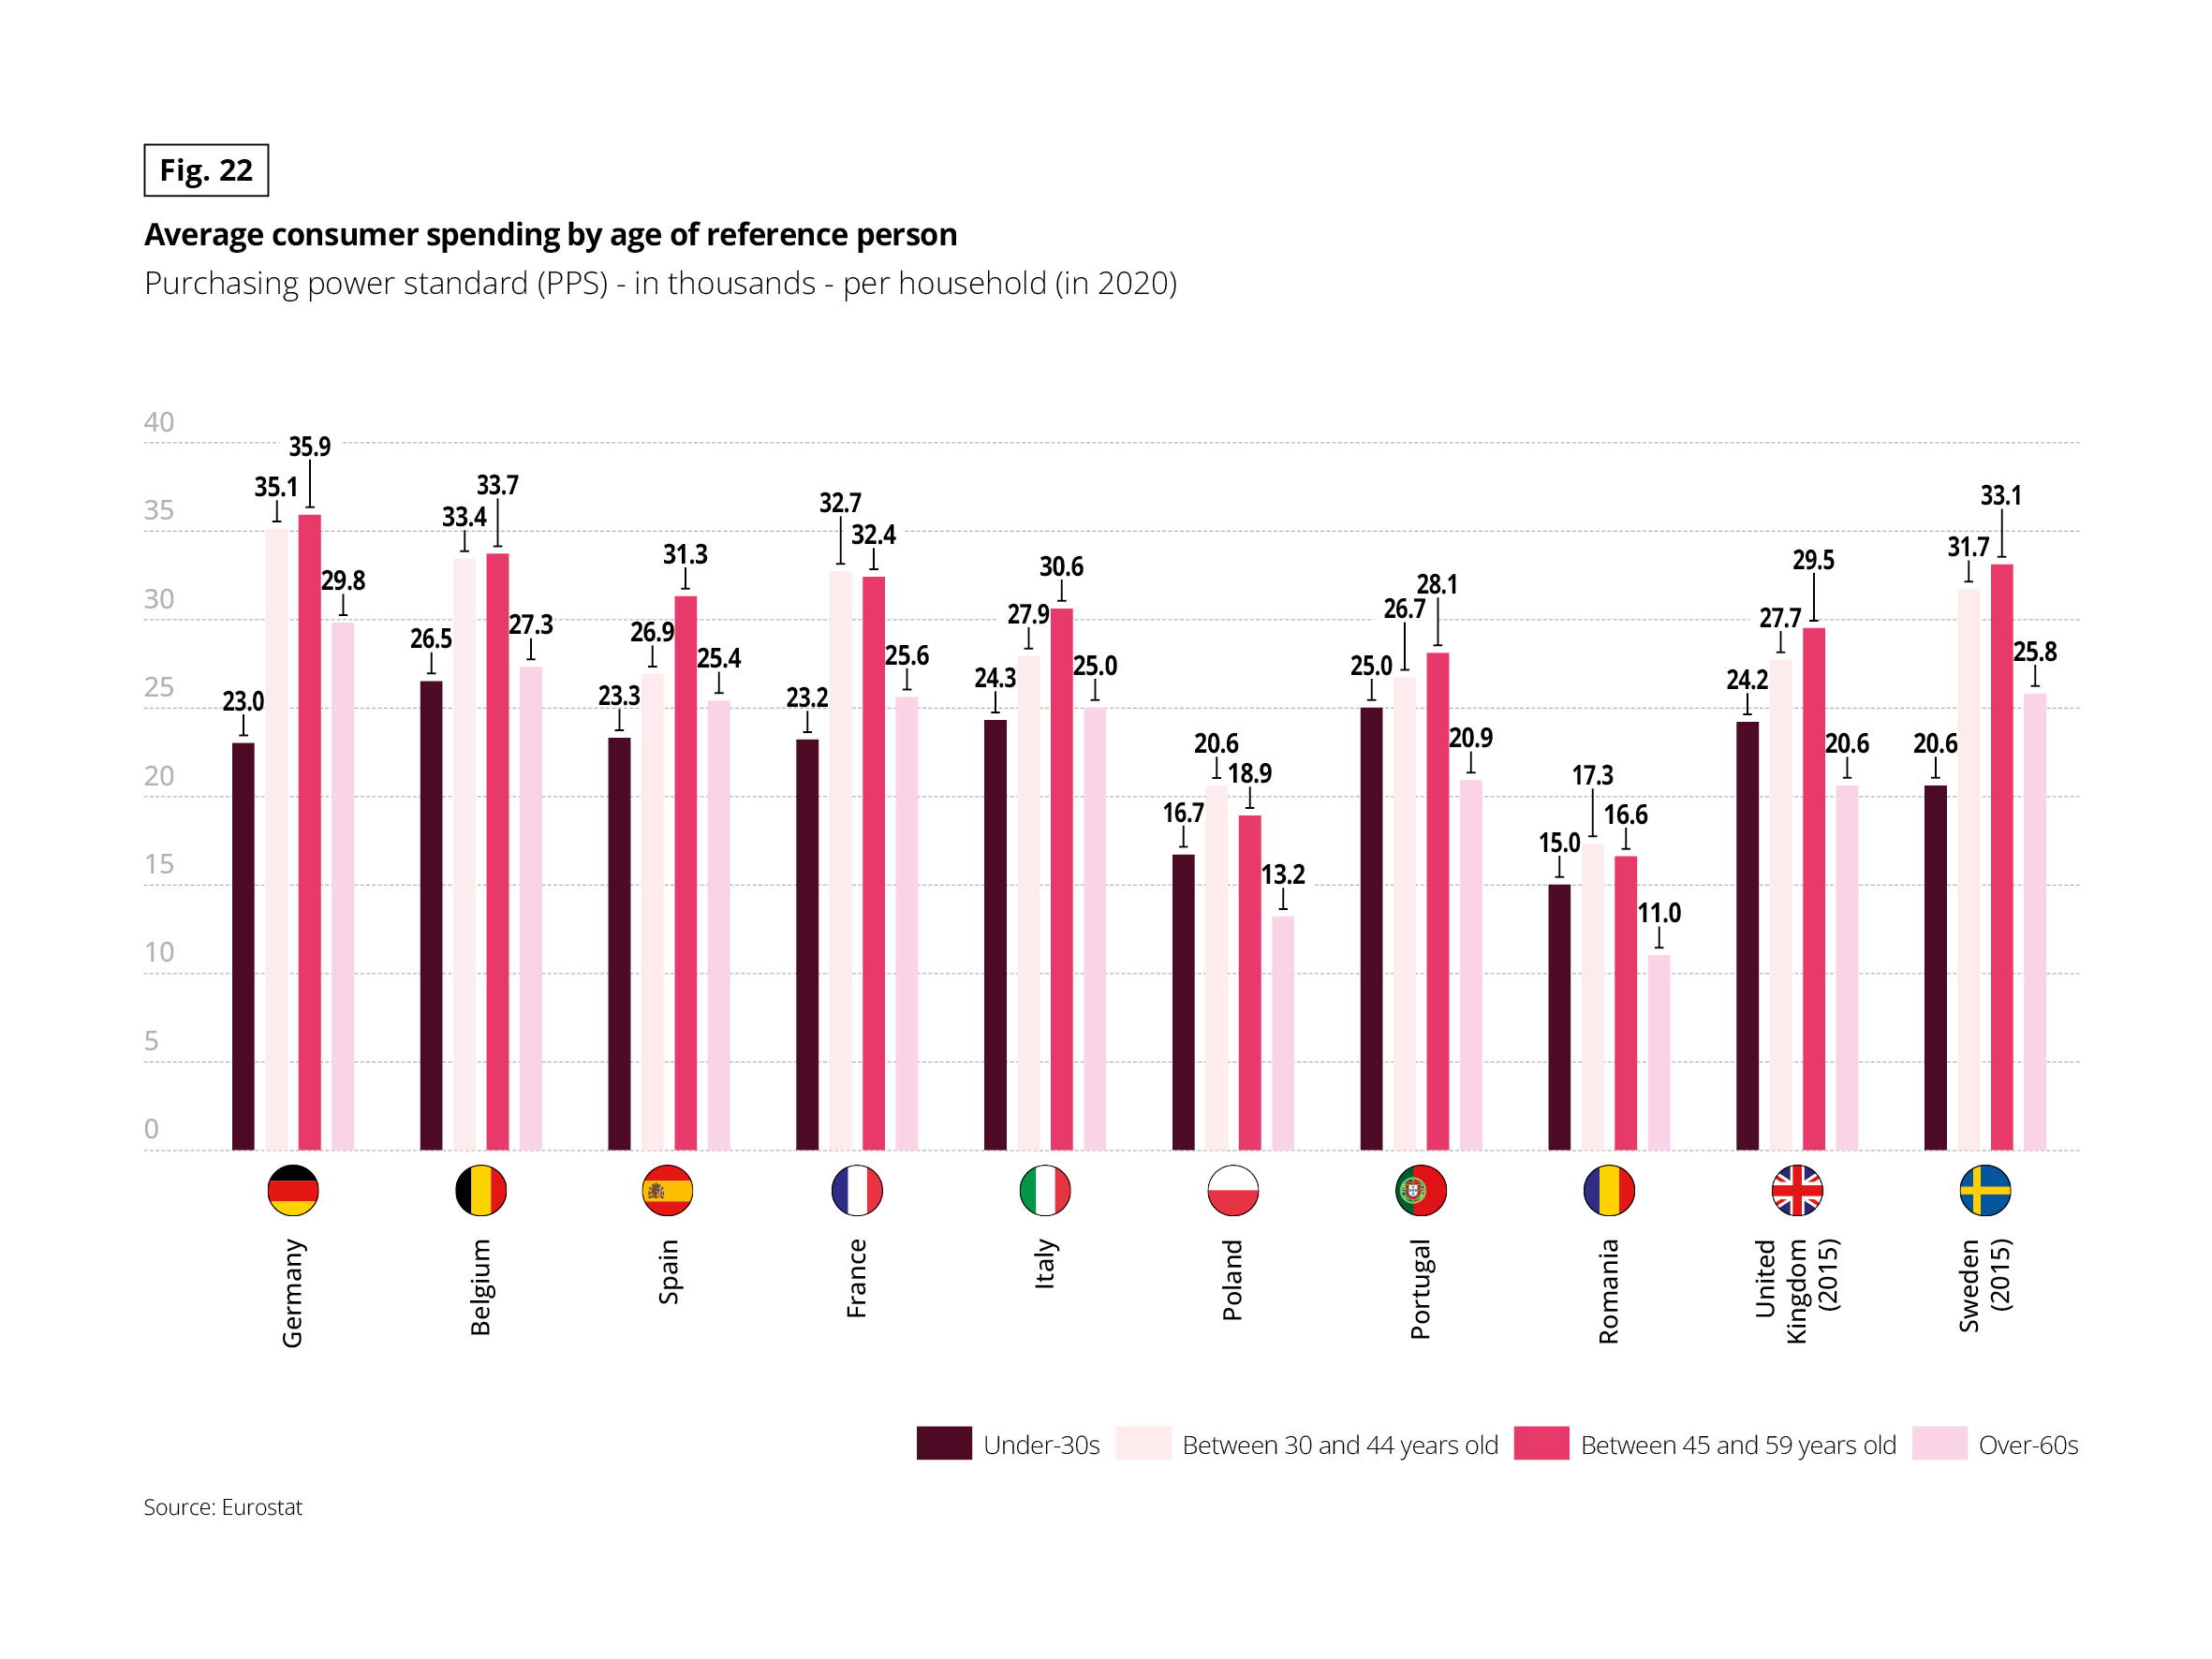 This infographic compares the average household consumption expenditure according to the age of the reference person, in purchasing power standard, expressed in thousands, for the year 2020.
INSIGHT
Using an “age-generation-cohort” model, L’Observatoire Cetelem is proposing a projection of consumption by item in France up to 2030.
This approach makes it possible to identify what will change and what will remain stable over the long term as a result of demographics. Some behaviours change with age and ageing (such as the purchase of glasses for long-sightedness), while others persist because they are specific to a generation and the habits it has developed (reading the printed press, using cheques, etc.).
These two effects are constantly influenced by the effects of the times (innovations, inflation, regulations, etc.), which can affect all ages and all generations simultaneously (see Appendix for more details).
Fig 23 – Projections of consumption by category and generation
Download this infographic for your presentations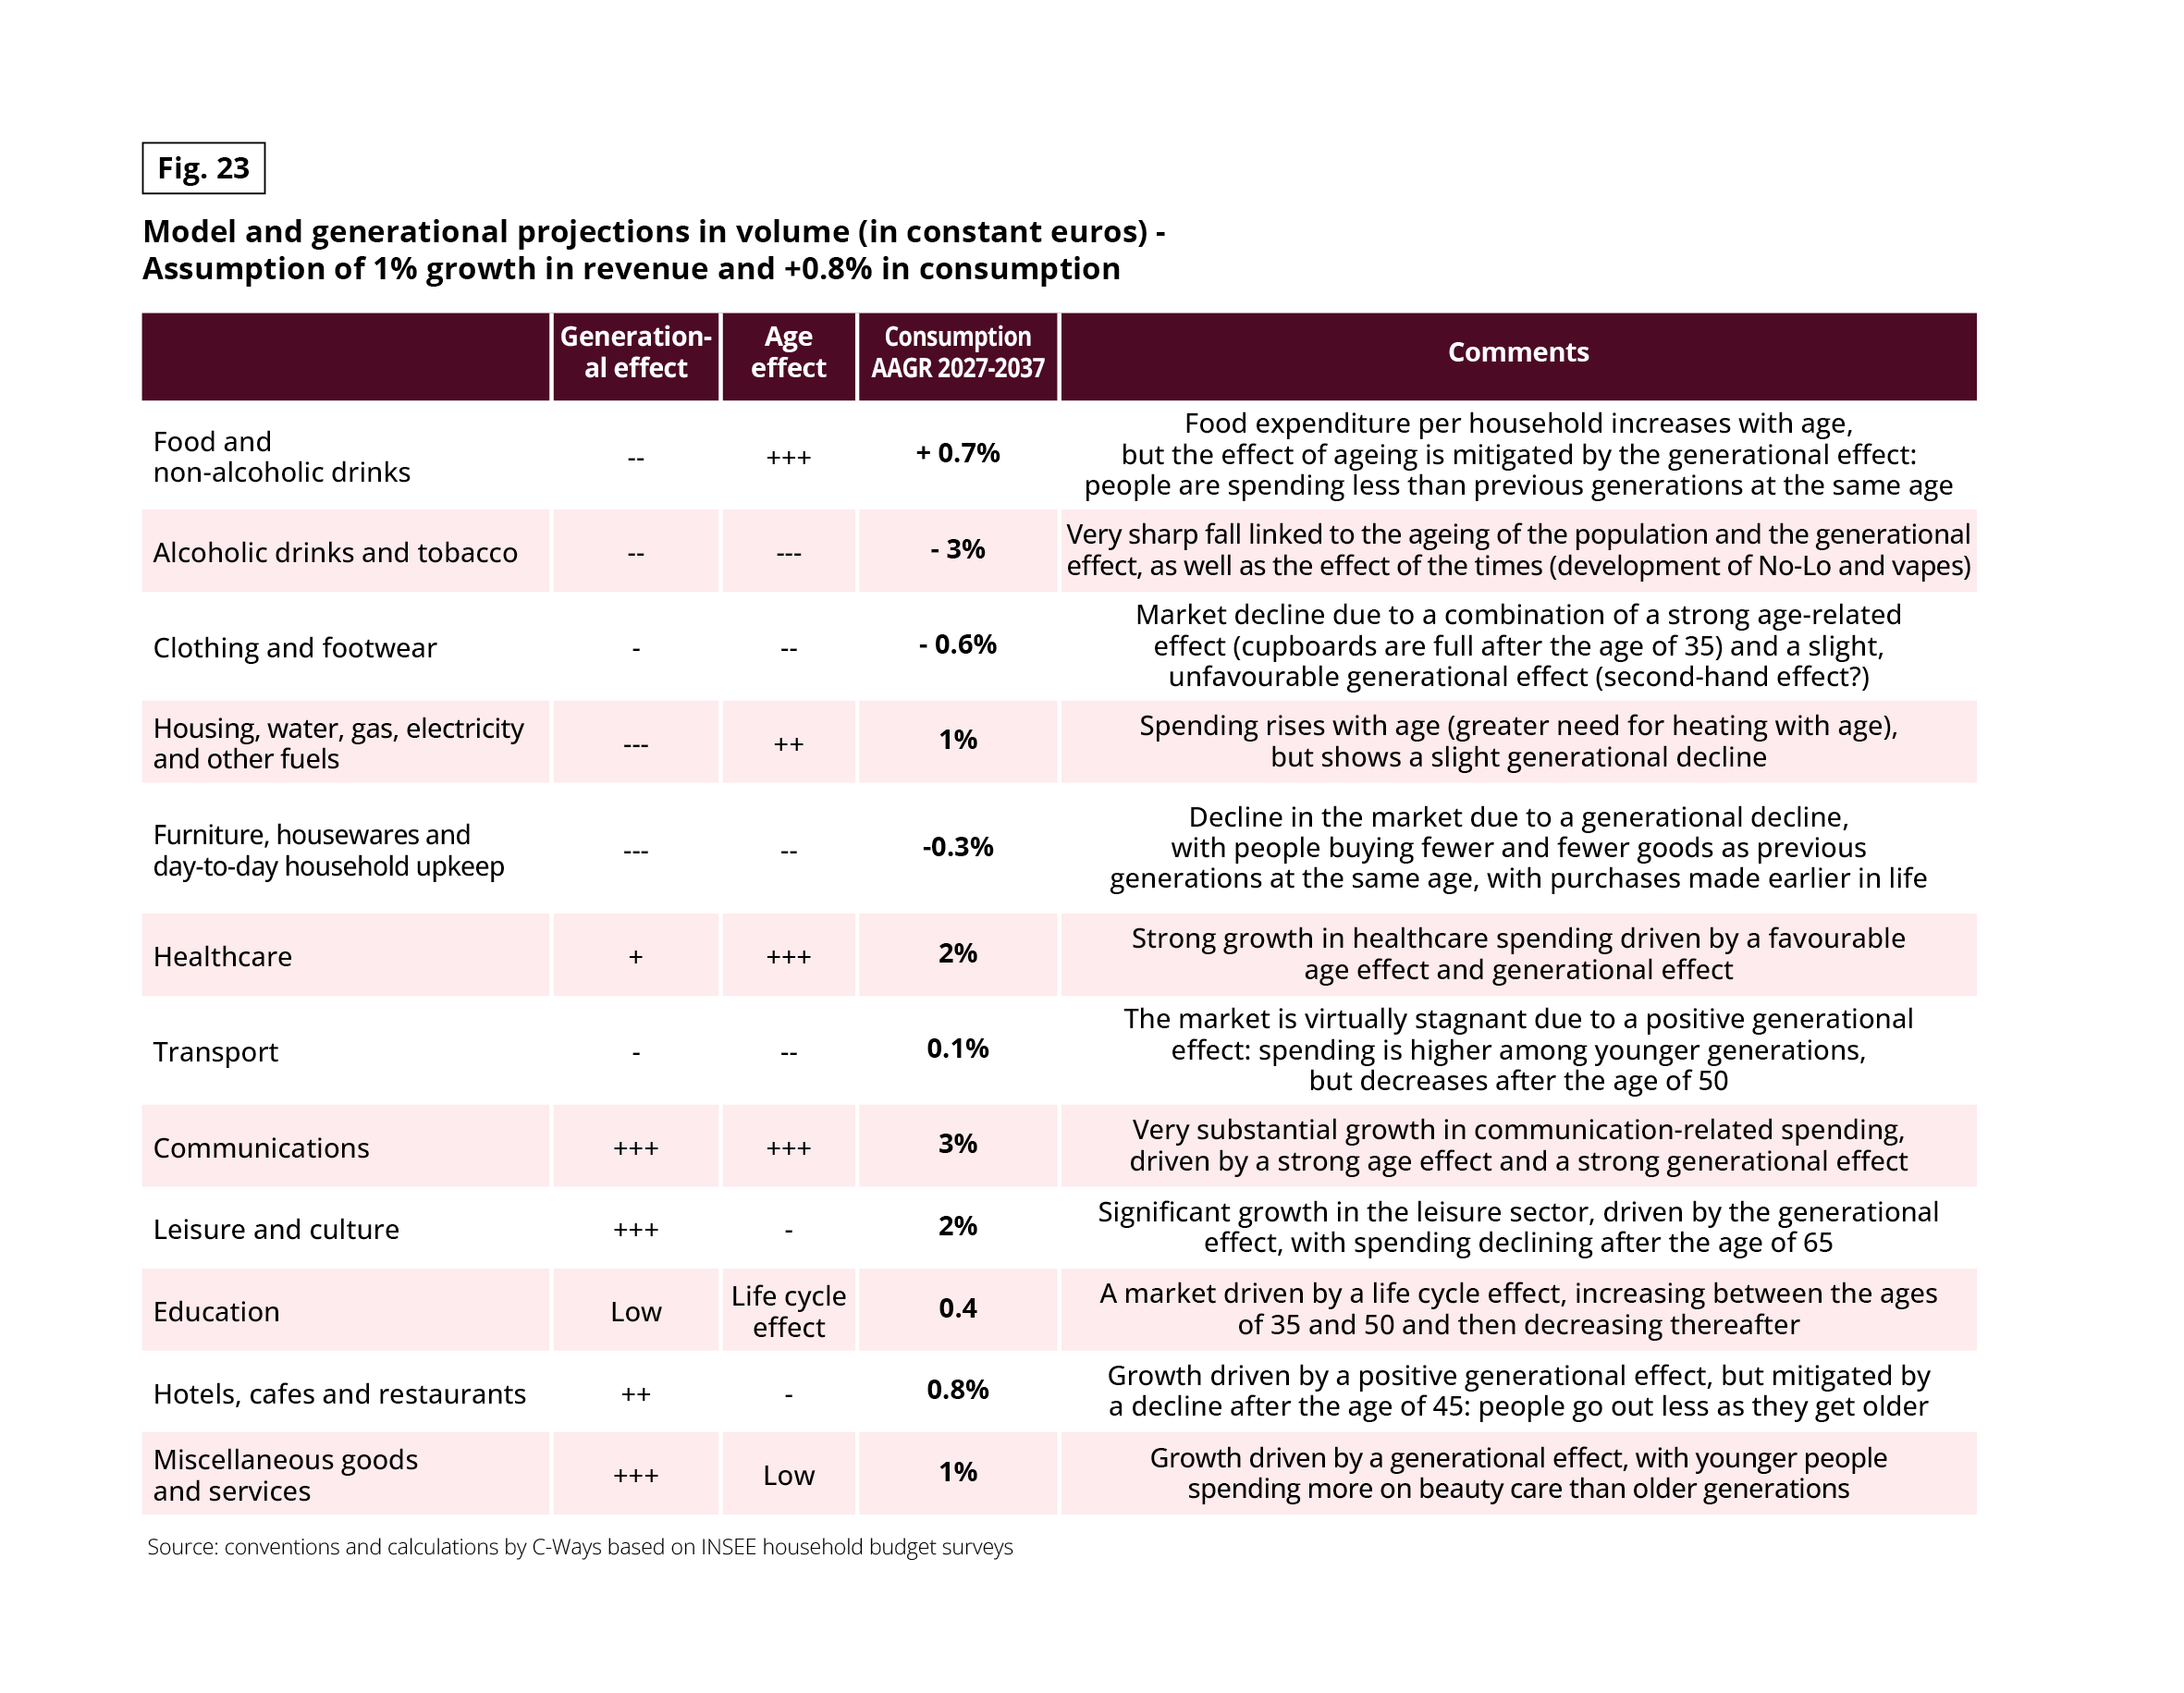 This infographic presents a model of generational consumption projections in volume, in constant euros, over the period 2027-2037, based on an assumption of 1% growth in income and +0.8% consumption.
Fig 24 – Expected evolution of consumption expenditure in France
Download this infographic for your presentations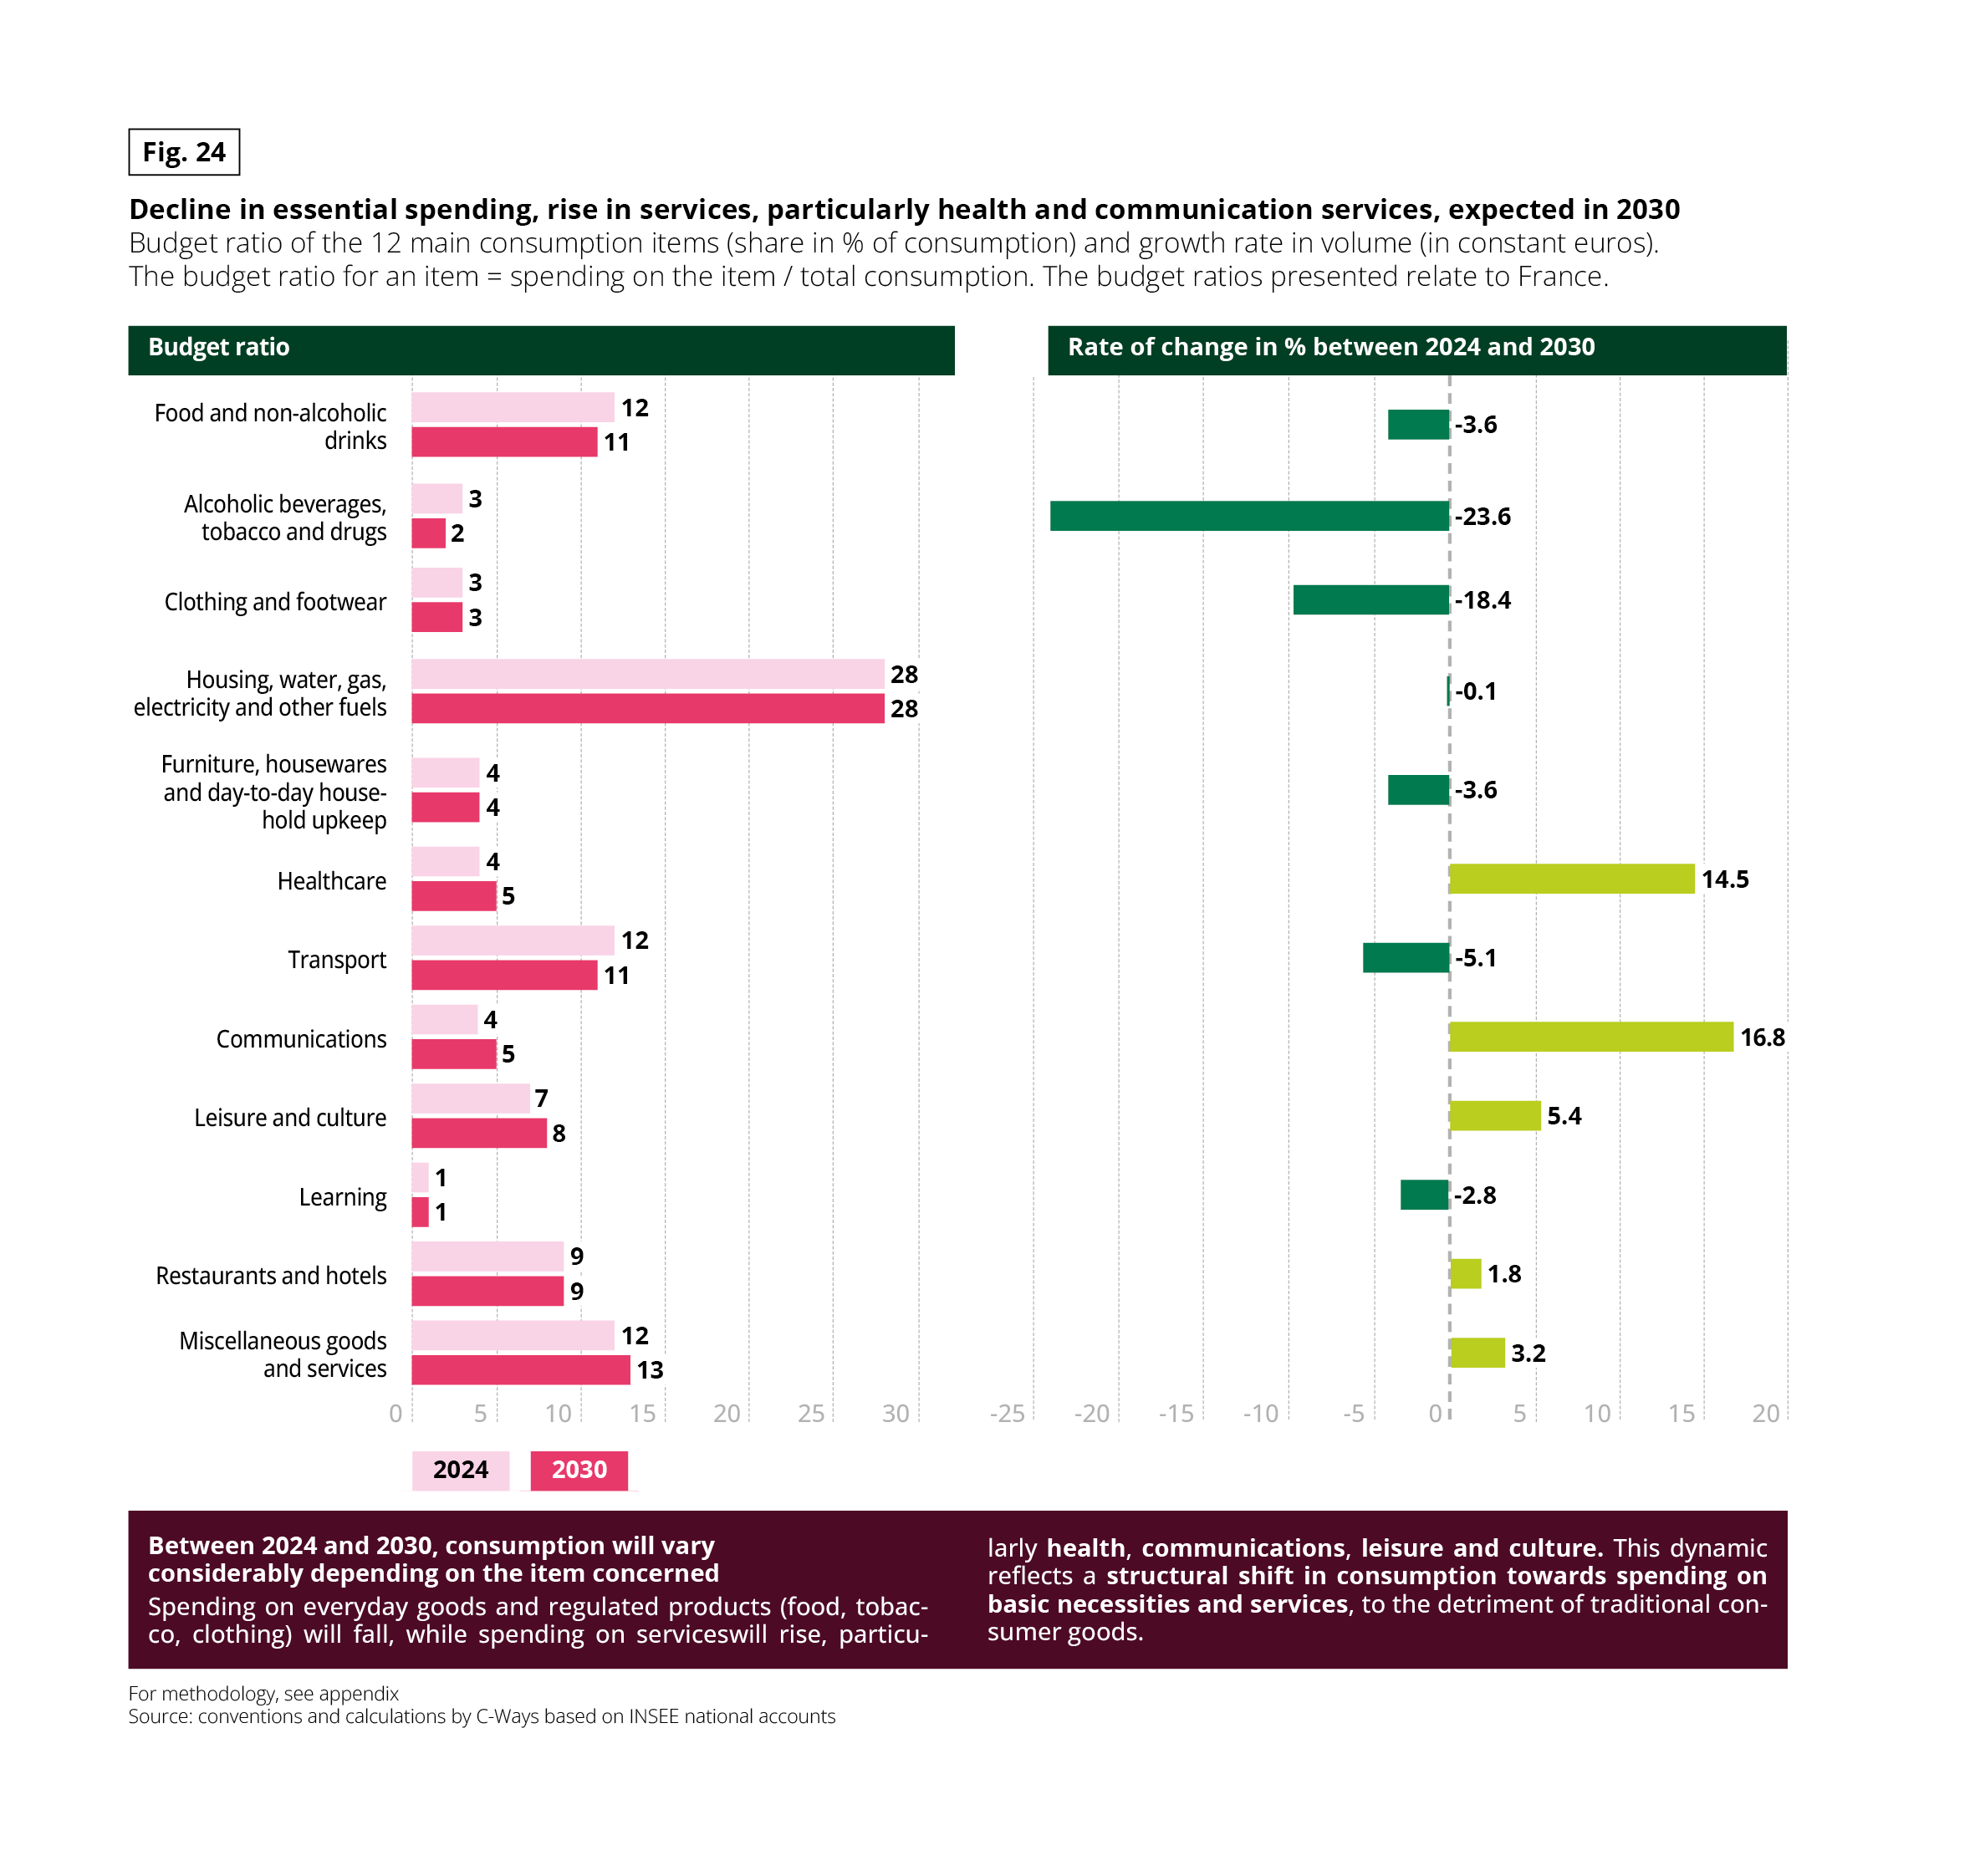 This infographic presents, for France, the budget coefficients of the main consumption categories in 2024 and 2030, as well as their volume growth rate between 2024 and 2030.
PRICE AND QUALITY FIRST
All the surveys carried out by L’Observatoire Cetelem show that price is consumers’ main concern. This year’s edition, dedicated to senior citizens, is no exception. For 8 out of 10 of seniors, it is the primary factor when purchasing durable goods. Differences between countries are relatively slight.
It is worth noting that the Germans were the most likely to pay attention to price, a further sign of significant economic anxiety. The quality of products attracts the attention of senior consumers in slightly lower proportions, with 74% mentioning importance to functionality.
Fig 25 – Purchase criteria for equipment goods among seniors
Download this infographic for your presentations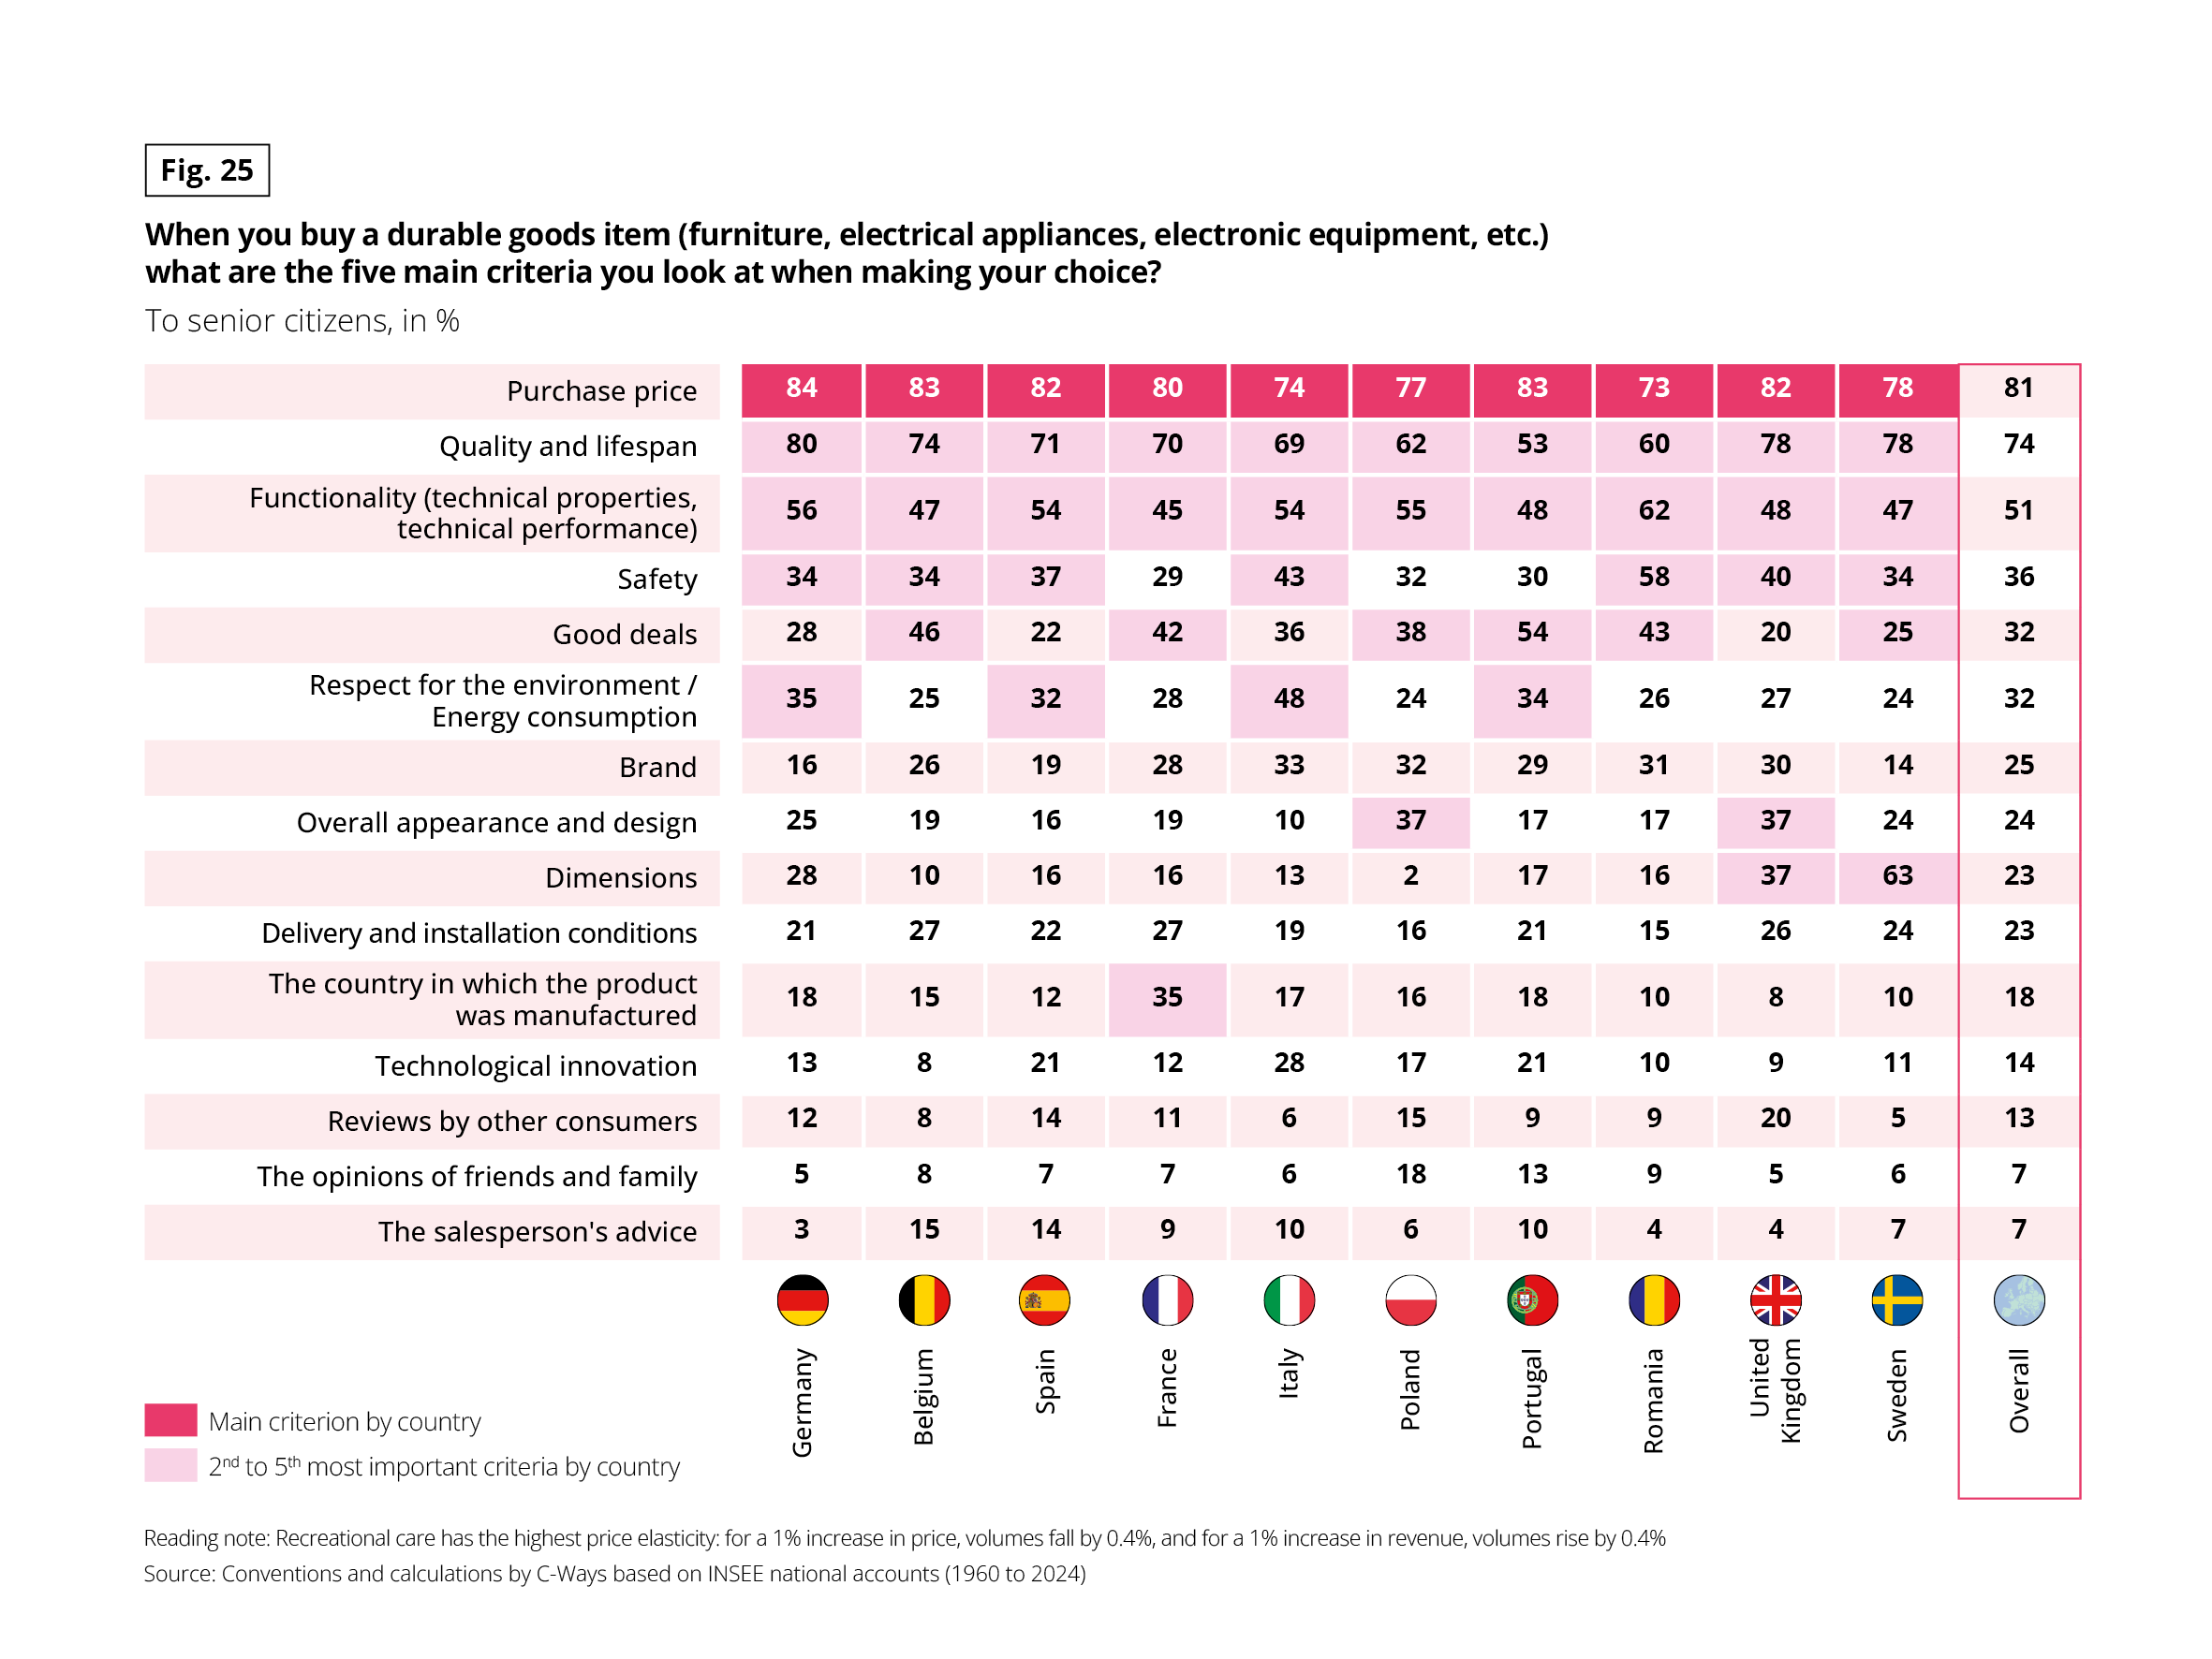 This infographic presents the five main criteria considered by seniors when purchasing an equipment good, expressed as a percentage, for several European countries and a total overall.
EVEN MORE RESPONSIBLE OVER TIME
Age is often associated with responsibility, or even wisdom. This survey bears witness to this in its own way, noting that more responsible consumption patterns have been strengthening among senior citizens over the last 10 years.
More than 1 in 3 senior citizens would rather have a product repaired than buy a new one. Second-hand and reconditioned products also appeal to more than a quarter of over-60s. Spain stands out for its marked change in behaviour, while Belgium, the UK and Germany have yet to display it.
Fig 26 – Evolution of seniors’ consumption practices
Download this infographic for your presentations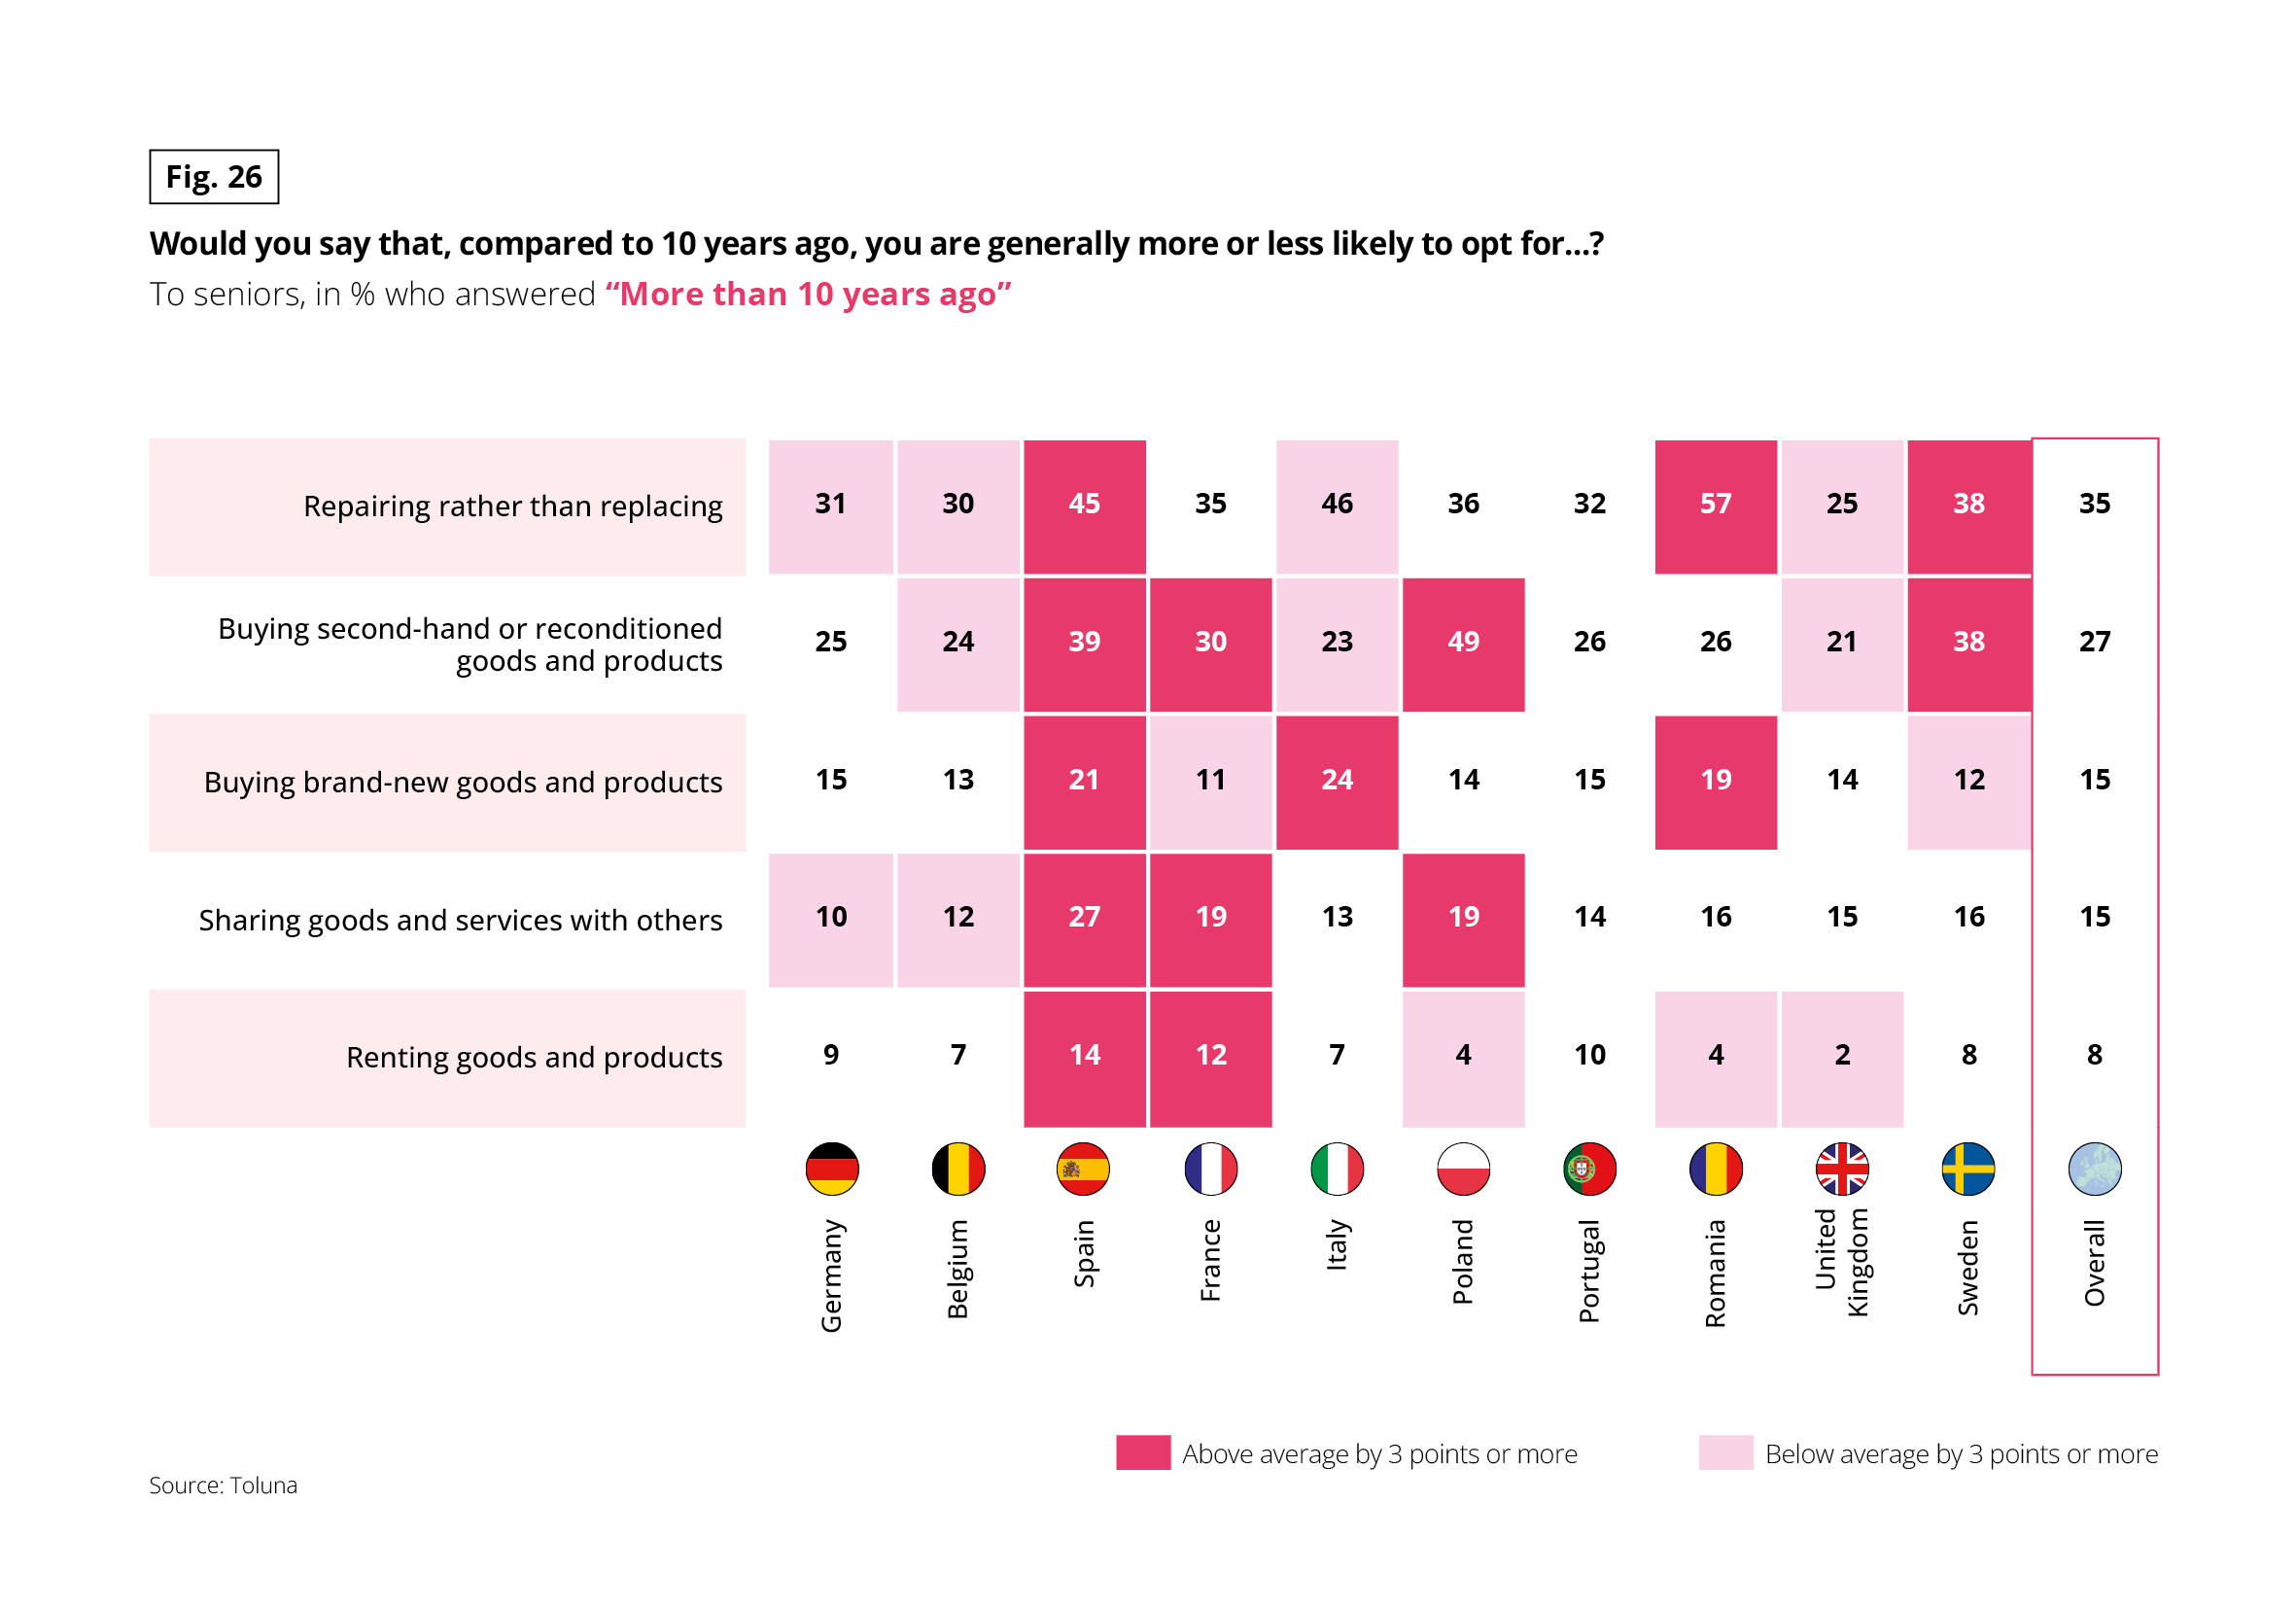 This infographic presents the share of seniors declaring to have more recourse to certain consumption practices than ten years ago, expressed as a percentage of “more than ten years ago” responses.
GOING TO THE HEART OF THE MATTER
A breakdown of the various consumer items reveals a structural breakdown common to all countries, but also significant differences between them, depending on the items considered. In all countries, spending on housing was the highest, rising steadily as a result of higher prices per square metre and higher energy costs. Food purchases were the second largest item of expenditure, with much greater differences between countries.
They were particularly high in Poland and Romania. This is a logical result given Engel’s law, which states that the share of income allocated to food expenditure falls as income rises. Household-related expenditure came third, with consistent results across all nations. The same applies to health, with the notable exception of France where public medical cover no doubt reduces the burden. Leisure activities are in fifth place.
Fig 27 – Breakdown of household consumption by function
Download this infographic for your presentations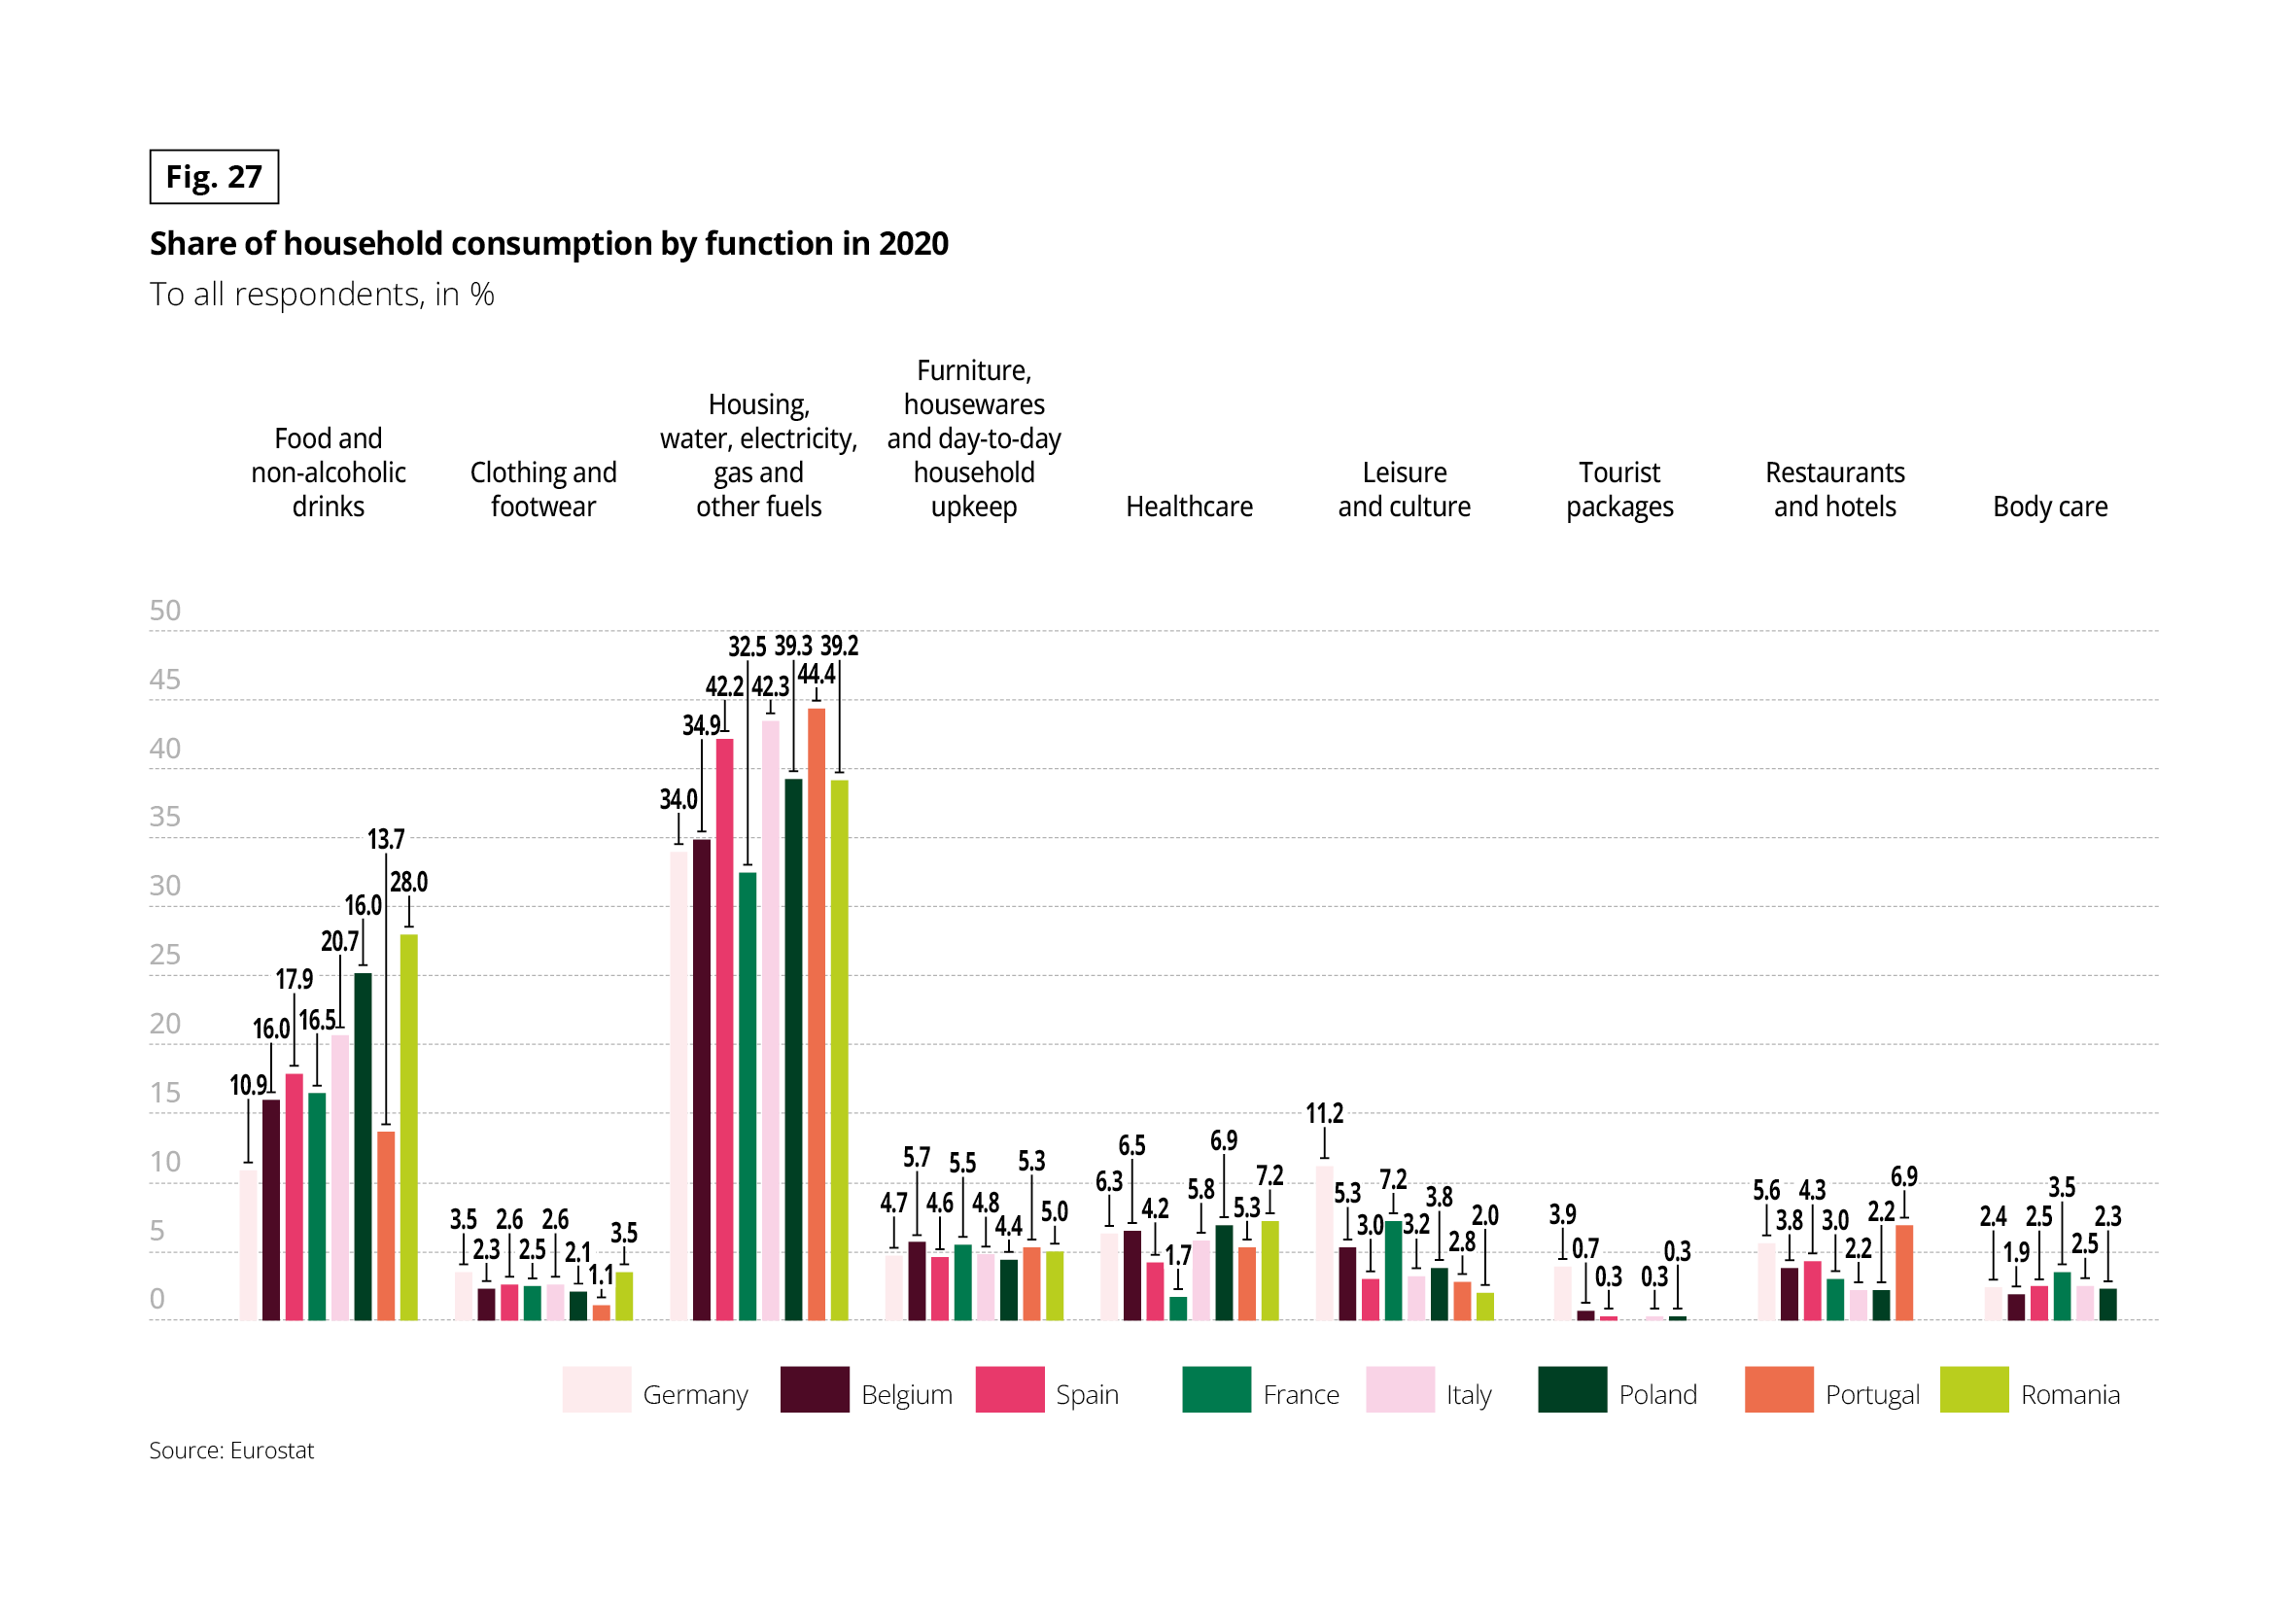 This infographic presents the share of household consumption by function in 2020, expressed as a percentage, for eight European countries: Germany, Belgium, Spain, France, Italy, Poland, Portugal, and Romania.
LEISURE ACTIVITIES FOR PLEASURE
Often retired and free from the worry of bringing up their children, senior citizens have plenty of time to devote to their hobbies. “Silver economy” is therefore often synonymous with “leisure economy”.
Leisure is the top priority for seniors in all the countries surveyed, with 7 out of 10 clearly showing their attachment to it. While the Germans and Portuguese were the most likely to engage in leisure activities, the British, Poles and Romanians were relatively less likely to do so. While this type of activity was very much a part of their present lives, senior citizens intended to devote more time to it in the future, with Italians and Romanians particularly keen to do so.
More specifically with regard to holidays and weekend breaks, over the last 10 years there has been a decline in getaways taken by seniors, with a 10-point rise in the percentage travel was particularly noticeable among people from neighbouring Germany and Poland.
Fig 28 – Time spent on leisure activities among seniors
Download this infographic for your presentations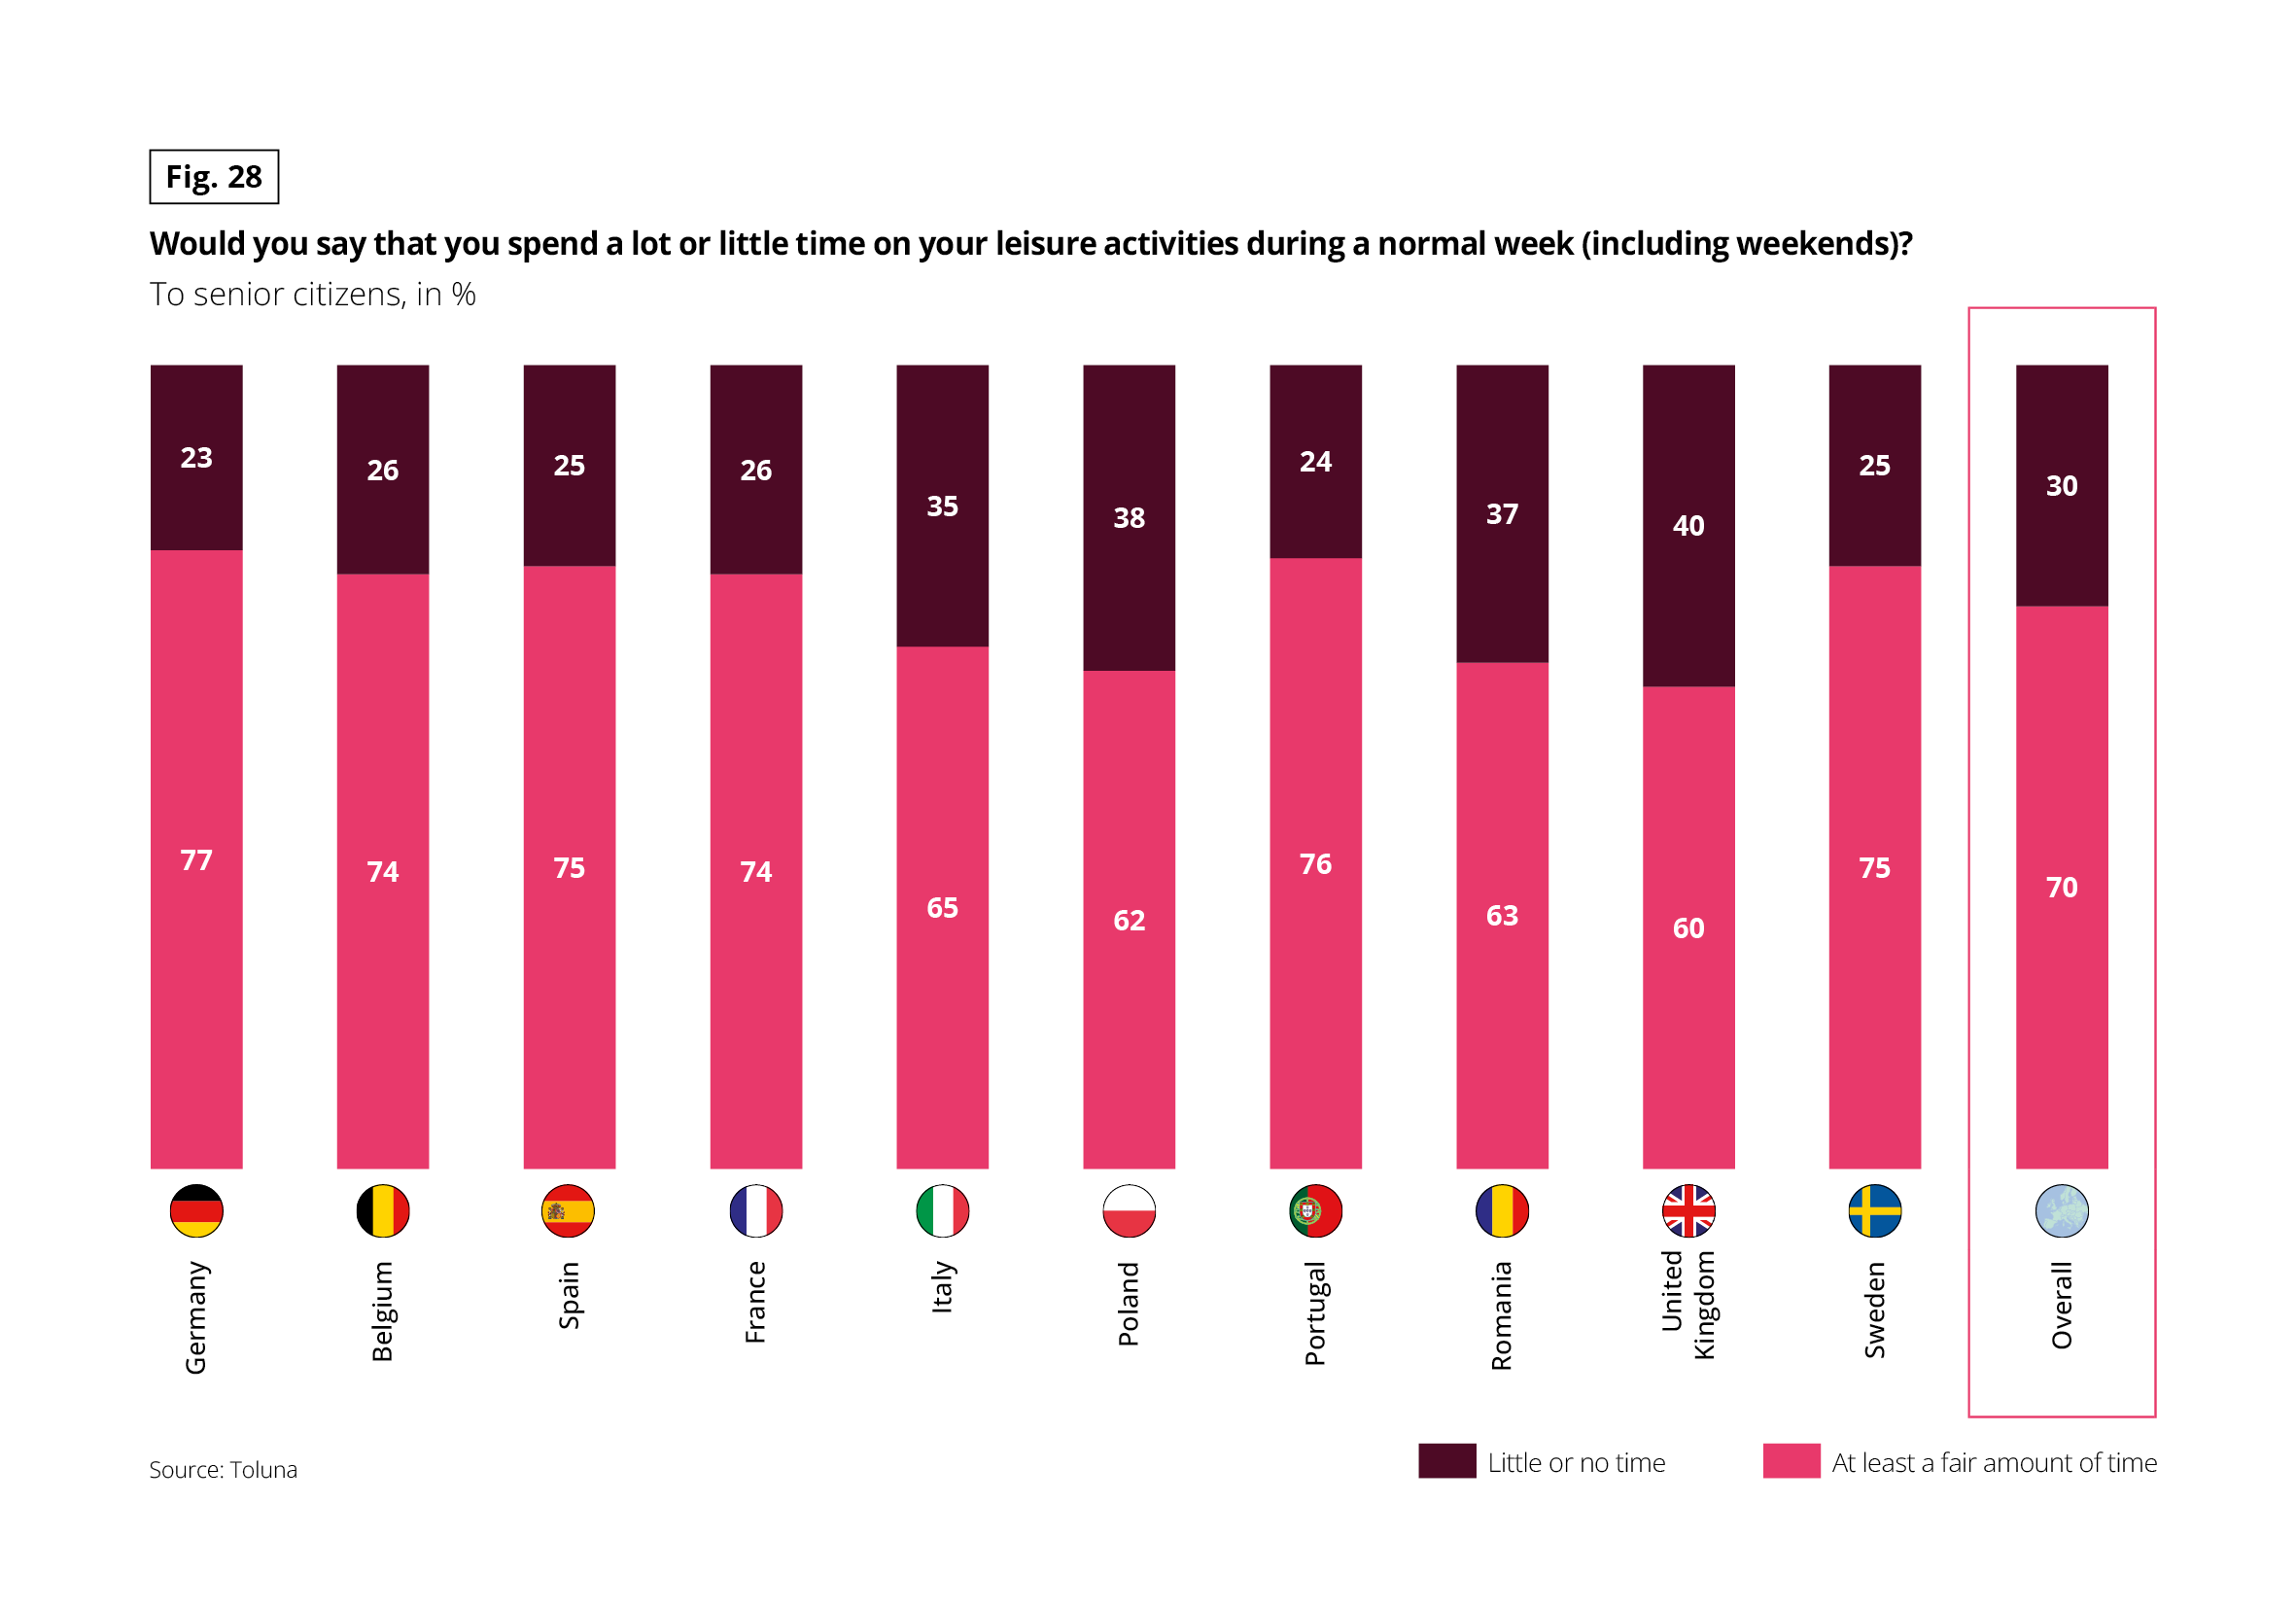 This infographic presents, in percentage, the share of seniors who report spending little or no time, or at least enough time, on leisure activities during a normal week, including weekends.
Fig 29 – Future intentions for time spent on leisure activities
Download this infographic for your presentations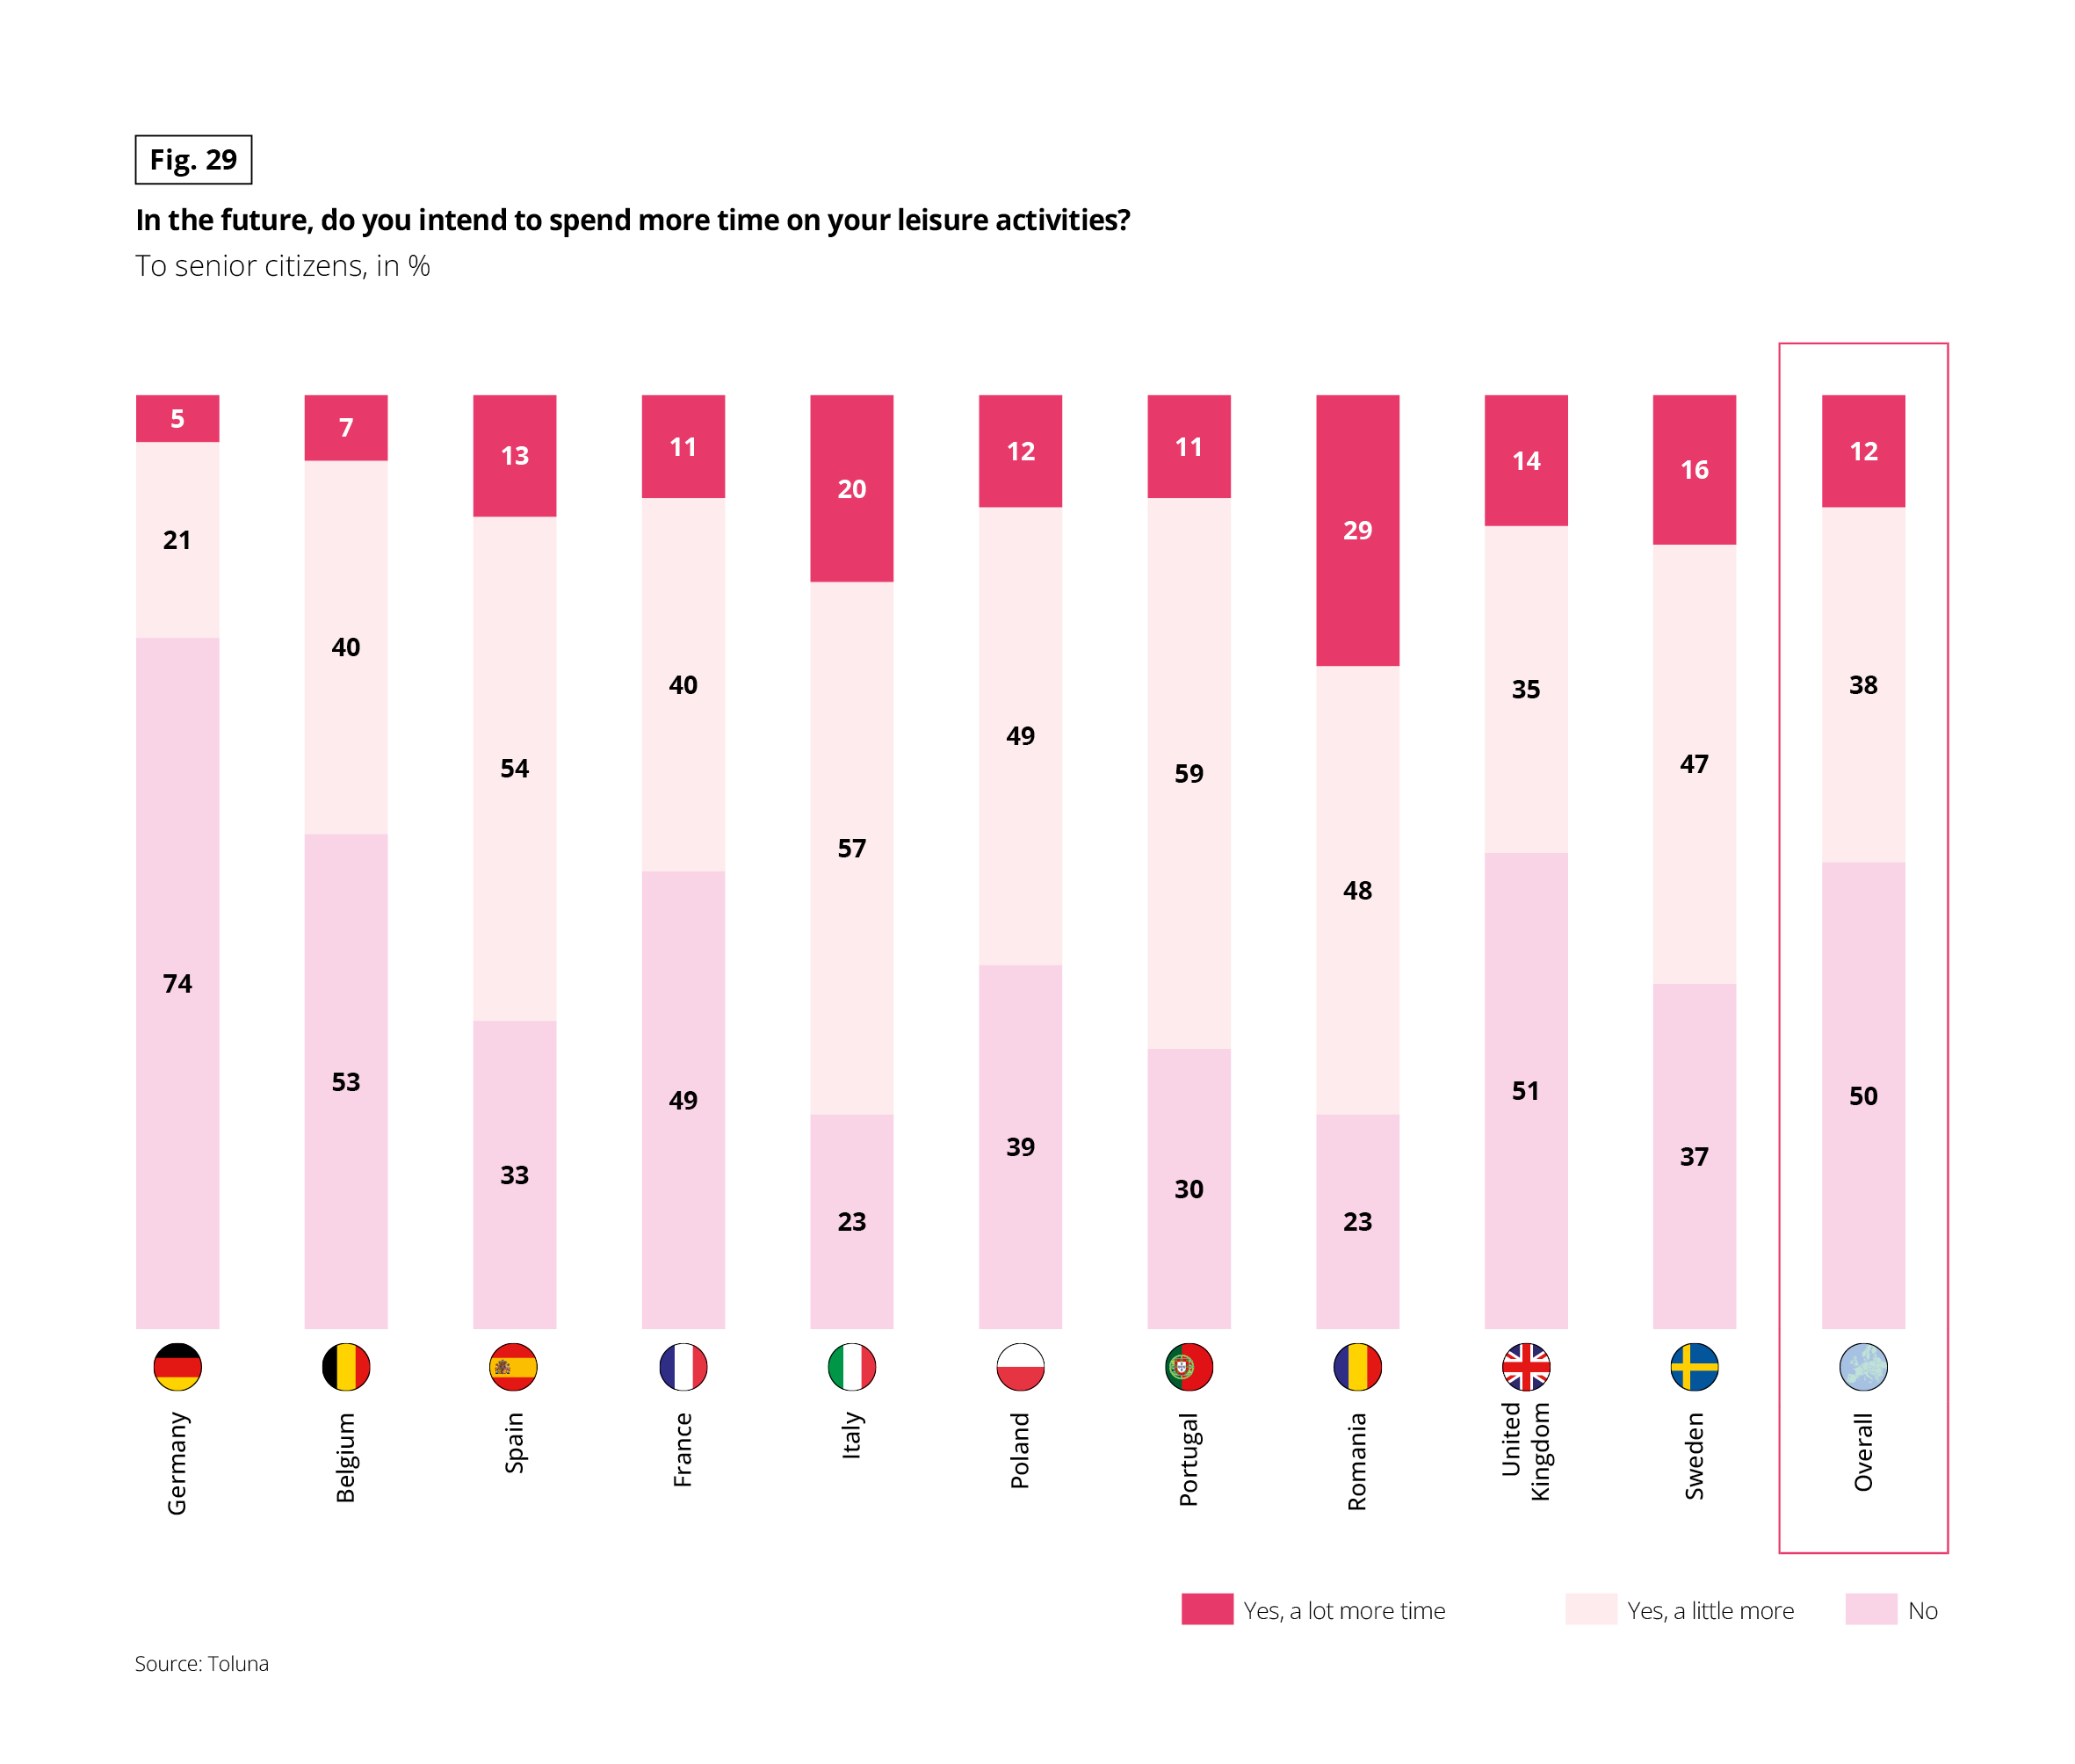 This infographic presents, in percentage, the intention of seniors to spend more time on leisure activities in the future.
The responses are divided into three categories: no, yes a little more, and yes much more. The stacked bars allow for comparison by country. The secondary graphic elements are decorative.
Overall: No: 50% Yes, a little more: 38% Yes, much more: 12%
Examples of variations by country: Germany: 74% no, 21% yes a little more, 5% yes much more Spain: 33% no, 54% yes a little more, 13% yes much more Italy: 23% no, 57% yes a little more, 20% yes much more Romania: 23% no, 48% yes a little more, 29% yes much more
The main message is that the dominant intention is either to maintain or moderately increase the time spent on leisure activities.
Source: Toluna.
This infographic presents, in percentage, the intention of seniors to spend more time on leisure activities in the future.
The responses are divided into three categories: no, yes a little more, and yes much more. The stacked bars allow for comparison by country. The secondary graphic elements are decorative.
Overall: No: 50% Yes, a little more: 38% Yes, much more: 12%
Examples of variations by country: Germany: 74% no, 21% yes a little more, 5% yes much more Spain: 33% no, 54% yes a little more, 13% yes much more Italy: 23% no, 57% yes a little more, 20% yes much more Romania: 23% no, 48% yes a little more, 29% yes much more
The main message is that the dominant intention is either to maintain or moderately increase the time spent on leisure activities.
Source: Toluna.
Fig 30 – Frequency of vacations or weekends
Download this infographic for your presentations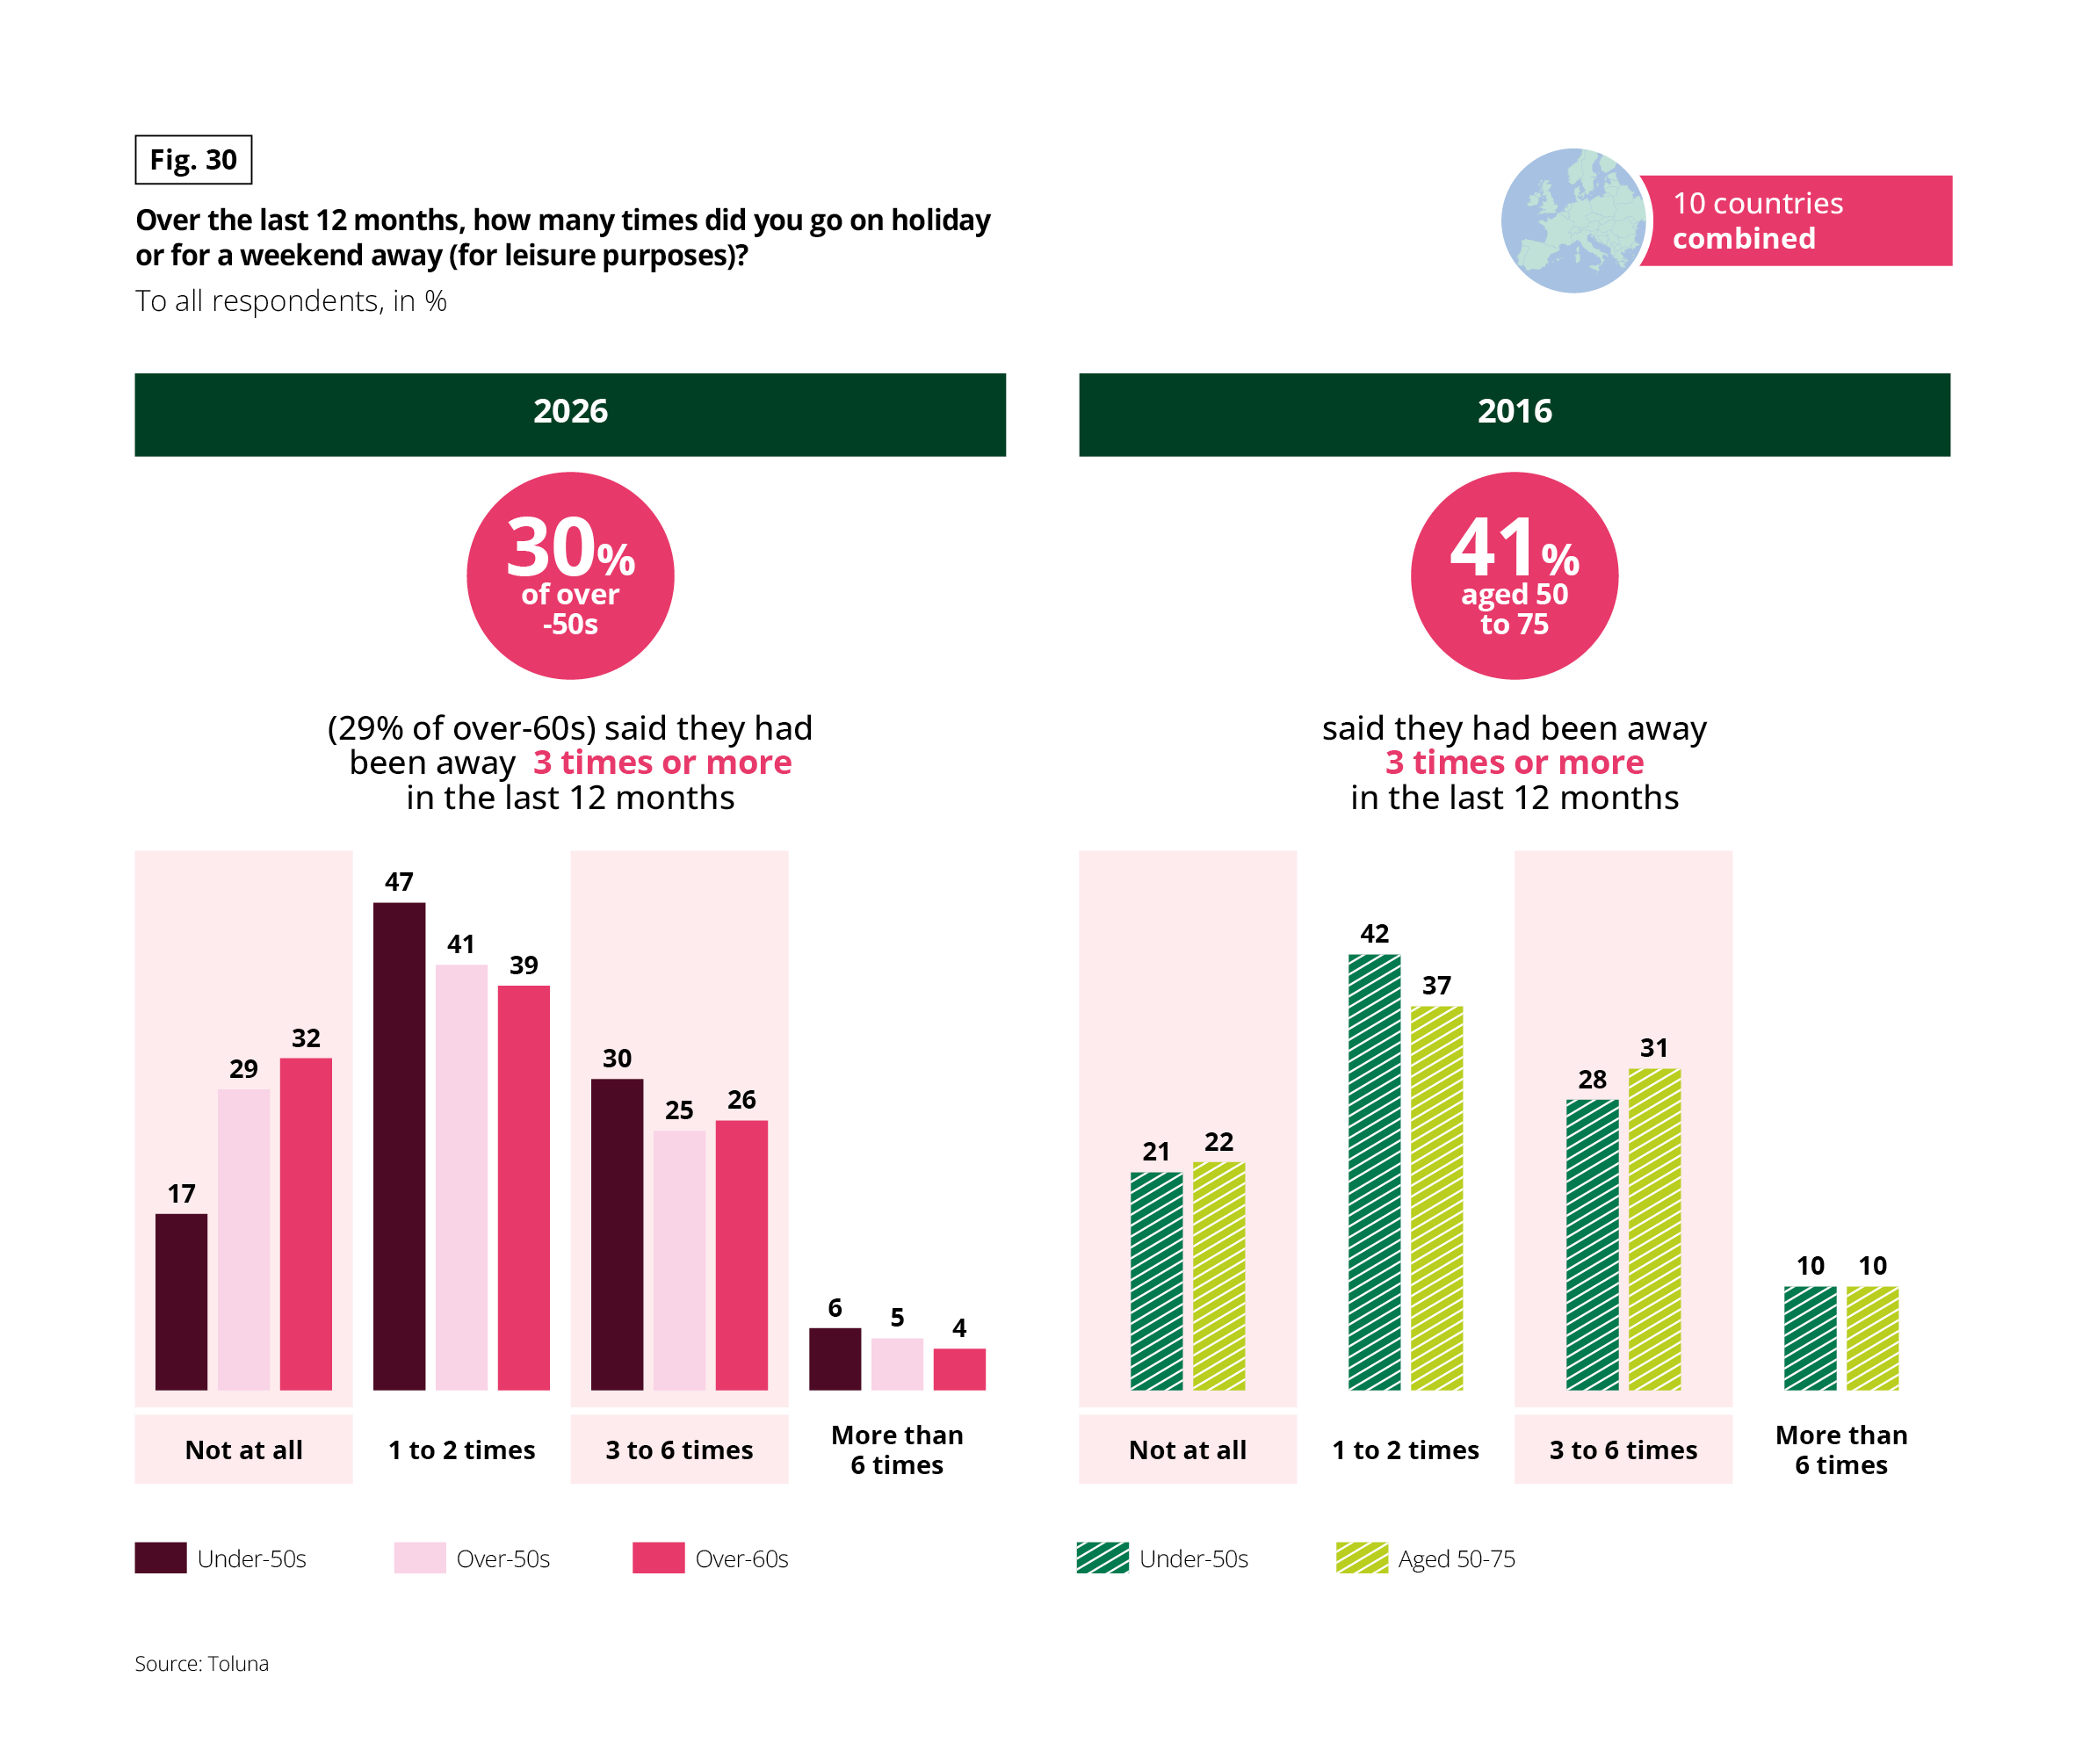 This infographic compares the frequency of vacations or weekends for personal reasons over the past 12 months, expressed as a percentage.
Fig 31 – Effects of age and income on leisure and culture
Download this infographic for your presentations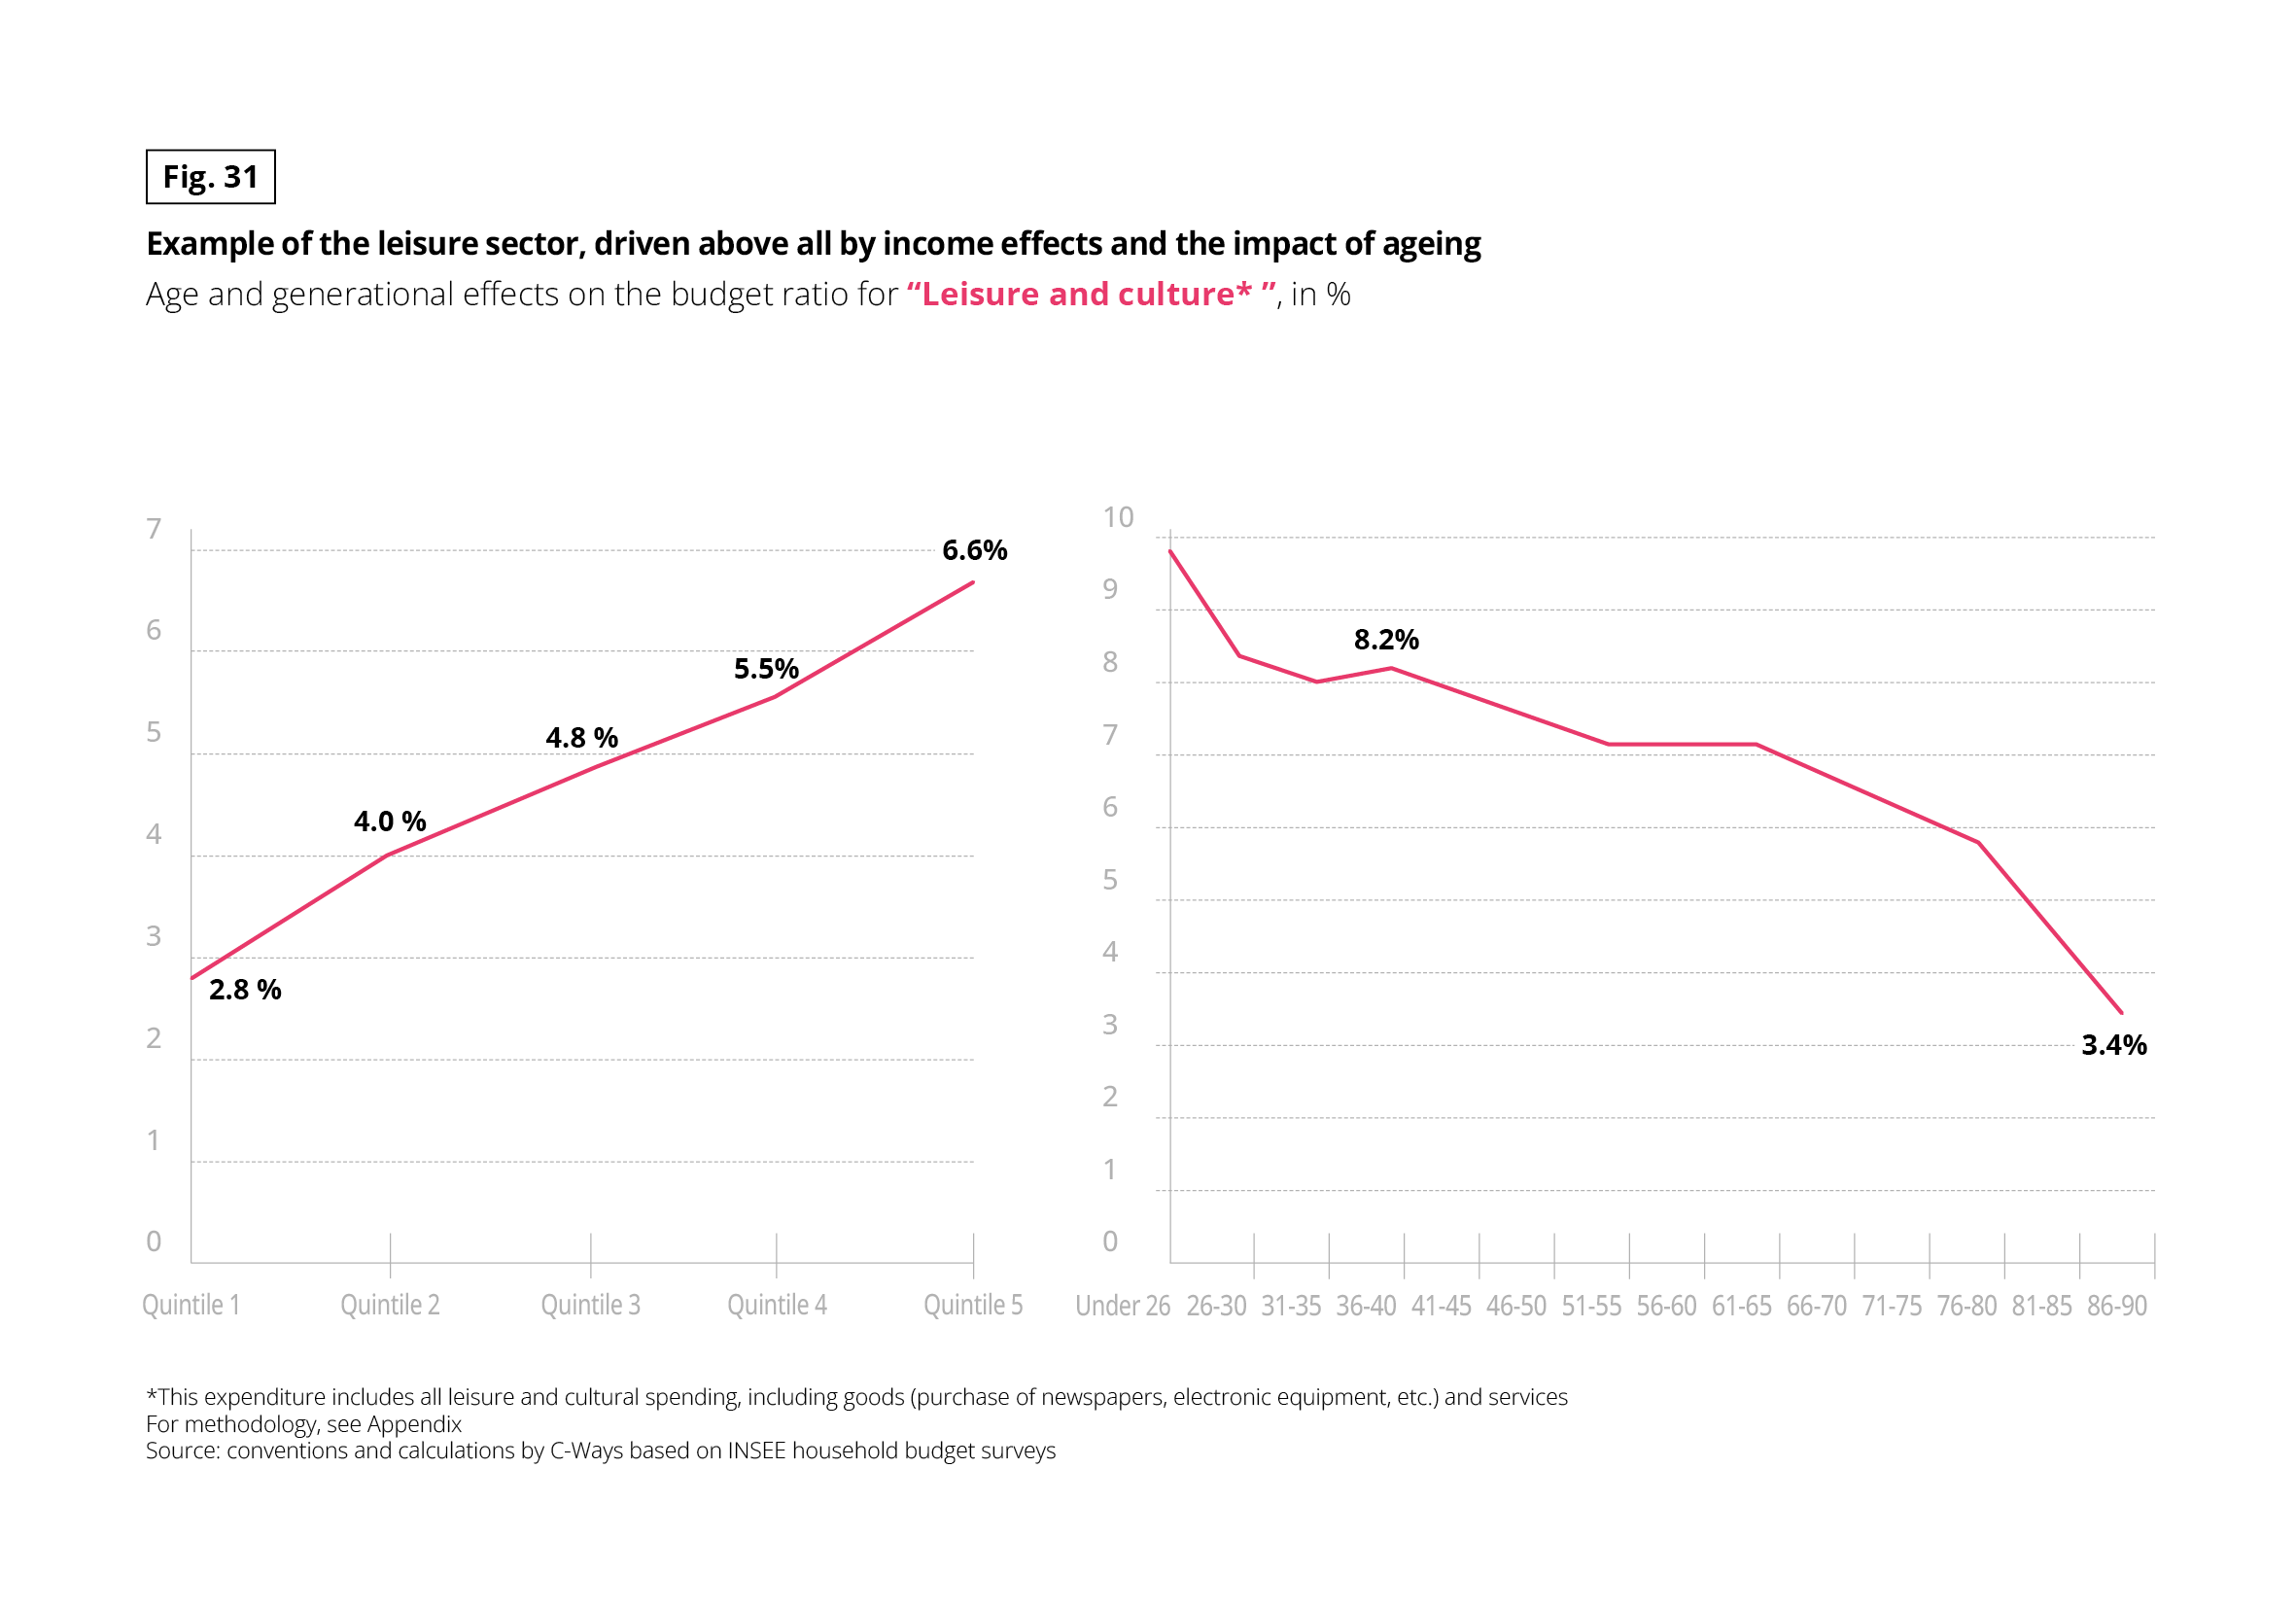 This infographic presents the effects of income and age on the budget coefficient for leisure and culture expenses, expressed as a percentage.
SLOWER CONSUMPTION ON SERVICE PLATFORMS
Still in terms of leisure activities, senior citizens were far less keen on subscriptions than the under-60s. This is particularly true in the fields of music and video. Sweden, the country of origin of the streaming giant Spotify, is the country most attracted by this indoor leisure consumption. This can no doubt be explained by its climate.
Fig 32 – Monthly subscriptions held by seniors
Download this infographic for your presentations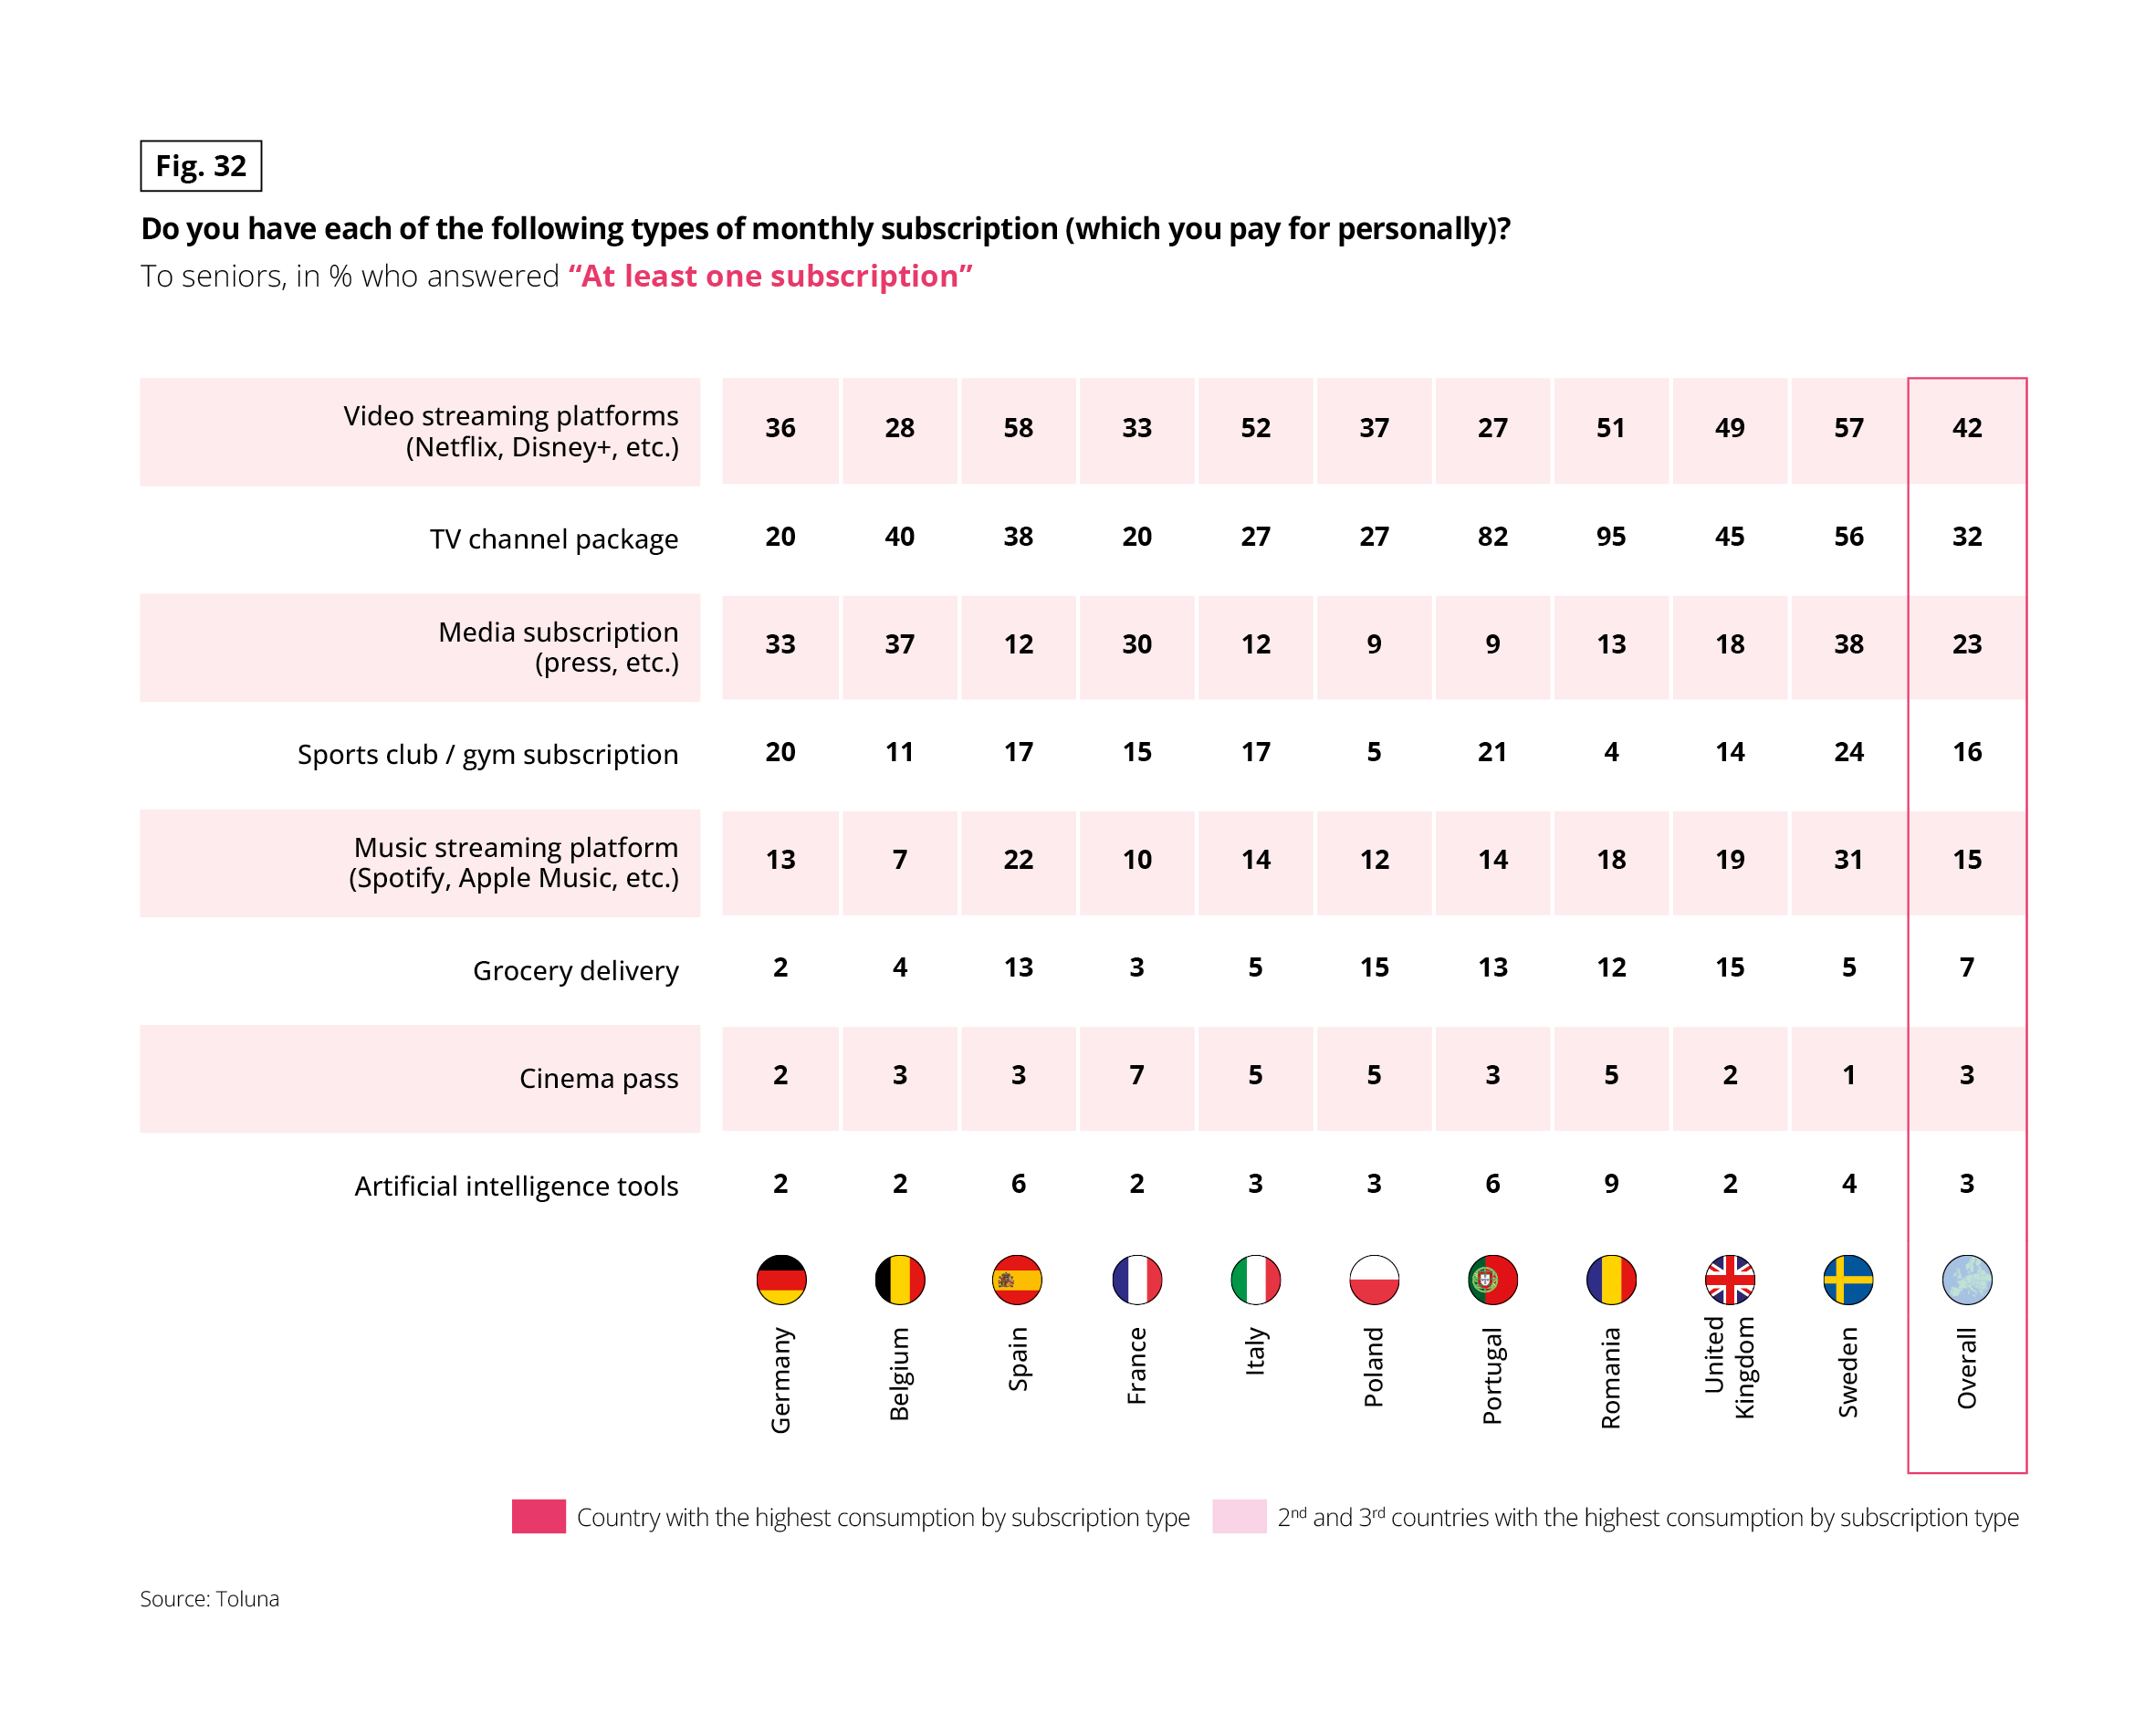 This infographic presents the percentage of seniors who report having at least one monthly subscription by type.