
National preference: a sliding scale


 3 min
reading time
3 min
reading time
DOMESTIC PREFERENCE PREVAILS IN MAJOR CAR-MAKING NATIONS
Is this down to the ambiguity surrounding what constitutes a vehicle’s nationality? Whatever the cause, automotive nationalism varies dramatically when it comes to choosing the brand of one’s next car. While on average only 1 in 5 respondents would choose to buy a car from a domestic brand, the divergence in viewpoints is stark. On this point, Japan shows an overwhelming preference for buying Japanese first and foremost. China and the US align with Japan, albeit more moderately, with a clear majority favouring domestic brands. Germany follows suit, as does France to a lesser extent. Conversely, “brandless” markets such as the Netherlands, Belgium and Portugal logically pay little heed to this criterion. Meanwhile, the sharp drop in Italian car production may account for the modest score recorded there.
Fig. 19 – Preference for purchasing a brand from one’s own country, by country (% of respondents)
Download this infographic for your presentations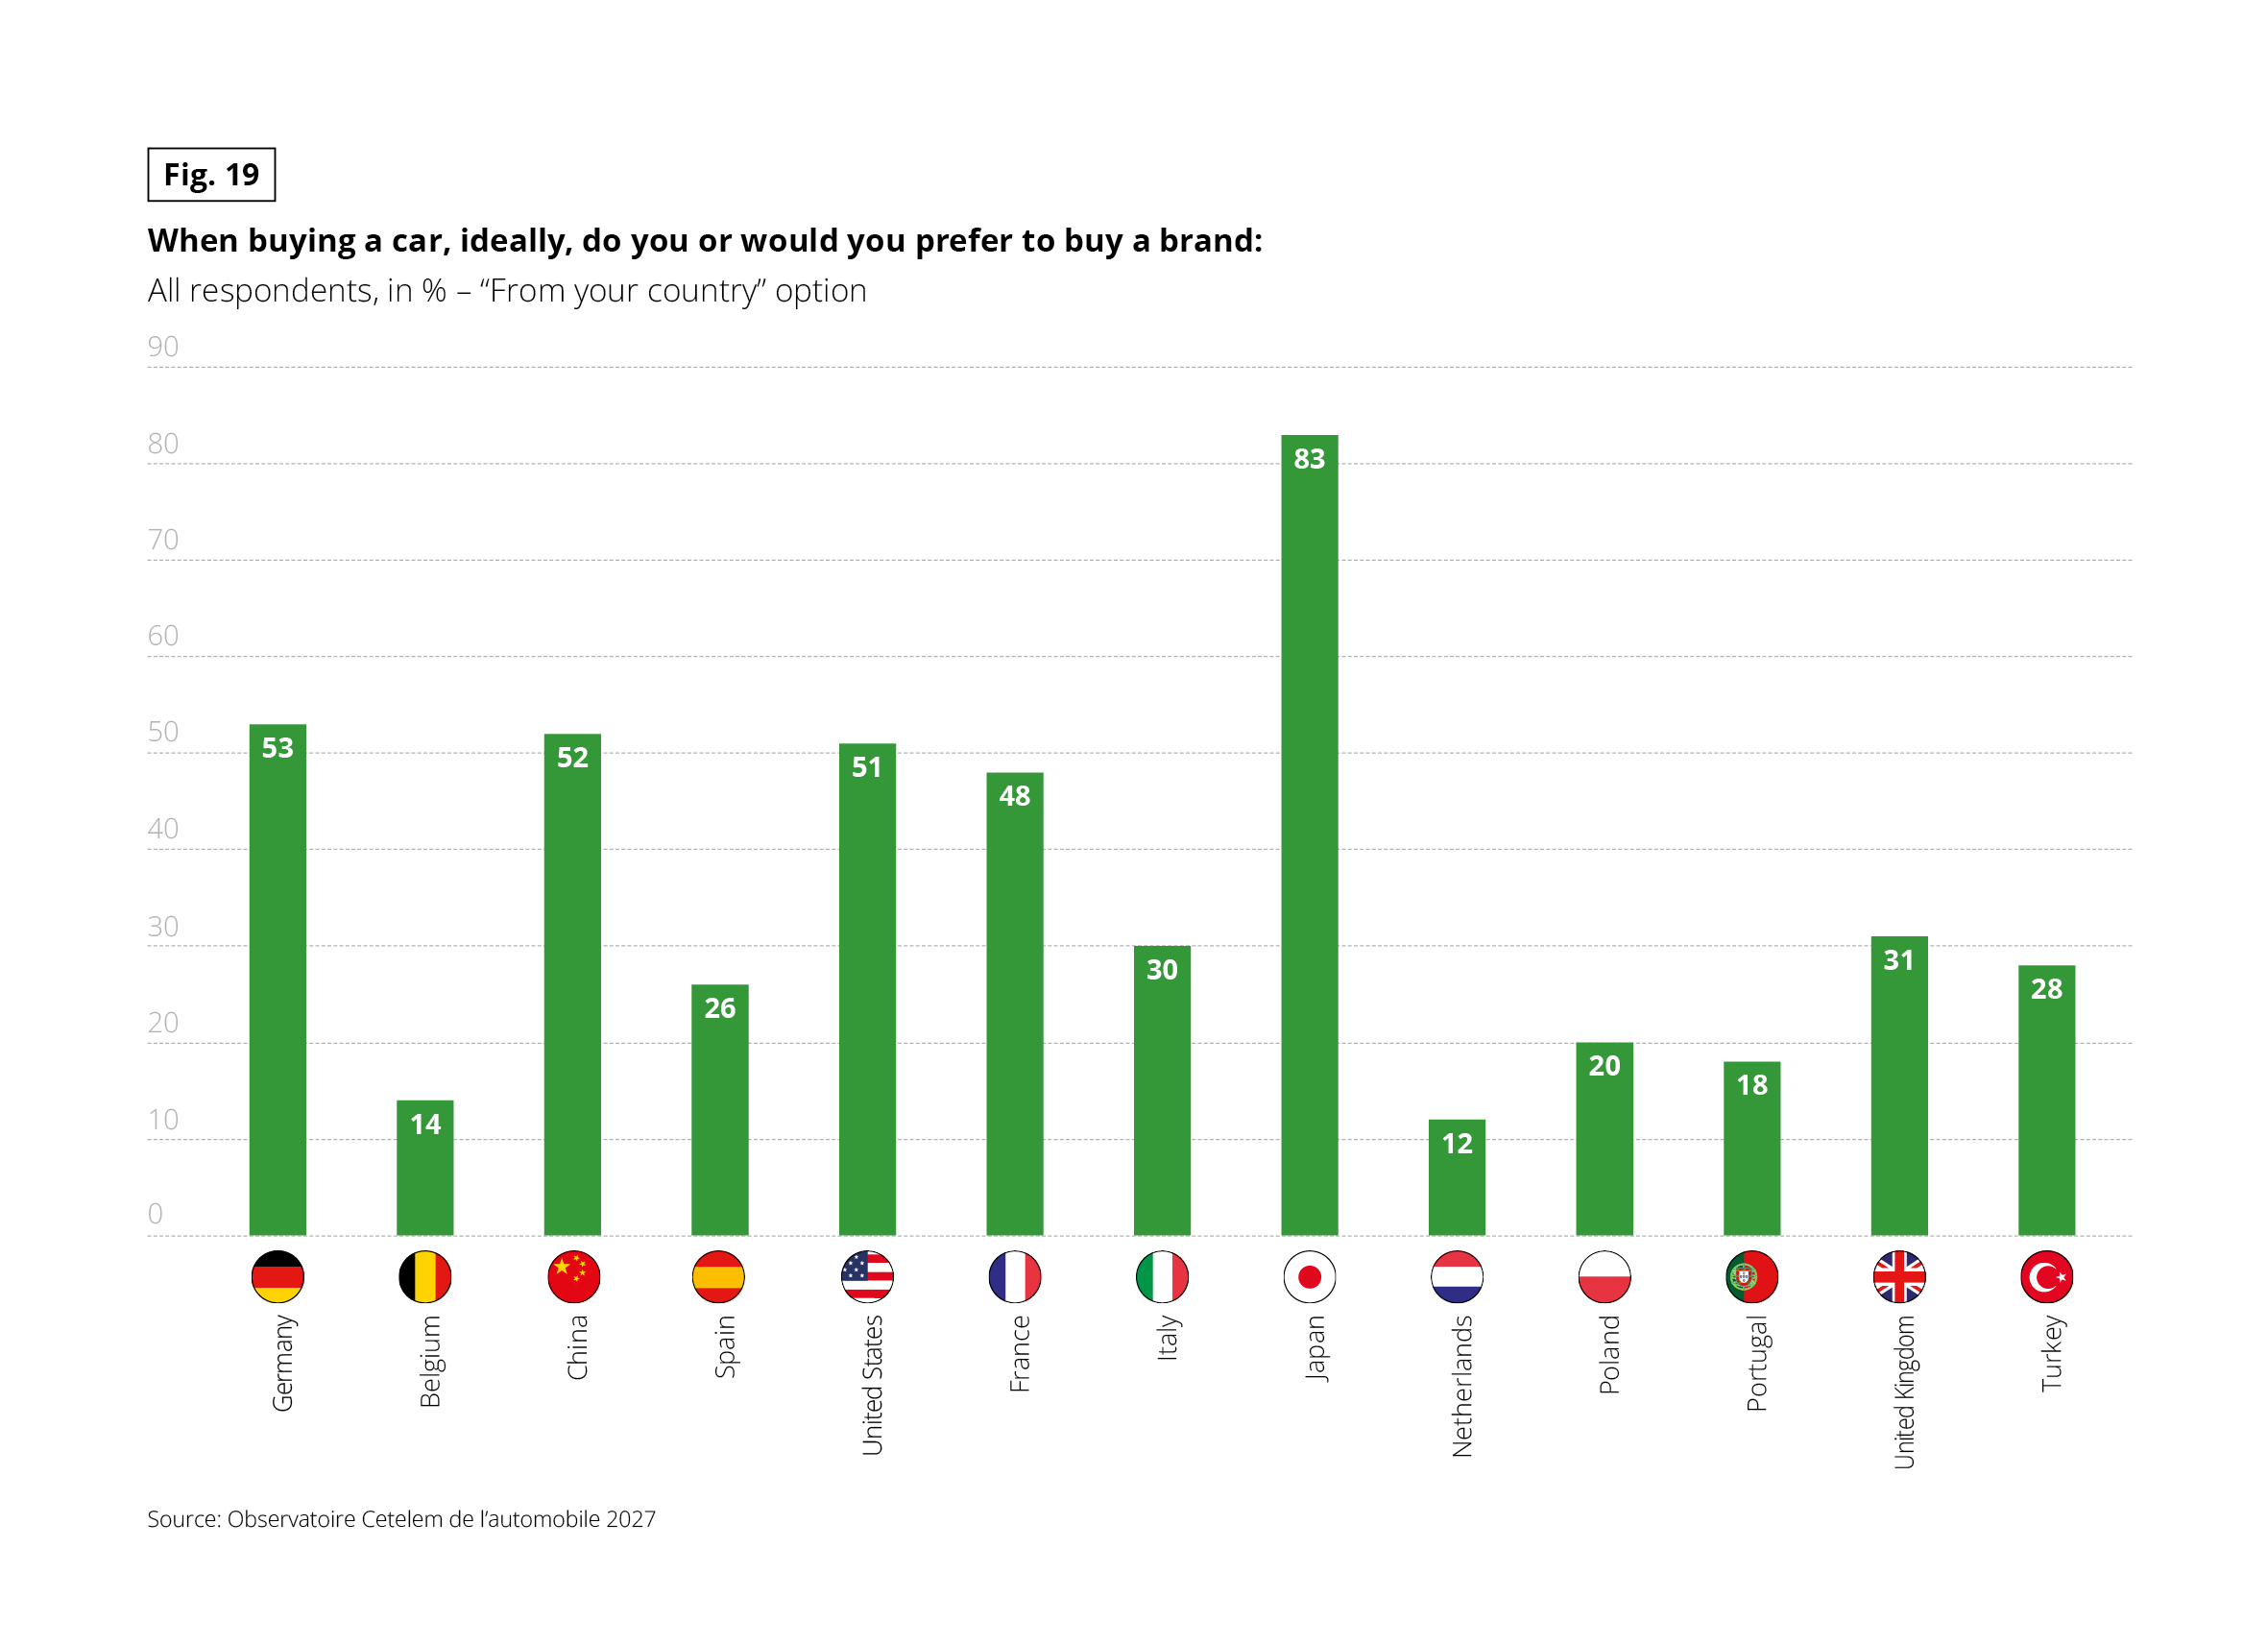 Vertical bar chart showing, for 13 countries, the share of respondents who prefer or would prefer to buy a brand from their own country (“From your country” option). All respondents, in percent.
Source: Observatoire Cetelem de l’automobile 2027.
• Germany: 53
• Belgium: 14
• China: 52
• Spain: 26
• United States: 51
• France: 48
• Italy: 30
• Japan: 83
• Netherlands: 12
• Poland: 20
• Portugal: 18
• United Kingdom: 31
• Turkey: 28
Key takeaways: Japan (83%) is far ahead. Germany (53%), China (52%), the United States (51%) and France (48%) follow. The Netherlands (12%) and Belgium (14%) are lowest.
Vertical bar chart showing, for 13 countries, the share of respondents who prefer or would prefer to buy a brand from their own country (“From your country” option). All respondents, in percent.
Source: Observatoire Cetelem de l’automobile 2027.
• Germany: 53
• Belgium: 14
• China: 52
• Spain: 26
• United States: 51
• France: 48
• Italy: 30
• Japan: 83
• Netherlands: 12
• Poland: 20
• Portugal: 18
• United Kingdom: 31
• Turkey: 28
Key takeaways: Japan (83%) is far ahead. Germany (53%), China (52%), the United States (51%) and France (48%) follow. The Netherlands (12%) and Belgium (14%) are lowest.
NATIONAL CHAMPIONS OFTEN HOLD SWAY
In Germany and Japan, the two countries where automotive nationalism is most pronounced, the top three sales slots are held entirely by domestic brands. In France, the picture is identical if Dacia, a subsidiary of Renault, is counted as a domestic brand.
Fig. 20 – Top 3 brands by market share in the countries in 2025 (% of passenger vehicle sales)
Download this infographic for your presentations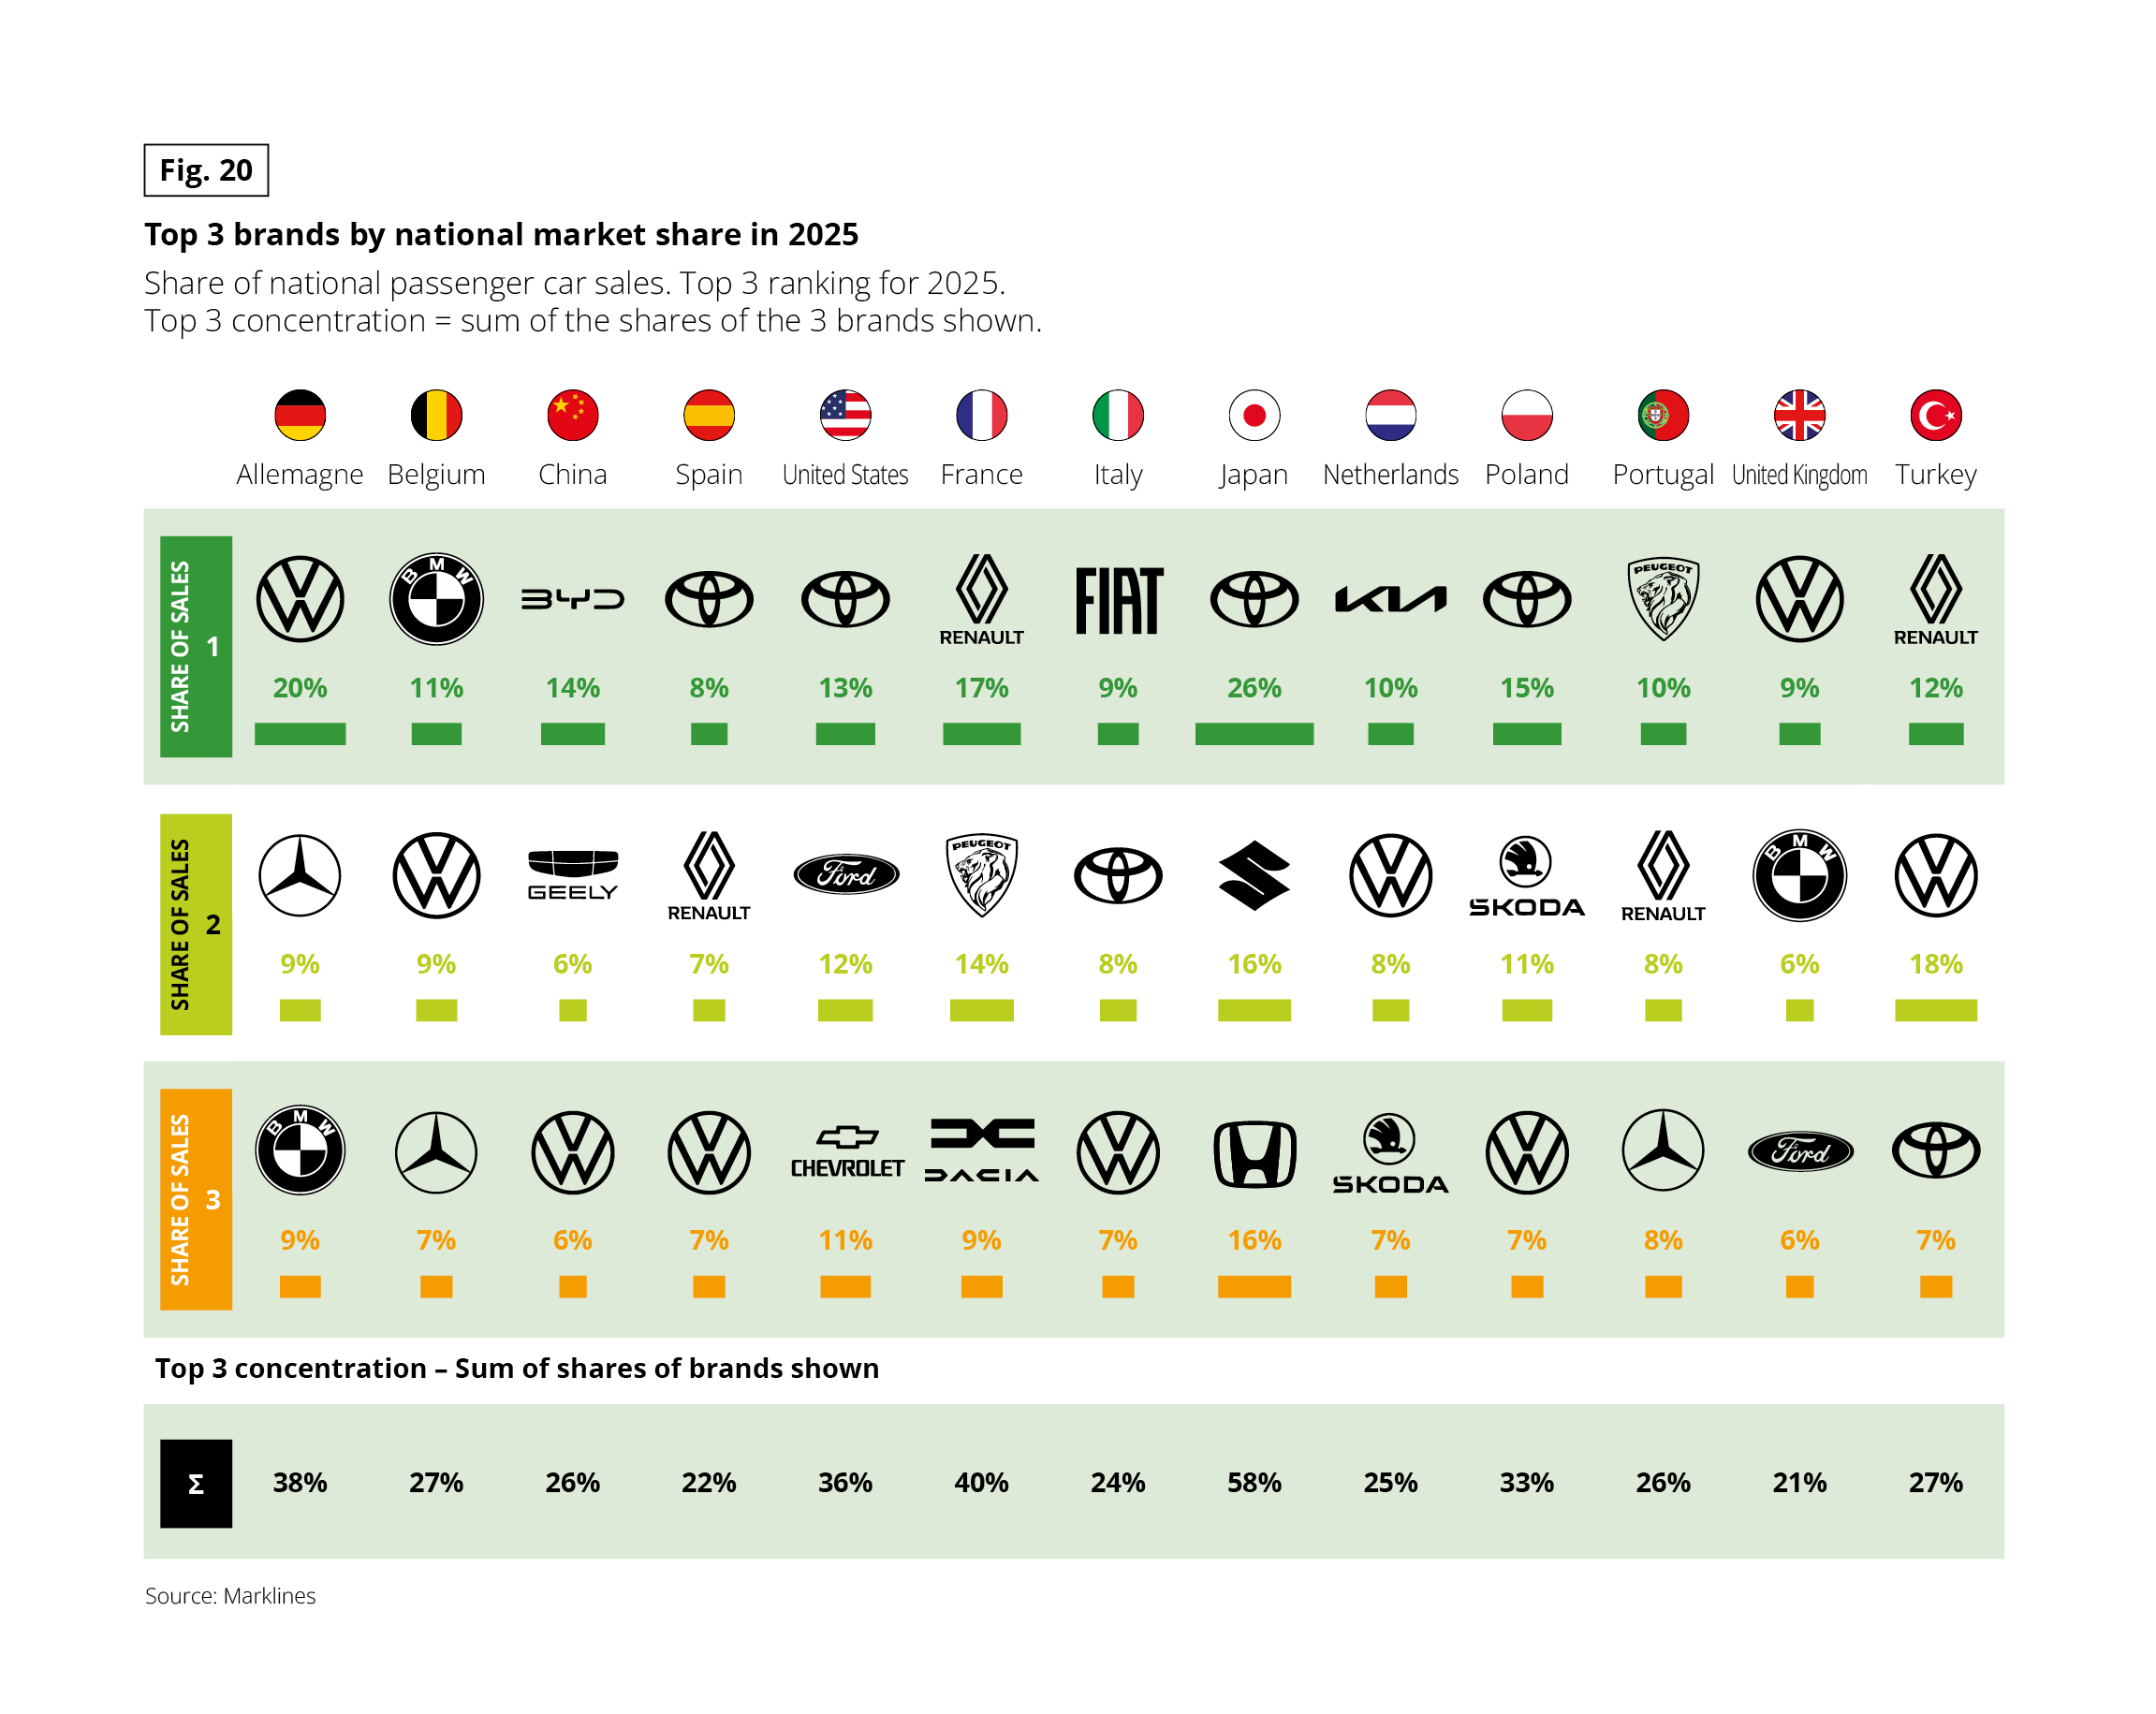 Table showing, for 13 countries, the three brands with the highest share of national passenger car sales in 2025, with their percentage share. A final row gives the top 3 concentration, i.e. the sum of the shares of the three brands shown. Source: Marklines. For each country: brand ranked 1; brand ranked 2; brand ranked 3; top 3 concentration.
• Germany: Volkswagen 20%; Mercedes-Benz 9%; BMW 9%; concentration 38%
• Belgium: BMW 11%; Volkswagen 9%; Mercedes-Benz 7%; concentration 27%
• China: BYD 14%; Geely 6%; Volkswagen 6%; concentration 26%
• Spain: Toyota 8%; Renault 7%; Volkswagen 7%; concentration 22%
• United States: Toyota 13%; Ford 12%; Chevrolet 11%; concentration 36%
• France: Renault 17%; Peugeot 14%; Dacia 9%; concentration 40%
• Italy: Fiat 9%; Toyota 8%; Volkswagen 7%; concentration 24%
• Japan: Toyota 26%; Suzuki 16%; Honda 16%; concentration 58%
• Netherlands: Kia 10%; Volkswagen 8%; Skoda 7%; concentration 25%
• Poland: Toyota 15%; Skoda 11%; Volkswagen 7%; concentration 33%
• Portugal: Peugeot 10%; Renault 8%; Mercedes-Benz 8%; concentration 26%
• United Kingdom: Volkswagen 9%; BMW 6%; Ford 6%; concentration 21%
• Turkey: Renault 12%; Volkswagen 18%; Toyota 7%; concentration 27%
Key takeaways: Toyota ranks first in four markets (Spain, United States, Japan, Poland). Volkswagen leads in Germany and the United Kingdom, Renault in France and Turkey. Japan is the most concentrated market (58%), ahead of France (40%) and Germany (38%). The United Kingdom (21%) and Spain (22%) are the most fragmented.
Table showing, for 13 countries, the three brands with the highest share of national passenger car sales in 2025, with their percentage share. A final row gives the top 3 concentration, i.e. the sum of the shares of the three brands shown. Source: Marklines. For each country: brand ranked 1; brand ranked 2; brand ranked 3; top 3 concentration.
• Germany: Volkswagen 20%; Mercedes-Benz 9%; BMW 9%; concentration 38%
• Belgium: BMW 11%; Volkswagen 9%; Mercedes-Benz 7%; concentration 27%
• China: BYD 14%; Geely 6%; Volkswagen 6%; concentration 26%
• Spain: Toyota 8%; Renault 7%; Volkswagen 7%; concentration 22%
• United States: Toyota 13%; Ford 12%; Chevrolet 11%; concentration 36%
• France: Renault 17%; Peugeot 14%; Dacia 9%; concentration 40%
• Italy: Fiat 9%; Toyota 8%; Volkswagen 7%; concentration 24%
• Japan: Toyota 26%; Suzuki 16%; Honda 16%; concentration 58%
• Netherlands: Kia 10%; Volkswagen 8%; Skoda 7%; concentration 25%
• Poland: Toyota 15%; Skoda 11%; Volkswagen 7%; concentration 33%
• Portugal: Peugeot 10%; Renault 8%; Mercedes-Benz 8%; concentration 26%
• United Kingdom: Volkswagen 9%; BMW 6%; Ford 6%; concentration 21%
• Turkey: Renault 12%; Volkswagen 18%; Toyota 7%; concentration 27%
Key takeaways: Toyota ranks first in four markets (Spain, United States, Japan, Poland). Volkswagen leads in Germany and the United Kingdom, Renault in France and Turkey. Japan is the most concentrated market (58%), ahead of France (40%) and Germany (38%). The United Kingdom (21%) and Spain (22%) are the most fragmented.
LOCAL ORIGIN STRUGGLES TO WITHSTAND FOREIGN COMPETITION…
National preference falters when faced with attractive foreign alternatives. On average, only 3 in 10 drivers have decided against buying a foreign-branded car they liked in order to opt for a local or regional vehicle instead. On this measure, the US, followed by China, demonstrates the strongest resistance (43%). The exact opposite is true, once again, in Italy, where automotive patriotism appears to have run its course. One must look to major cities and younger, predominantly male demographics to find the strongest expressions of brand patriotism.
Fig. 21 – Have you already given up a foreign brand you liked in favor of a brand from your regional area? Percentage of “yes” (%)
Download this infographic for your presentations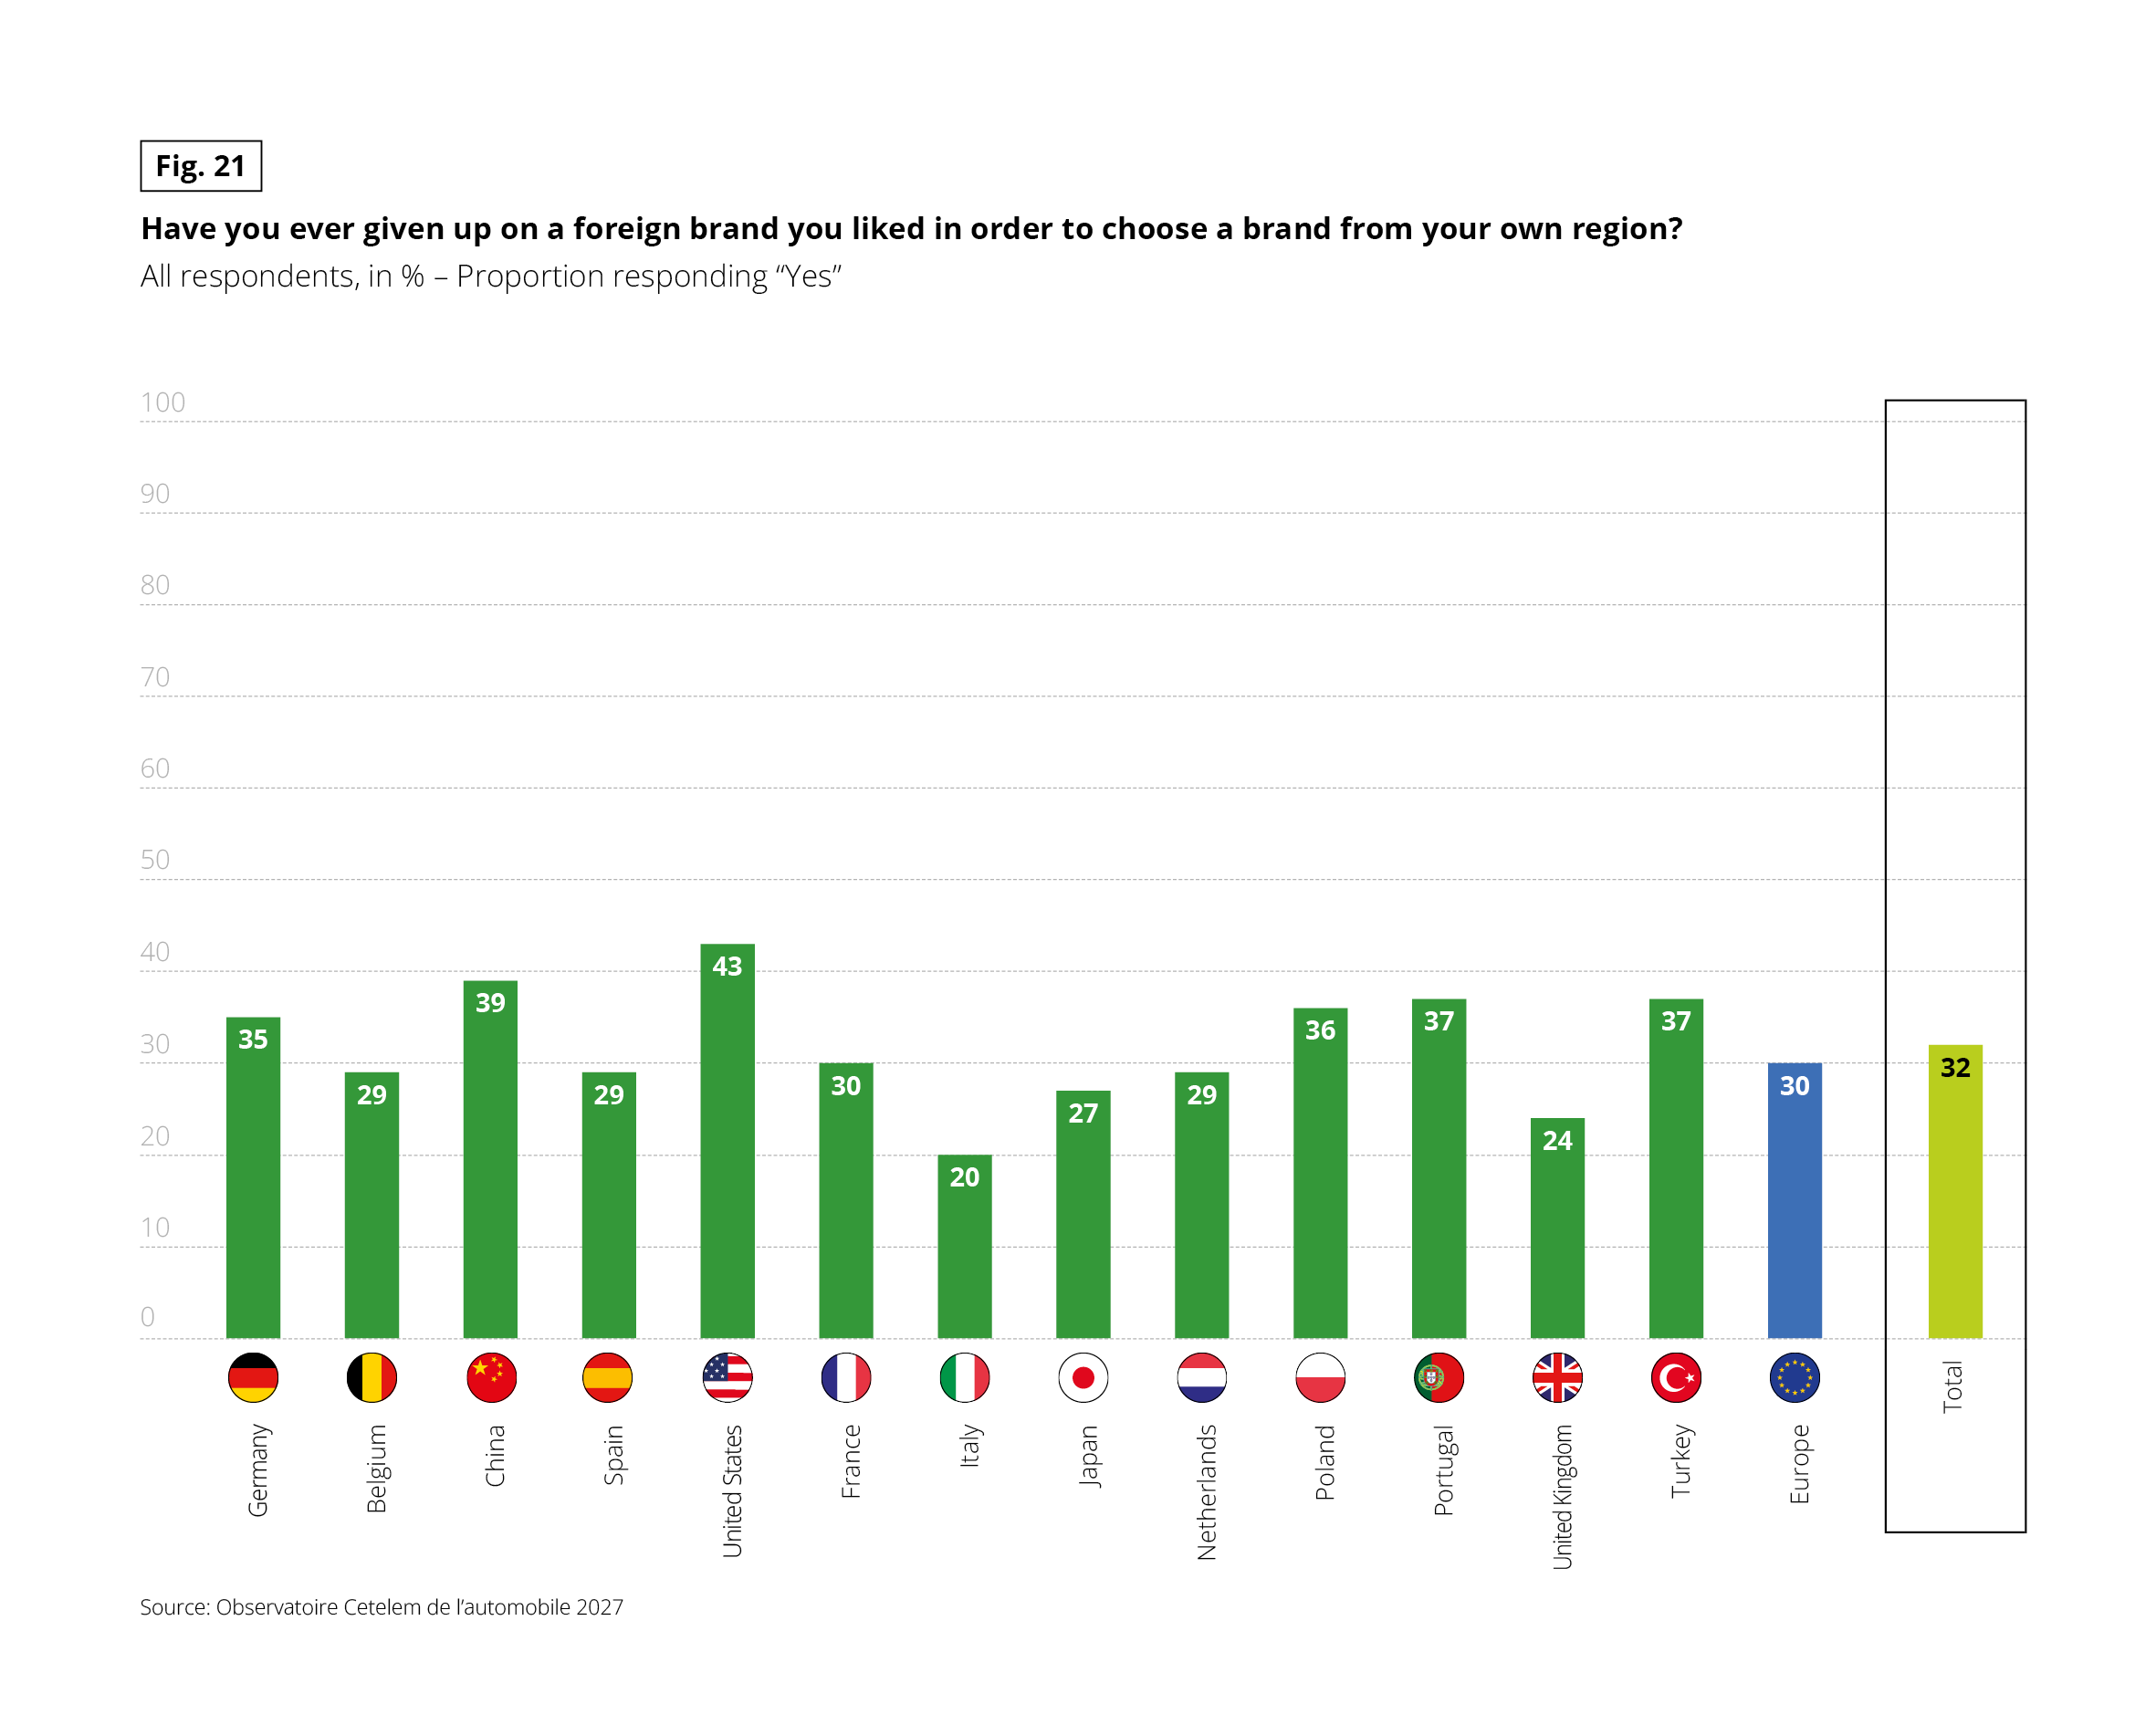 Vertical bar chart. Question: “Have you ever given up on a foreign brand you liked in order to choose a brand from your own region?” Base: all respondents, in %, proportion answering “Yes”. Source: Observatoire Cetelem de l’automobile 2027.
Across all countries combined, 32% answered yes. The United States has the highest share (43%) and Italy the lowest (20%).
Data by country: Germany 35%, Belgium 29%, China 39%, Spain 29%, United States 43%, France 30%, Italy 20%, Japan 27%, Netherlands 29%, Poland 36%, Portugal 37%, United Kingdom 24%, Turkey 37%. The European average is 30%. The total for all countries is 32%.
Vertical bar chart. Question: “Have you ever given up on a foreign brand you liked in order to choose a brand from your own region?” Base: all respondents, in %, proportion answering “Yes”. Source: Observatoire Cetelem de l’automobile 2027.
Across all countries combined, 32% answered yes. The United States has the highest share (43%) and Italy the lowest (20%).
Data by country: Germany 35%, Belgium 29%, China 39%, Spain 29%, United States 43%, France 30%, Italy 20%, Japan 27%, Netherlands 29%, Poland 36%, Portugal 37%, United Kingdom 24%, Turkey 37%. The European average is 30%. The total for all countries is 32%.
…YET DRIVERS REMAIN WILLING TO PAY A SMALL PREMIUM FOR A DOMESTIC CAR
Even so, consumers show a modest degree of financial goodwill when purchasing a car from their own country or a neighbouring state. Fully 76% state they are prepared to pay more, with Chinese, American, Turkish and Polish buyers leading the way. Paying more, but only up to a point: typically around 5%. Younger drivers reinforce their support for local brands by showing significantly greater generosity. Indeed, 9 in 10 young buyers would accept a price premium, with 4 in 10 estimating this mark-up at between 5% and 10%.
Fig. 22 – Maximum additional cost accepted for the purchase of a car from a brand in their country or geographical area (% accepting an additional cost)
Download this infographic for your presentations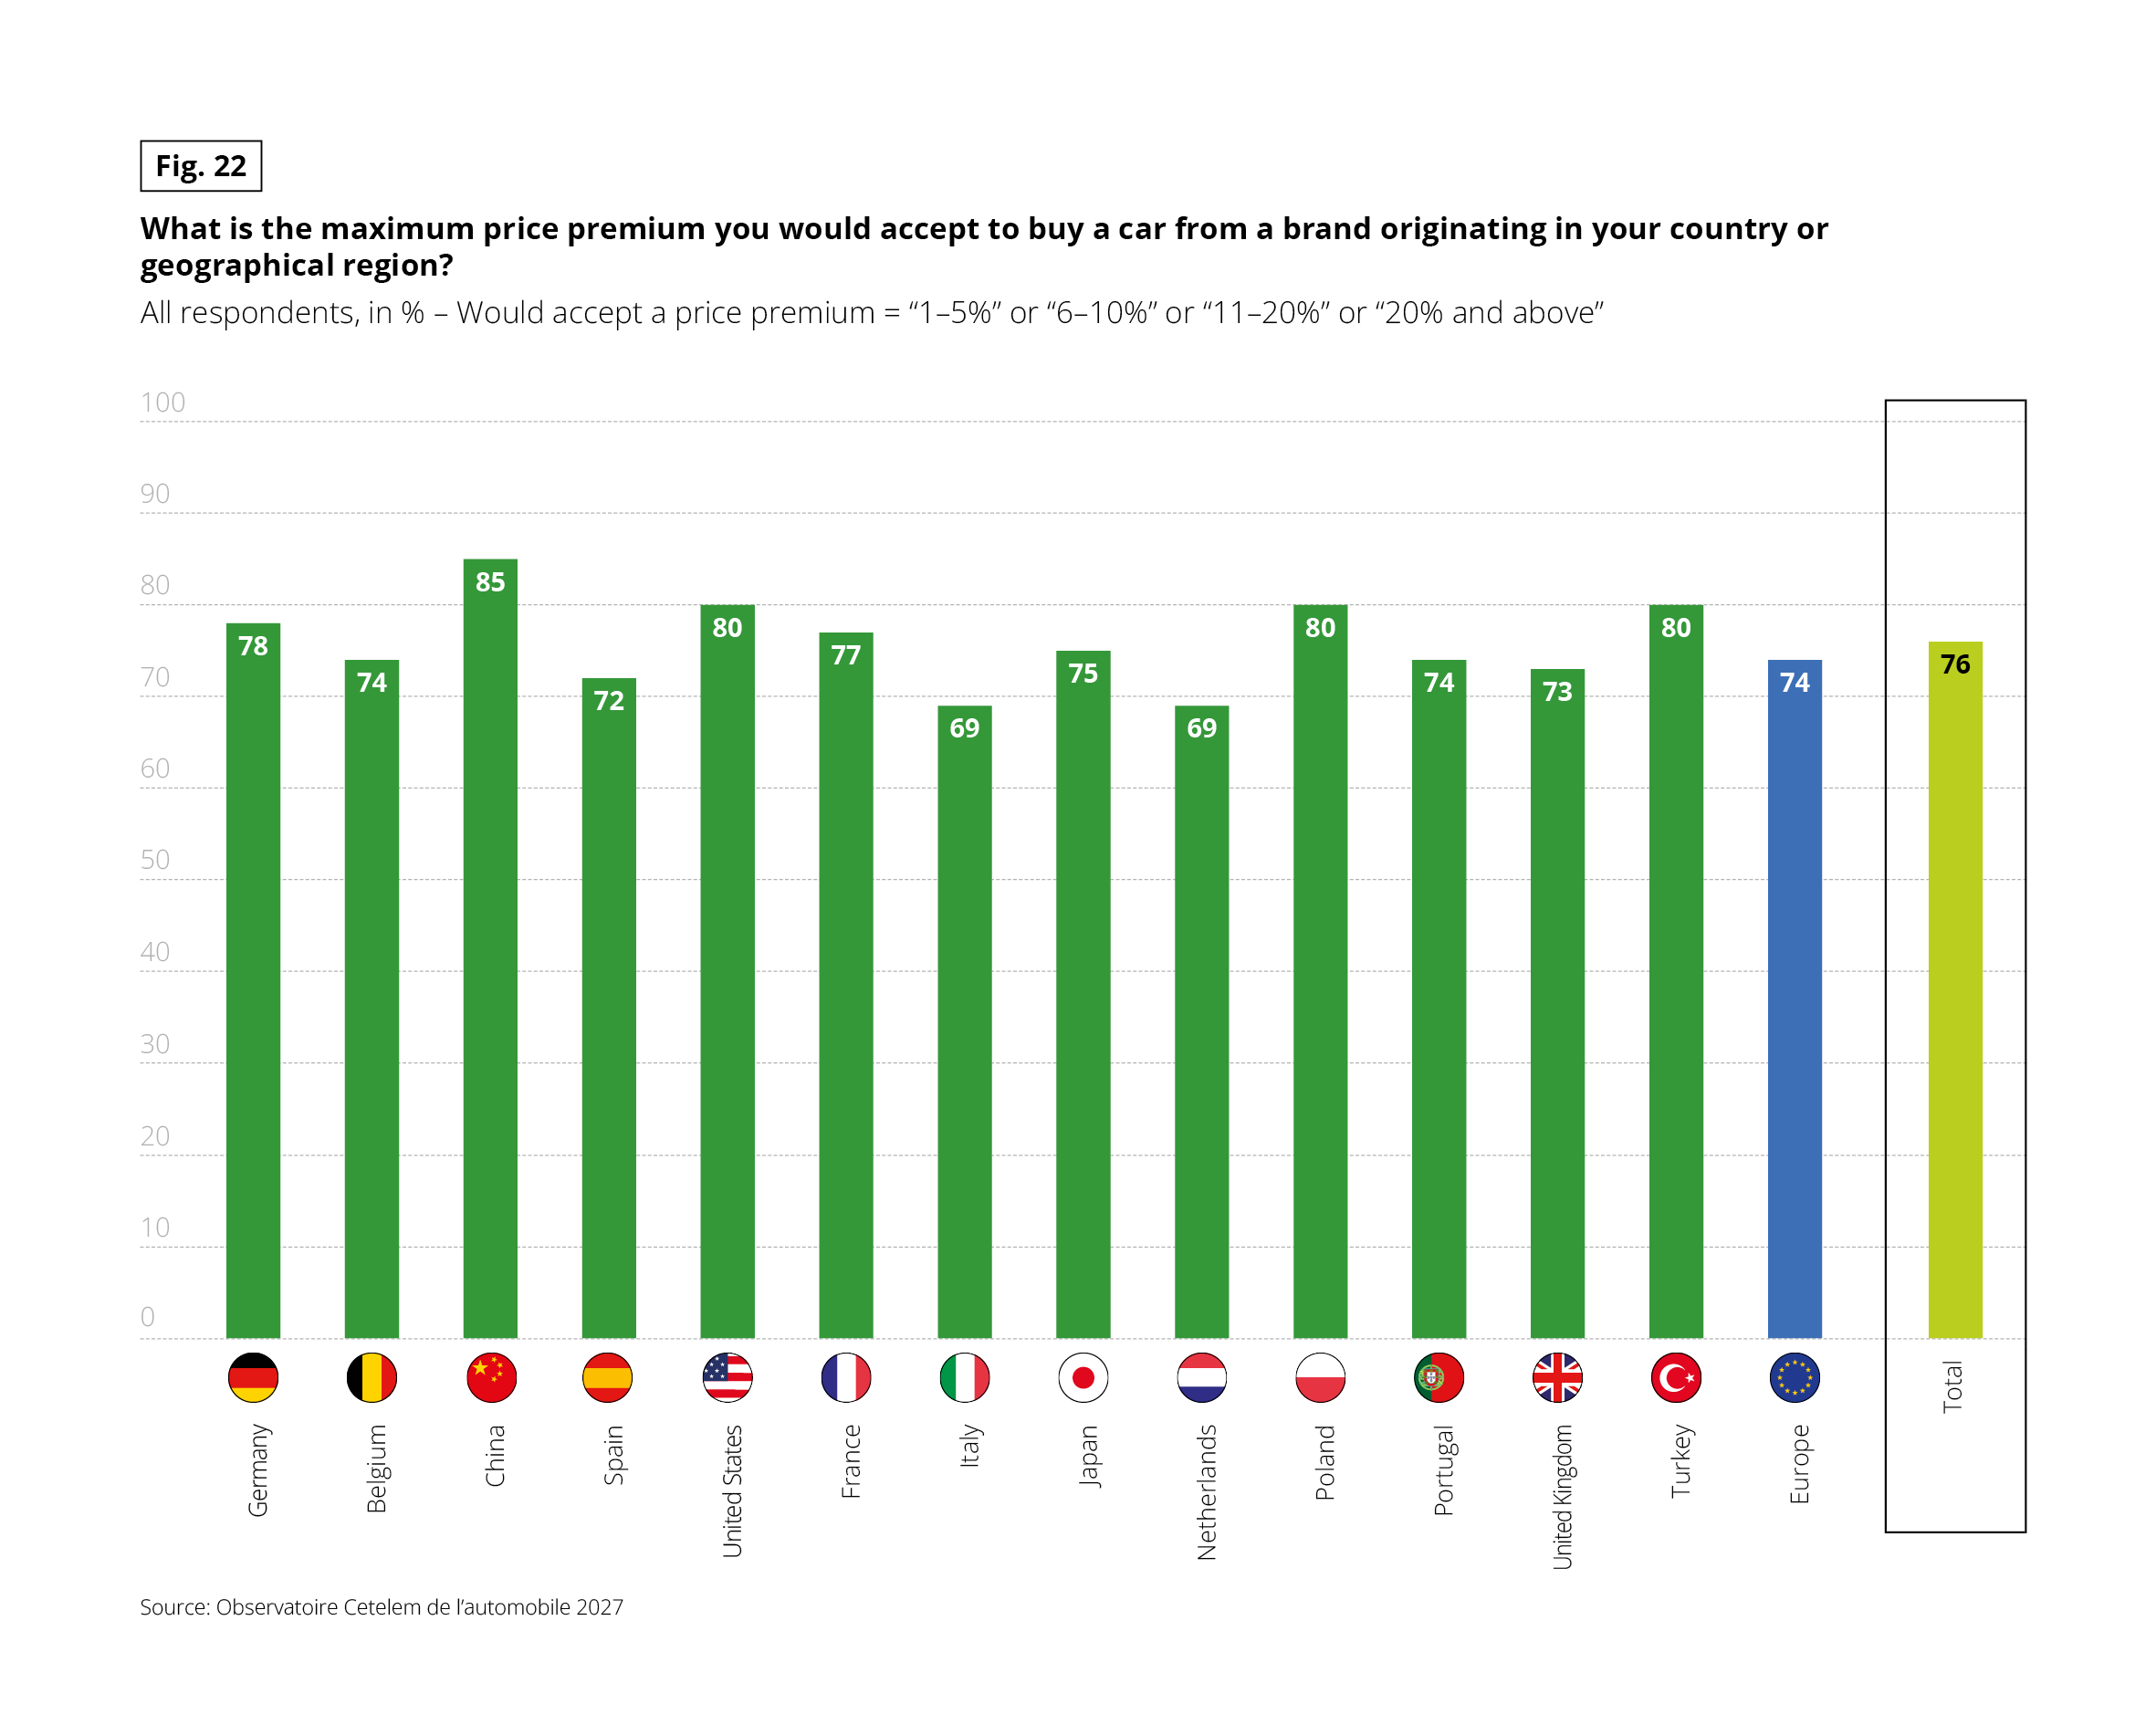 Vertical bar chart. Question: “What is the maximum price premium you would accept to buy a car from a brand originating in your country or geographical region?” Base: all respondents, in %. “Would accept a price premium” groups the answers “1–5%”, “6–10%”, “11–20%” and “20% and above”. Source: Observatoire Cetelem de l’automobile 2027.
Across all countries combined, 76% would accept a premium. China is the highest (85%). Italy and the Netherlands are the lowest (69% each).
Data by country: Germany 78%, Belgium 74%, China 85%, Spain 72%, United States 80%, France 77%, Italy 69%, Japan 75%, Netherlands 69%, Poland 80%, Portugal 74%, United Kingdom 73%, Turkey 80%. The European average is 74%. The total is 76%.
Vertical bar chart. Question: “What is the maximum price premium you would accept to buy a car from a brand originating in your country or geographical region?” Base: all respondents, in %. “Would accept a price premium” groups the answers “1–5%”, “6–10%”, “11–20%” and “20% and above”. Source: Observatoire Cetelem de l’automobile 2027.
Across all countries combined, 76% would accept a premium. China is the highest (85%). Italy and the Netherlands are the lowest (69% each).
Data by country: Germany 78%, Belgium 74%, China 85%, Spain 72%, United States 80%, France 77%, Italy 69%, Japan 75%, Netherlands 69%, Poland 80%, Portugal 74%, United Kingdom 73%, Turkey 80%. The European average is 74%. The total is 76%.
CHOOSING LOCAL: A MATTER OF TASTE
If drivers are indeed willing to pay extra for a local car, what actually motivates them? While no single factor emerges as the dominant driver from the list of options, 1 in 5 motorists ranks sheer appeal first. Behind this hedonistic, personal criterion—championed most strongly by Portuguese, British and German drivers— economic logic and supporting domestic industry rank second, with American and French consumers placing the greatest weight on this argument. It is also worth noting the desire for a reliable local service network, a topic explored in greater detail in Part 4.
Fig. 23 – Reasons for choosing a national brand vehicle (% of respondents who gave up a foreign brand)
Download this infographic for your presentations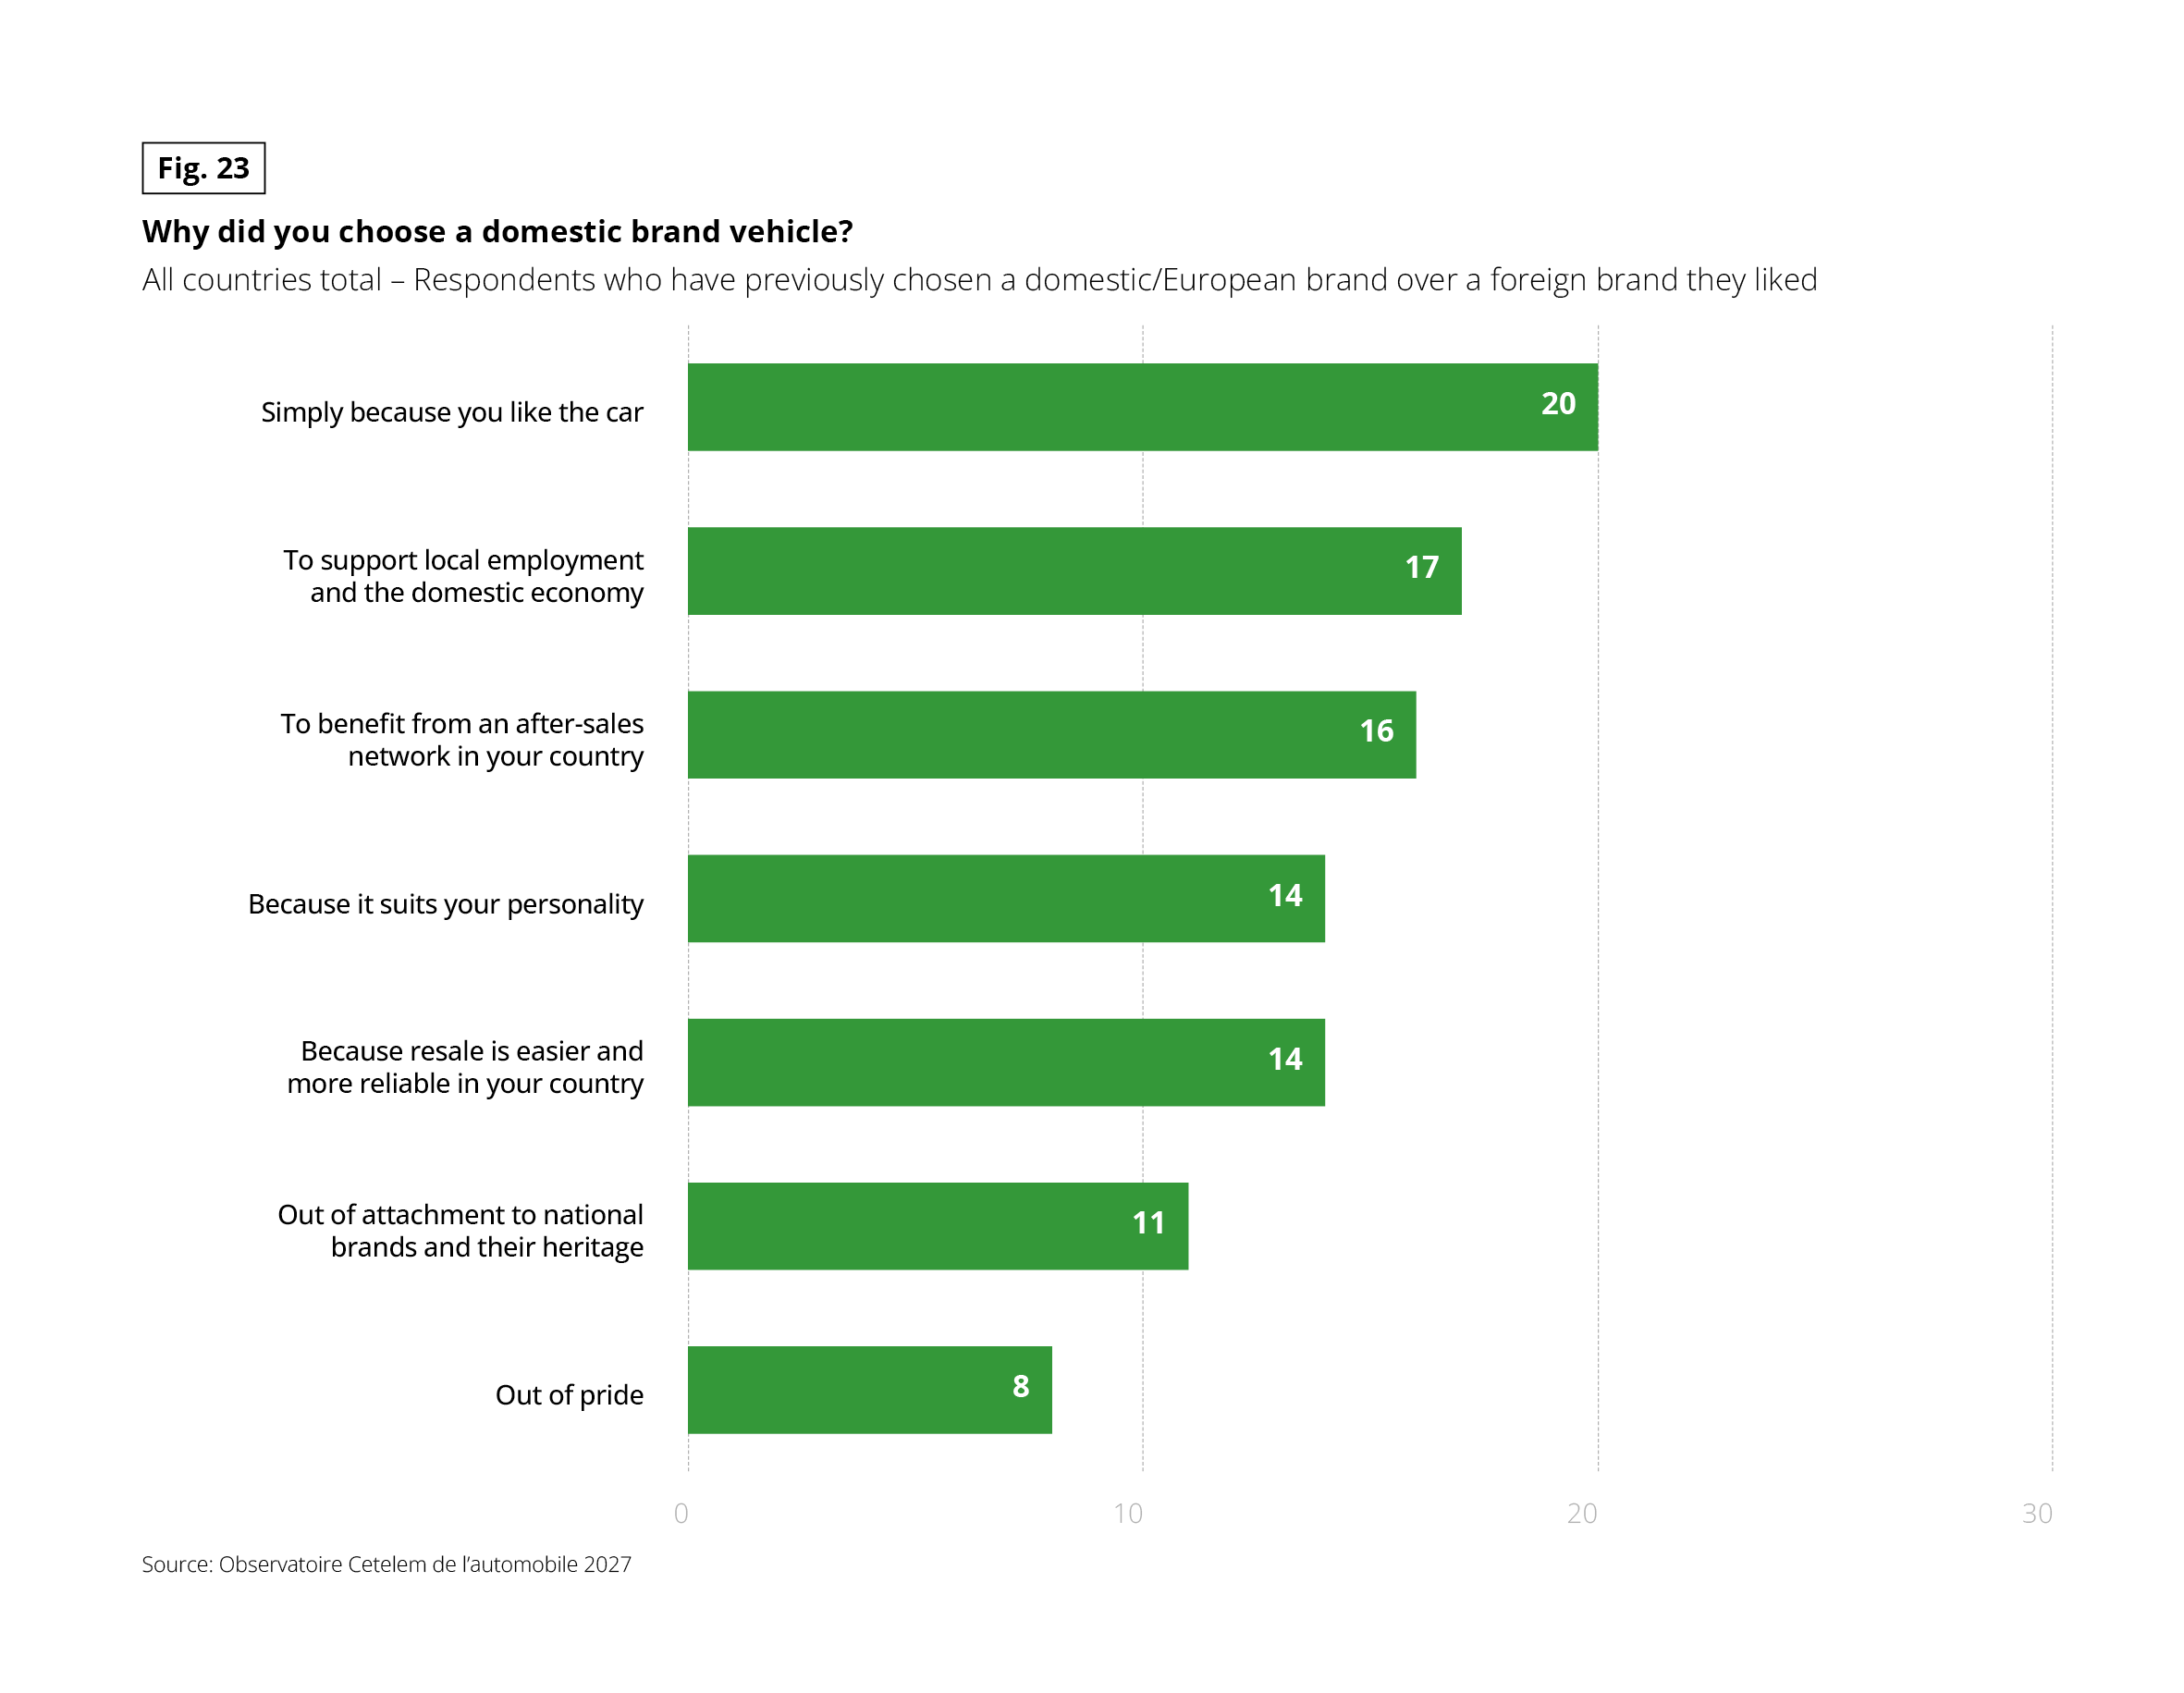 Horizontal bar chart. Question: “Why did you choose a domestic brand vehicle?” Base: all countries total, respondents who have previously chosen a domestic or European brand over a foreign brand they liked, in %. Source: Observatoire Cetelem de l’automobile 2027.
Reasons, from most to least cited:
1. Simply because you like the car: 20%
2. To support local employment and the domestic economy: 17%
3. To benefit from an after-sales network in your country: 16%
4. Because it suits your personality: 14%
5. Because resale is easier and more reliable in your country: 14%
6. Out of attachment to national brands and their heritage: 11%
7. Out of pride: 8%
Personal liking therefore comes first. Economic and practical reasons follow, and emotional or identity-based reasons come last.
Horizontal bar chart. Question: “Why did you choose a domestic brand vehicle?” Base: all countries total, respondents who have previously chosen a domestic or European brand over a foreign brand they liked, in %. Source: Observatoire Cetelem de l’automobile 2027.
Reasons, from most to least cited:
1. Simply because you like the car: 20%
2. To support local employment and the domestic economy: 17%
3. To benefit from an after-sales network in your country: 16%
4. Because it suits your personality: 14%
5. Because resale is easier and more reliable in your country: 14%
6. Out of attachment to national brands and their heritage: 11%
7. Out of pride: 8%
Personal liking therefore comes first. Economic and practical reasons follow, and emotional or identity-based reasons come last.