
Staying loyal for the next purchase


 3 min
reading time
3 min
reading time
A RELATIVE SENSE OF ATTACHMENT
In roughly equal measure when choosing their next vehicle, motorists declare themselves attached to their current car. More than 1 in 2 state this is the case, with Chinese and Polish drivers showing the highest loyalty (86% and 61%, respectively), in contrast to Turkish and Portuguese motorists (47% and 43%). Younger drivers express a stronger personal attachment to their vehicle than older age groups. Furthermore, this disposition has remained stable over time. In equal measure, one third of motorists report feeling more attached to their vehicle than before, while another third feel less attached.
Fig. 29 – Attachment to car brand: “very attached” or “not attached” (% of households equipped)
Download this infographic for your presentations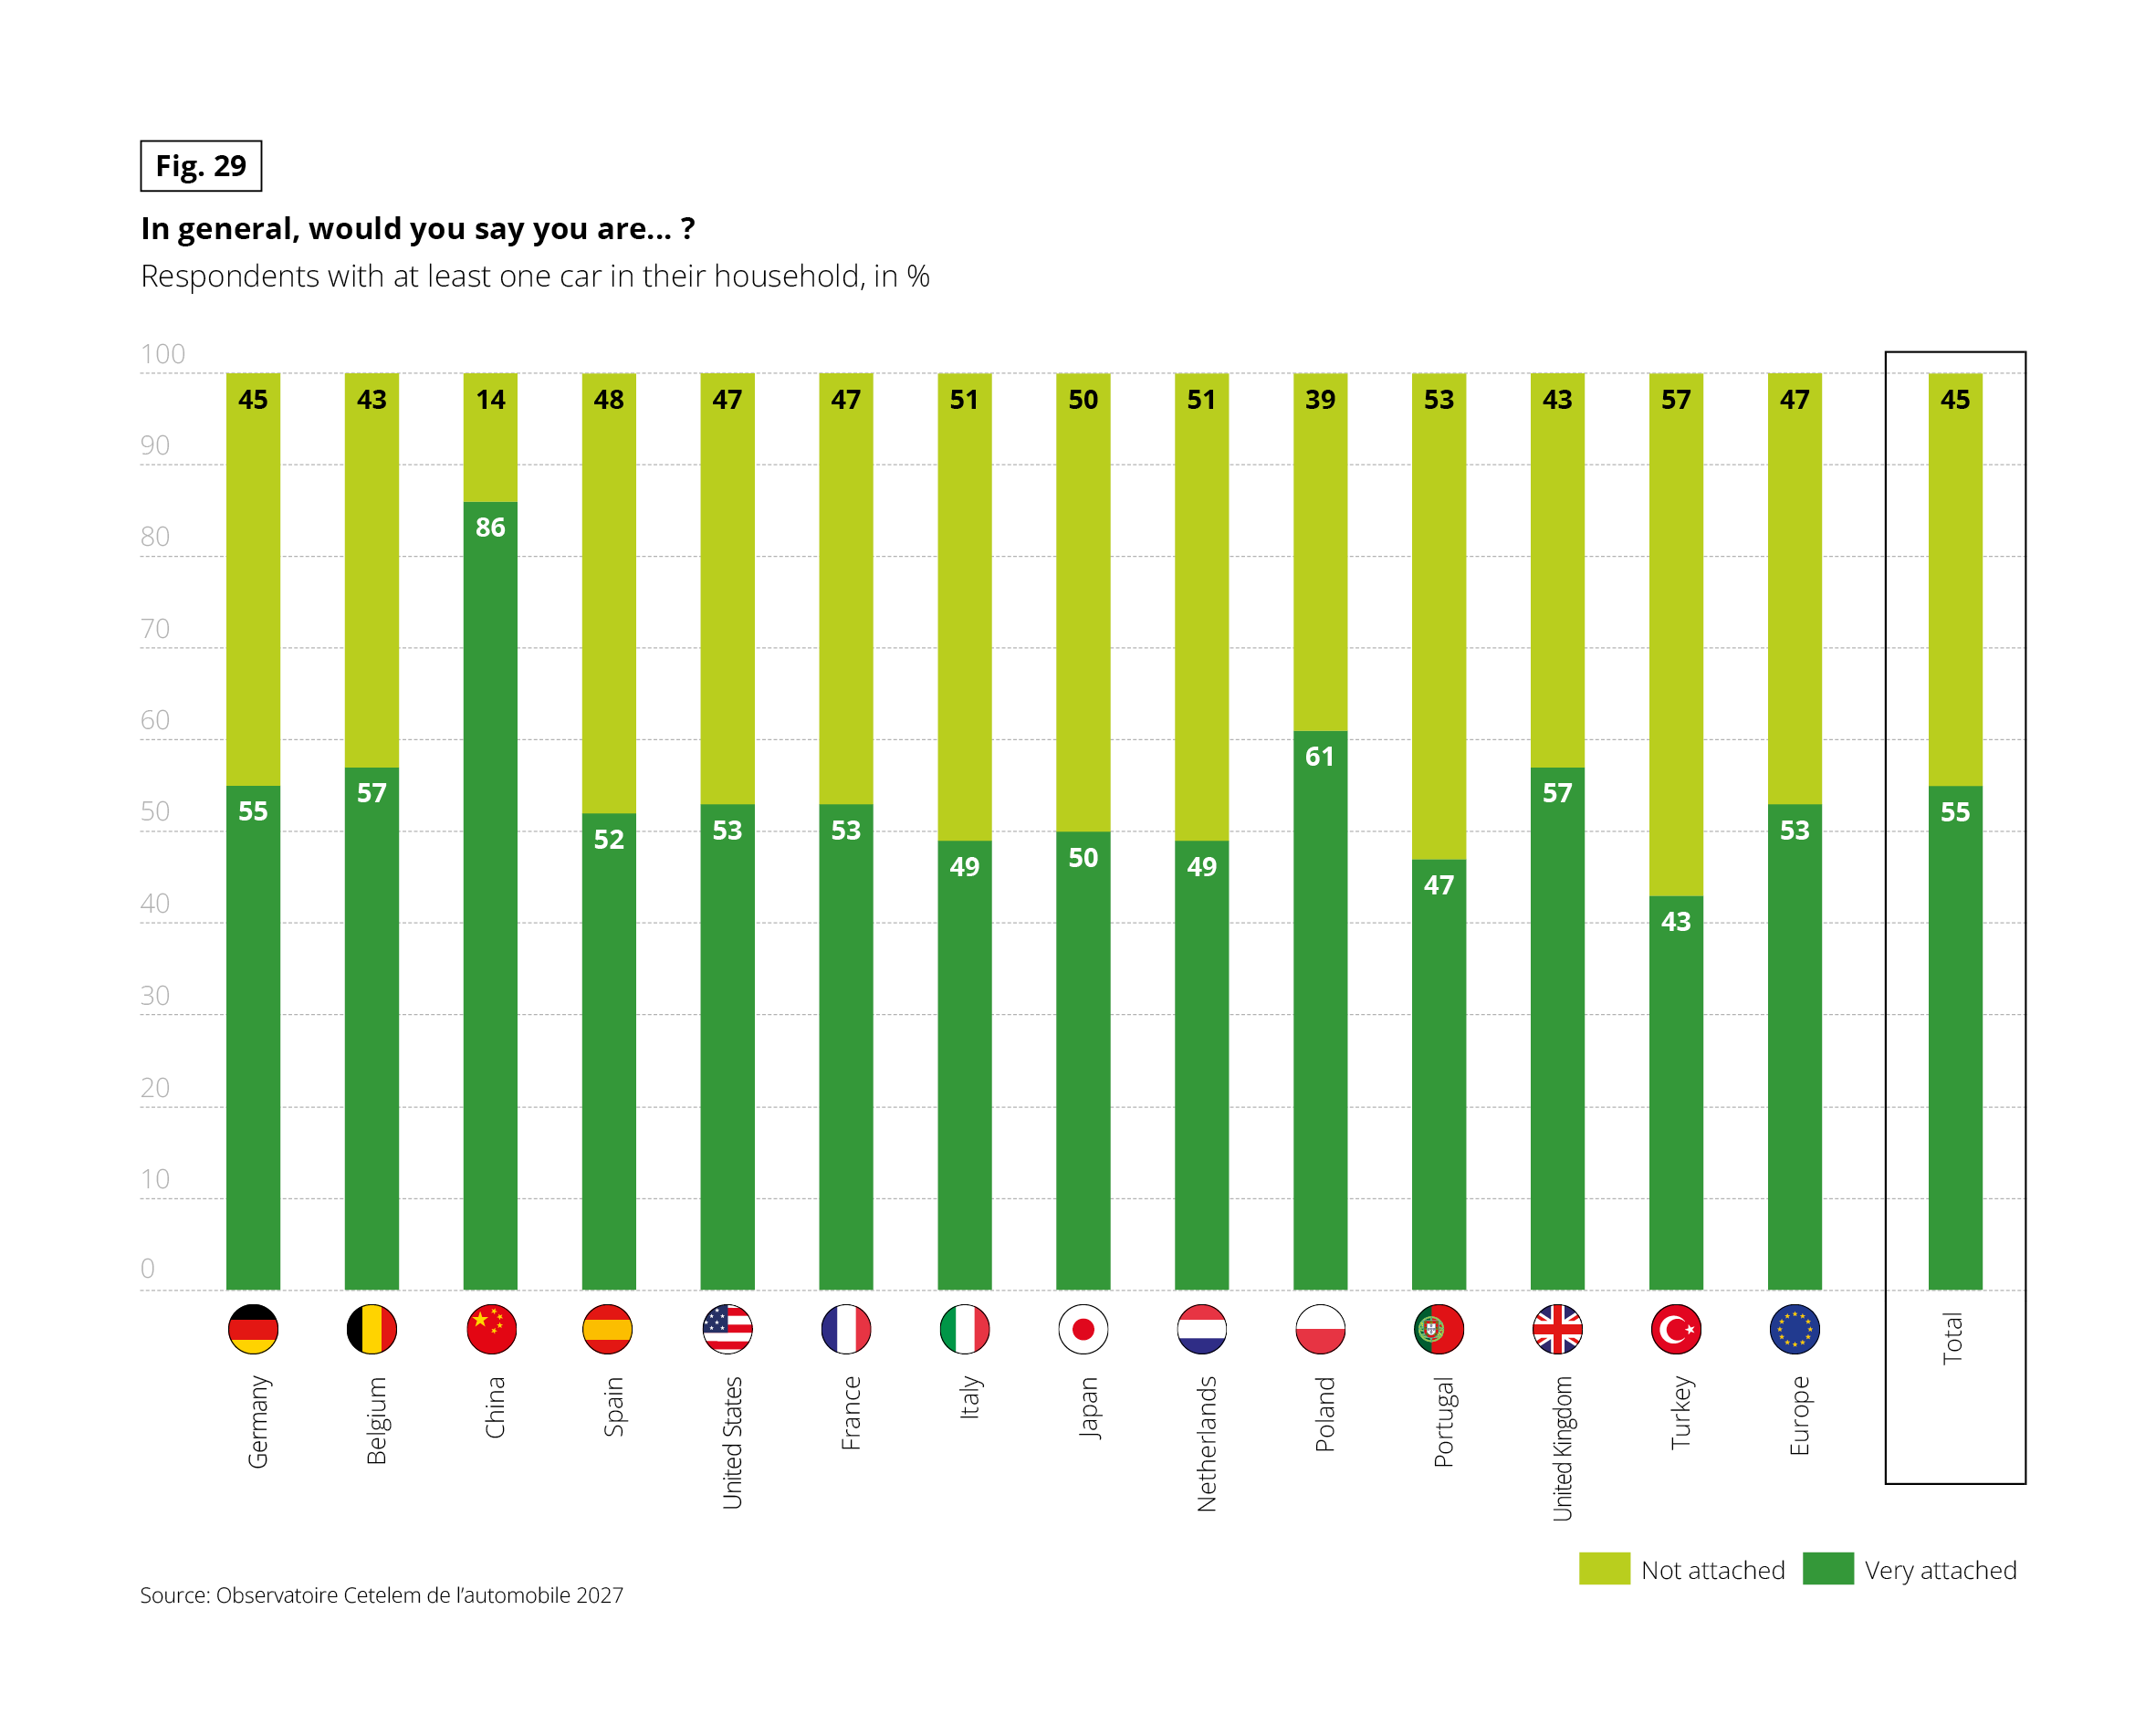 Stacked vertical bar chart. Question: “In general, would you say you are…?” Base: respondents with at least one car in their household, in %. Two answers: “Very attached” and “Not attached”; the figure does not state the object of attachment. Source: Observatoire Cetelem de l’automobile 2027. For all countries combined, 55% are very attached and 45% are not attached.
Data by country, in the form very attached / not attached:
• Germany 55% / 45%
• Belgium 57% / 43%
• China 86% / 14%
• Spain 52% / 48%
• United States 53% / 47%
• France 53% / 47%
• Italy 49% / 51%
• Japan 50% / 50%
• Netherlands 49% / 51%
• Poland 61% / 39%
• Portugal 47% / 53%
• United Kingdom 57% / 43%
• Turkey 43% / 57%
• Europe average 53% / 47%
China stands out with a large majority of very attached respondents. Italy, Netherlands, Portugal and Turkey have a majority of respondents who are not attached.
Stacked vertical bar chart. Question: “In general, would you say you are…?” Base: respondents with at least one car in their household, in %. Two answers: “Very attached” and “Not attached”; the figure does not state the object of attachment. Source: Observatoire Cetelem de l’automobile 2027. For all countries combined, 55% are very attached and 45% are not attached.
Data by country, in the form very attached / not attached:
• Germany 55% / 45%
• Belgium 57% / 43%
• China 86% / 14%
• Spain 52% / 48%
• United States 53% / 47%
• France 53% / 47%
• Italy 49% / 51%
• Japan 50% / 50%
• Netherlands 49% / 51%
• Poland 61% / 39%
• Portugal 47% / 53%
• United Kingdom 57% / 43%
• Turkey 43% / 57%
• Europe average 53% / 47%
China stands out with a large majority of very attached respondents. Italy, Netherlands, Portugal and Turkey have a majority of respondents who are not attached.
REPEATED BRAND PURCHASES ARE FAR FROM THE NORM
Yet loyalty is not synonymous with permanence. Only 4 in 10 drivers have bought multiple vehicles from the same brand. In this regard, French consumers prove even more loyal than their Japanese counterparts, whereas Turkish and Spanish drivers are most inclined to embrace change. With 8 in 10 Chinese respondents declaring they have never bought from the same brand twice, one might assume this represents a unique consumer quirk. In reality, this is a structural artifact driven by the fact that first-time buyers account for 88% of the country’s market. Unlike when assessing brand awareness for future purchases, comparing the new and used car markets reveals no dramatic disparities. The sharpest proportional differences are found in Italy and Portugal.
Fig. 30.1 – Purchase of several cars of the same brand, current car purchased new (% of “yes”)
Download this infographic for your presentations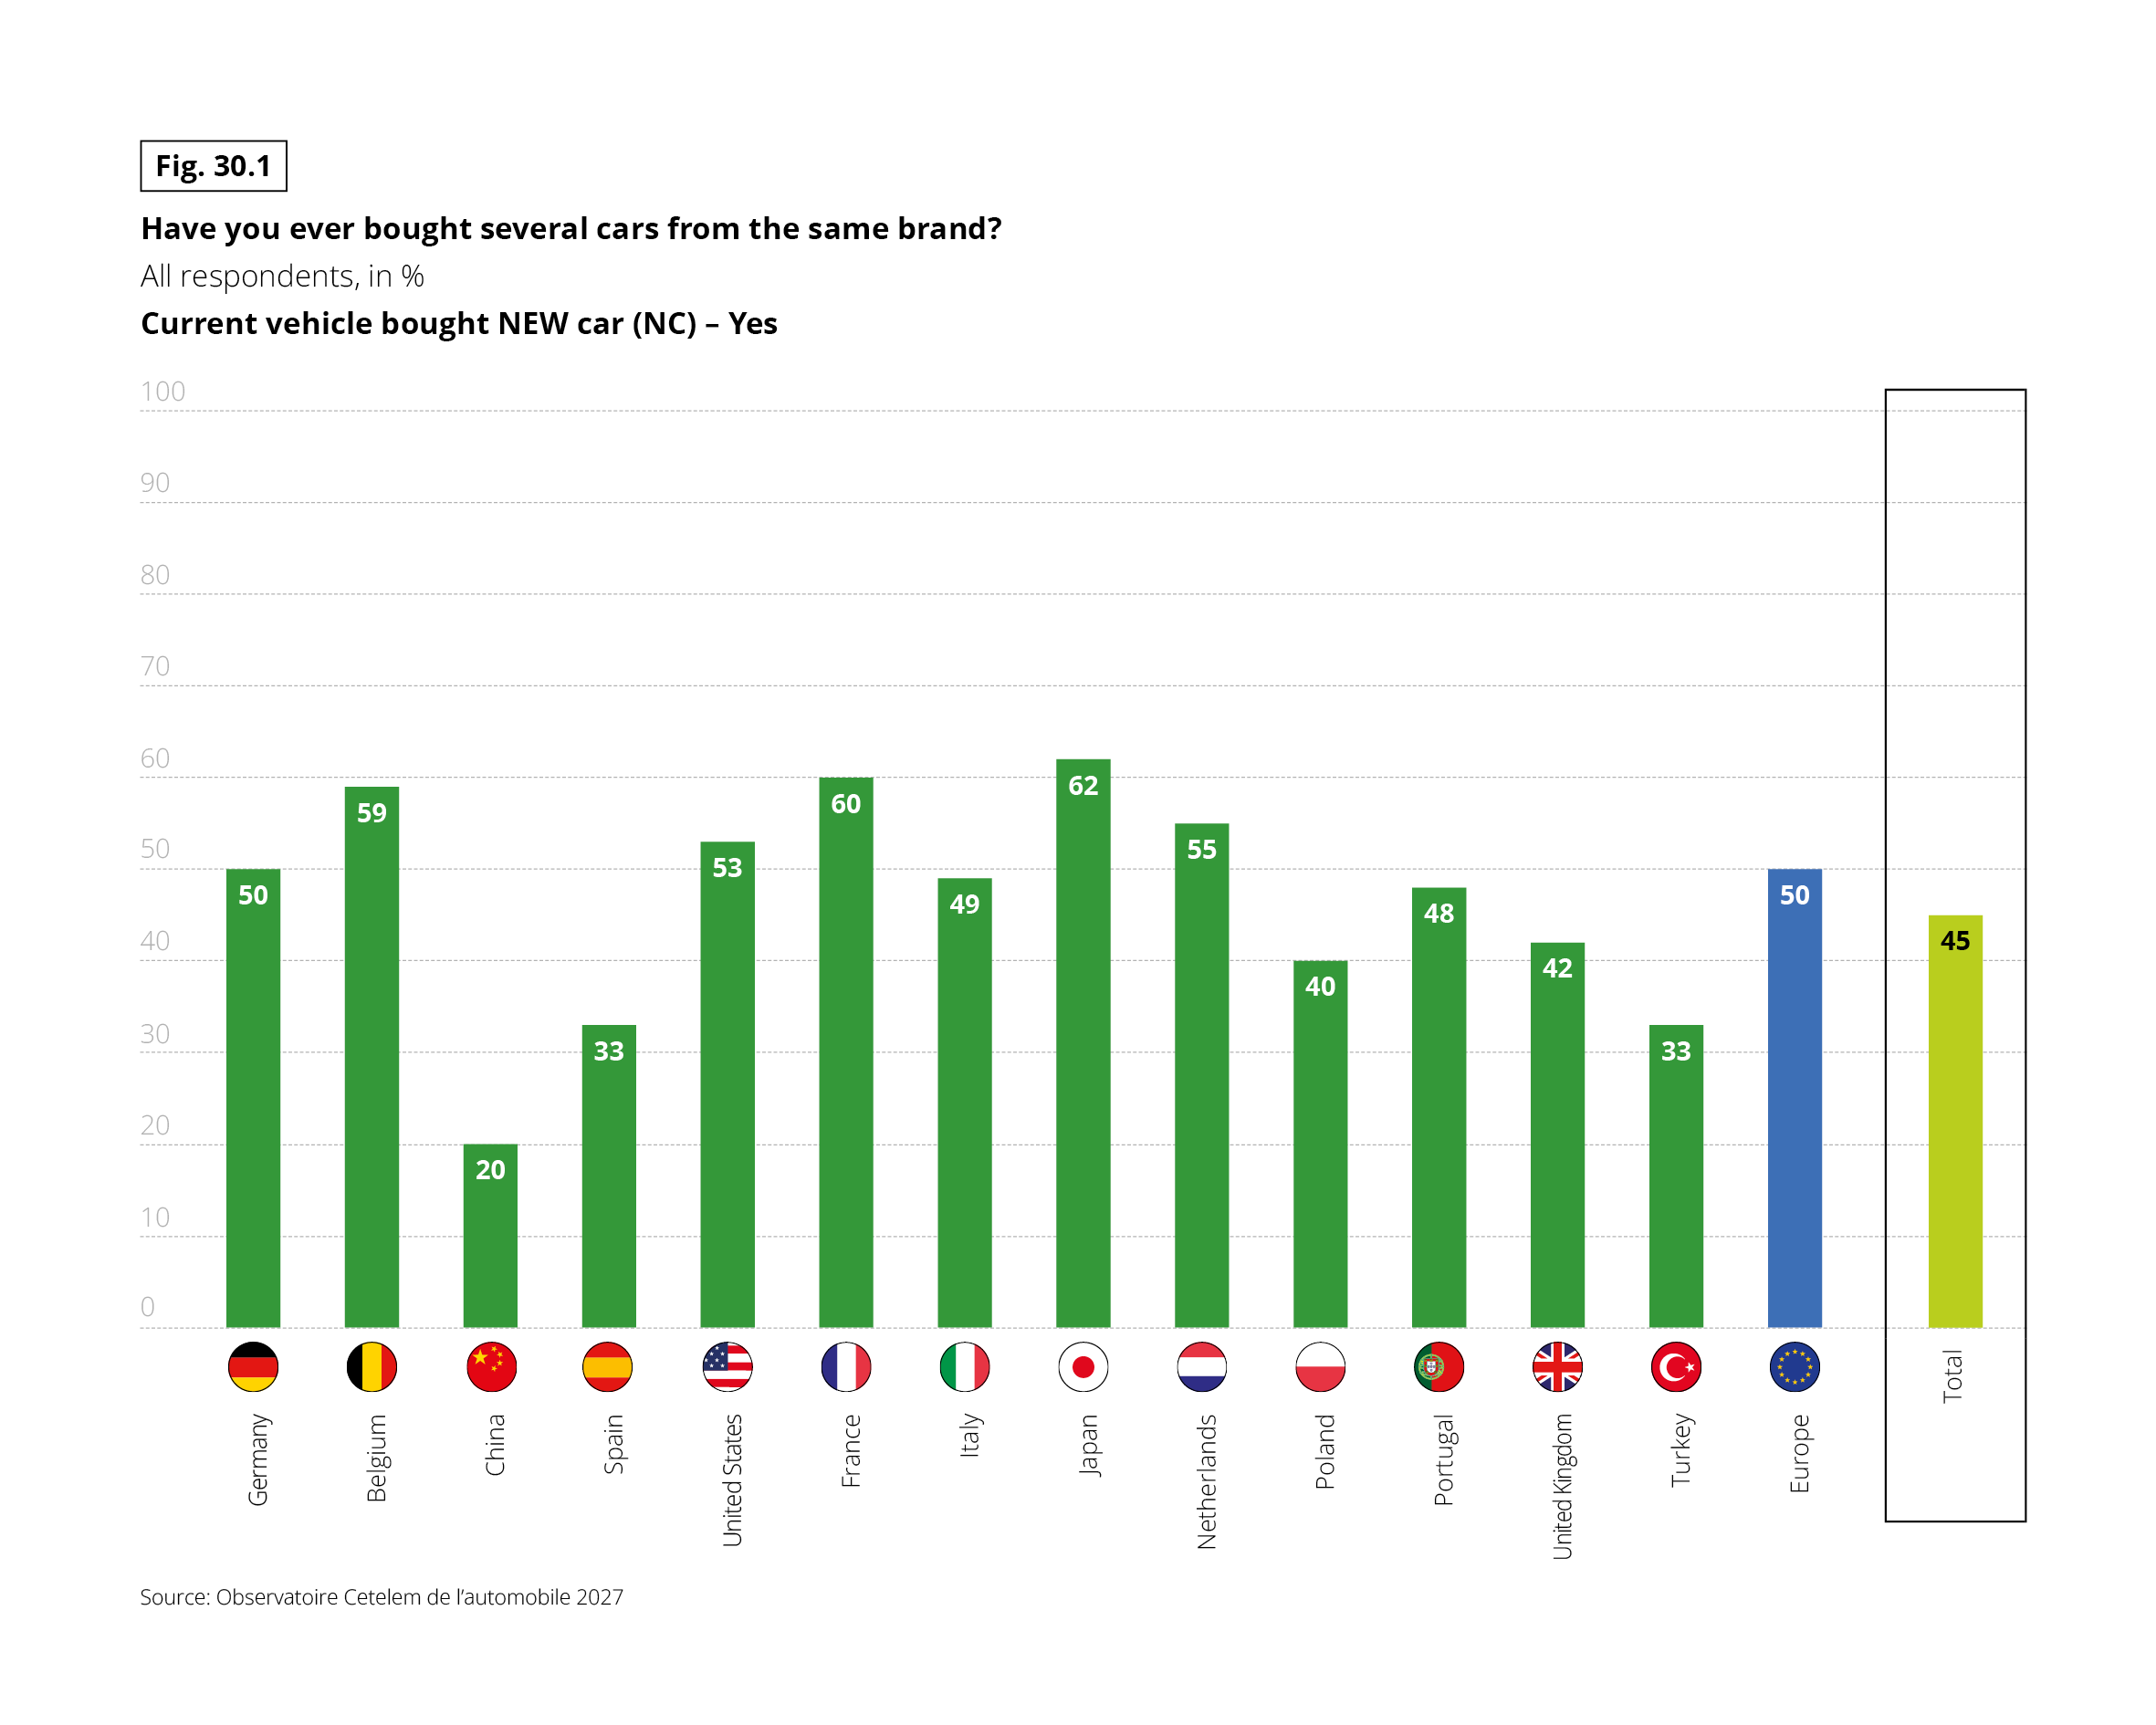 Vertical bar chart. Question: “Have you ever bought several cars from the same brand?” Base: all respondents, in %. Filter: current vehicle bought new (NC, new car), answer “Yes”. Source: Observatoire Cetelem de l’automobile 2027.
Across all countries combined, 45% answered yes. Japan is the highest (62%) and China the lowest (20%).
Data by country: Germany 50%, Belgium 59%, China 20%, Spain 33%, United States 53%, France 60%, Italy 49%, Japan 62%, Netherlands 55%, Poland 40%, Portugal 48%, United Kingdom 42%, Turkey 33%. The European average is 50%. The total is 45%.
Vertical bar chart. Question: “Have you ever bought several cars from the same brand?” Base: all respondents, in %. Filter: current vehicle bought new (NC, new car), answer “Yes”. Source: Observatoire Cetelem de l’automobile 2027.
Across all countries combined, 45% answered yes. Japan is the highest (62%) and China the lowest (20%).
Data by country: Germany 50%, Belgium 59%, China 20%, Spain 33%, United States 53%, France 60%, Italy 49%, Japan 62%, Netherlands 55%, Poland 40%, Portugal 48%, United Kingdom 42%, Turkey 33%. The European average is 50%. The total is 45%.
Fig. 30.2 – Purchase of several cars of the same brand, current car purchased second-hand (% of “yes”)
Download this infographic for your presentations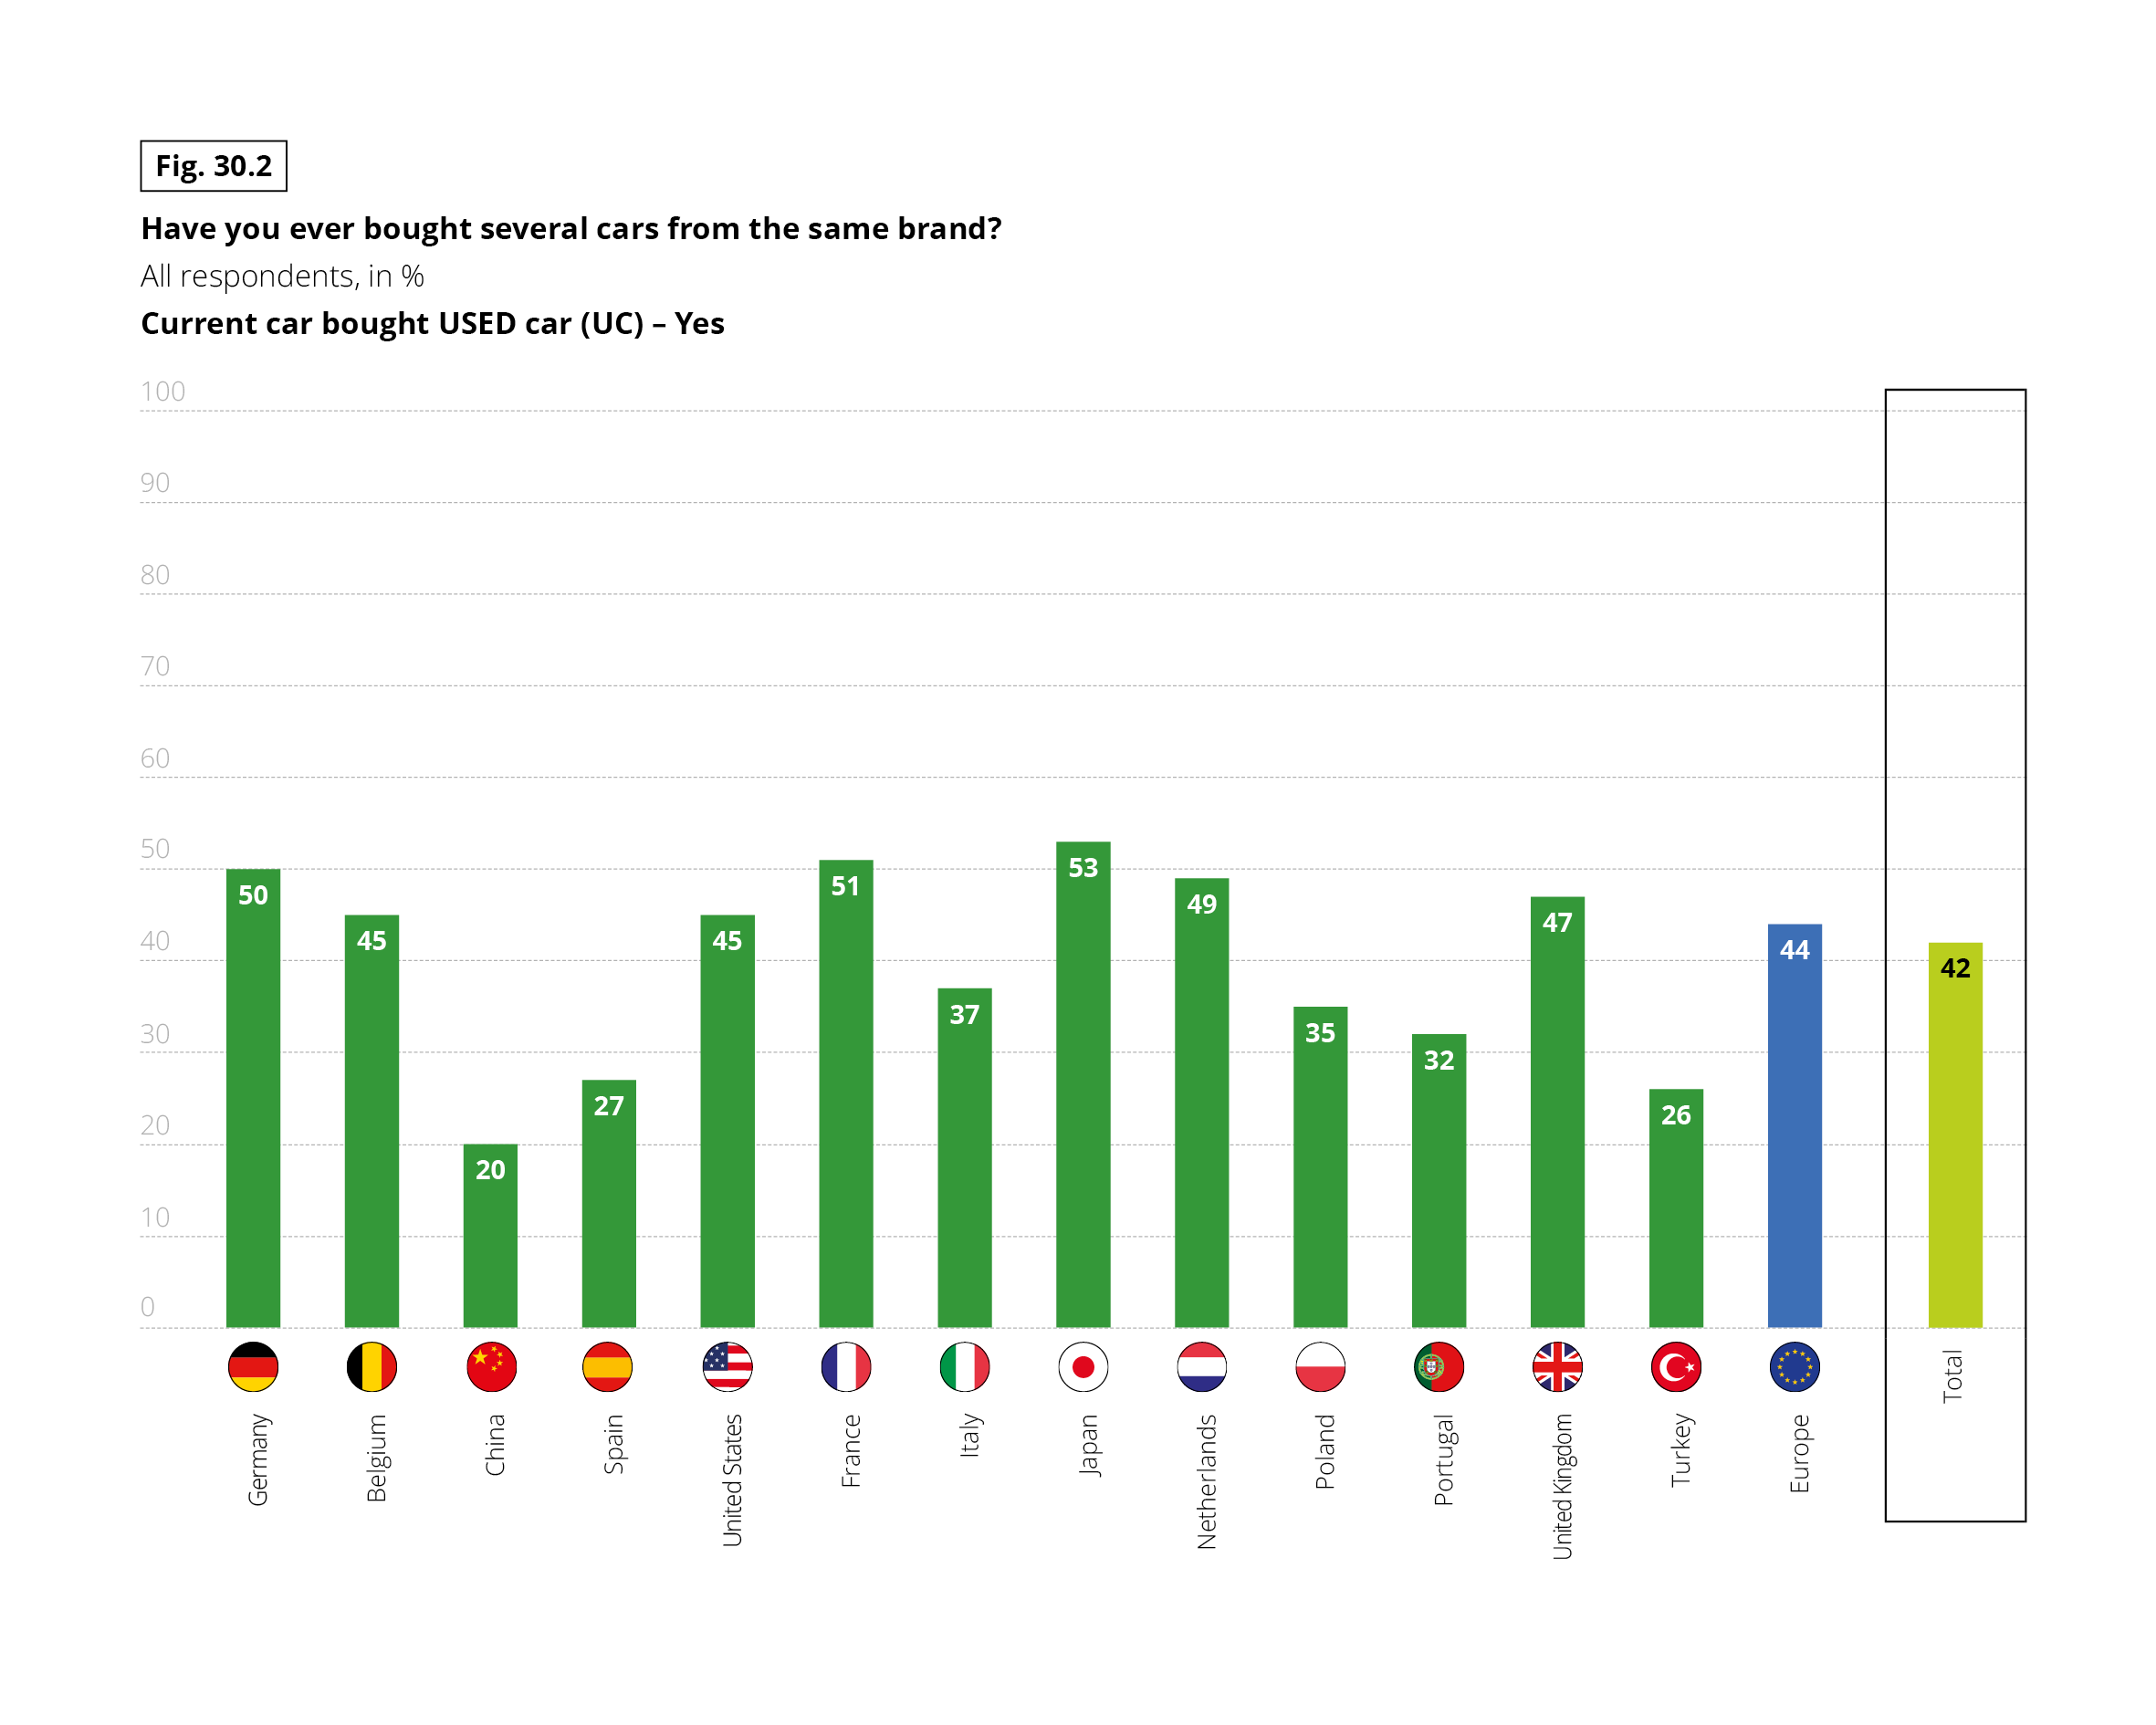 Vertical bar chart. Question: “Have you ever bought several cars from the same brand?” Base: all respondents, in %. Filter: current car bought used (UC, used car), answer “Yes”. Source: Observatoire Cetelem de l’automobile 2027.
Across all countries combined, 42% answered yes. Japan is the highest (53%) and China the lowest (20%).
Data by country: Germany 50%, Belgium 45%, China 20%, Spain 27%, United States 45%, France 51%, Italy 37%, Japan 53%, Netherlands 49%, Poland 35%, Portugal 32%, United Kingdom 47%, Turkey 26%. The European average is 44%. The total is 42%.
Brand repeat purchase is slightly less common among used-car buyers (42%) than among new-car buyers (45%, Fig. 30.1).
Vertical bar chart. Question: “Have you ever bought several cars from the same brand?” Base: all respondents, in %. Filter: current car bought used (UC, used car), answer “Yes”. Source: Observatoire Cetelem de l’automobile 2027.
Across all countries combined, 42% answered yes. Japan is the highest (53%) and China the lowest (20%).
Data by country: Germany 50%, Belgium 45%, China 20%, Spain 27%, United States 45%, France 51%, Italy 37%, Japan 53%, Netherlands 49%, Poland 35%, Portugal 32%, United Kingdom 47%, Turkey 26%. The European average is 44%. The total is 42%.
Brand repeat purchase is slightly less common among used-car buyers (42%) than among new-car buyers (45%, Fig. 30.1).
SIMPLY A DESIRE FOR CHANGE…
What, then, drives motorists to look elsewhere rather than remain loyal to a single brand? Their answers state what might seem self-evident. In 4 out of 10 cases, the primary driver of change across both the new and second-hand markets is simply the desire to experience a different brand. China, which boasts the widest choice of automotive brands, and the UK stand out for their strong appetite for a fresh start, whereas Germany and Belgium prove least susceptible to the allure of novelty. For new car purchases, the shift to electric vehicles and general curiosity about a brand play a prominent role. Indeed, the transition to EVs can undermine brand loyalty, as carmakers lagging in this segment lose customers to rivals. For second-hand buyers, price considerations and a lack of brand attachment are the paramount factors.
Fig. 31 – Reasons not to repurchase the same brand, next new and used car (% of people unlikely to repurchase the same brand)
Download this infographic for your presentations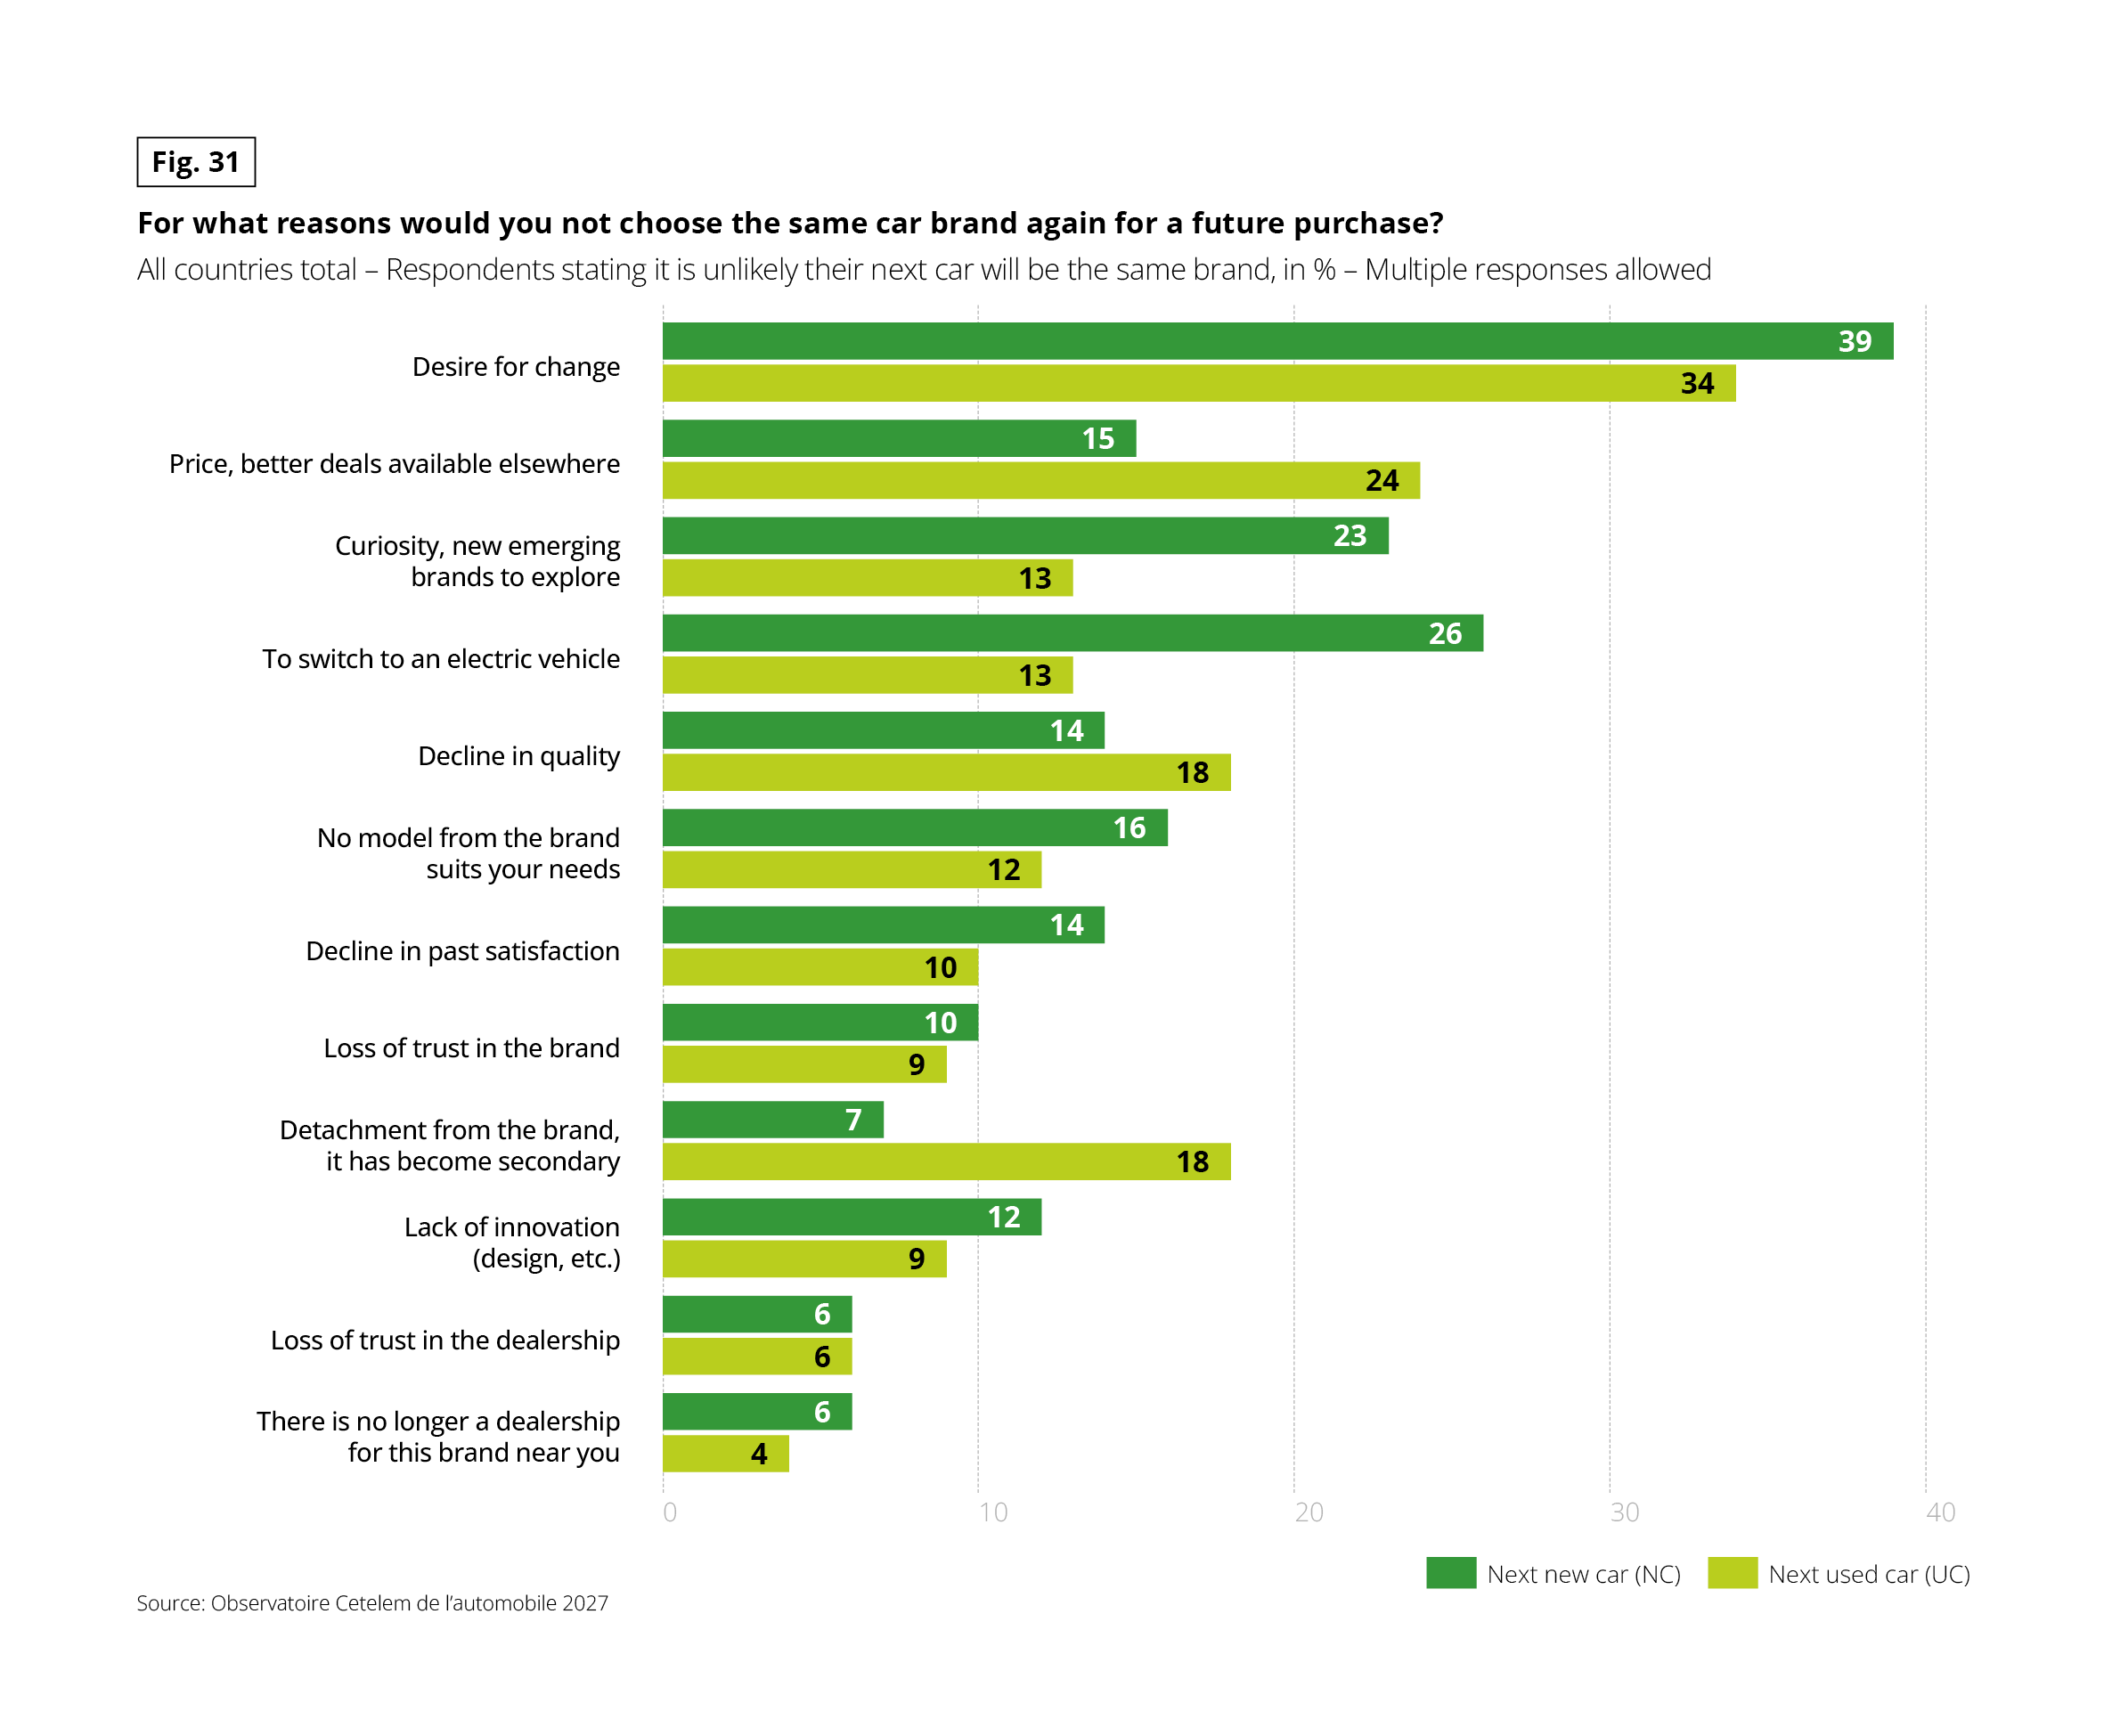 Horizontal paired bar chart. Question: “For what reasons would you not choose the same car brand again for a future purchase?” Base: all countries total, respondents stating it is unlikely their next car will be the same brand, in %. Multiple responses allowed. Two series: next new car (NC) and next used car (UC). Source: Observatoire Cetelem de l’automobile 2027.
Data, in the form next new car / next used car:
• Desire for change: 39% / 34%
• Price, better deals available elsewhere: 15% / 24%
• Curiosity, new emerging brands to explore: 23% / 13%
• To switch to an electric vehicle: 26% / 13%
• Decline in quality: 14% / 18%
• No model from the brand suits your needs: 16% / 12%
• Decline in past satisfaction: 14% / 10%
• Loss of trust in the brand: 10% / 9%
• Detachment from the brand, it has become secondary: 7% / 18%
• Lack of innovation (design, etc.): 12% / 9%
• Loss of trust in the dealership: 6% / 6%
• There is no longer a dealership for this brand near you: 6% / 4%
Desire for change is the top reason in both groups. Future new-car buyers cite switching to an electric vehicle (26%) and curiosity about new brands (23%) more often. Future used-car buyers cite price (24%) and detachment from the brand (18%) more often.
Horizontal paired bar chart. Question: “For what reasons would you not choose the same car brand again for a future purchase?” Base: all countries total, respondents stating it is unlikely their next car will be the same brand, in %. Multiple responses allowed. Two series: next new car (NC) and next used car (UC). Source: Observatoire Cetelem de l’automobile 2027.
Data, in the form next new car / next used car:
• Desire for change: 39% / 34%
• Price, better deals available elsewhere: 15% / 24%
• Curiosity, new emerging brands to explore: 23% / 13%
• To switch to an electric vehicle: 26% / 13%
• Decline in quality: 14% / 18%
• No model from the brand suits your needs: 16% / 12%
• Decline in past satisfaction: 14% / 10%
• Loss of trust in the brand: 10% / 9%
• Detachment from the brand, it has become secondary: 7% / 18%
• Lack of innovation (design, etc.): 12% / 9%
• Loss of trust in the dealership: 6% / 6%
• There is no longer a dealership for this brand near you: 6% / 4%
Desire for change is the top reason in both groups. Future new-car buyers cite switching to an electric vehicle (26%) and curiosity about new brands (23%) more often. Future used-car buyers cite price (24%) and detachment from the brand (18%) more often.
…THAT RARELY MATERIALISES
When all is said and done, however, 6 in 10 motorists will ultimately stick with their current brand overall. This loyalty is significantly stronger among new car buyers (7 in 10) than in the second-hand market (5 in 10). In the new car sector, Chinese, German, Dutch, Belgian and American consumers are more likely to consider switching brands, whereas over 4 in 10 British buyers remain undecided. A similar inclination towards loyalty appears among second-hand buyers in China, the Netherlands and Germany, while British and Turkish buyers remain the least loyal. Demographically, drivers under 30 are less inclined than older generations to remain with the same brand. For younger cohorts, personal attachment to a car does not necessarily translate into loyalty to a brand.
Fig. 32 – Probability that the next car will be of the same brand as the current one, new car (% by country)
Download this infographic for your presentations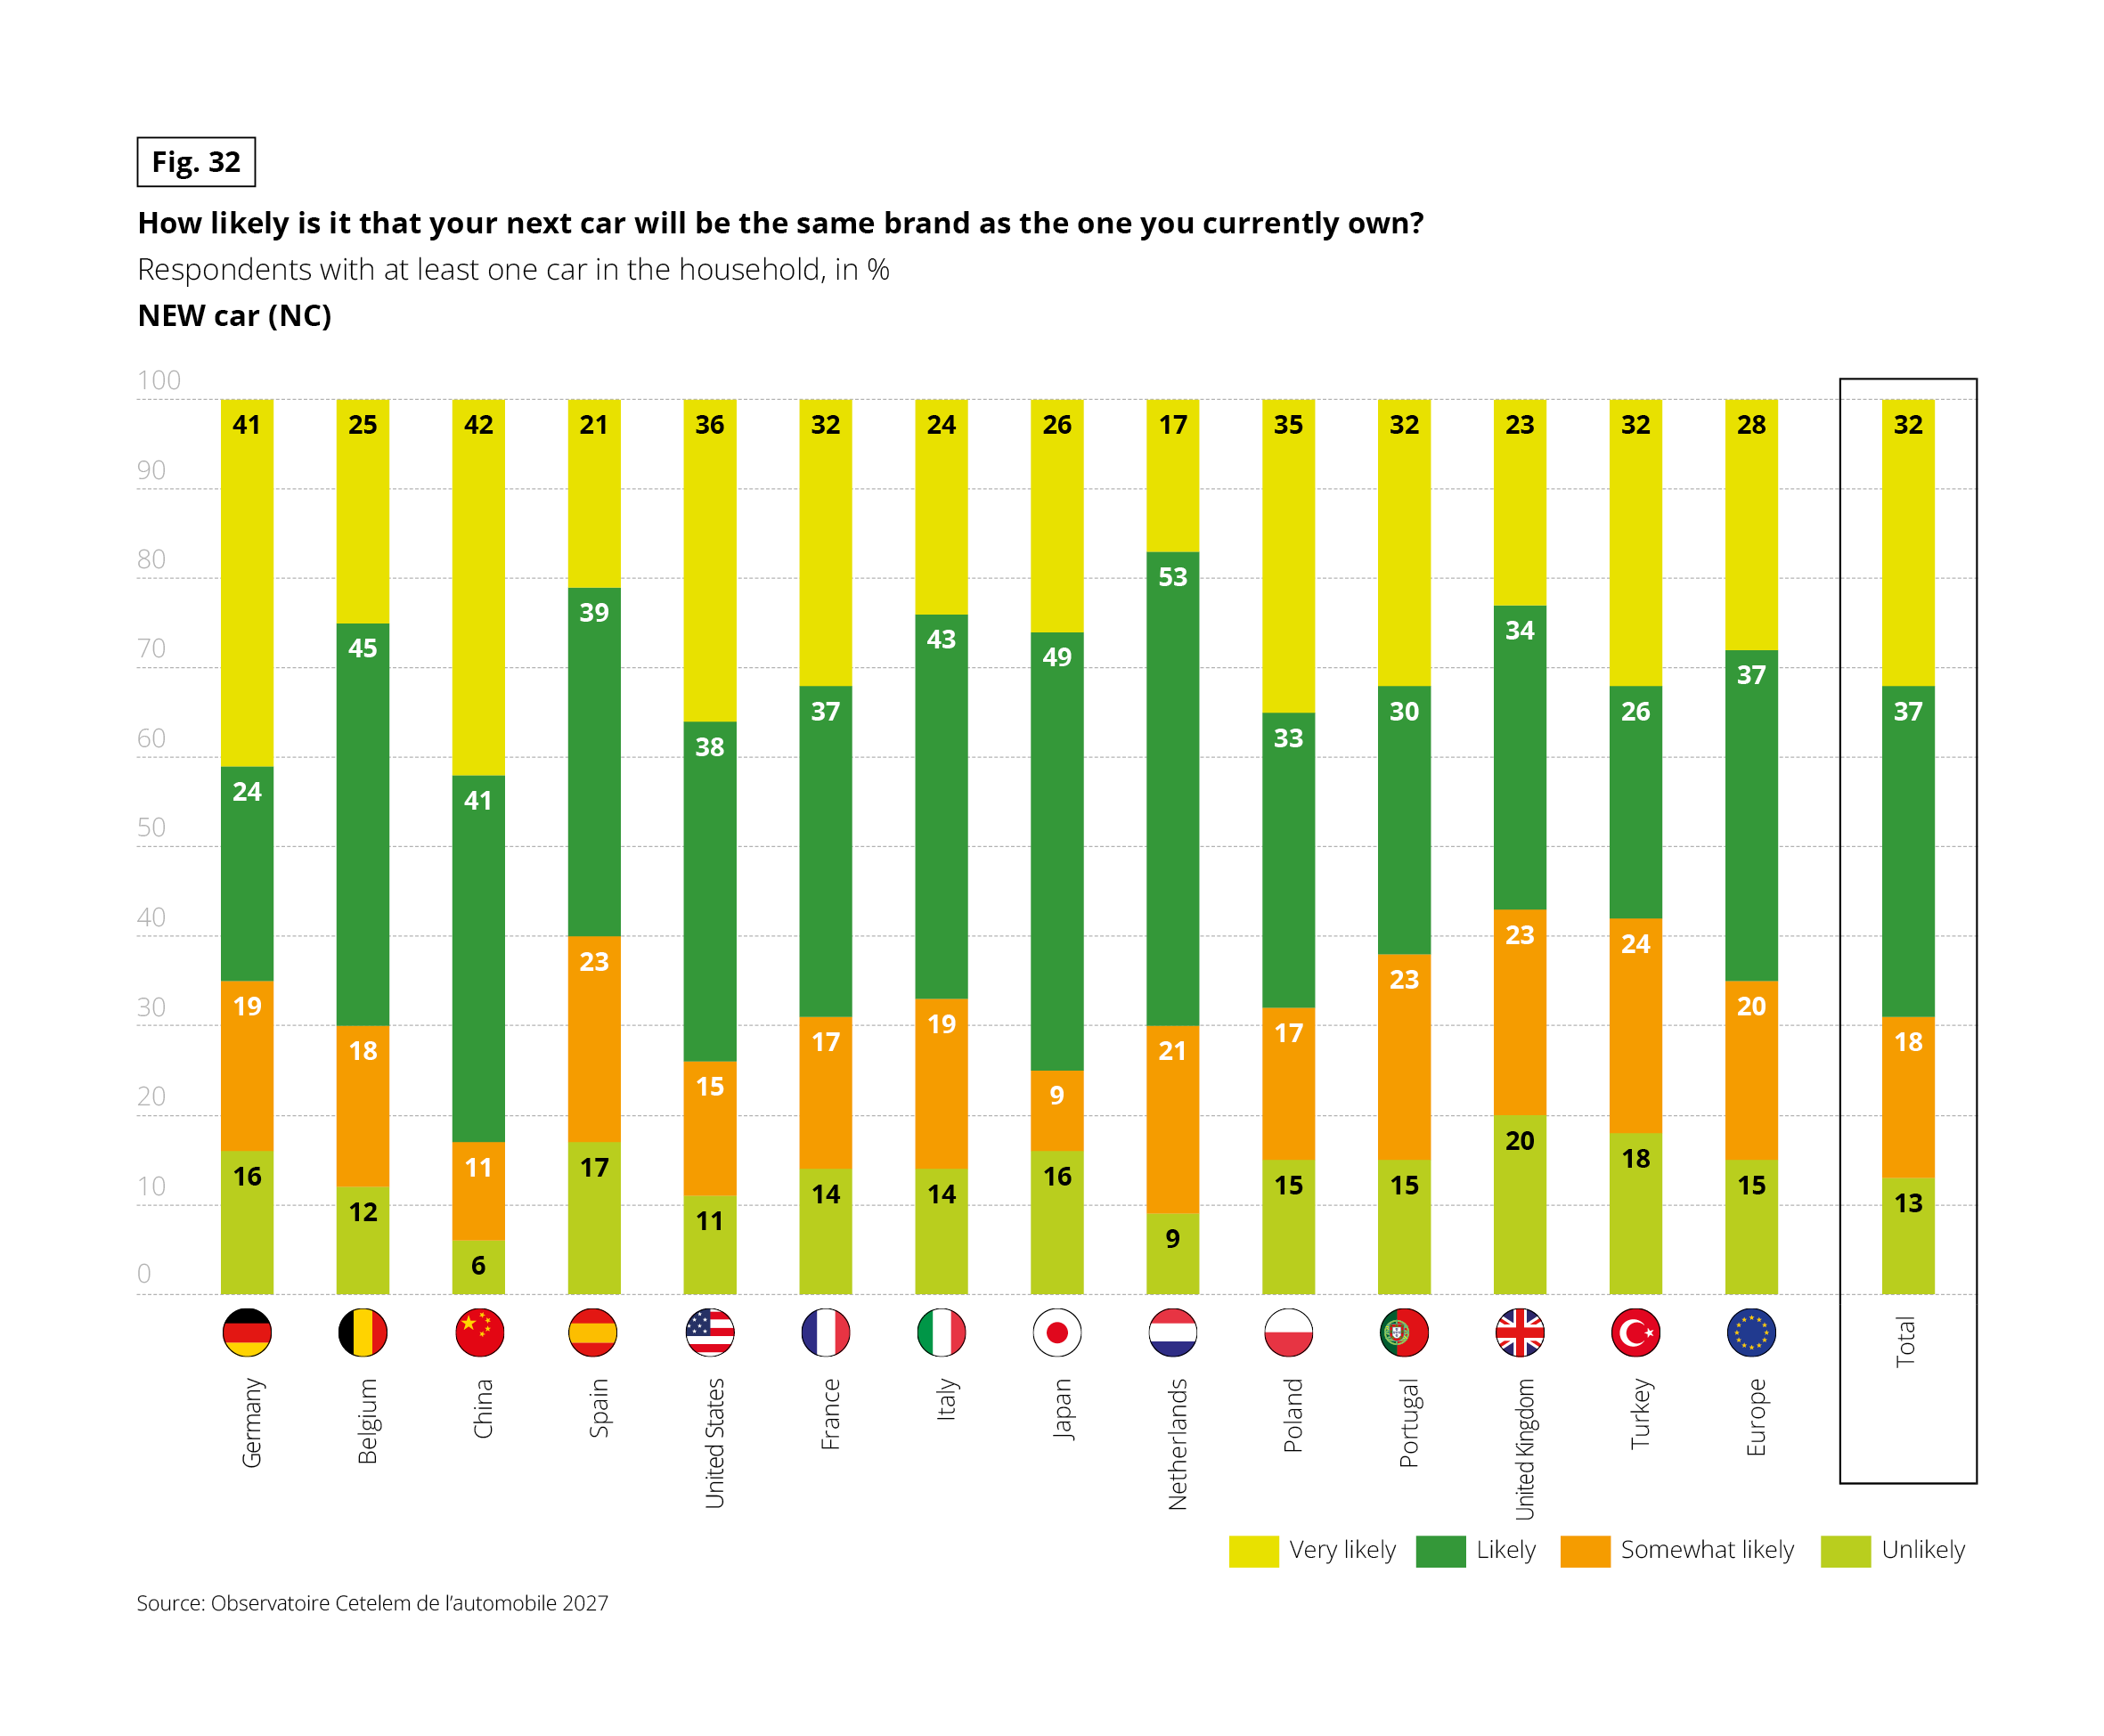 Stacked vertical bar chart. Question: “How likely is it that your next car will be the same brand as the one you currently own?” Base: respondents with at least one car in the household, in %. Filter: new car (NC). Four answers: very likely, likely, somewhat likely, unlikely. Source: Observatoire Cetelem de l’automobile 2027. For all countries combined: very likely 32%, likely 37%, somewhat likely 18%, unlikely 13%.
Data by country, in the form very likely / likely / somewhat likely / unlikely:
• Germany 41 / 24 / 19 / 16
• Belgium 25 / 45 / 18 / 12
• China 42 / 41 / 11 / 6
• Spain 21 / 39 / 23 / 17
• United States 36 / 38 / 15 / 11
• France 32 / 37 / 17 / 14
• Italy 24 / 43 / 19 / 14
• Japan 26 / 49 / 9 / 16
• Netherlands 17 / 53 / 21 / 9
• Poland 35 / 33 / 17 / 15
• Portugal 32 / 30 / 23 / 15
• United Kingdom 23 / 34 / 23 / 20
• Turkey 32 / 26 / 24 / 18
• Europe average 28 / 37 / 20 / 15
China has the lowest share of “unlikely” (6%) and the highest share of “very likely” (42%, ahead of Germany at 41%). The United Kingdom has the highest share of “unlikely” (20%).
Stacked vertical bar chart. Question: “How likely is it that your next car will be the same brand as the one you currently own?” Base: respondents with at least one car in the household, in %. Filter: new car (NC). Four answers: very likely, likely, somewhat likely, unlikely. Source: Observatoire Cetelem de l’automobile 2027. For all countries combined: very likely 32%, likely 37%, somewhat likely 18%, unlikely 13%.
Data by country, in the form very likely / likely / somewhat likely / unlikely:
• Germany 41 / 24 / 19 / 16
• Belgium 25 / 45 / 18 / 12
• China 42 / 41 / 11 / 6
• Spain 21 / 39 / 23 / 17
• United States 36 / 38 / 15 / 11
• France 32 / 37 / 17 / 14
• Italy 24 / 43 / 19 / 14
• Japan 26 / 49 / 9 / 16
• Netherlands 17 / 53 / 21 / 9
• Poland 35 / 33 / 17 / 15
• Portugal 32 / 30 / 23 / 15
• United Kingdom 23 / 34 / 23 / 20
• Turkey 32 / 26 / 24 / 18
• Europe average 28 / 37 / 20 / 15
China has the lowest share of “unlikely” (6%) and the highest share of “very likely” (42%, ahead of Germany at 41%). The United Kingdom has the highest share of “unlikely” (20%).
KEEPING A SENSE OF PERSPECTIVE
The factors prompting motorists to remain loyal to a brand serve to temper the impression of a merely lukewarm attachment. Quality, past satisfaction and trust emerge as their primary drivers, three criteria that underpin a close relationship with a brand, built on familiarity deepened over time. German consumers are the most likely to highlight past satisfaction and quality. On price, which ranks a close fourth, French buyers are the most discerning. Notably, brand origin plays a negligible role; to a certain extent, respondents view this dimension as implicitly folded into the top three criteria.
Fig. 33 – Reasons for having purchased the same brand (% of those who bought several cars of the same brand)
Download this infographic for your presentations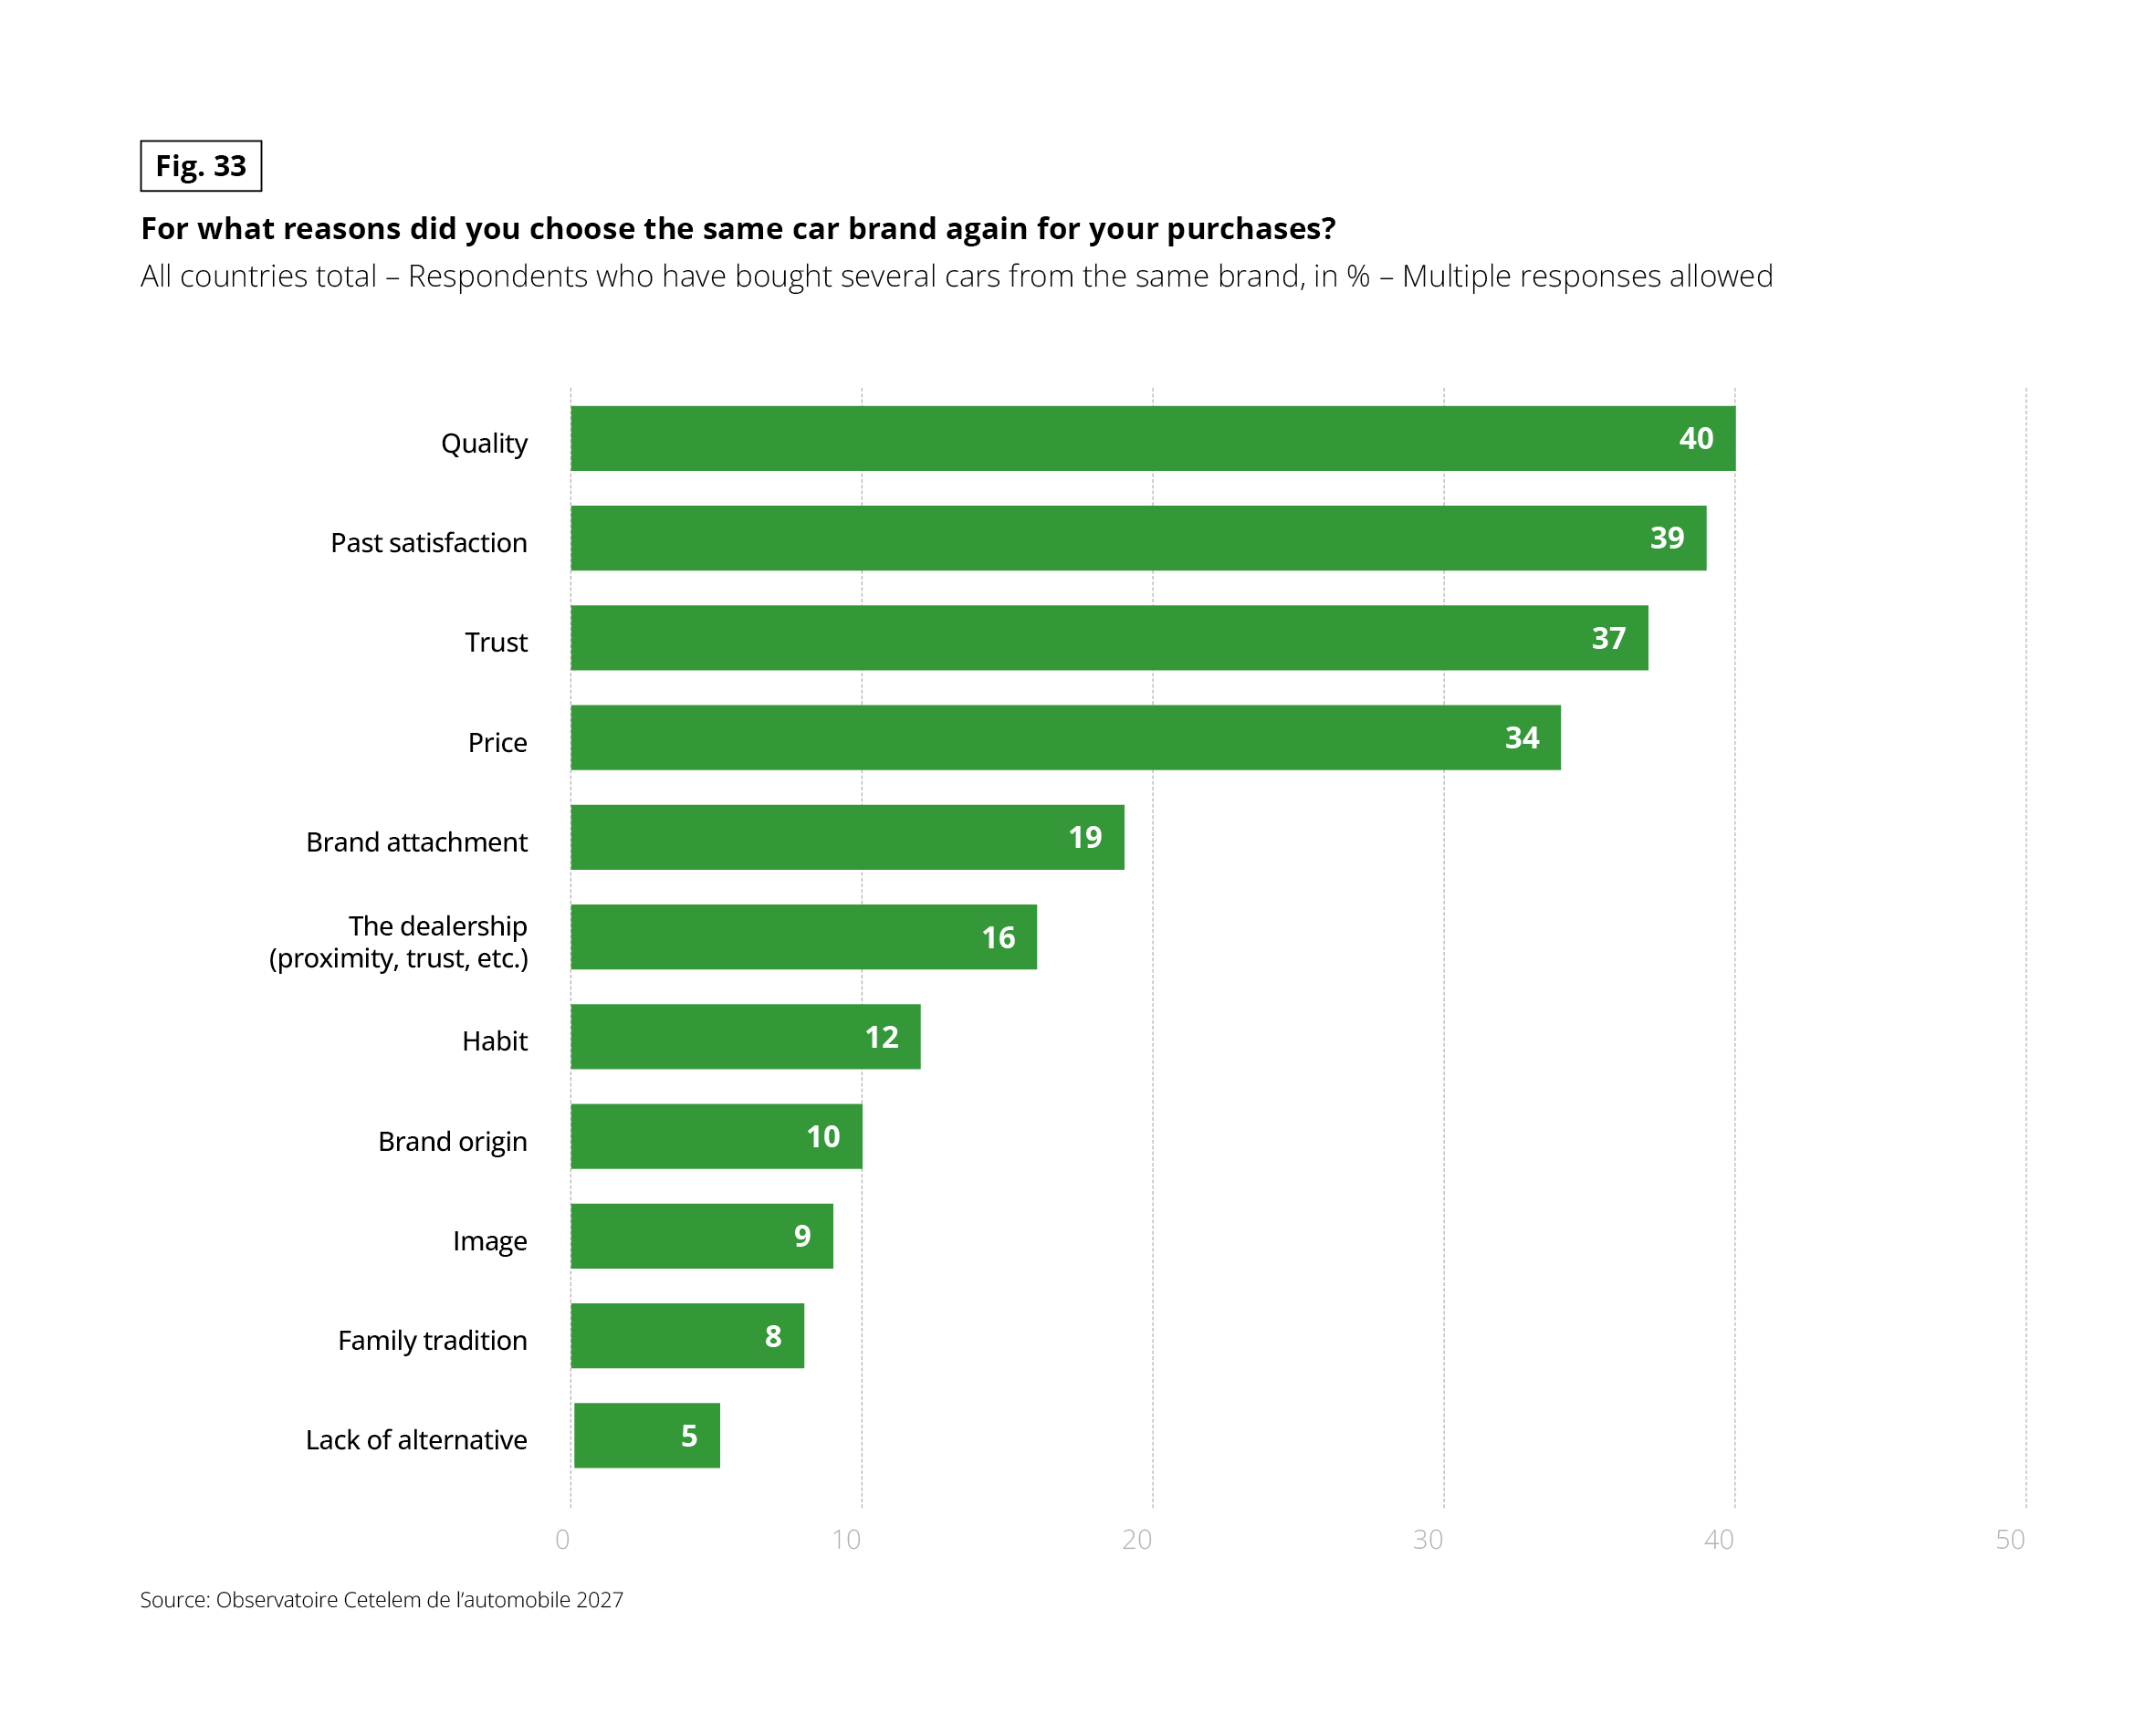 Horizontal bar chart. Question: “For what reasons did you choose the same car brand again for your purchases?” Base: all countries total, respondents who have bought several cars from the same brand, in %. Multiple responses allowed. Source: Observatoire Cetelem de l’automobile 2027.
Reasons, from most to least cited: Quality 40%, Past satisfaction 39%, Trust 37%, Price 34%, Brand attachment 19%, The dealership (proximity, trust, etc.) 16%, Habit 12%, Brand origin 10%, Image 9%, Family tradition 8%, Lack of alternative 5%.
The first four reasons (quality, past satisfaction, trust, price) are each cited by more than a third of respondents, well ahead of the others.
Horizontal bar chart. Question: “For what reasons did you choose the same car brand again for your purchases?” Base: all countries total, respondents who have bought several cars from the same brand, in %. Multiple responses allowed. Source: Observatoire Cetelem de l’automobile 2027.
Reasons, from most to least cited: Quality 40%, Past satisfaction 39%, Trust 37%, Price 34%, Brand attachment 19%, The dealership (proximity, trust, etc.) 16%, Habit 12%, Brand origin 10%, Image 9%, Family tradition 8%, Lack of alternative 5%.
The first four reasons (quality, past satisfaction, trust, price) are each cited by more than a third of respondents, well ahead of the others.