
Financial considerations take precedence


 2 min
reading time
2 min
reading time
THE PRIMACY OF PRICE
When push comes to shove, despite contrasting views on brand origin in places like Japan or among younger drivers, which factor ultimately carries the most weight? Across successive editions of the Observatoire Cetelem, whether tracking cars or broader retail trends, the result recurs year after year with the predictability of a Philip Glass score. Price remains the single most important factor for motorists when choosing a car. Indeed, 4 in 10 highlight it for a new vehicle purchase, rising to more than 5 in 10 for a second-hand model. Price emerges decisively as the primary criterion across every surveyed country, with the exception of China, where reliability is preferred. French consumers display the highest price sensitivity, followed closely by Belgian, Portuguese and Japanese drivers. It carries greater weight among older demographics than among younger generations. Predictably, lower-income households and rural residents are particularly sensitive to price. (Fig. 34)
Fig. 34 – Most important criteria in choosing a car, depending on whether the current car was bought new or used (%, max. 3 answers)
Download this infographic for your presentations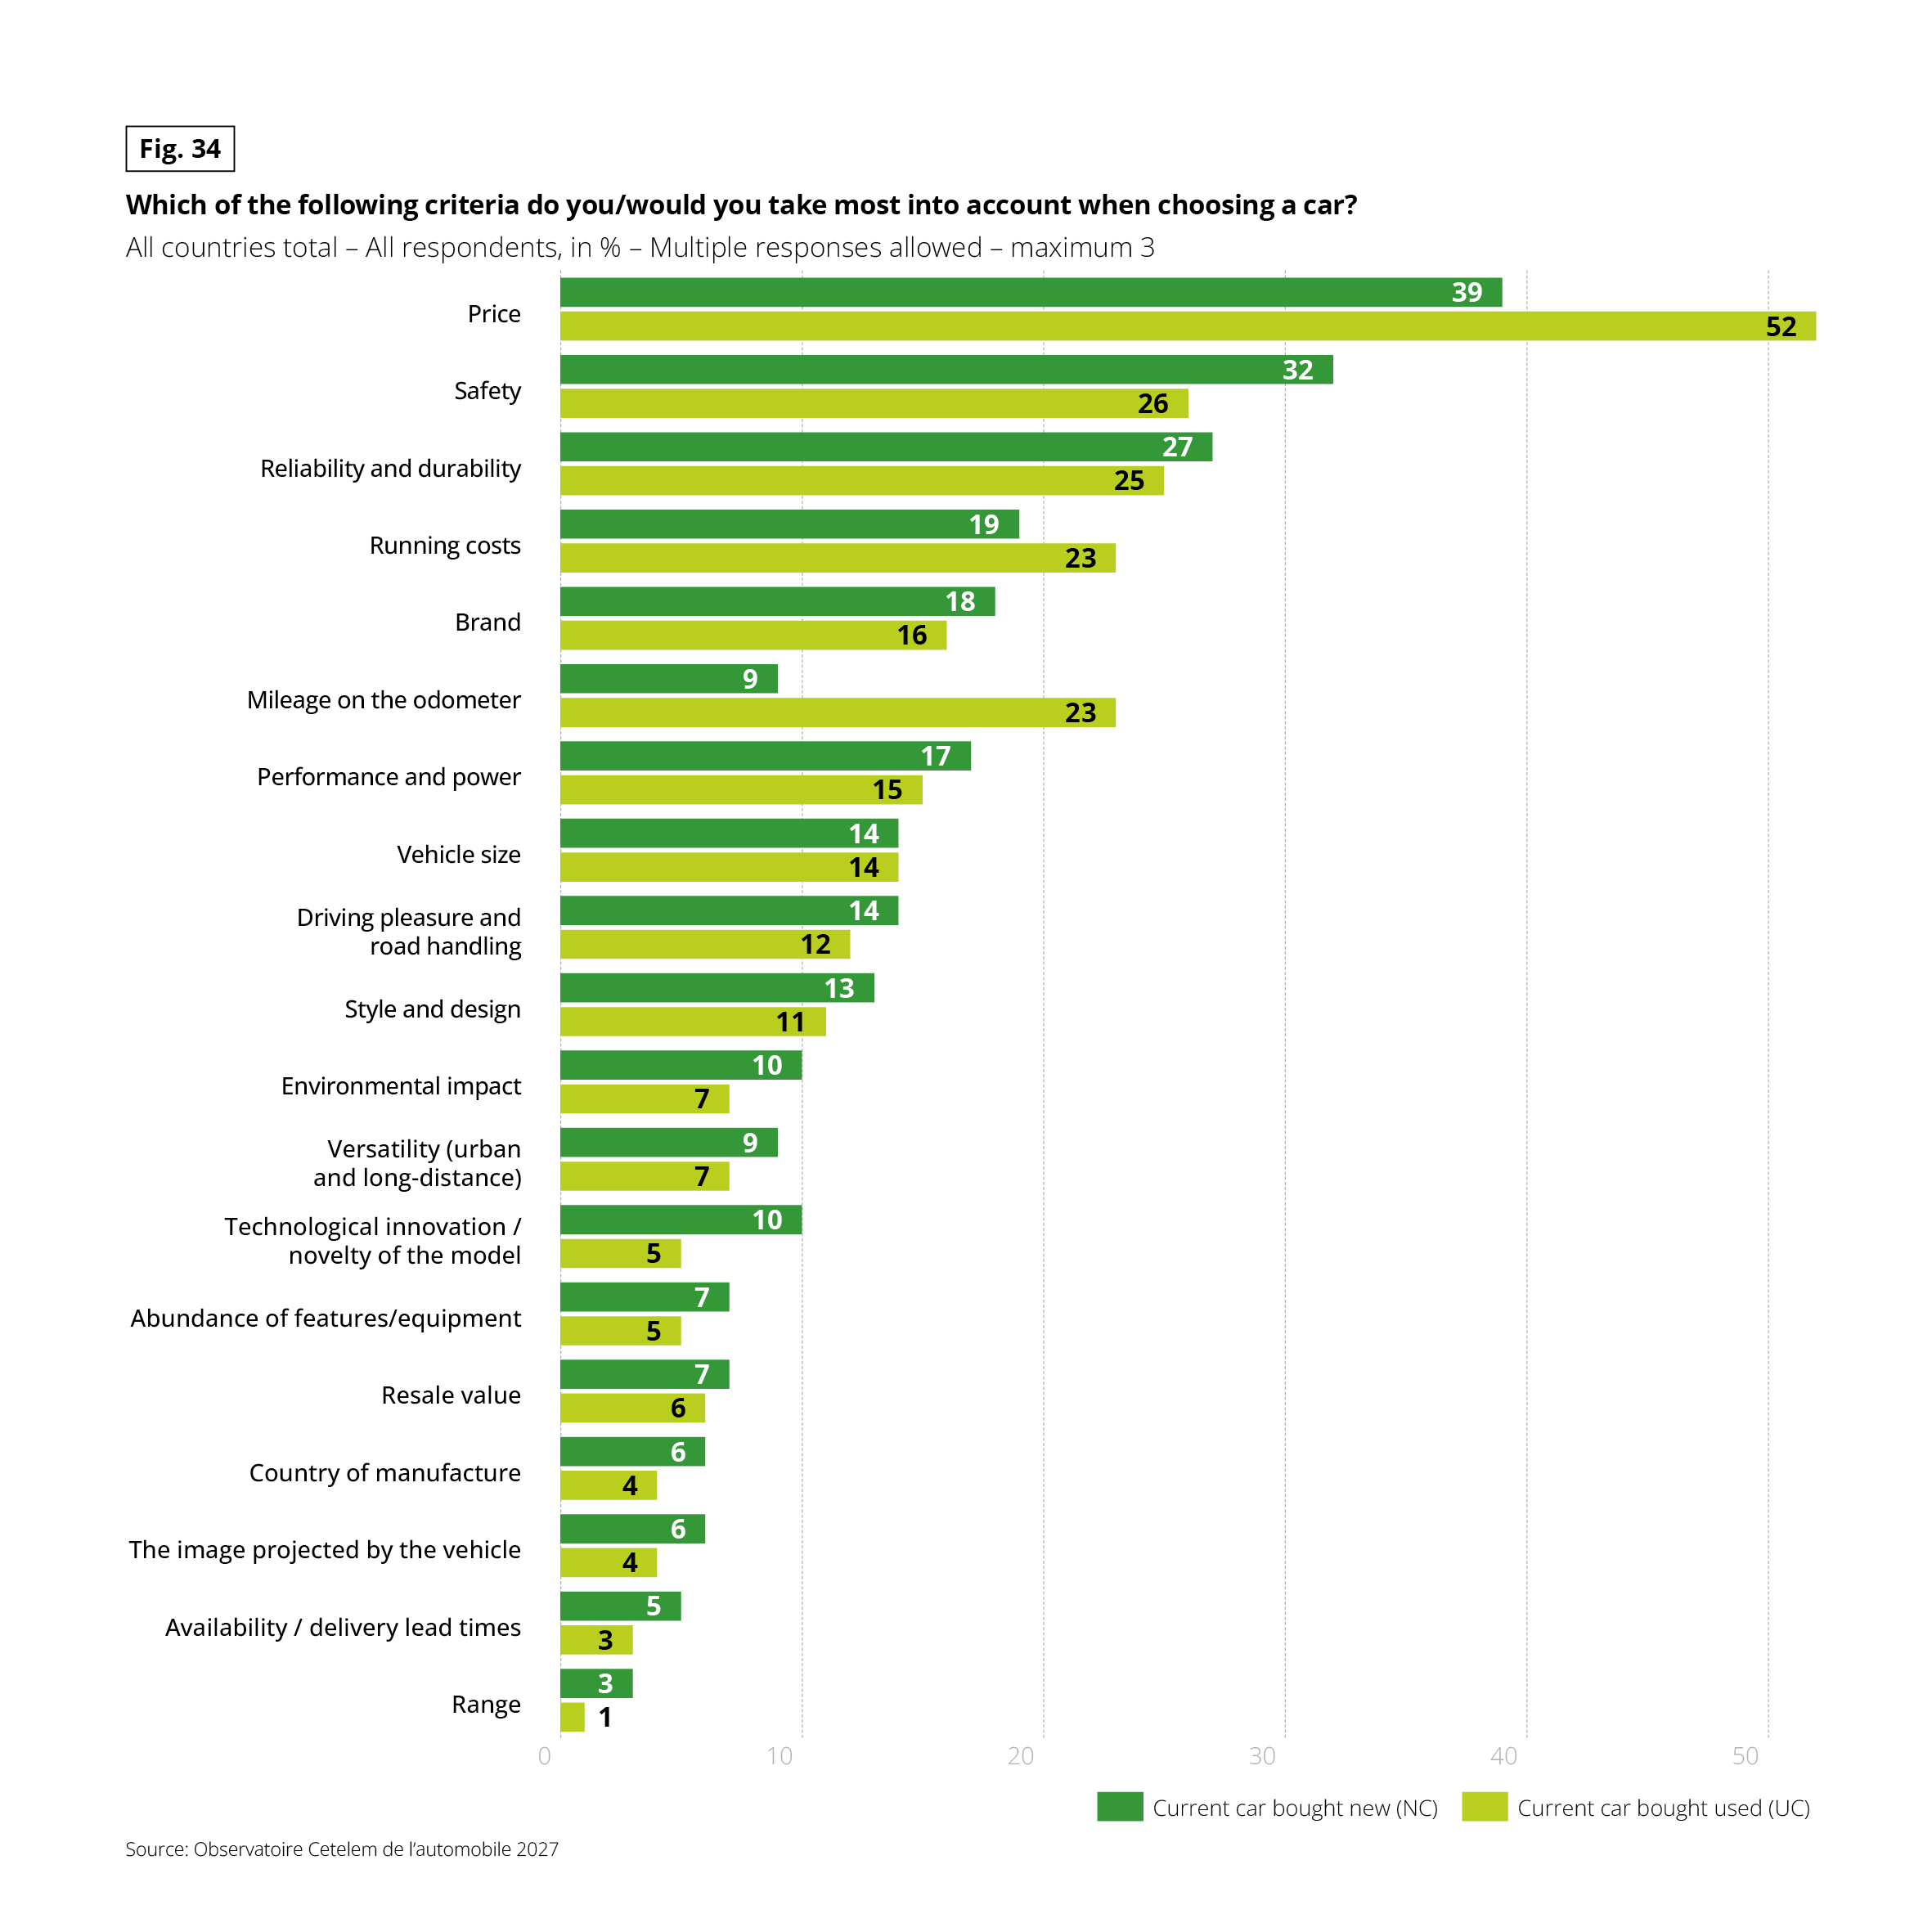 Horizontal paired bar chart. Question: “Which of the following criteria do/would you take most into account when choosing a car?” Base: all countries total, all respondents, in %. Multiple responses allowed, maximum 3. Two series: current car bought new (NC) and current car bought used (UC). Source: Observatoire Cetelem de l’automobile 2027.
Data, in the form new / used:
• Price: 39% / 52%
• Safety: 32% / 26%
• Reliability and durability: 27% / 25%
• Running costs: 19% / 23%
• Brand: 18% / 16%
• Mileage on the odometer: 9% / 23%
• Performance and power: 17% / 15%
• Vehicle size: 14% / 14%
• Driving pleasure and road handling: 14% / 12%
• Style and design: 13% / 11%
• Environmental impact: 10% / 7%
• Versatility (urban and long-distance): 9% / 7%
• Technological innovation / novelty of the model: 10% / 5%
• Abundance of features/equipment: 7% / 5%
• Resale value: 7% / 6%
• Country of manufacture: 6% / 4%
• The image projected by the vehicle: 6% / 4%
• Availability / delivery lead times: 5% / 3%
• Range: 3% / 1%
Price is the top criterion for both groups, and even more so for used-car buyers. New-car buyers give more weight to safety, innovation and brand. Used-car buyers give more weight to price, running costs and mileage.
Horizontal paired bar chart. Question: “Which of the following criteria do/would you take most into account when choosing a car?” Base: all countries total, all respondents, in %. Multiple responses allowed, maximum 3. Two series: current car bought new (NC) and current car bought used (UC). Source: Observatoire Cetelem de l’automobile 2027.
Data, in the form new / used:
• Price: 39% / 52%
• Safety: 32% / 26%
• Reliability and durability: 27% / 25%
• Running costs: 19% / 23%
• Brand: 18% / 16%
• Mileage on the odometer: 9% / 23%
• Performance and power: 17% / 15%
• Vehicle size: 14% / 14%
• Driving pleasure and road handling: 14% / 12%
• Style and design: 13% / 11%
• Environmental impact: 10% / 7%
• Versatility (urban and long-distance): 9% / 7%
• Technological innovation / novelty of the model: 10% / 5%
• Abundance of features/equipment: 7% / 5%
• Resale value: 7% / 6%
• Country of manufacture: 6% / 4%
• The image projected by the vehicle: 6% / 4%
• Availability / delivery lead times: 5% / 3%
• Range: 3% / 1%
Price is the top criterion for both groups, and even more so for used-car buyers. New-car buyers give more weight to safety, innovation and brand. Used-car buyers give more weight to price, running costs and mileage.
THE COST OF WALKING AWAY
Price is not merely a decisive purchasing factor; it is also the primary deal-breaker. Exerting far more influence than brand identity itself, its power to dictate consumer behaviour is absolute. Indeed, 6 in 10 motorists have decided against buying a particular brand simply due to its high price tag. Spanish and Italian consumers are the most likely to have walked away for this reason, in stark contrast to British, Chinese, Japanese and American drivers, who prove far less price-sensitive. Price is a major deal-breaker in France, as well. Younger buyers and rural residents are similarly responsive to this factor.
Fig. 35 – Waiver of a brand for price reasons (% of “yes” by country)
Download this infographic for your presentations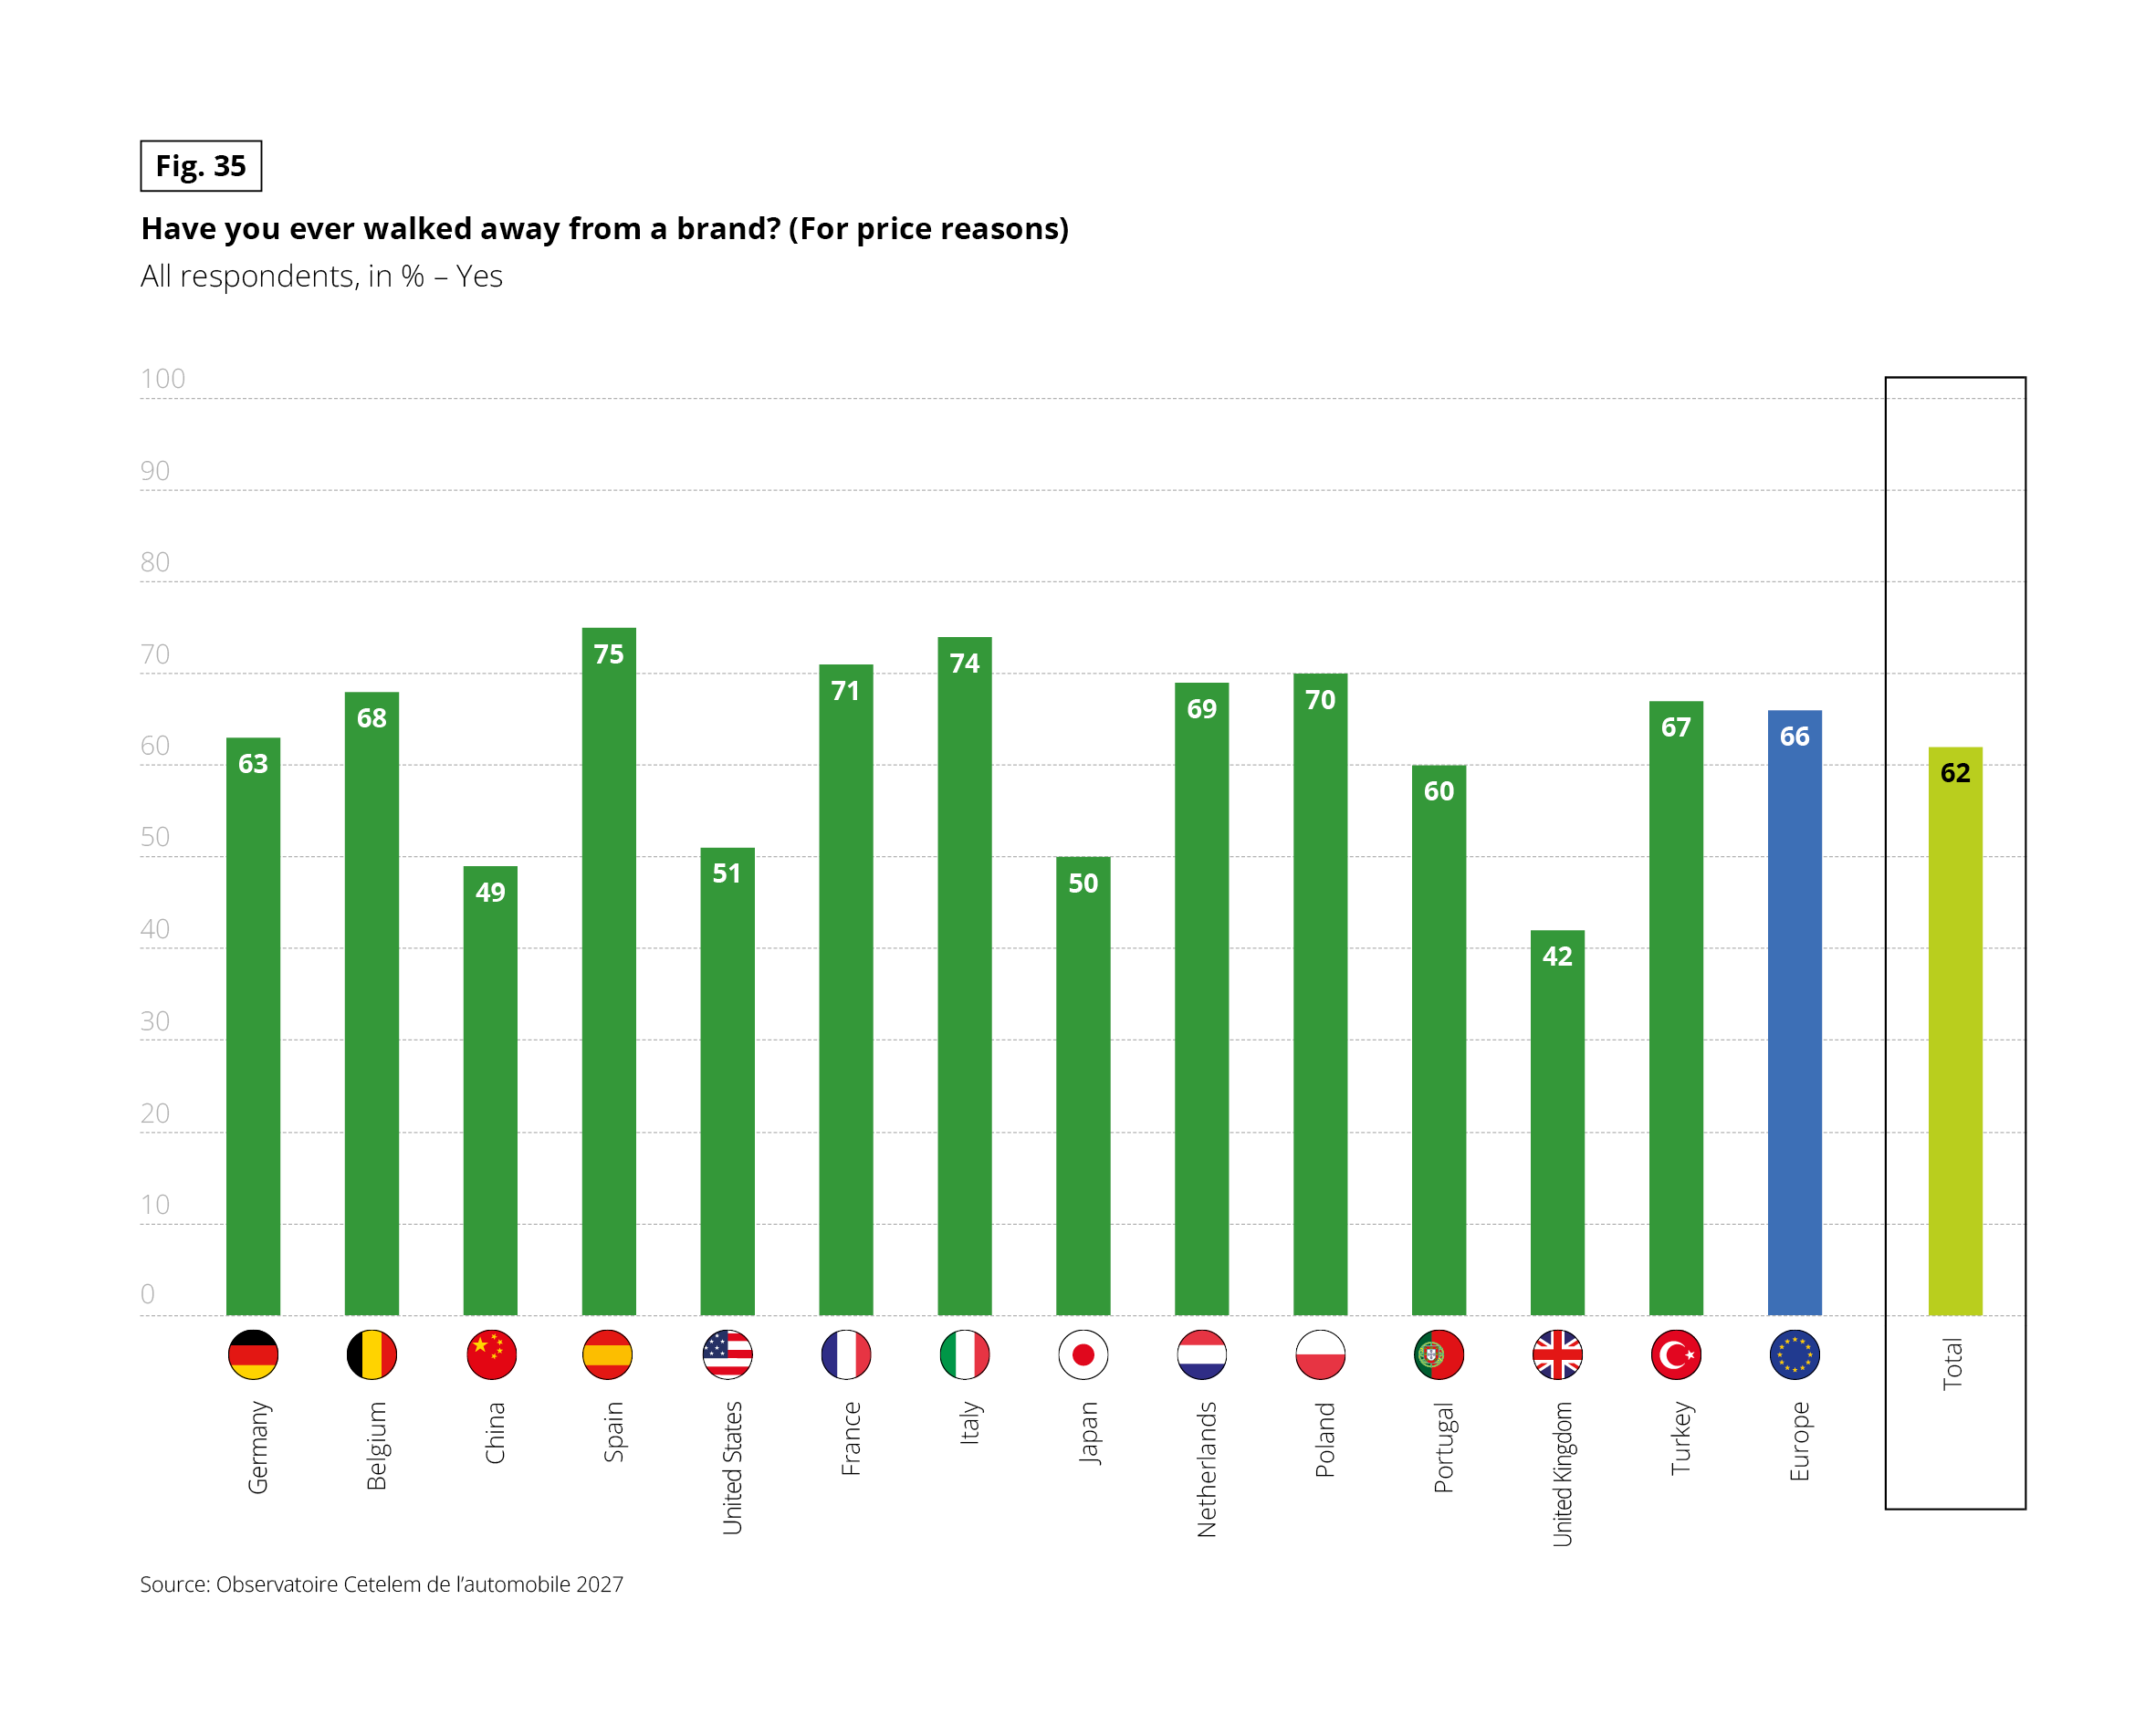 Vertical bar chart. Question: “Have you ever walked away from a brand? (For price reasons)”
Base: all respondents, in %, answer “Yes”. Source: Observatoire Cetelem de l’automobile 2027.
Across all countries combined, 62% answered yes. Spain is the highest (75%) and the United Kingdom the lowest (42%).
Data by country: Germany 63%, Belgium 68%, China 49%, Spain 75%, United States 51%, France 71%, Italy 74%, Japan 50%, Netherlands 69%, Poland 70%, Portugal 60%, United Kingdom 42%, Turkey 67%. The European average is 66%. The total is 62%.
Vertical bar chart. Question: “Have you ever walked away from a brand? (For price reasons)”
Base: all respondents, in %, answer “Yes”. Source: Observatoire Cetelem de l’automobile 2027.
Across all countries combined, 62% answered yes. Spain is the highest (75%) and the United Kingdom the lowest (42%).
Data by country: Germany 63%, Belgium 68%, China 49%, Spain 75%, United States 51%, France 71%, Italy 74%, Japan 50%, Netherlands 69%, Poland 70%, Portugal 60%, United Kingdom 42%, Turkey 67%. The European average is 66%. The total is 62%.
PRICE TRUMPS ORIGIN
If further proof were needed that price outweighs patriotism, nearly 6 in 10 motorists provide it by choosing a cheaper foreign brand over a domestic equivalent. National resistance is strongest, as is so often the case, in Japan, alongside China and the US. In Portugal, the Netherlands, Spain and Italy, the price argument proves overwhelmingly persuasive. Younger generations are more inclined than older cohorts to opt for a domestic brand, even at a higher price tag. The split between new and used market buyers reveals subtly different priorities. Preference for domestic origin holds firm in the new car sector across the three aforementioned countries, as well as in Germany and France, where figures hit or exceed 50%. This threshold is never reached in the second-hand market, except in Japan and the US, with price winning out in every other nation.
Fig. 36.1 – Choice between a more expensive domestic car and a cheaper foreign car, current car purchased new (%)
Download this infographic for your presentations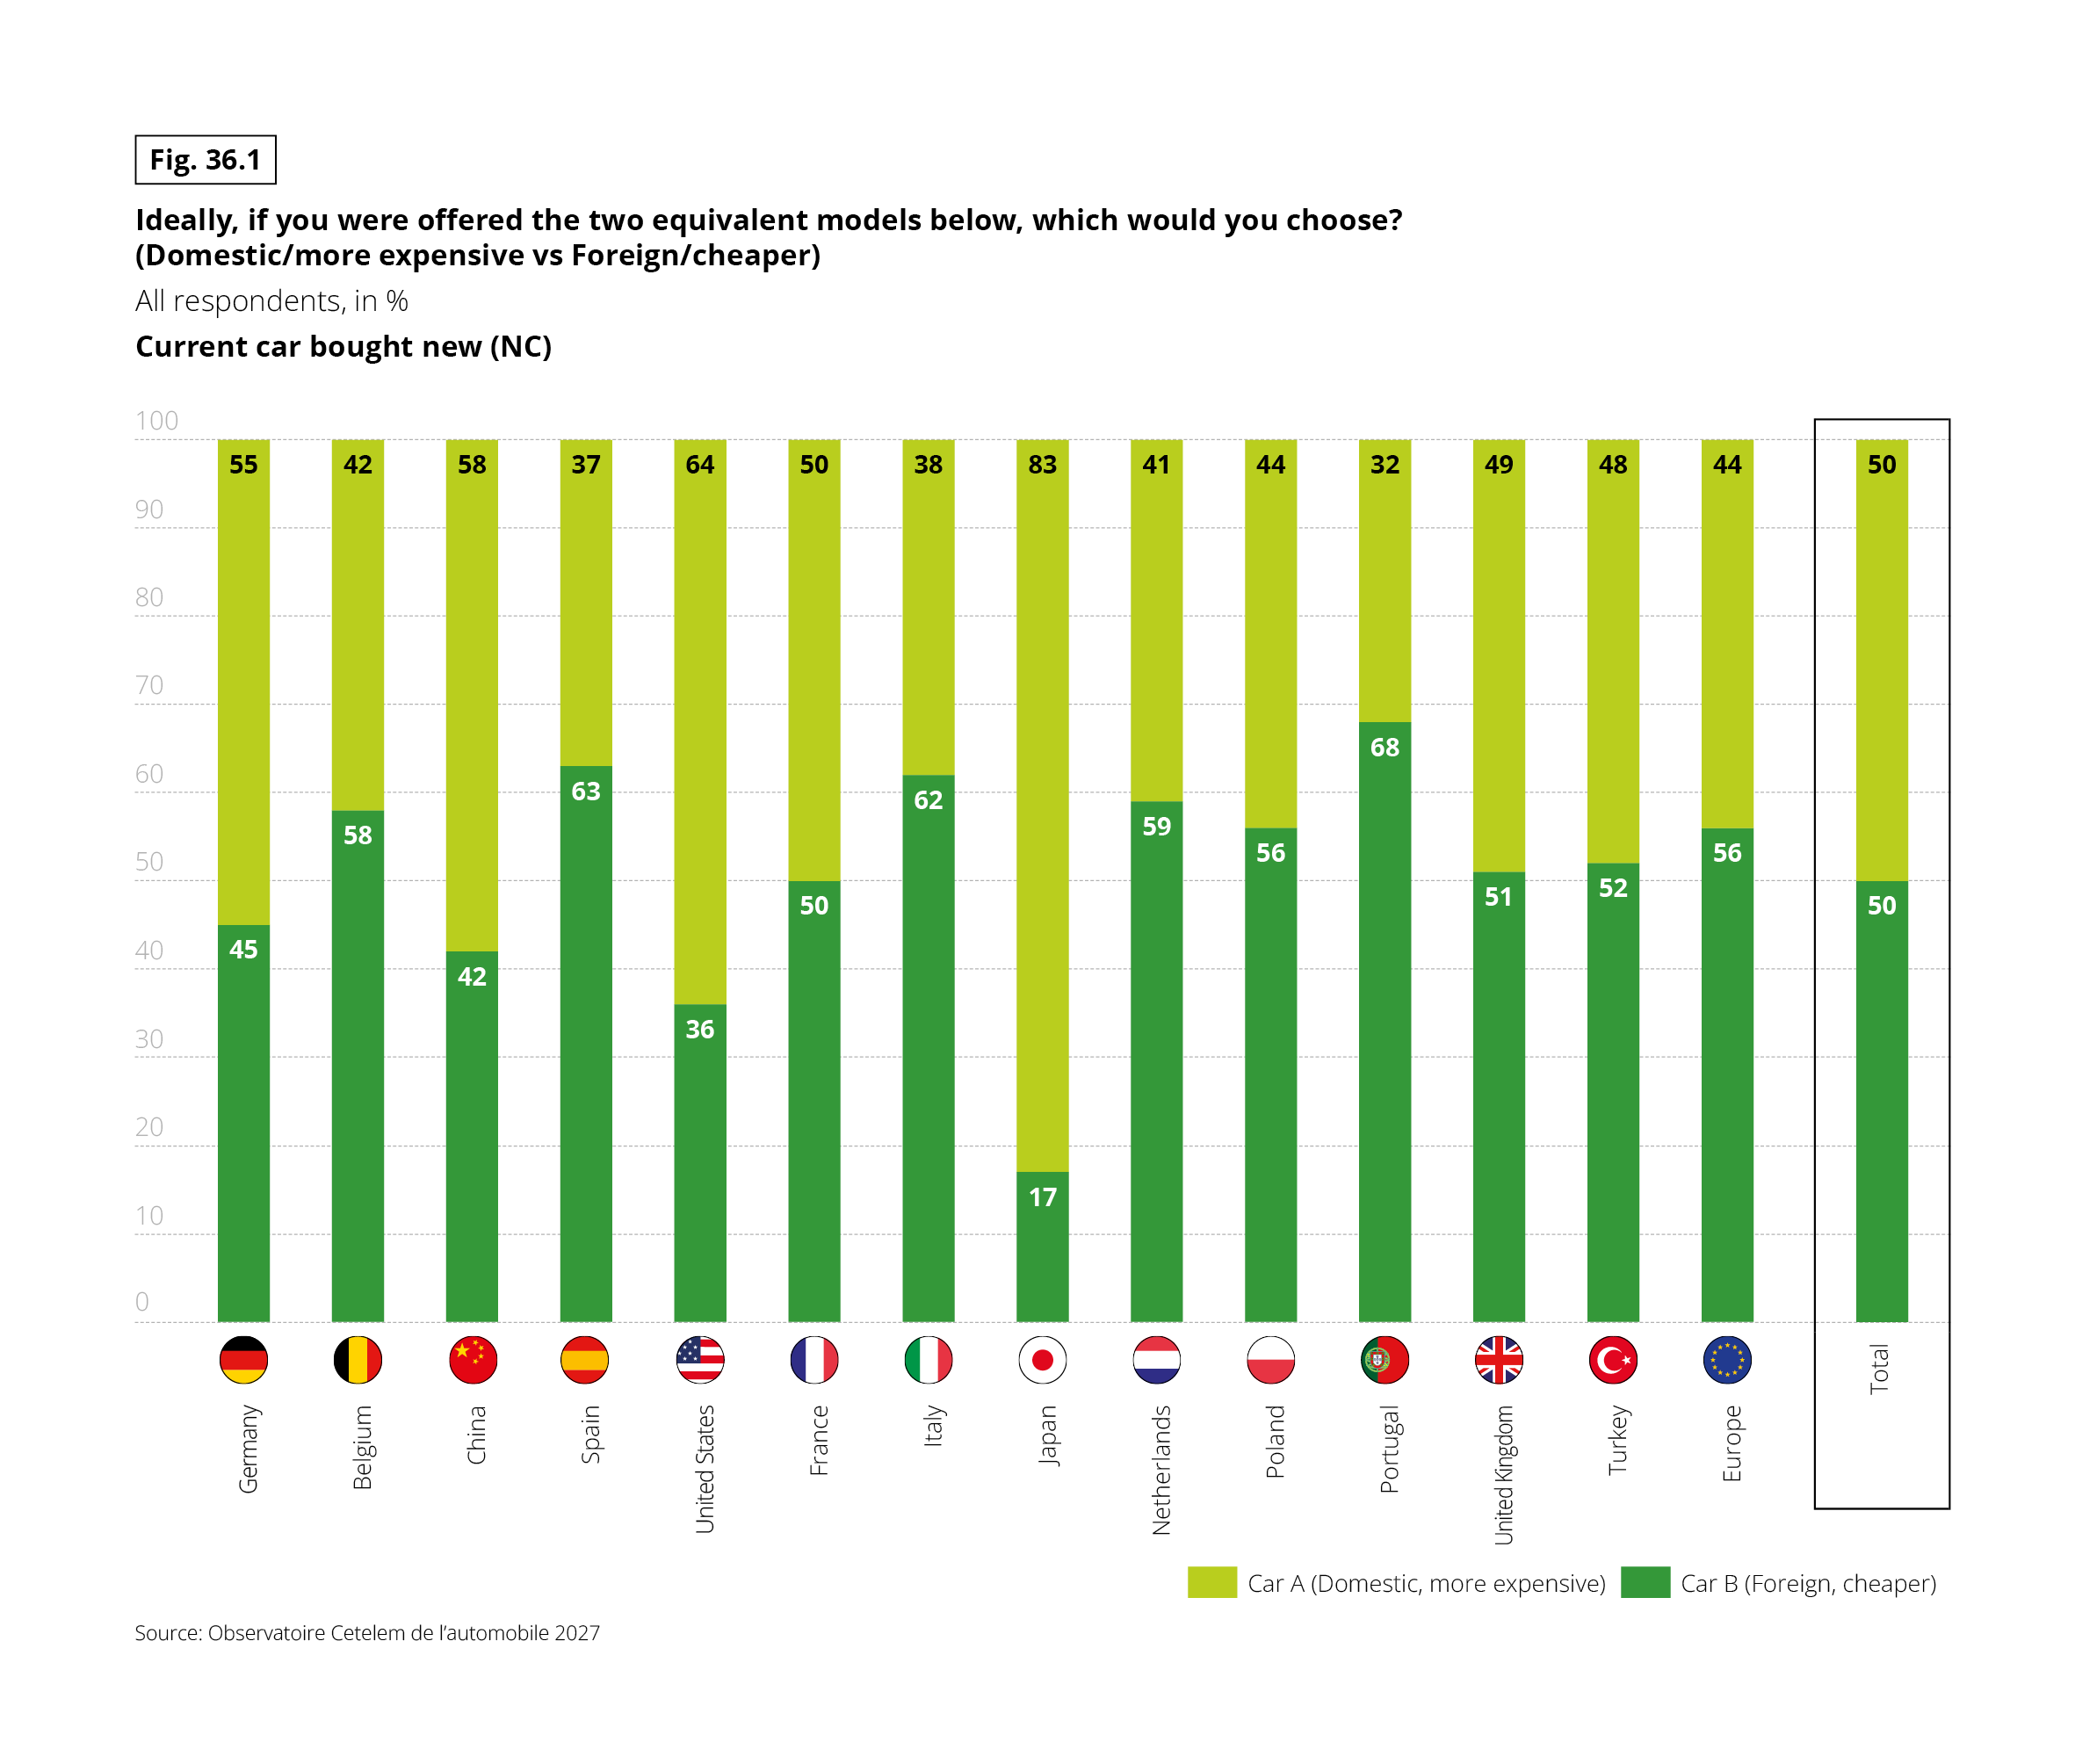 Stacked vertical bar chart. Question: “Ideally, if you were offered the two equivalent models below, which would you choose? (Domestic/more expensive vs Foreign/cheaper)” Base: all respondents, in %. Filter: current car bought new (NC). Two answers: Car A (domestic, more expensive) and Car B (foreign, cheaper). Source: Observatoire Cetelem de l’automobile 2027. For all countries combined, the split is 50% Car A and 50% Car B.
Data by country, in the form Car A domestic / Car B foreign:
• Germany 55% / 45%
• Belgium 42% / 58%
• China 58% / 42%
• Spain 37% / 63%
• United States 64% / 36%
• France 50% / 50%
• Italy 38% / 62%
• Japan 83% / 17%
• Netherlands 41% / 59%
• Poland 44% / 56%
• Portugal 32% / 68%
• United Kingdom 49% / 51%
• Turkey 48% / 52%
• Europe average 44% / 56%
Japan stands out with a very strong preference for the domestic car (83%). Portugal, Spain and Italy favour the cheaper foreign car most clearly.
Stacked vertical bar chart. Question: “Ideally, if you were offered the two equivalent models below, which would you choose? (Domestic/more expensive vs Foreign/cheaper)” Base: all respondents, in %. Filter: current car bought new (NC). Two answers: Car A (domestic, more expensive) and Car B (foreign, cheaper). Source: Observatoire Cetelem de l’automobile 2027. For all countries combined, the split is 50% Car A and 50% Car B.
Data by country, in the form Car A domestic / Car B foreign:
• Germany 55% / 45%
• Belgium 42% / 58%
• China 58% / 42%
• Spain 37% / 63%
• United States 64% / 36%
• France 50% / 50%
• Italy 38% / 62%
• Japan 83% / 17%
• Netherlands 41% / 59%
• Poland 44% / 56%
• Portugal 32% / 68%
• United Kingdom 49% / 51%
• Turkey 48% / 52%
• Europe average 44% / 56%
Japan stands out with a very strong preference for the domestic car (83%). Portugal, Spain and Italy favour the cheaper foreign car most clearly.
Fig. 36.2 – Choice between a more expensive domestic car and a cheaper foreign car, current car purchased second-hand (%)
Download this infographic for your presentations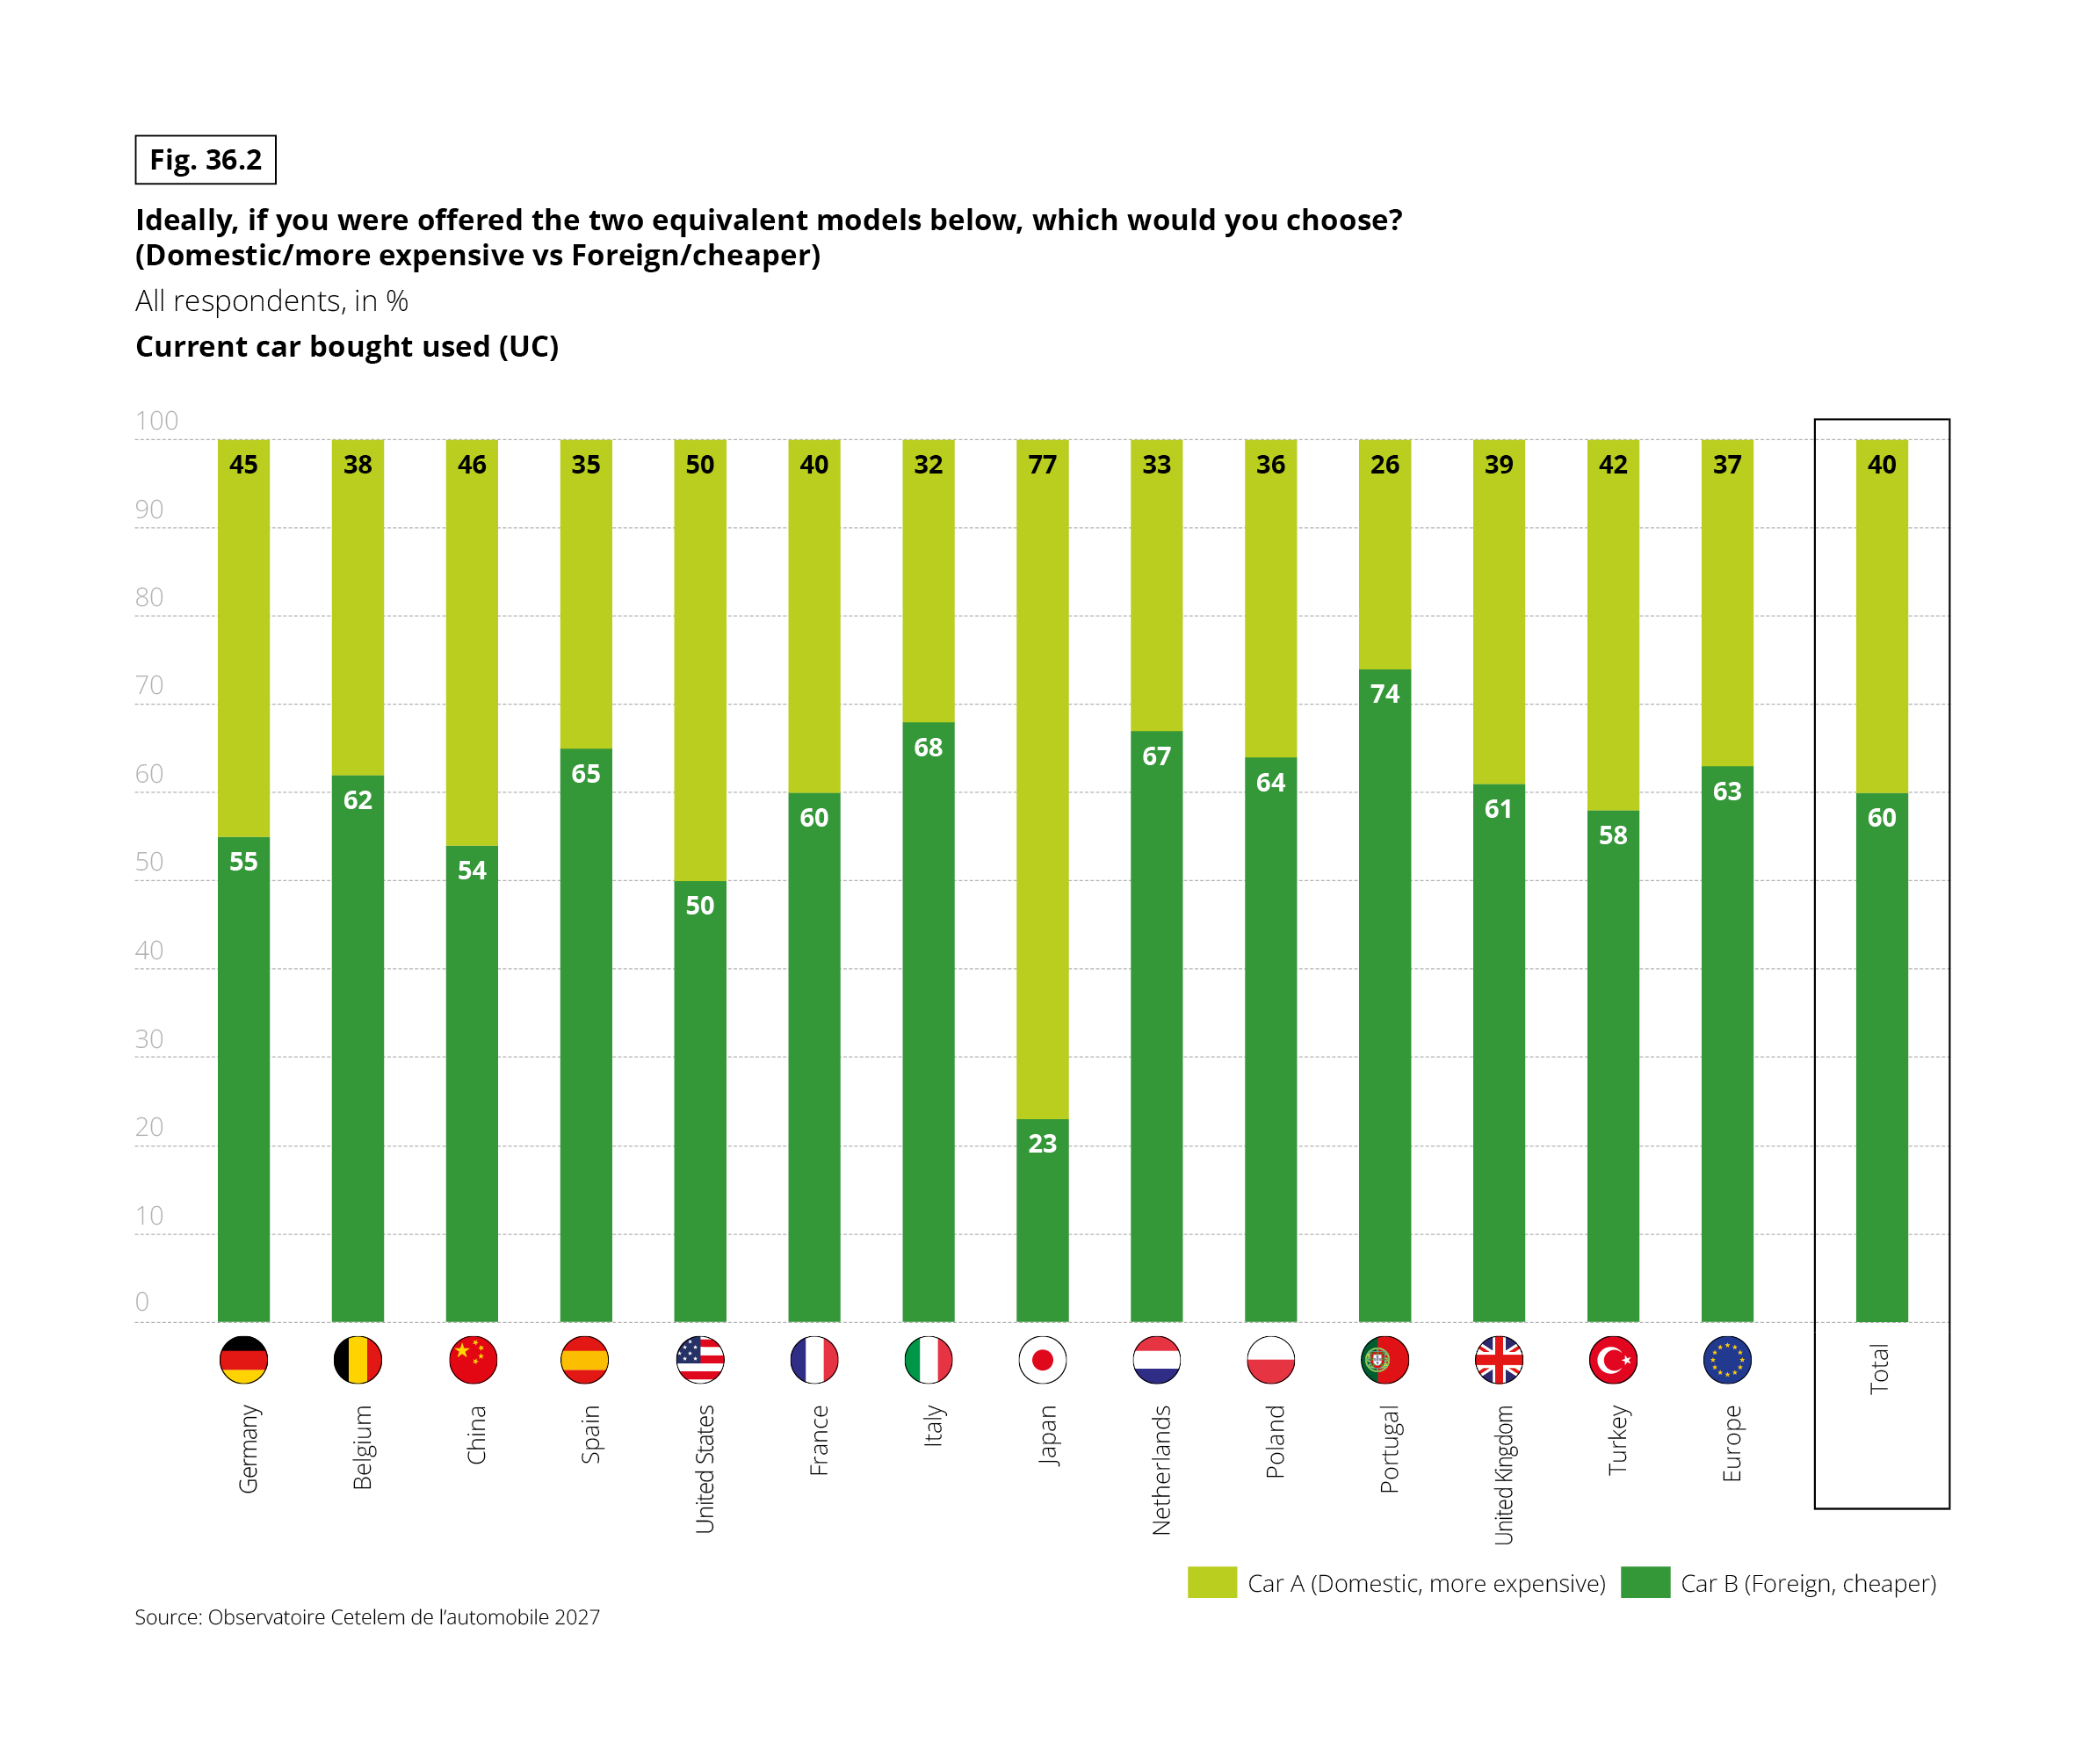 Stacked vertical bar chart. Question: “Ideally, if you were offered the two equivalent models below, which would you choose? (Domestic/more expensive vs Foreign/cheaper)” Base: all respondents, in %. Filter: current car bought used (UC). Two answers: Car A (domestic, more expensive) and Car B (foreign, cheaper). Source: Observatoire Cetelem de l’automobile 2027. For all countries combined, 40% choose Car A and 60% choose Car B.
Data by country, in the form Car A domestic / Car B foreign:
• Germany 45% / 55%
• Belgium 38% / 62%
• China 46% / 54%
• Spain 35% / 65%
• United States 50% / 50%
• France 40% / 60%
• Italy 32% / 68%
• Japan 77% / 23%
• Netherlands 33% / 67%
• Poland 36% / 64%
• Portugal 26% / 74%
• United Kingdom 39% / 61%
• Turkey 42% / 58%
• Europe average 37% / 63%
Used-car buyers choose the cheaper foreign car more often than new-car buyers (60% against 50%, Fig. 36.1). Japan is again the exception with a majority for the domestic car (77%), and Portugal has the highest share for the foreign car (74%).
Stacked vertical bar chart. Question: “Ideally, if you were offered the two equivalent models below, which would you choose? (Domestic/more expensive vs Foreign/cheaper)” Base: all respondents, in %. Filter: current car bought used (UC). Two answers: Car A (domestic, more expensive) and Car B (foreign, cheaper). Source: Observatoire Cetelem de l’automobile 2027. For all countries combined, 40% choose Car A and 60% choose Car B.
Data by country, in the form Car A domestic / Car B foreign:
• Germany 45% / 55%
• Belgium 38% / 62%
• China 46% / 54%
• Spain 35% / 65%
• United States 50% / 50%
• France 40% / 60%
• Italy 32% / 68%
• Japan 77% / 23%
• Netherlands 33% / 67%
• Poland 36% / 64%
• Portugal 26% / 74%
• United Kingdom 39% / 61%
• Turkey 42% / 58%
• Europe average 37% / 63%
Used-car buyers choose the cheaper foreign car more often than new-car buyers (60% against 50%, Fig. 36.1). Japan is again the exception with a majority for the domestic car (77%), and Portugal has the highest share for the foreign car (74%).