
Energy costs

 3 min
reading time
3 min
reading time
THE IMPACT OF THE ENERGY CRISIS
The geopolitical backdrop and accompanying energy crisis provided a compelling reason to ask motorists about another form of financial pressure: rising fuel prices. For 1 in 5 motorists, no fuel price hike, no matter how steep, would prompt a change in vehicle or habits. Just over half set a 20% price increase as the threshold beyond which everything changes. Across most surveyed countries, results are remarkably consistent, with Japan standing out as the market where drivers are least inclined to change their vehicle or habits. Income levels exert surprisingly little influence on these choices. While wealthier households have the financial cushion to absorb the crisis, those on tighter budgets simply cannot afford to give up their cars. In rural areas, dependency on cars means drivers are less likely to contemplate change than their urban counterparts. Just starting out in their careers, younger drivers report feeling most constrained by rising fuel costs.
Fig. 37 – Increase in the monthly fuel budget from which a change of vehicle or mode of transport is considered (% of households equipped)
Download this infographic for your presentations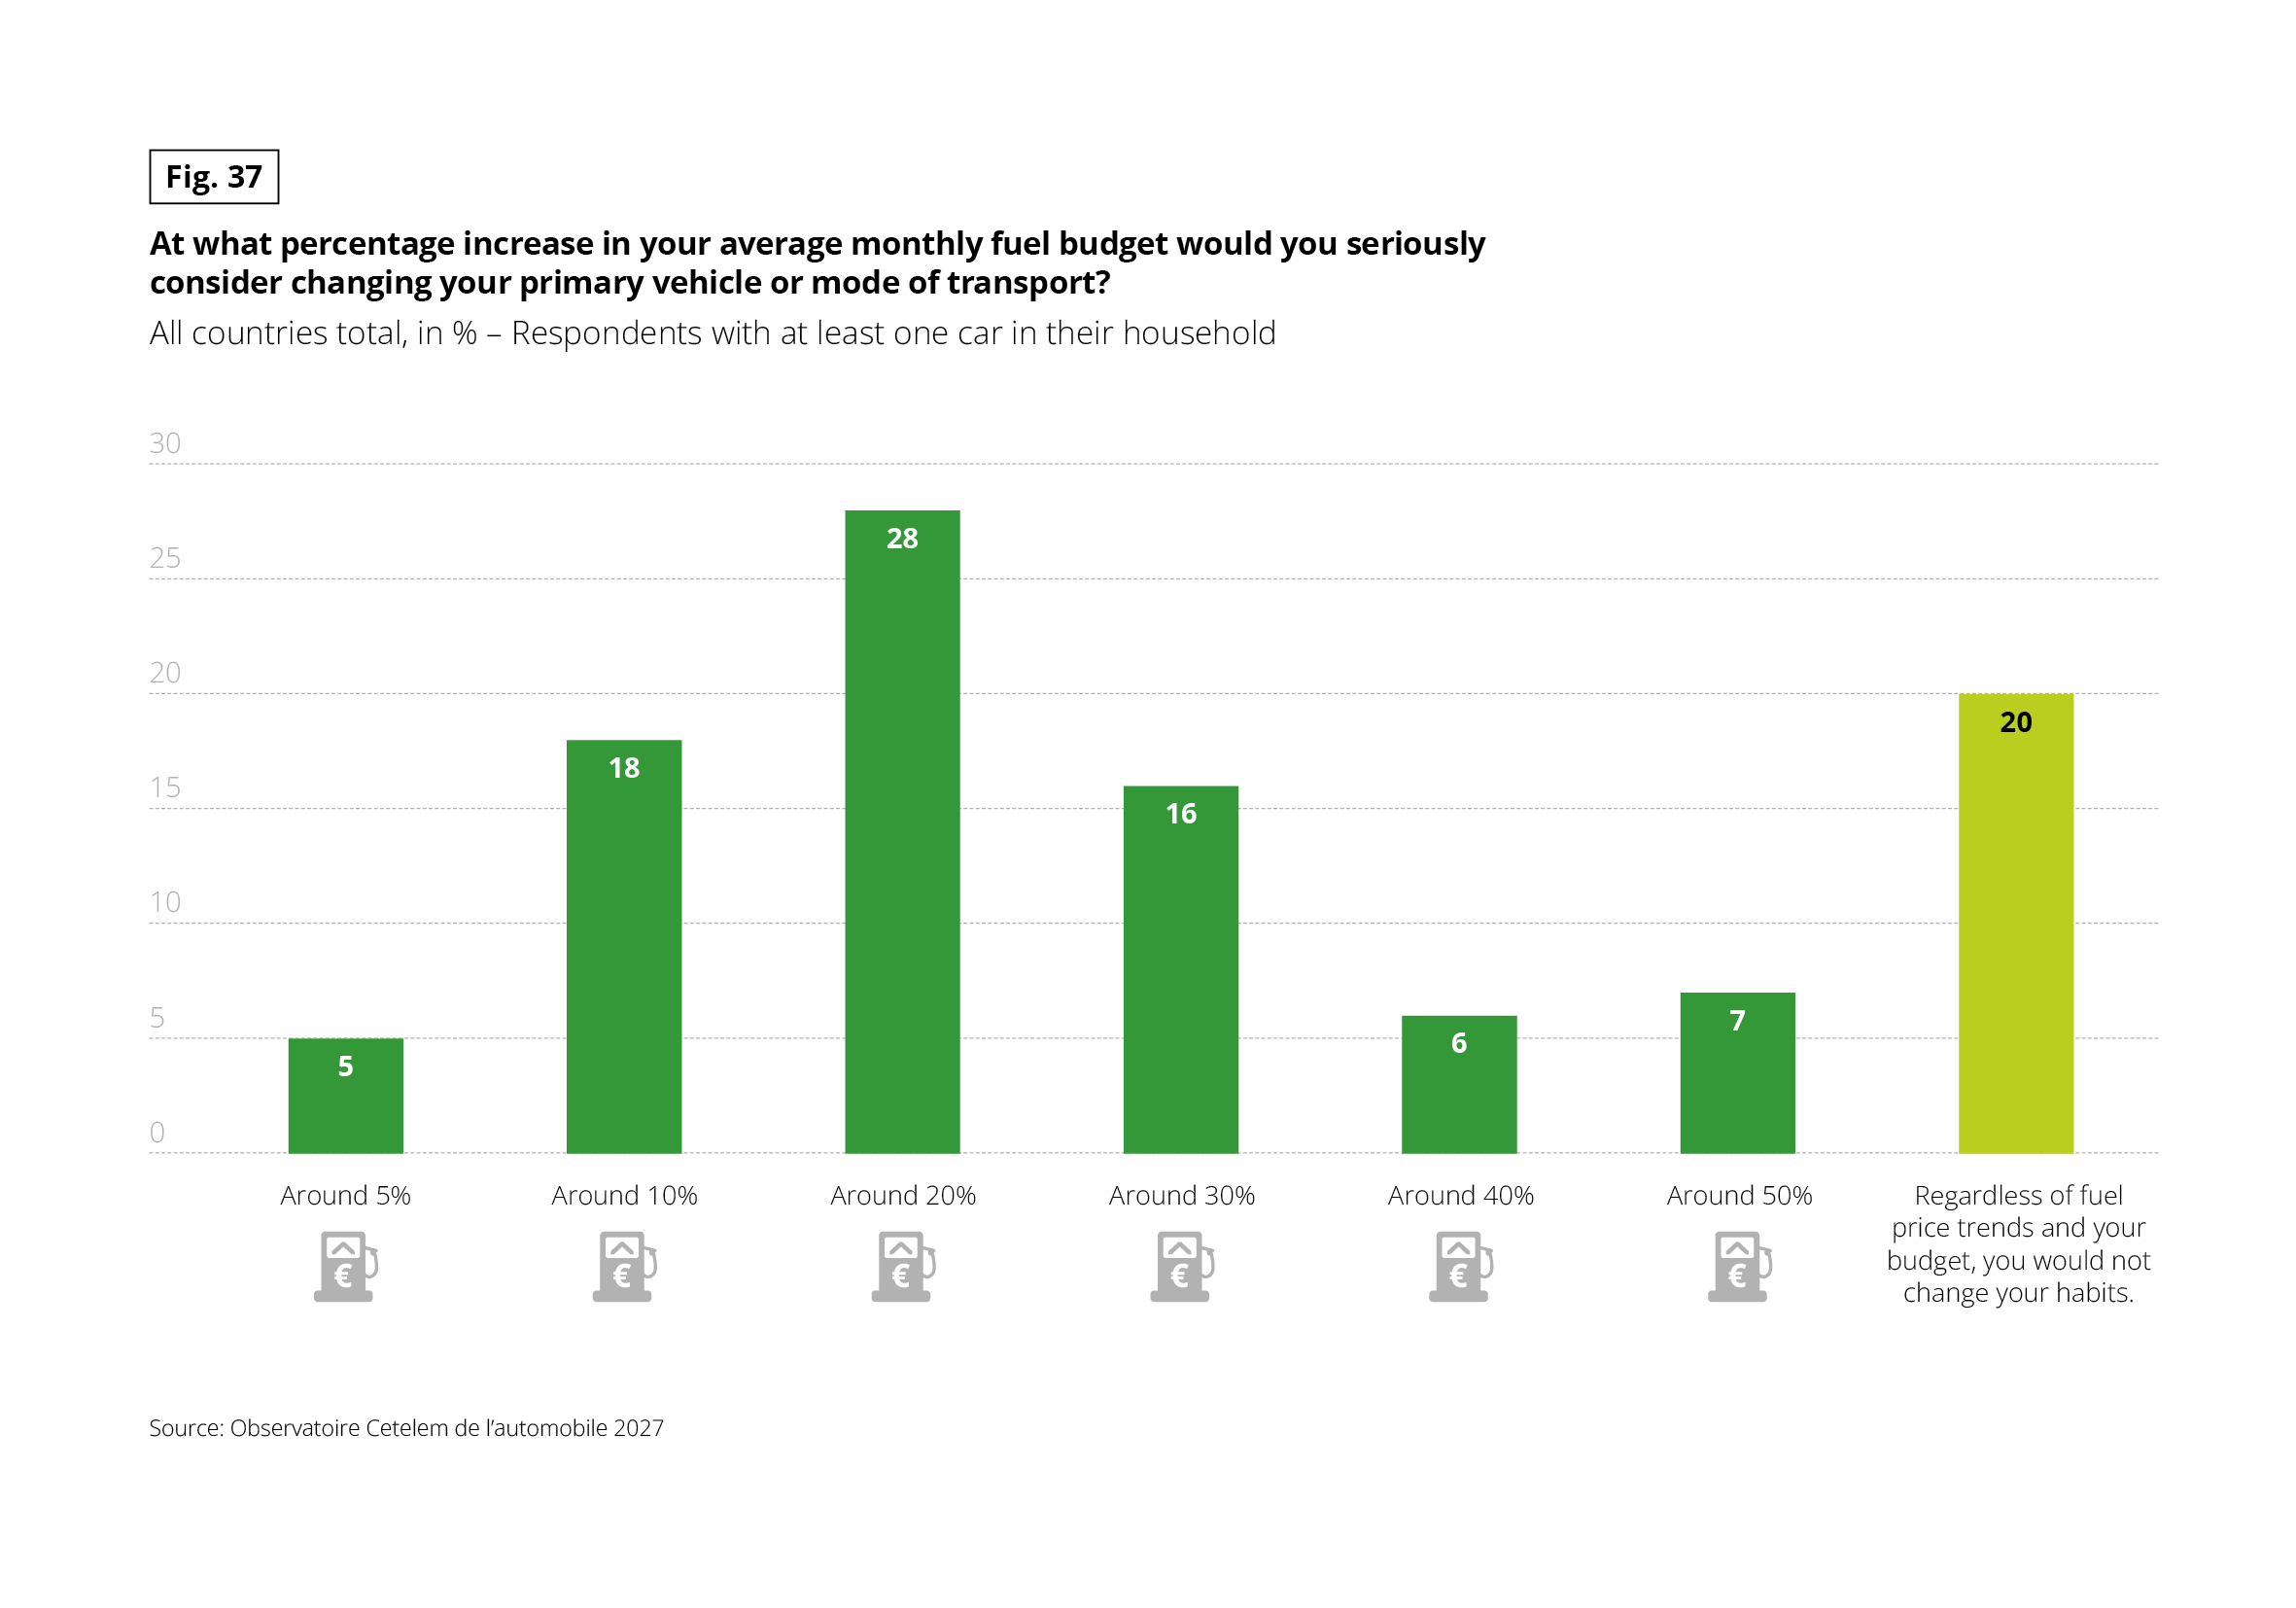 Vertical bar chart. Question: “At what percentage increase in your average monthly fuel budget would you seriously consider changing your primary vehicle or mode of transport?” Base: all countries total, respondents with at least one car in their household, in %. Source: Observatoire Cetelem de l’automobile 2027.
Results:
• Around 5%: 5%
• Around 10%: 18%
• Around 20%: 28%
• Around 30%: 16%
• Around 40%: 6%
• Around 50%: 7%
• Regardless of fuel price trends and budget, would not change habits: 20%
An increase of around 20% is the most frequently cited threshold. Cumulatively, 67% of respondents would consider a change at an increase of 30% or less, and 20% would not change their habits whatever the price.
Vertical bar chart. Question: “At what percentage increase in your average monthly fuel budget would you seriously consider changing your primary vehicle or mode of transport?” Base: all countries total, respondents with at least one car in their household, in %. Source: Observatoire Cetelem de l’automobile 2027.
Results:
• Around 5%: 5%
• Around 10%: 18%
• Around 20%: 28%
• Around 30%: 16%
• Around 40%: 6%
• Around 50%: 7%
• Regardless of fuel price trends and budget, would not change habits: 20%
An increase of around 20% is the most frequently cited threshold. Cumulatively, 67% of respondents would consider a change at an increase of 30% or less, and 20% would not change their habits whatever the price.
CRISIS CURBS TRAVEL
Outside the US, the fuel price surge following the Iranian crisis has had a varied impact on consumption.
Fig. 38 – Gasoline consumption per capita, January to May 2026 (kb/j per million inhabitants)
Download this infographic for your presentations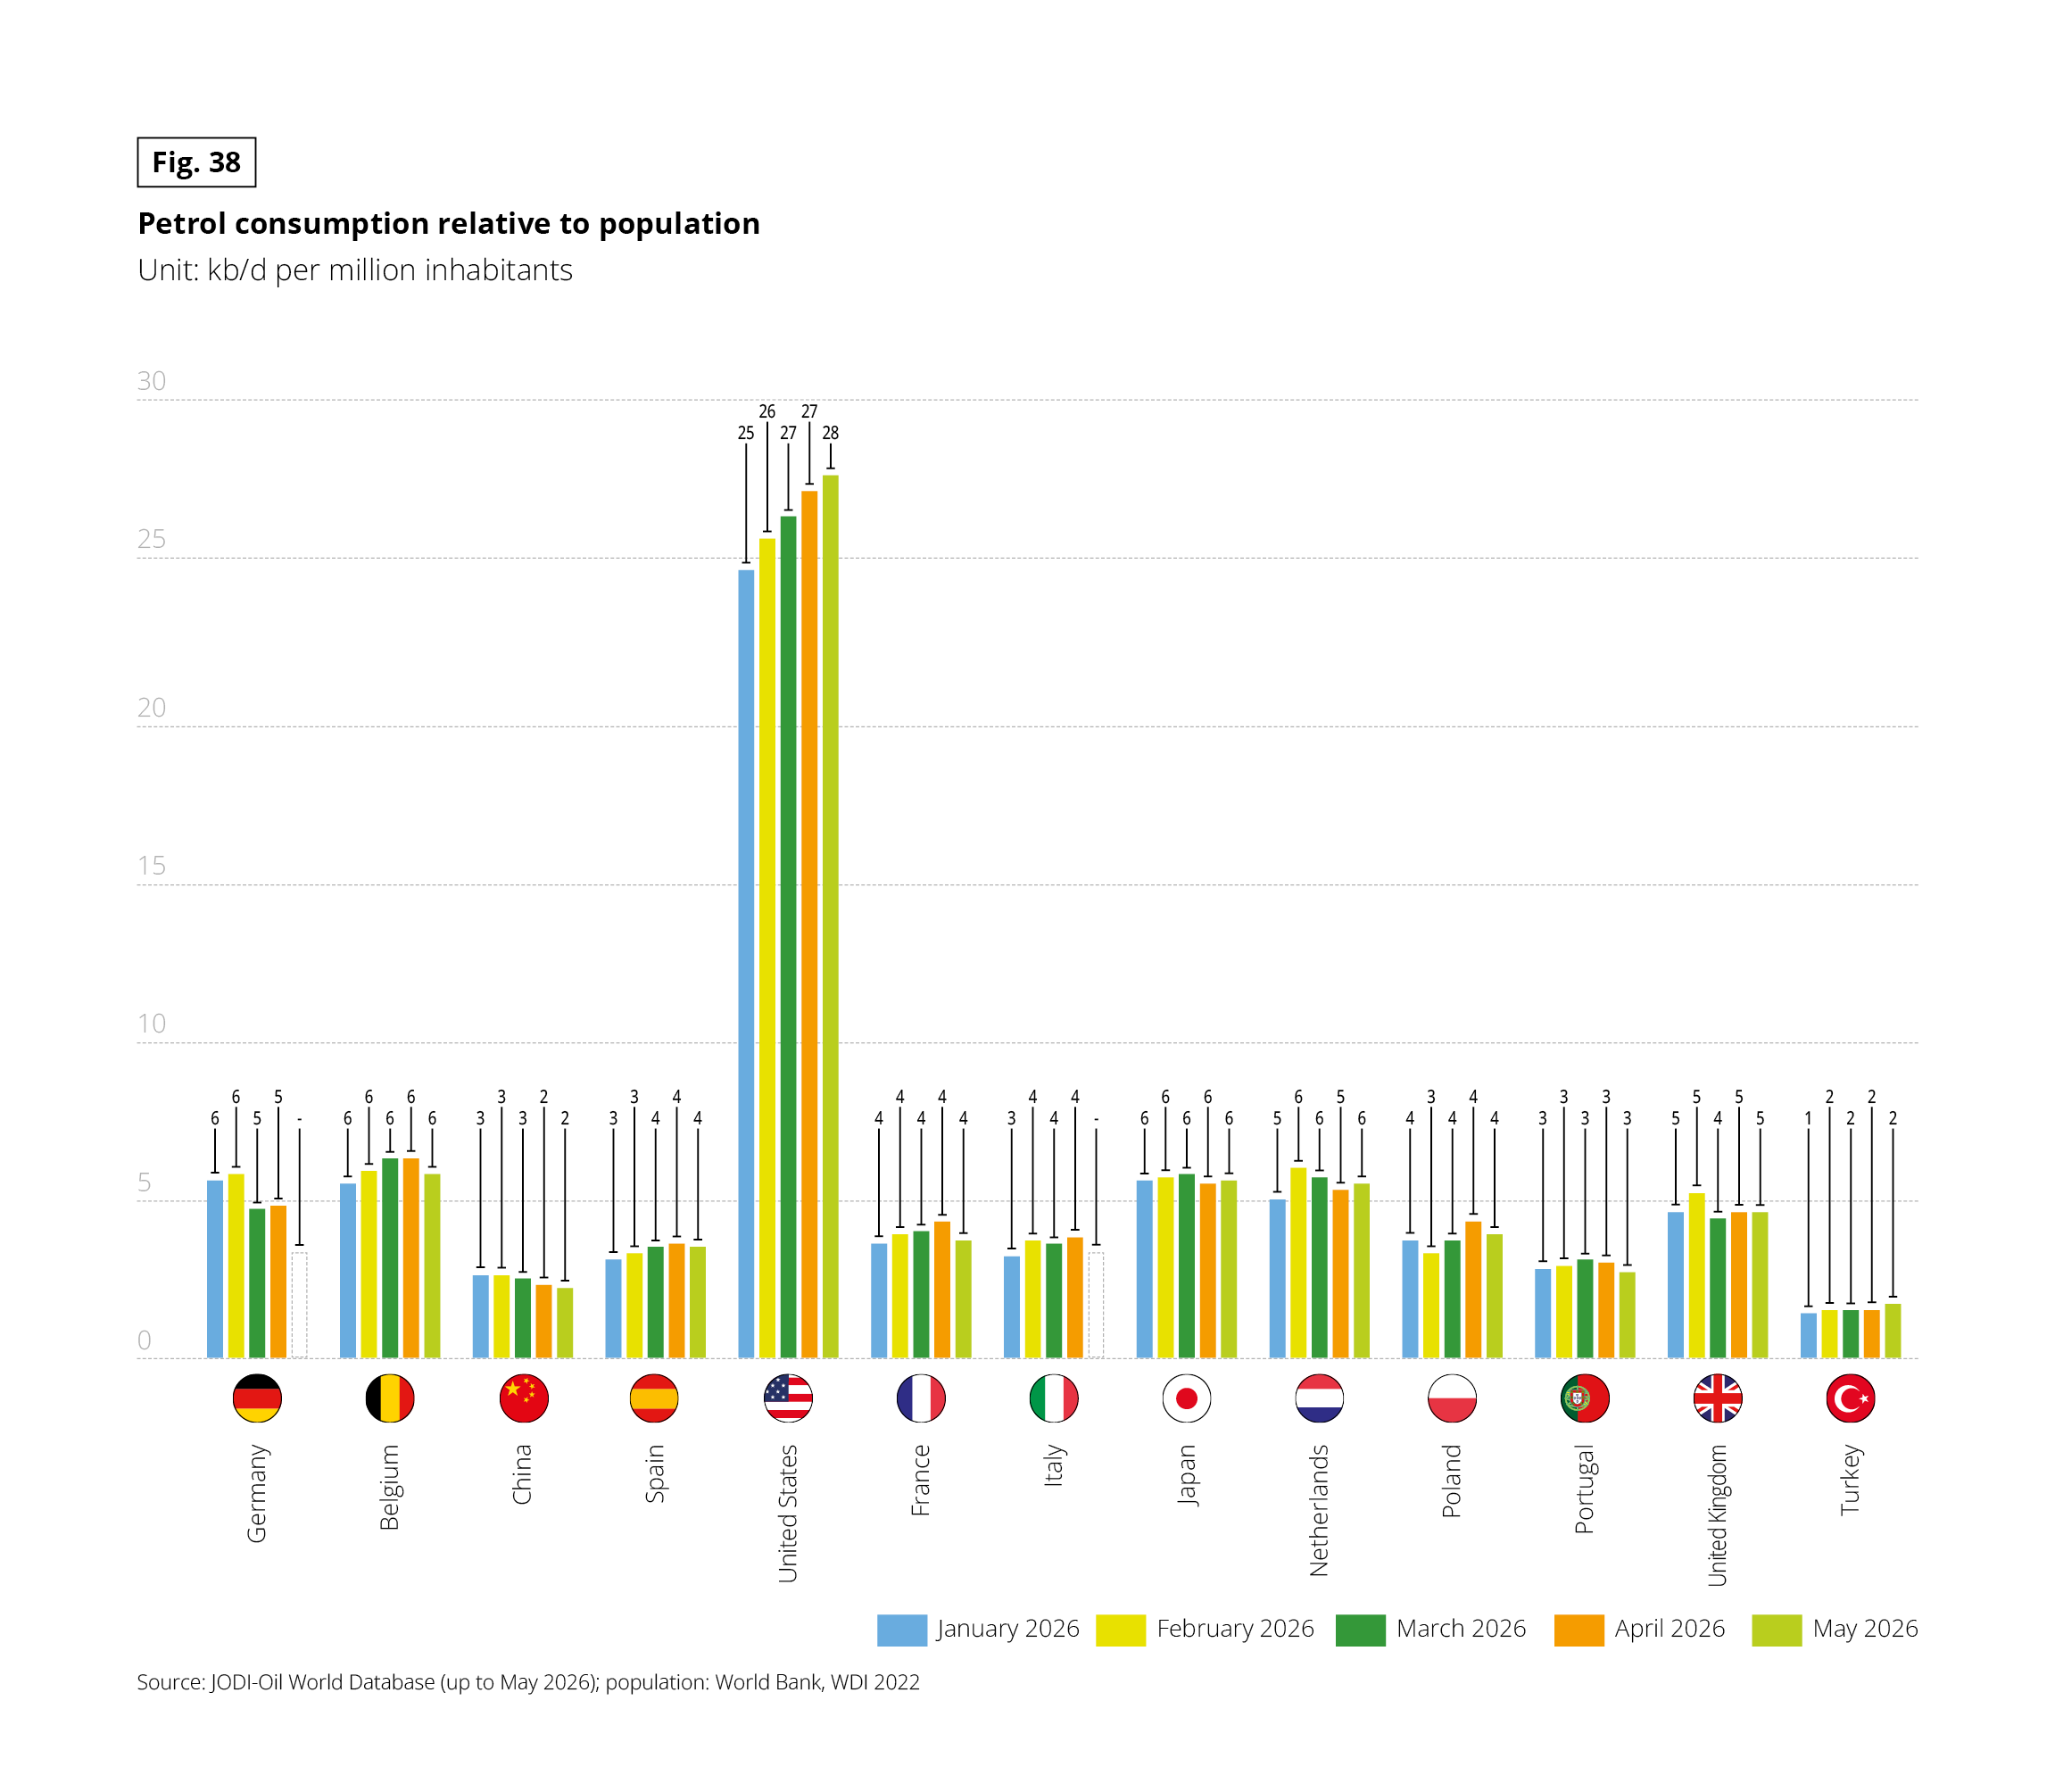 Vertical grouped bar chart. Unit: kb/d (thousand barrels per day) per million inhabitants, rounded to the nearest whole number. Five series, one per month: January, February, March, April and May 2026. Source: JODI-Oil World Database (up to May 2026); population: World Bank, WDI 2022.
Data by country, in the form January / February / March / April / May:
• Germany: 6 / 6 / 5 / 5 / no data shown
• Belgium: 6 / 6 / 6 / 6 / 6
• China: 3 / 3 / 3 / 2 / 2
• Spain: 3 / 3 / 4 / 4 / 4
• United States: 25 / 26 / 27 / 27 / 28
• France: 4 / 4 / 4 / 4 / 4
• Italy: 3 / 4 / 4 / 4 / no data shown
• Japan: 6 / 6 / 6 / 6 / 6
• Netherlands: 5 / 6 / 6 / 5 / 6
• Poland: 4 / 3 / 4 / 4 / 4
• Portugal: 3 / 3 / 3 / 3 / 3
• United Kingdom: 5 / 5 / 4 / 5 / 5
• Turkey: 1 / 2 / 2 / 2 / 2
Consumption per inhabitant in the United States is four to five times higher than in any other country shown, and it rises slightly over the period. Turkey has the lowest level. May 2026 values are missing for Germany and Italy.
Vertical grouped bar chart. Unit: kb/d (thousand barrels per day) per million inhabitants, rounded to the nearest whole number. Five series, one per month: January, February, March, April and May 2026. Source: JODI-Oil World Database (up to May 2026); population: World Bank, WDI 2022.
Data by country, in the form January / February / March / April / May:
• Germany: 6 / 6 / 5 / 5 / no data shown
• Belgium: 6 / 6 / 6 / 6 / 6
• China: 3 / 3 / 3 / 2 / 2
• Spain: 3 / 3 / 4 / 4 / 4
• United States: 25 / 26 / 27 / 27 / 28
• France: 4 / 4 / 4 / 4 / 4
• Italy: 3 / 4 / 4 / 4 / no data shown
• Japan: 6 / 6 / 6 / 6 / 6
• Netherlands: 5 / 6 / 6 / 5 / 6
• Poland: 4 / 3 / 4 / 4 / 4
• Portugal: 3 / 3 / 3 / 3 / 3
• United Kingdom: 5 / 5 / 4 / 5 / 5
• Turkey: 1 / 2 / 2 / 2 / 2
Consumption per inhabitant in the United States is four to five times higher than in any other country shown, and it rises slightly over the period. Turkey has the lowest level. May 2026 values are missing for Germany and Italy.
FUEL PRICES: IS THE IRAN CONFLICT A TIPPING POINT?
The conflict surrounding the Strait of Hormuz triggered a surge in pump prices in spring 2026: across the EU average, diesel rose from around €1.59/L in February to over €2.05/L in April 2026, while petrol topped €1.85/L. Following a brief respite in June, prices resumed their upward trajectory in July as fighting flared up again.
Fig. 39 – Average fuel price at EU pumps, January 2025 to July 2026 (€/L TTC)
Download this infographic for your presentations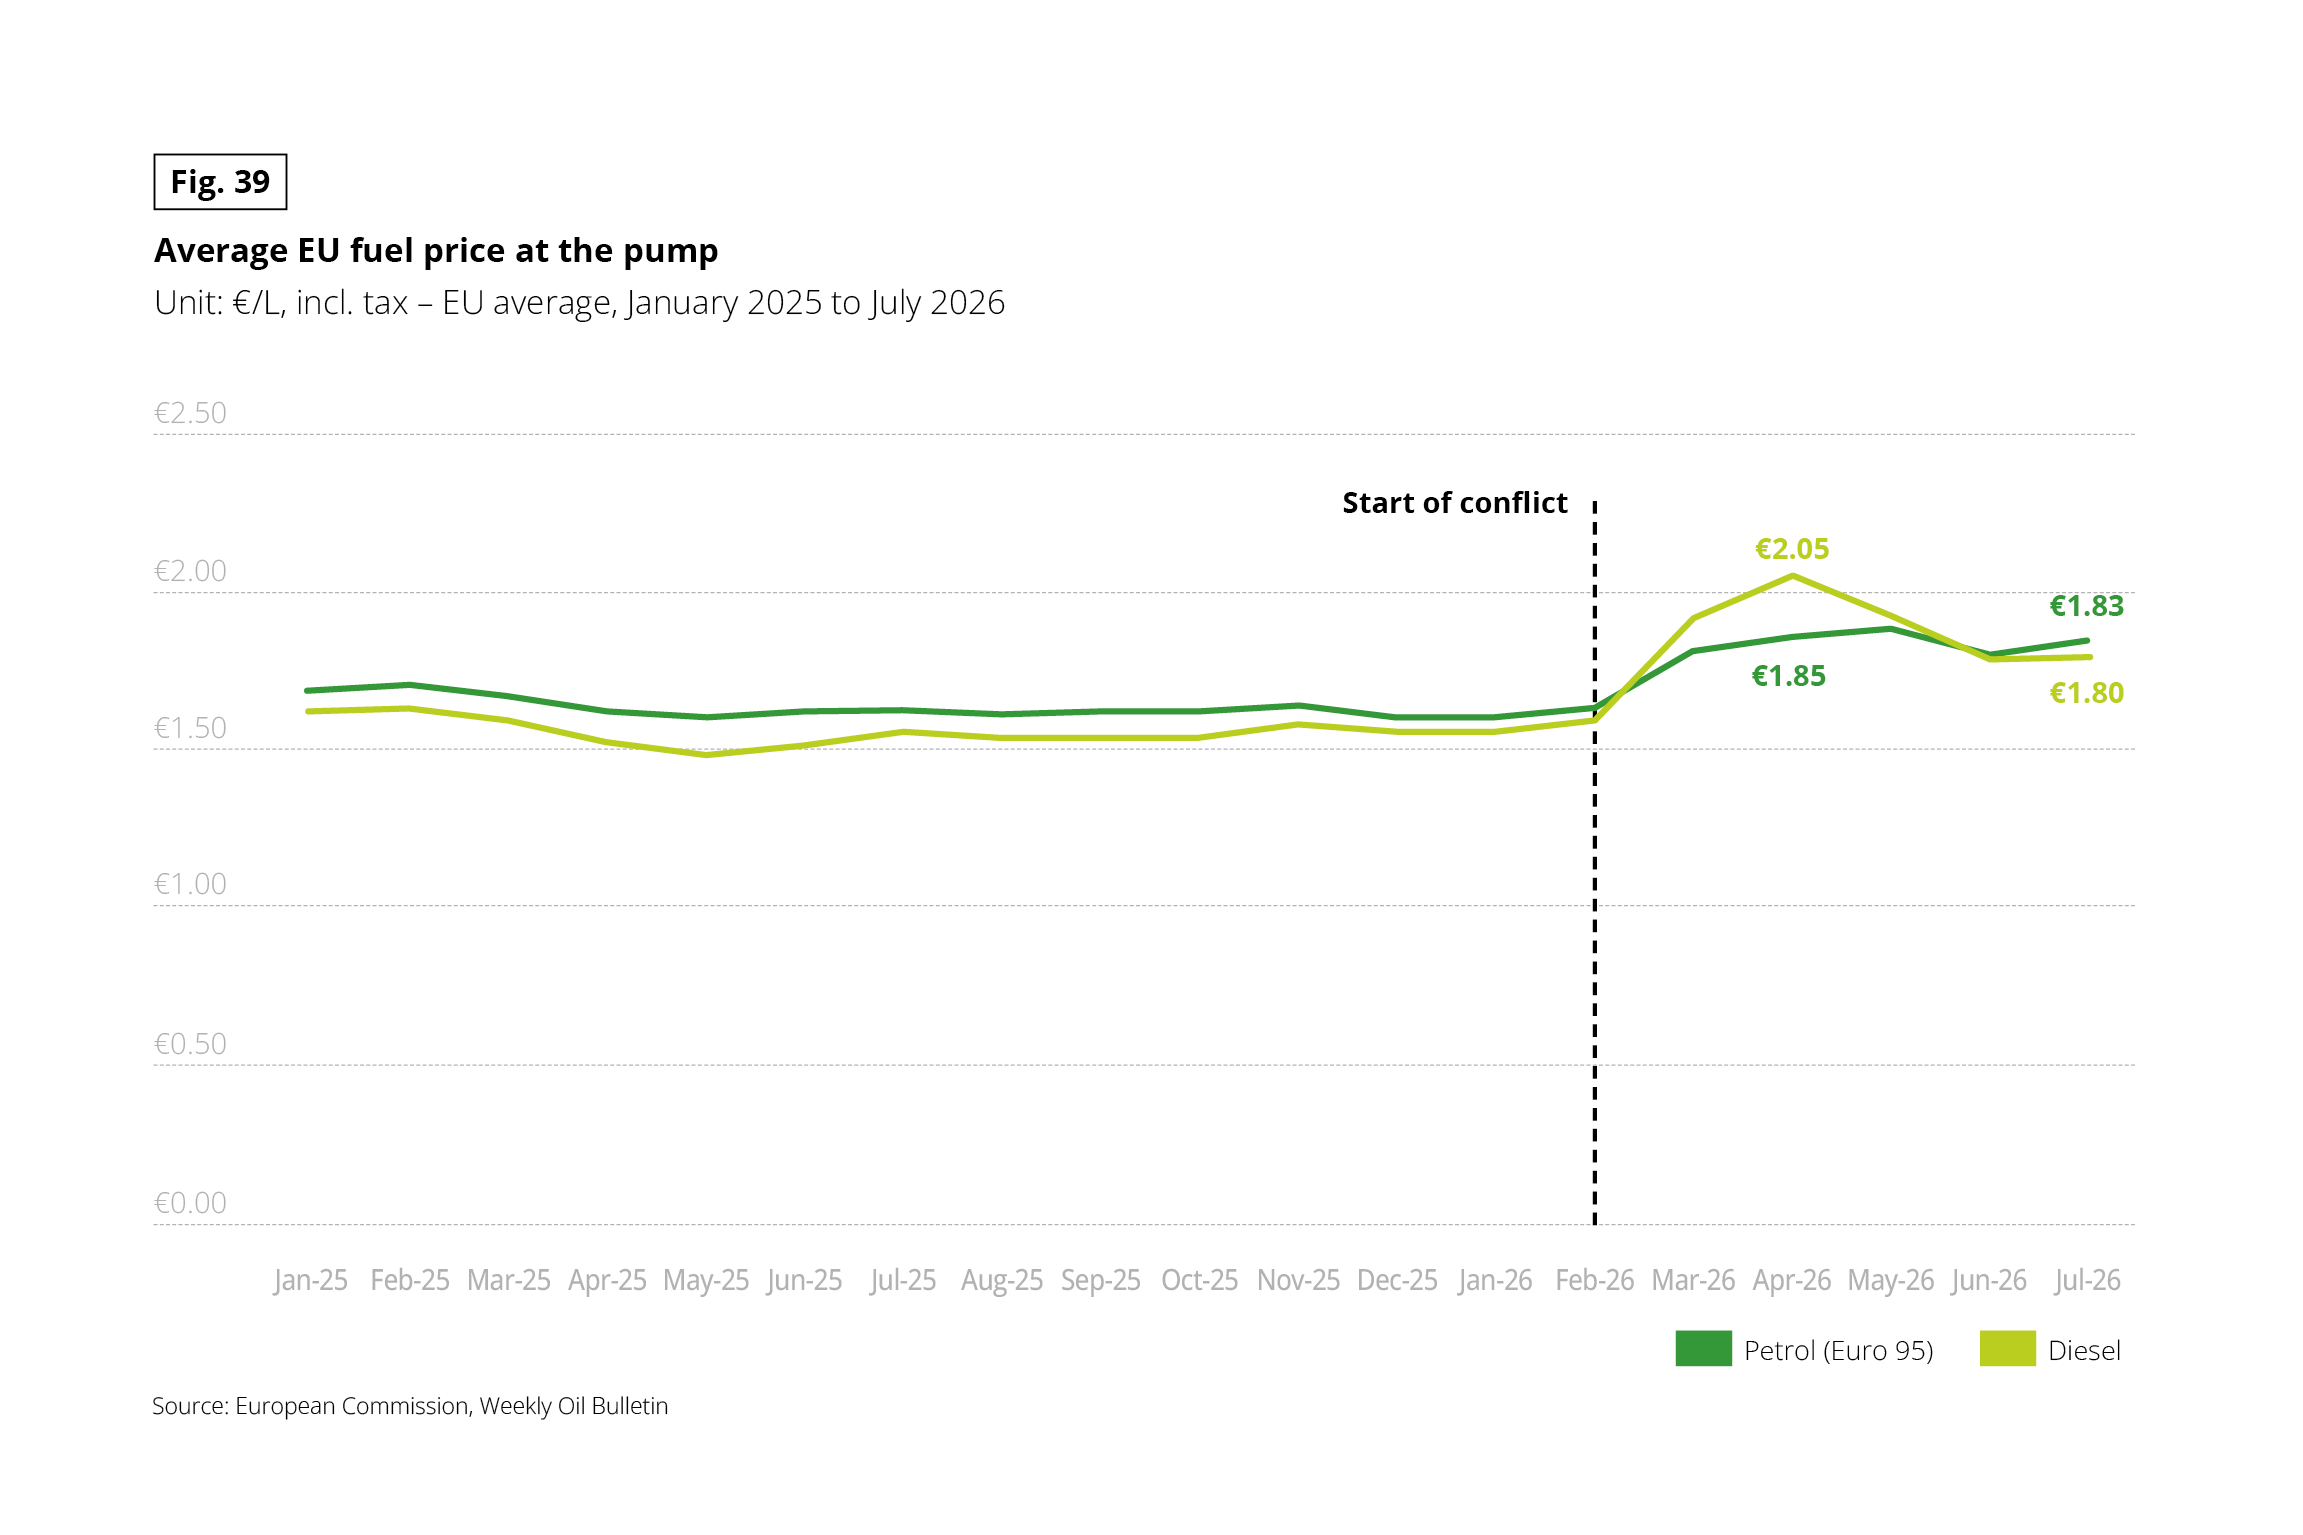 Line chart with two series: petrol (Euro 95) and diesel. Unit: euros per litre, including tax. EU average, monthly, from January 2025 to July 2026. A vertical dashed line labelled “Start of conflict” marks February 2026. Source: European Commission, Weekly Oil Bulletin.
Before the conflict, prices are stable. Petrol stays at roughly €1.60 to €1.70 per litre and diesel at roughly €1.47 to €1.63 (approximate values read from the chart), so diesel is cheaper than petrol throughout 2025 and in January 2026. After the start of the conflict, both prices rise sharply. Diesel peaks at €2.05 in April 2026. Petrol reaches €1.85 in April 2026 and stays close to that level in May. Diesel then falls back, and by June 2026 the two prices are roughly equal. In July 2026, the last month shown, petrol is at €1.83 and diesel at €1.80 per litre.
Line chart with two series: petrol (Euro 95) and diesel. Unit: euros per litre, including tax. EU average, monthly, from January 2025 to July 2026. A vertical dashed line labelled “Start of conflict” marks February 2026. Source: European Commission, Weekly Oil Bulletin.
Before the conflict, prices are stable. Petrol stays at roughly €1.60 to €1.70 per litre and diesel at roughly €1.47 to €1.63 (approximate values read from the chart), so diesel is cheaper than petrol throughout 2025 and in January 2026. After the start of the conflict, both prices rise sharply. Diesel peaks at €2.05 in April 2026. Petrol reaches €1.85 in April 2026 and stays close to that level in May. Diesel then falls back, and by June 2026 the two prices are roughly equal. In July 2026, the last month shown, petrol is at €1.83 and diesel at €1.80 per litre.
PAY LESS, DRIVE LESS
Faced with this energy crisis, motorists have adopted two primary strategies to soften the blow of rising fuel costs. First, 3 in 10 drivers focus on hunting down the lowest price, even if it means switching fuel types or finding a new service station. This is the preferred approach among Polish, German and American motorists, as well as younger demographics and residents of major cities, where fuel prices are typically higher.
Fig. 40 – Adjustment implemented in the last 6 months due to fuel prices: switching gas stations or fuel (% by country)
Download this infographic for your presentations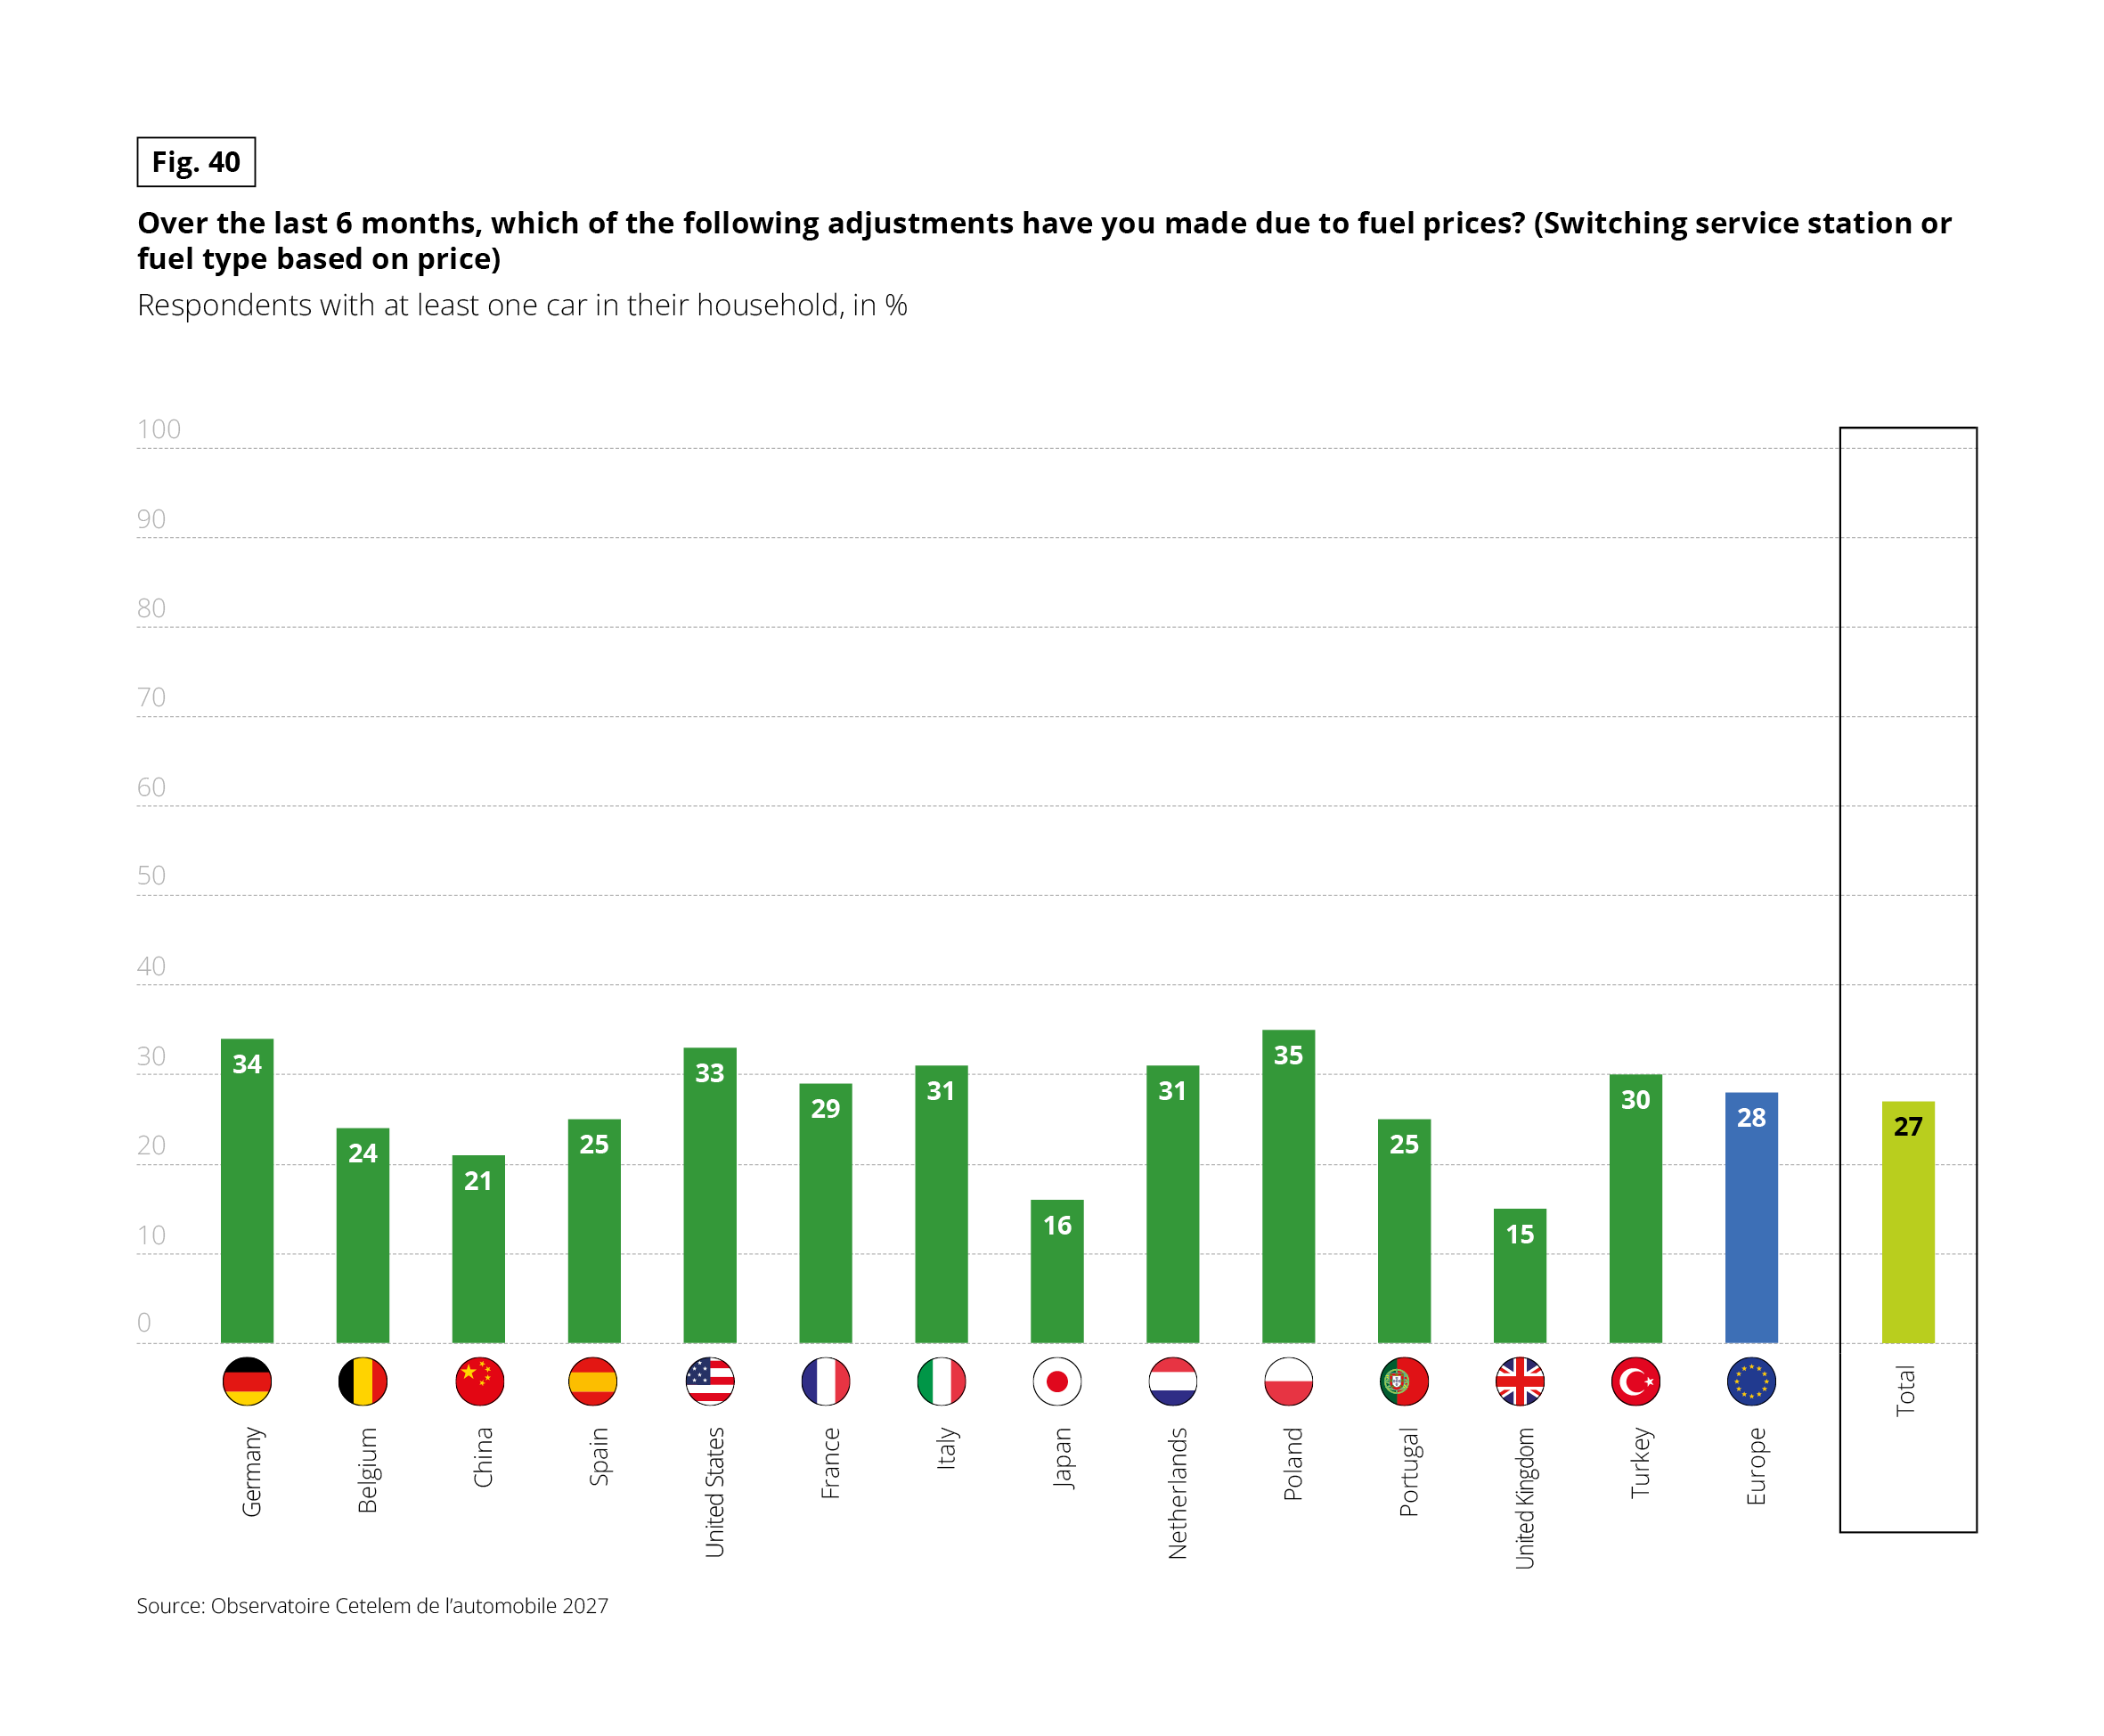 Vertical bar chart. Question: “Over the last 6 months, which of the following adjustments have you made due to fuel prices? (Switching service station or fuel type based on price)” Base: respondents with at least one car in their household, in %. Source: Observatoire Cetelem de l’automobile 2027.
Across all countries combined, 27% made this adjustment. Poland is the highest (35%) and the United Kingdom the lowest (15%).
Data by country: Germany 34%, Belgium 24%, China 21%, Spain 25%, United States 33%, France 29%, Italy 31%, Japan 16%, Netherlands 31%, Poland 35%, Portugal 25%, United Kingdom 15%, Turkey 30%. The European average is 28%. The total is 27%.
Vertical bar chart. Question: “Over the last 6 months, which of the following adjustments have you made due to fuel prices? (Switching service station or fuel type based on price)” Base: respondents with at least one car in their household, in %. Source: Observatoire Cetelem de l’automobile 2027.
Across all countries combined, 27% made this adjustment. Poland is the highest (35%) and the United Kingdom the lowest (15%).
Data by country: Germany 34%, Belgium 24%, China 21%, Spain 25%, United States 33%, France 29%, Italy 31%, Japan 16%, Netherlands 31%, Poland 35%, Portugal 25%, United Kingdom 15%, Turkey 30%. The European average is 28%. The total is 27%.
The alternative strategy sees 4 in 10 motorists cutting back on mileage to focus exclusively on essential journeys. Italian, French and Turkish drivers lead the way in road-frugality, in stark contrast to ever-steadfast Japanese motorists.
Fig. 41 – Adjustment implemented in the last 6 months due to fuel prices: reduce non-essential trips (% by country)
Download this infographic for your presentations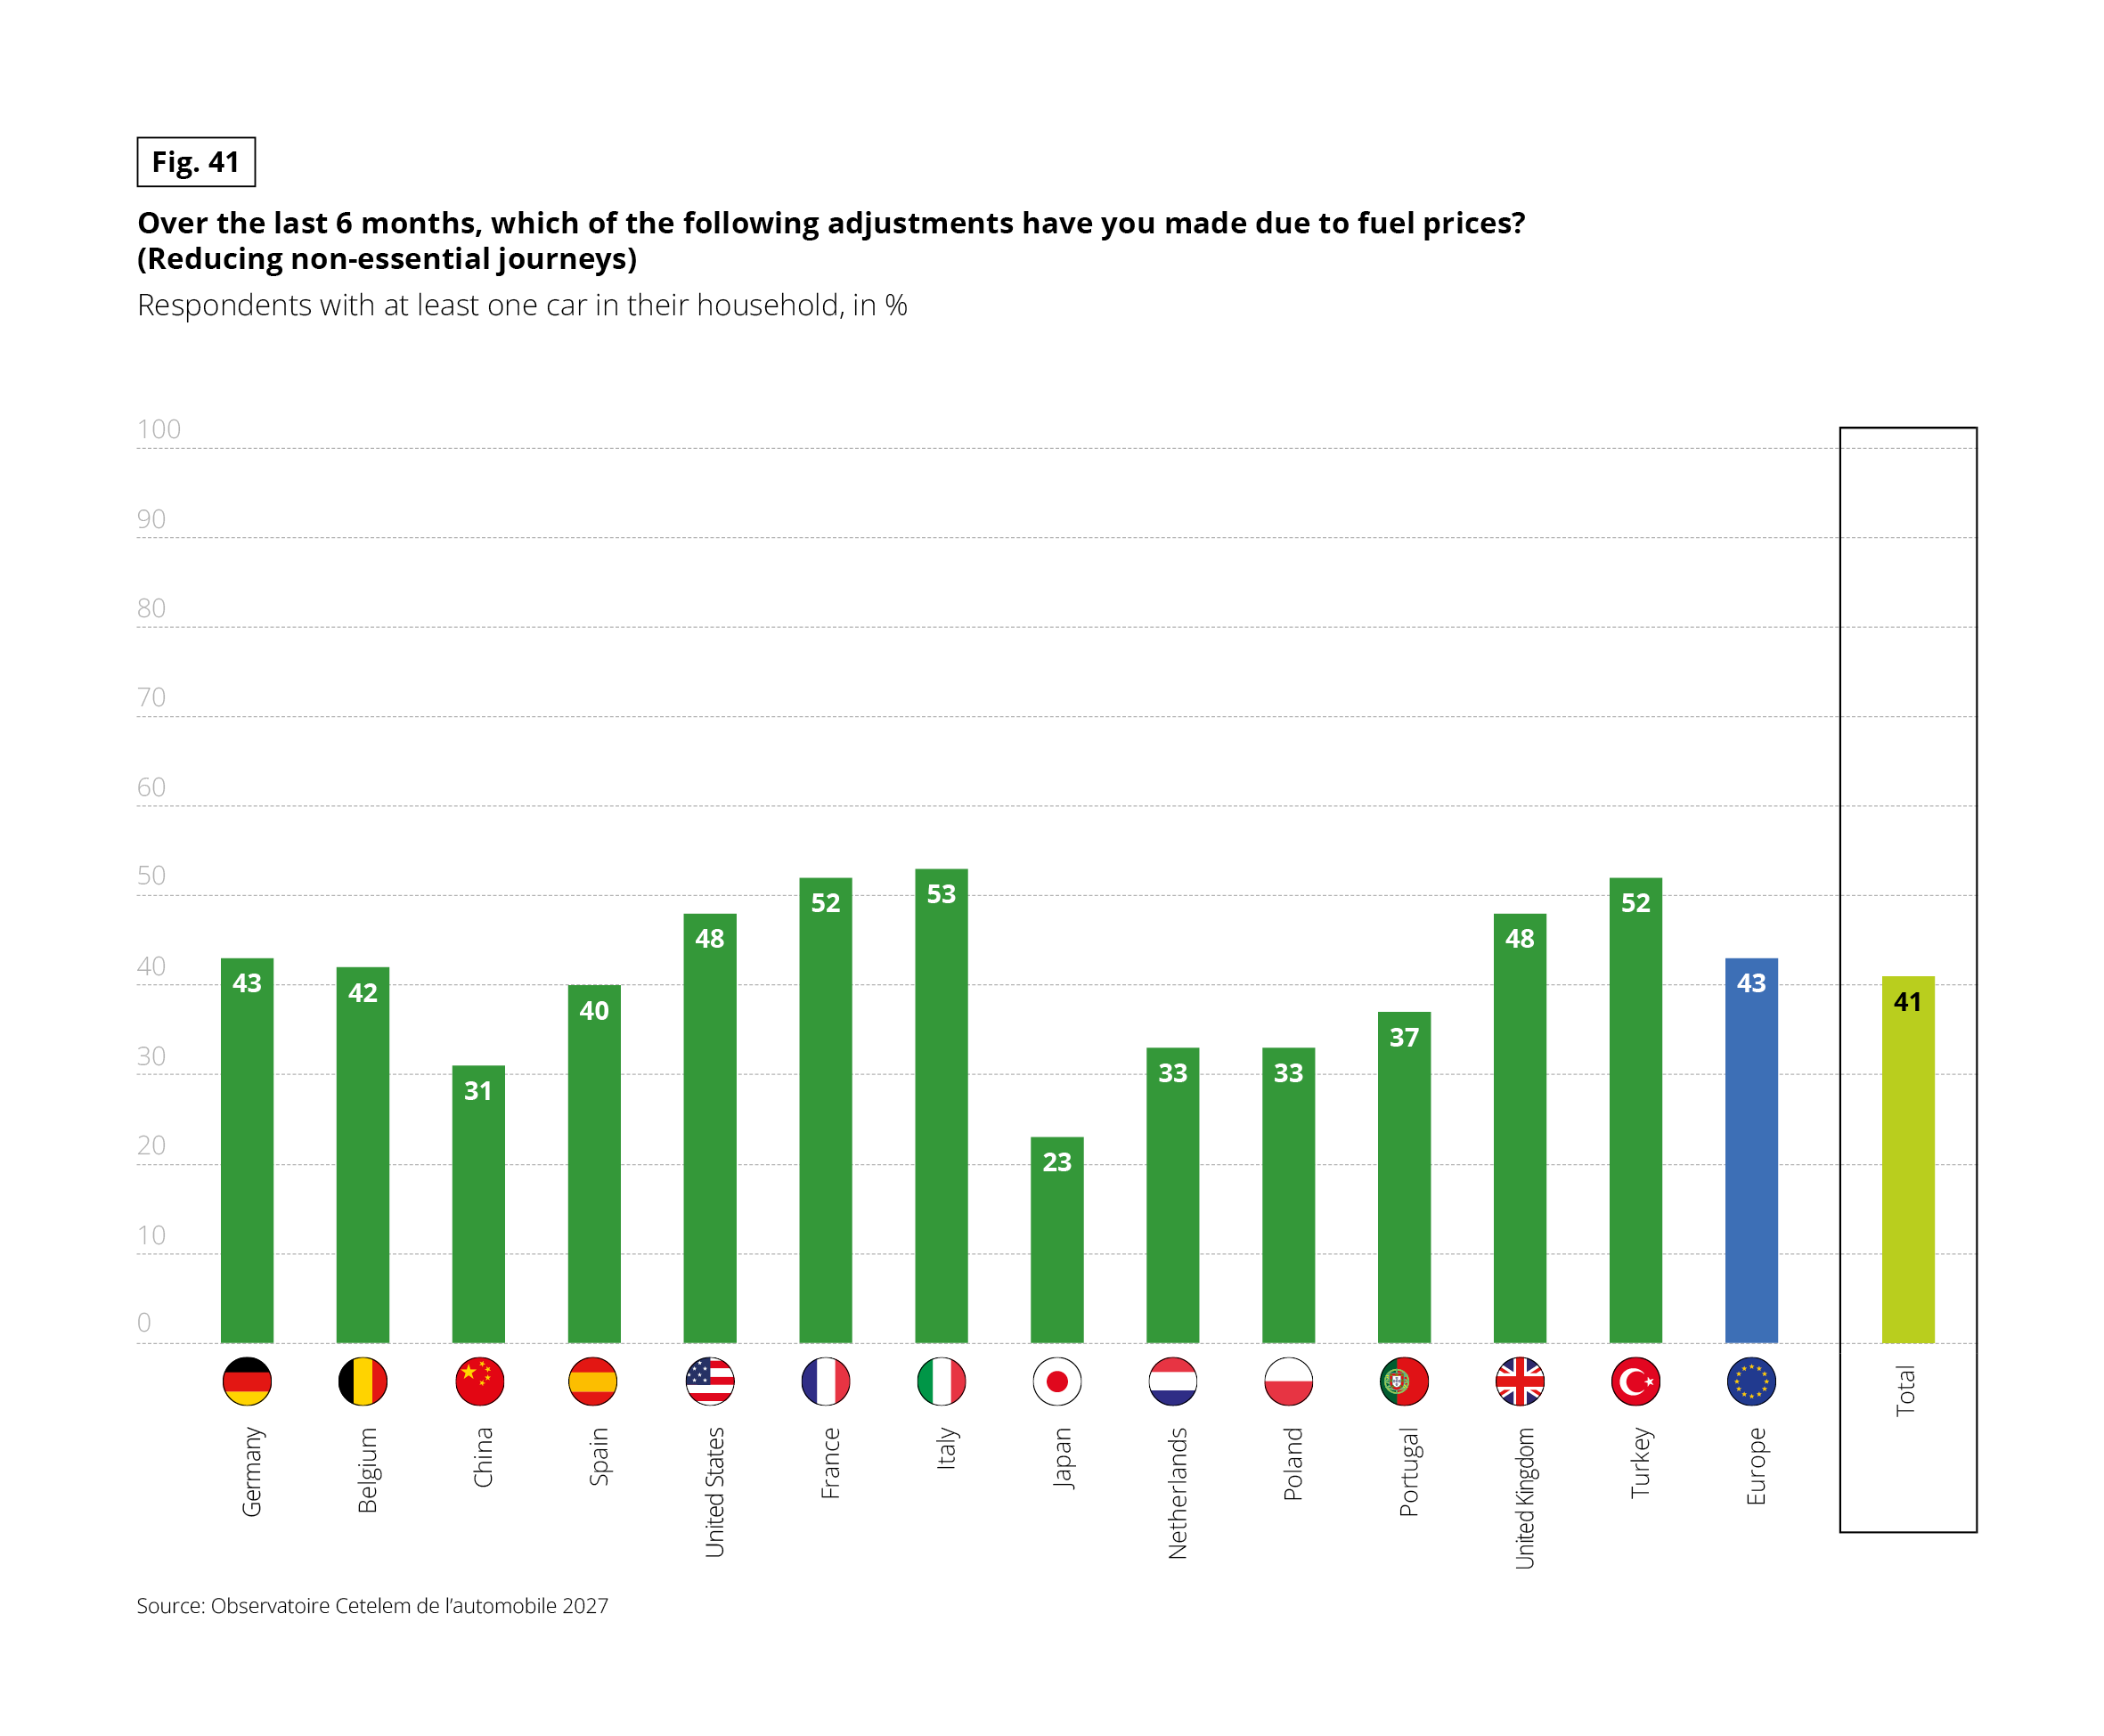 Vertical bar chart. Question: “Over the last 6 months, which of the following adjustments have you made due to fuel prices? (Reducing non-essential journeys)” Base: respondents with at least one car in their household, in %. Source: Observatoire Cetelem de l’automobile 2027.
Across all countries combined, 41% reduced non-essential journeys. Italy is the highest (53%) and Japan the lowest (23%).
Data by country: Germany 43%, Belgium 42%, China 31%, Spain 40%, United States 48%, France 52%, Italy 53%, Japan 23%, Netherlands 33%, Poland 33%, Portugal 37%, United Kingdom 48%, Turkey 52%. The European average is 43%. The total is 41%.
Compared with Fig. 40, reducing journeys (41%) is more common overall than switching station or fuel type (27%).
Vertical bar chart. Question: “Over the last 6 months, which of the following adjustments have you made due to fuel prices? (Reducing non-essential journeys)” Base: respondents with at least one car in their household, in %. Source: Observatoire Cetelem de l’automobile 2027.
Across all countries combined, 41% reduced non-essential journeys. Italy is the highest (53%) and Japan the lowest (23%).
Data by country: Germany 43%, Belgium 42%, China 31%, Spain 40%, United States 48%, France 52%, Italy 53%, Japan 23%, Netherlands 33%, Poland 33%, Portugal 37%, United Kingdom 48%, Turkey 52%. The European average is 43%. The total is 41%.
Compared with Fig. 40, reducing journeys (41%) is more common overall than switching station or fuel type (27%).
KEY FIGURES
- 1 in 3 motorists intends to purchase a vehicle in the next 12 months
- 6 in 10 motorists already know the brand of their next vehicle
- 4 in 10 motorists switch brands simply out of a desire for change
- 4 in 10 motorists have bought multiple vehicles from the same brand
- 6 in 10 motorists will not switch car brands for their next purchase
- Price emerges as the primary decision factor for 4 in 10 new-car buyers and more than 5 in 10 second-hand buyers
- 6 in 10 consumers have walked away from a car purchase due to its high price tag
- 6 in 10 motorists prefer a cheaper foreign brand over an equivalent domestic model
- 1 in 5 drivers would alter neither their vehicle nor their habits, regardless of fuel price increases