Energy transition, a genuine intention, but hindered

Access to energy renovation: An issue that goes beyond the sole question of cost
Despite financial reason being an important reason for Europeans, 42% of them are abandoning their renovation project due to non-financial reasons only. (Fig.13 et Fig.14)
Overall reasons for abandoning energy efficiency work
Fig 13 – Reasons for abandoning energy renovation work
Download this infographic for your presentations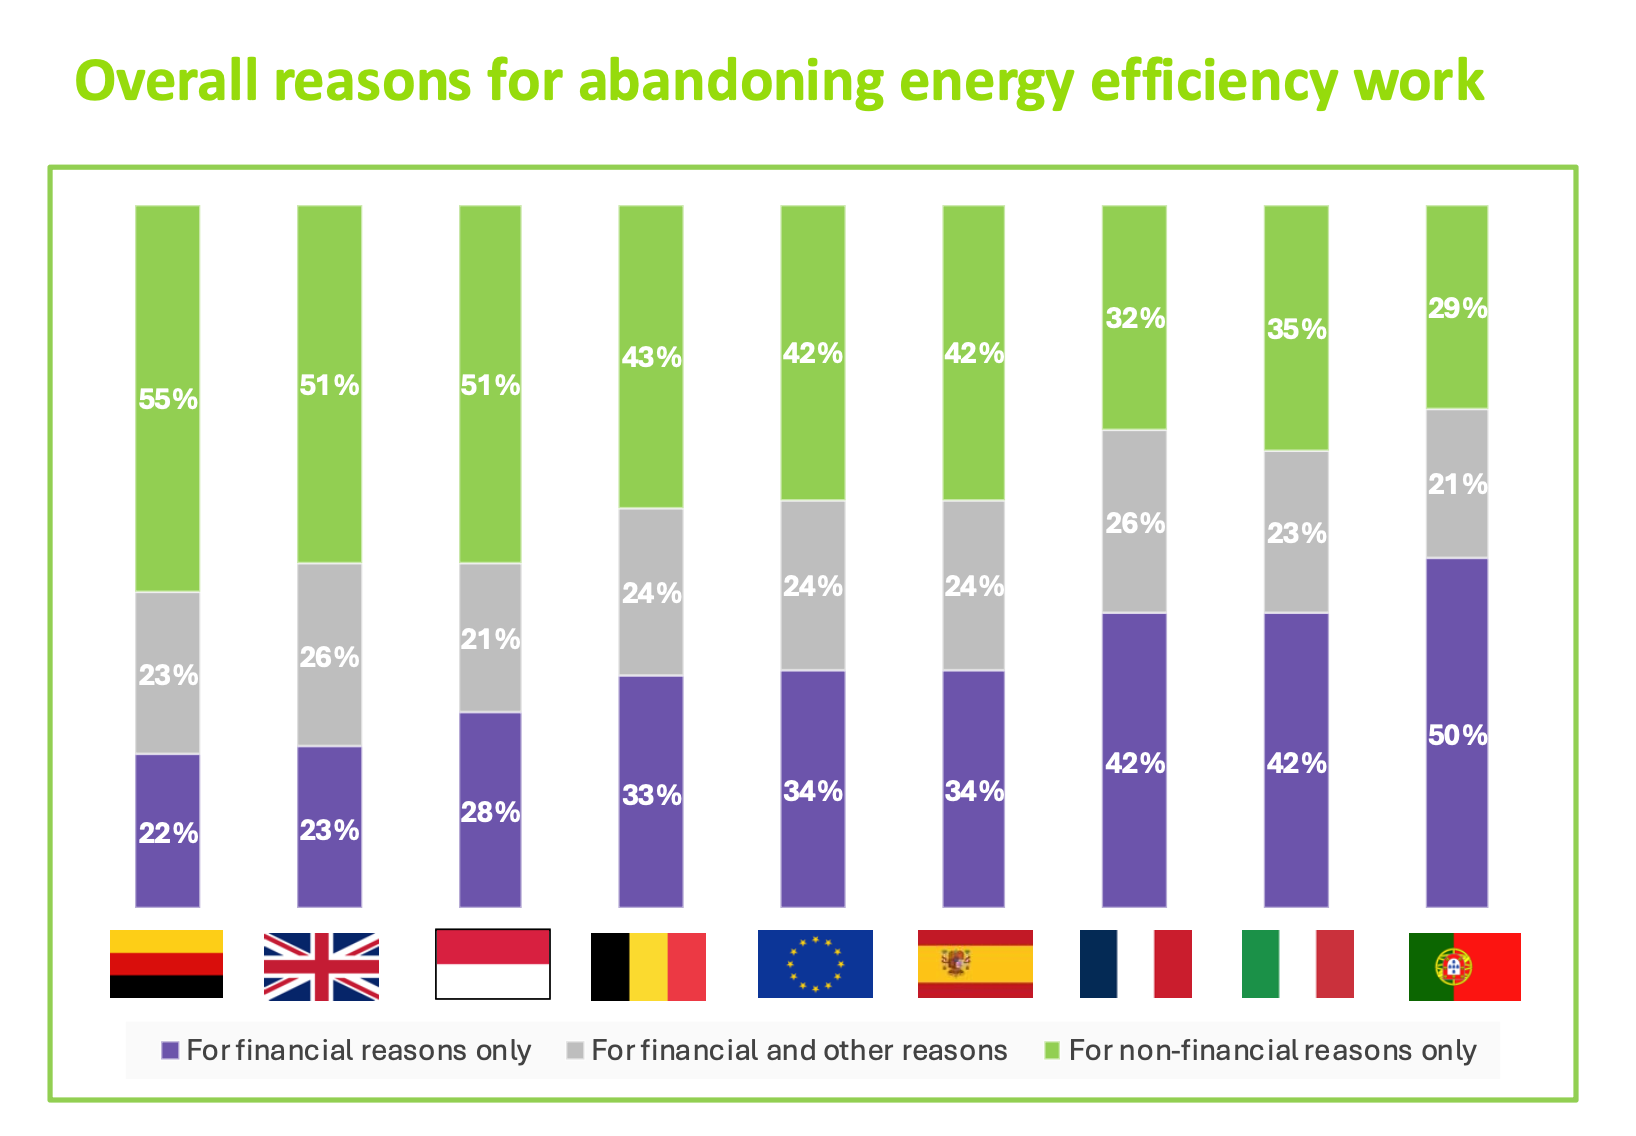 The image presents vertical bars for several European countries, indicating the main reasons for abandoning energy renovation work. Three categories appear: purple: only financial reasons, gray: financial reasons combined with others, light green: only non-financial reasons.
The data indicated is:
Germany: 22% financial reasons, 23% combined, 55% non-financial.
United Kingdom: 23%, 26%, 51%.
Netherlands: 28%, 21%, 51%.
Belgium: 33%, 24%, 43%.
Europe: 34%, 24%, 42%.
Spain: 34%, 24%, 42%.
France: 42%, 26%, 32%.
Italy: 42%, 23%, 35%.
Portugal: 50%, 21%, 29%.
The graph shows that pure financial reasons are an important reason for abandonment in several countries, but non-financial reasons are also frequent.
The image presents vertical bars for several European countries, indicating the main reasons for abandoning energy renovation work. Three categories appear: purple: only financial reasons, gray: financial reasons combined with others, light green: only non-financial reasons.
The data indicated is:
Germany: 22% financial reasons, 23% combined, 55% non-financial.
United Kingdom: 23%, 26%, 51%.
Netherlands: 28%, 21%, 51%.
Belgium: 33%, 24%, 43%.
Europe: 34%, 24%, 42%.
Spain: 34%, 24%, 42%.
France: 42%, 26%, 32%.
Italy: 42%, 23%, 35%.
Portugal: 50%, 21%, 29%.
The graph shows that pure financial reasons are an important reason for abandonment in several countries, but non-financial reasons are also frequent.
Detailed reasons for abandoning energy efficiency work
Fig 14 – Details of reasons for abandoning energy renovation
Download this infographic for your presentations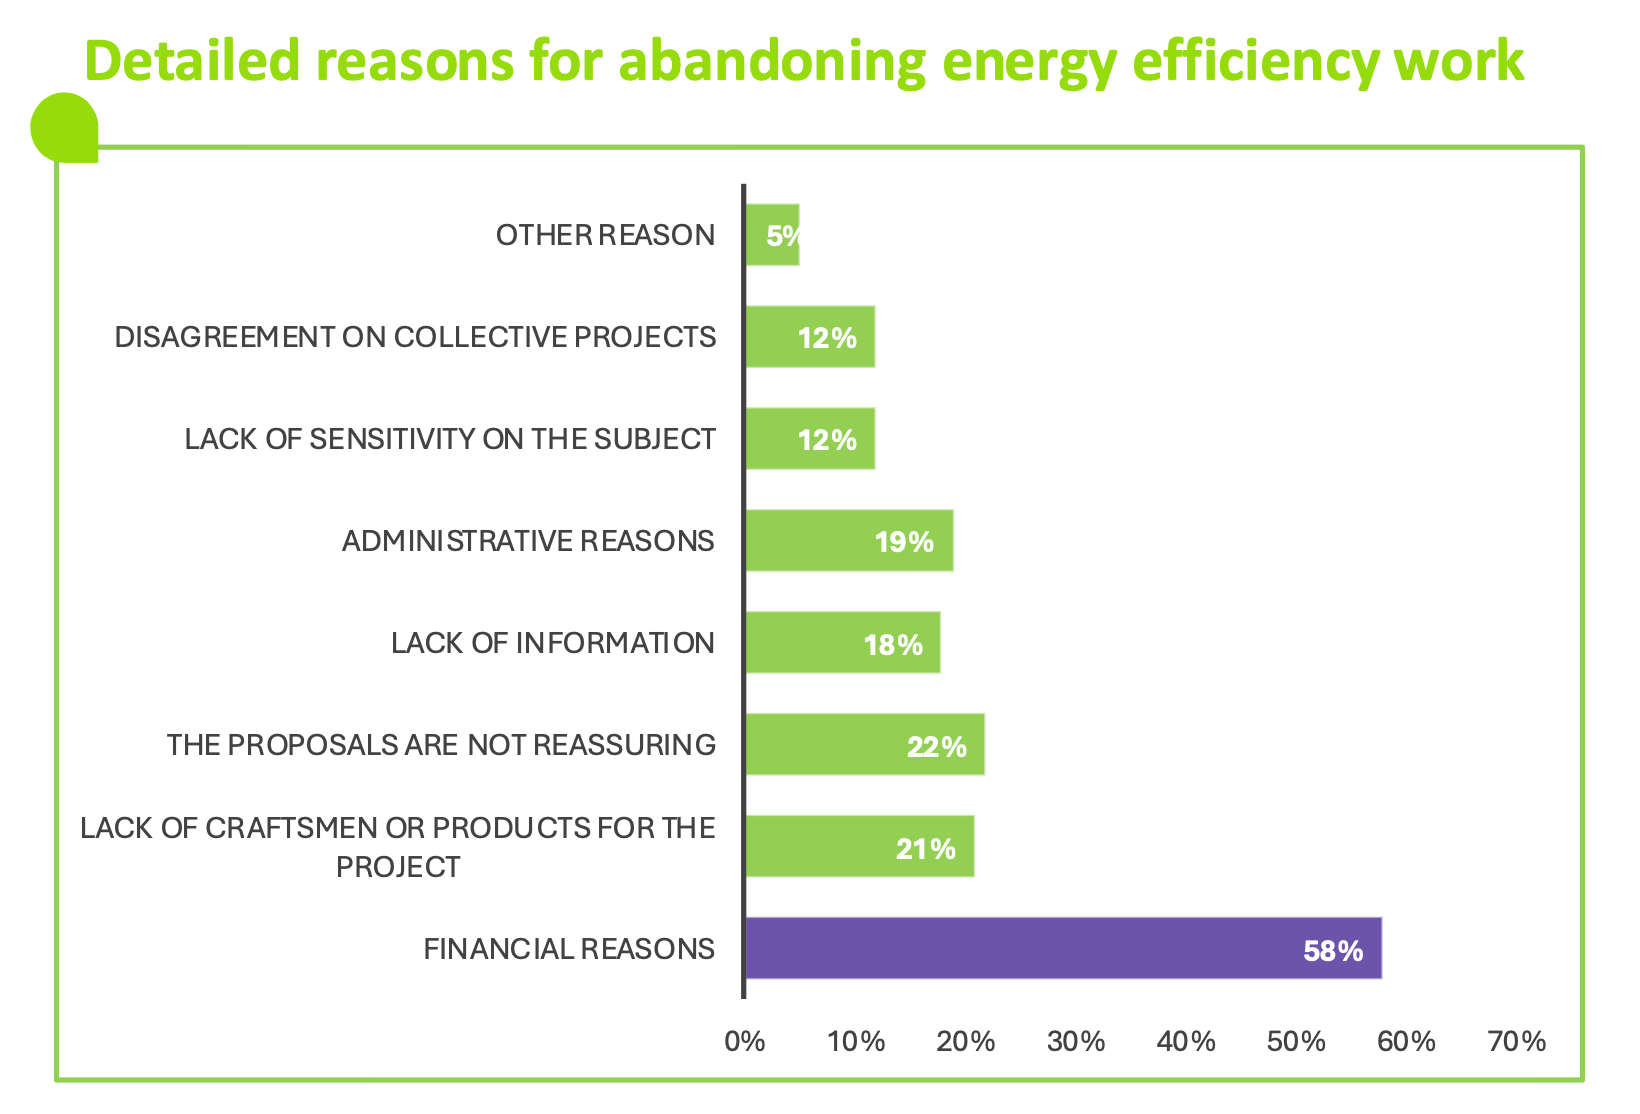 The visual presents a horizontal histogram detailing the specific reasons for abandoning energy renovation work.
The data indicated is:
Other reason: 5%.
Lack of agreement on projects: 12%.
Lack of sensitivity to the subject: 12%.
Administrative reasons: 19%.
Lack of information: 18%.
Proposals considered unconvincing: 22%.
Lack of craftsmen or products for the project: 21%.
Financial reasons: 58%.
The most frequent reason is far and away the financial factor, significantly higher than other reasons.
The visual presents a horizontal histogram detailing the specific reasons for abandoning energy renovation work.
The data indicated is:
Other reason: 5%.
Lack of agreement on projects: 12%.
Lack of sensitivity to the subject: 12%.
Administrative reasons: 19%.
Lack of information: 18%.
Proposals considered unconvincing: 22%.
Lack of craftsmen or products for the project: 21%.
Financial reasons: 58%.
The most frequent reason is far and away the financial factor, significantly higher than other reasons.
The housing budget: A financial burden for one household out of three
- For 33% of Europeans, the housing budget situation is difficult (vs. 35% in 2024). (Fig.15)
Fig 15 – Perception of budget situation related to housing
Download this infographic for your presentations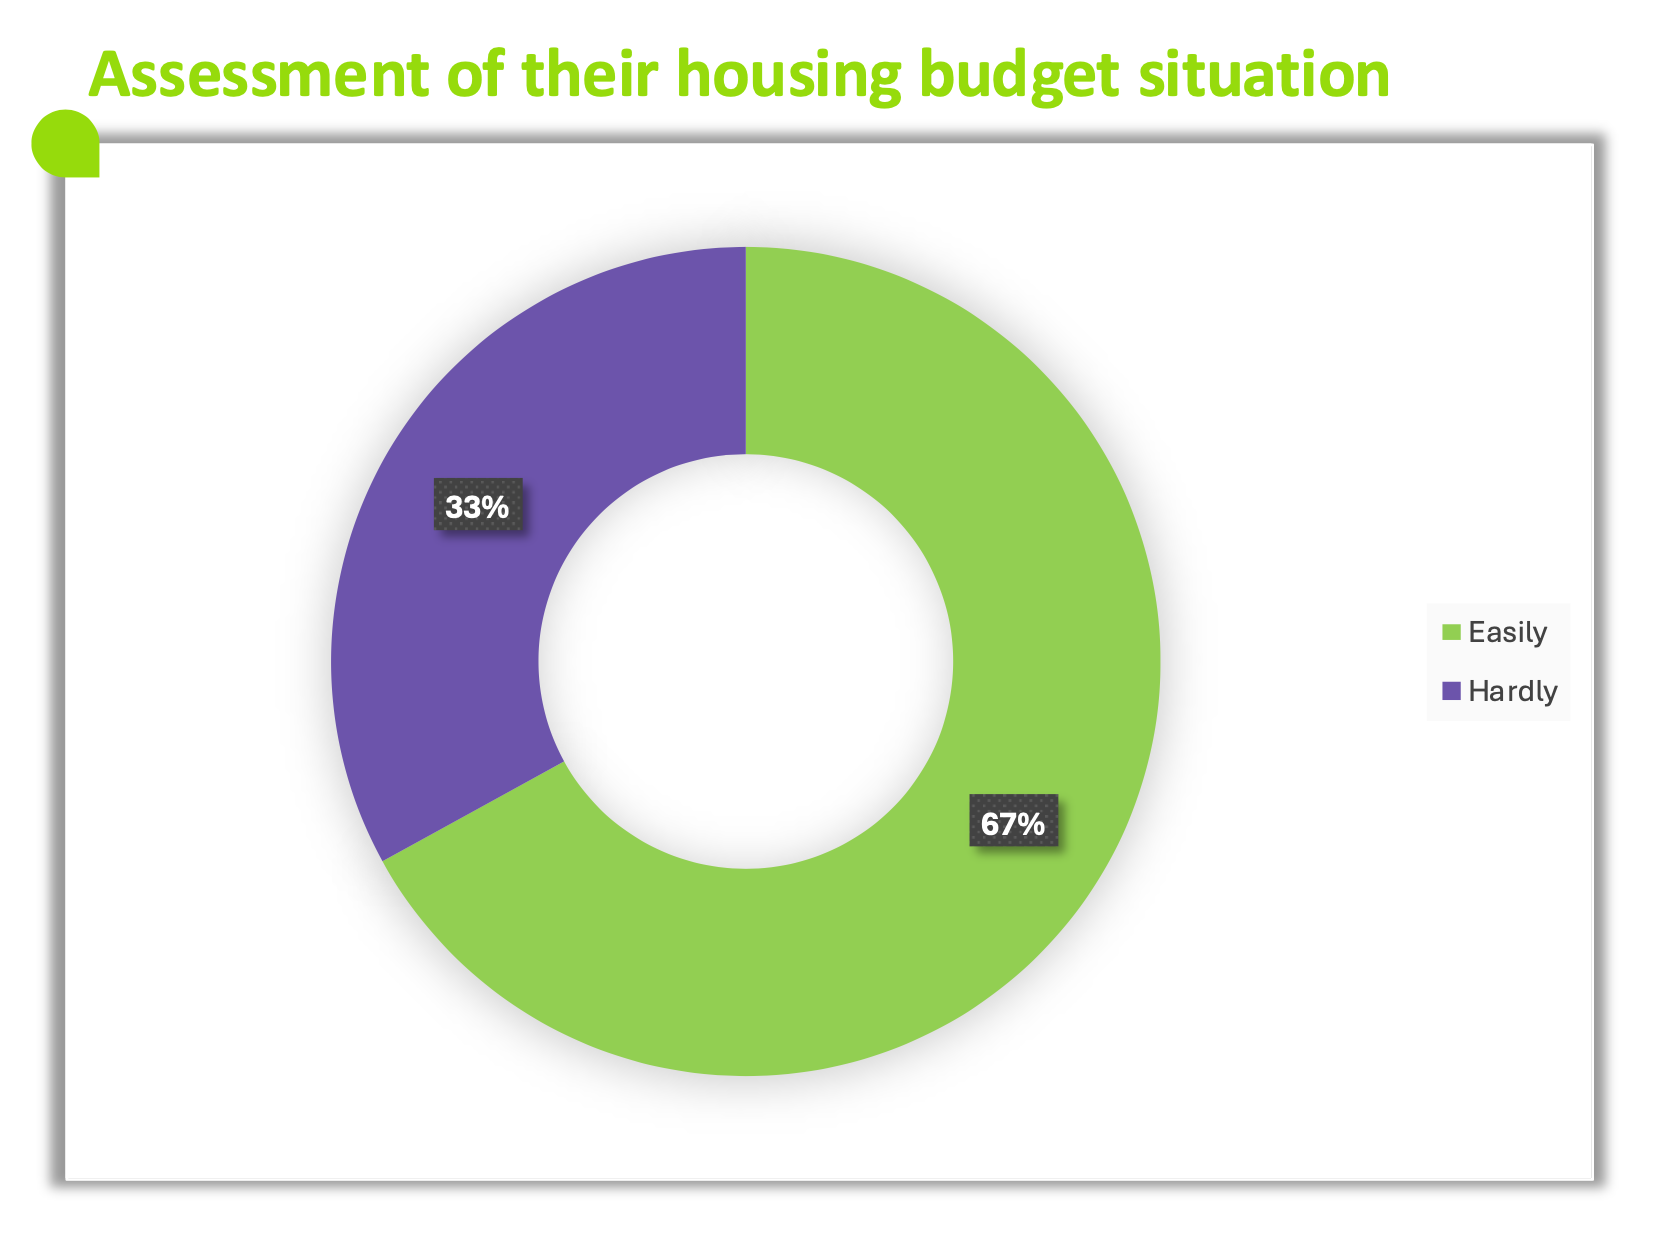 The infographic shows a ring diagram showing how respondents evaluate their budget situation regarding housing.
The data presented is:
Easy: 67%.
Difficult: 33%.
The infographic highlights that two-thirds of respondents consider their budget situation easy, while one-third considers it difficult.
The infographic shows a ring diagram showing how respondents evaluate their budget situation regarding housing.
The data presented is:
Easy: 67%.
Difficult: 33%.
The infographic highlights that two-thirds of respondents consider their budget situation easy, while one-third considers it difficult.
Public aid: Decisive but difficult to access
- 43% of Europeans say that public aid is understandable but difficult to implement. (Fig.16)
- 69% of Europeans say that state or public bodies cover between 10% and 50% of expenses. (Fig.17)
Fig 16 – Perception of public financial aid
Download this infographic for your presentations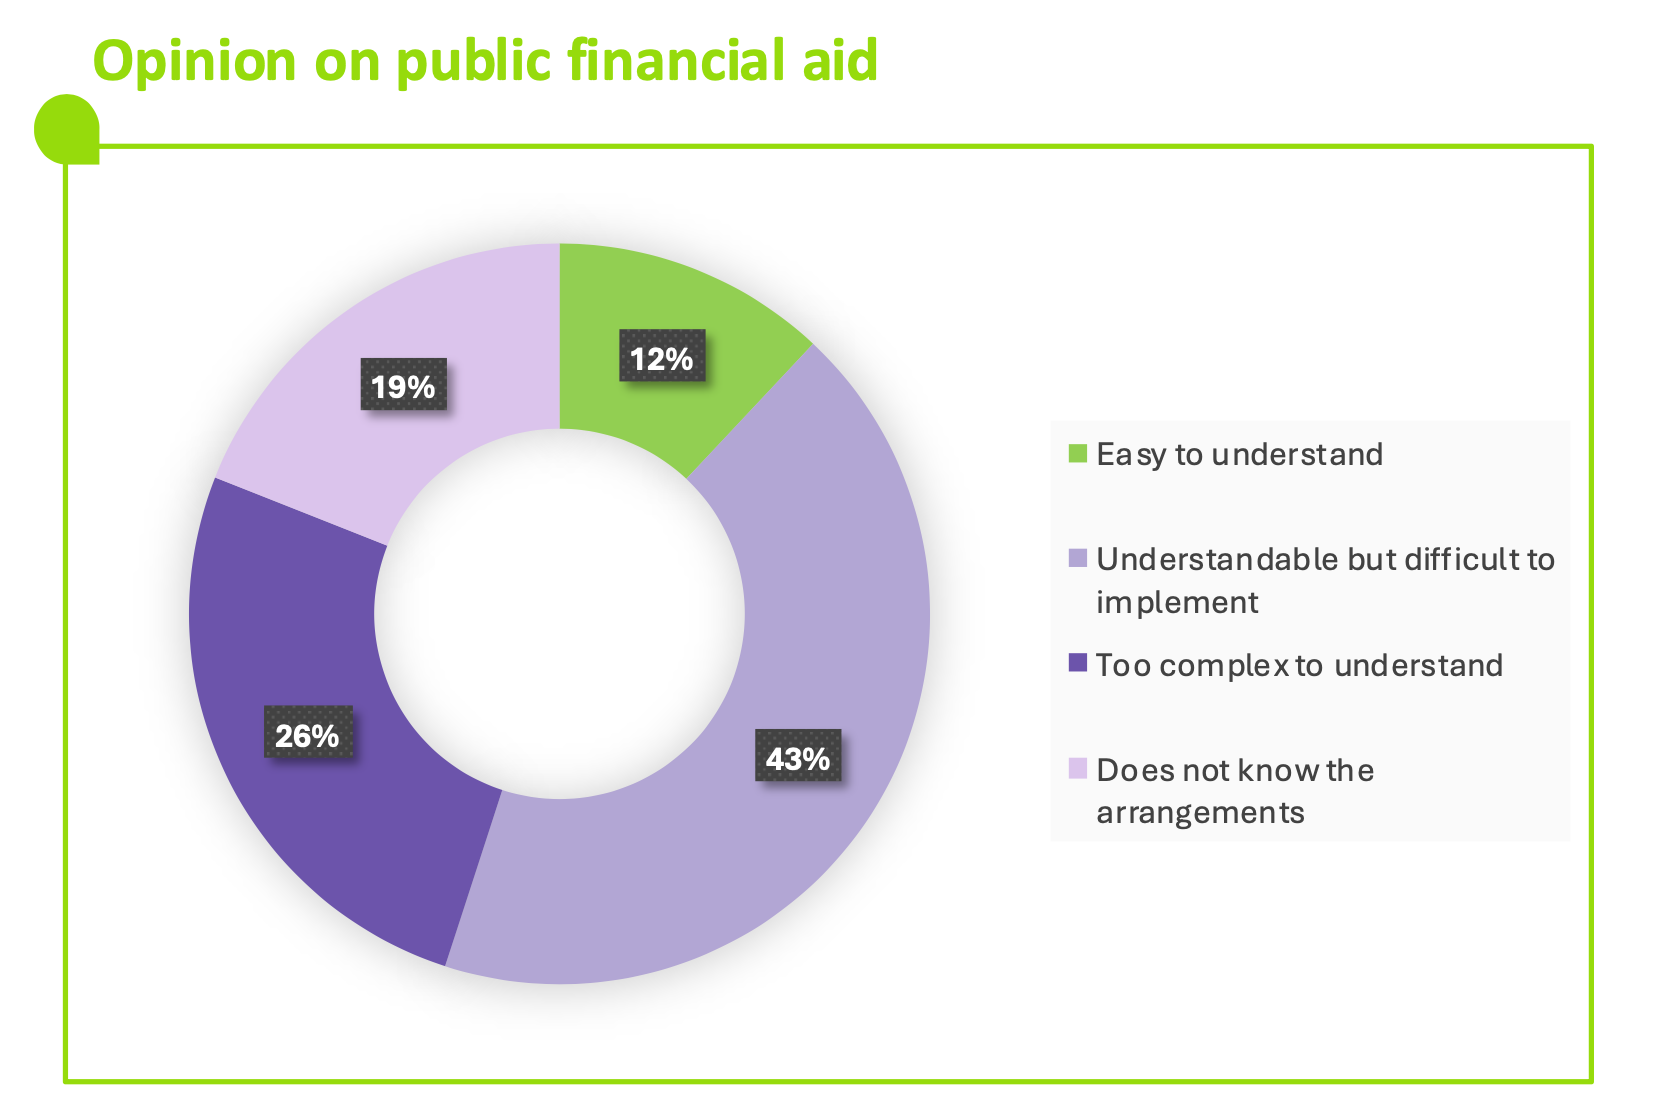 The infographic presents a ring diagram distributing four opinions concerning the understanding of public financial aid.
The data displayed is:
Easy to understand: 12%.
Understandable but difficult to implement: 43%.
Too complex to understand: 26%.
Does not know the devices: 19%.
The distribution indicates that the majority considers the aid understandable but difficult to apply, while a significant part considers the devices complex or unknown.
The infographic presents a ring diagram distributing four opinions concerning the understanding of public financial aid.
The data displayed is:
Easy to understand: 12%.
Understandable but difficult to implement: 43%.
Too complex to understand: 26%.
Does not know the devices: 19%.
The distribution indicates that the majority considers the aid understandable but difficult to apply, while a significant part considers the devices complex or unknown.
Fig 17 – Proportion of renovation costs covered by public aid
Download this infographic for your presentations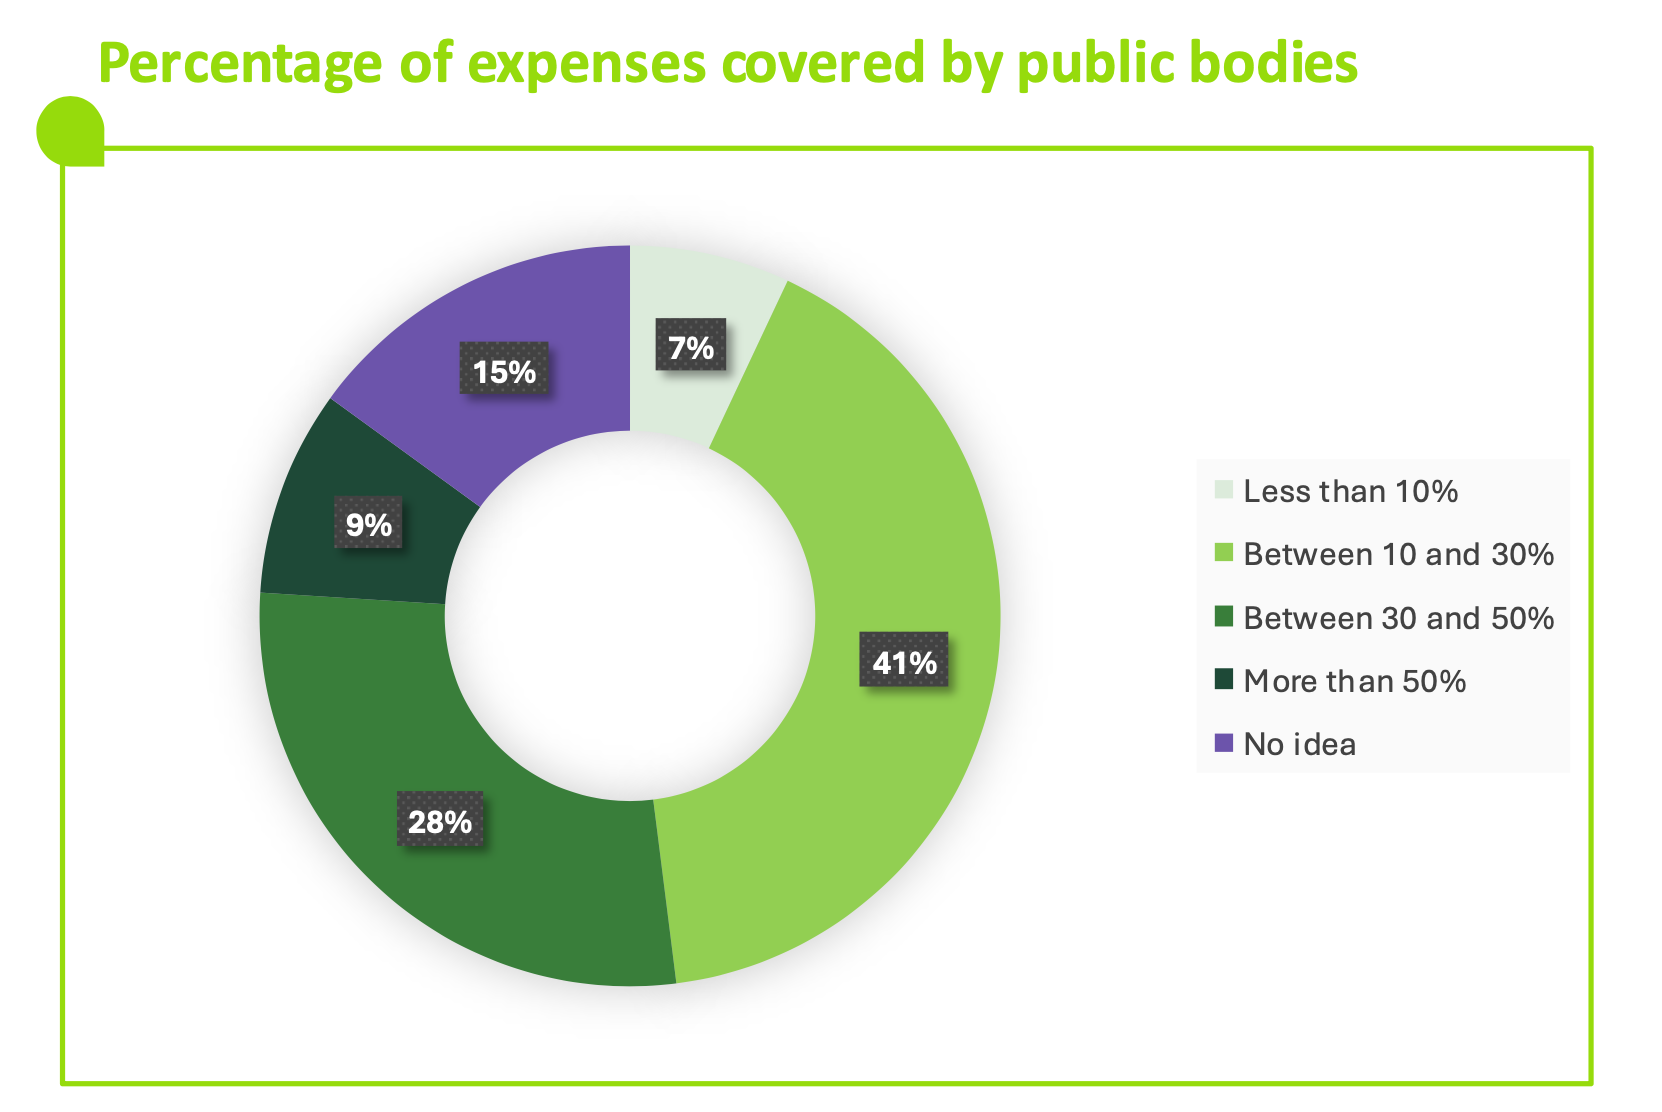 The visual presents a ring diagram indicating the estimated proportion of renovation costs covered by state or public aid.
The data displayed is:
Less than 10%: 7%.
Between 10% and 30%: 41%.
Between 30% and 50%: 28%.
More than 50%: 9%.
No idea: 15%.
The distribution shows that a majority estimates that aid covers less than 30% of costs or claims not to know the amount covered.
The visual presents a ring diagram indicating the estimated proportion of renovation costs covered by state or public aid.
The data displayed is:
Less than 10%: 7%.
Between 10% and 30%: 41%.
Between 30% and 50%: 28%.
More than 50%: 9%.
No idea: 15%.
The distribution shows that a majority estimates that aid covers less than 30% of costs or claims not to know the amount covered.
Financing: A complexity to overcome to facilitate action
- 60% of Europeans have another principal barrier to financing renovation works than interest rates. (Fig.18)
- 23% of Europeans see the difficulty to understand, identify, and evaluate offers as a main barrier to financing renovation works. (Fig.18)
Fig 18 – Obstacles to financing work
Download this infographic for your presentations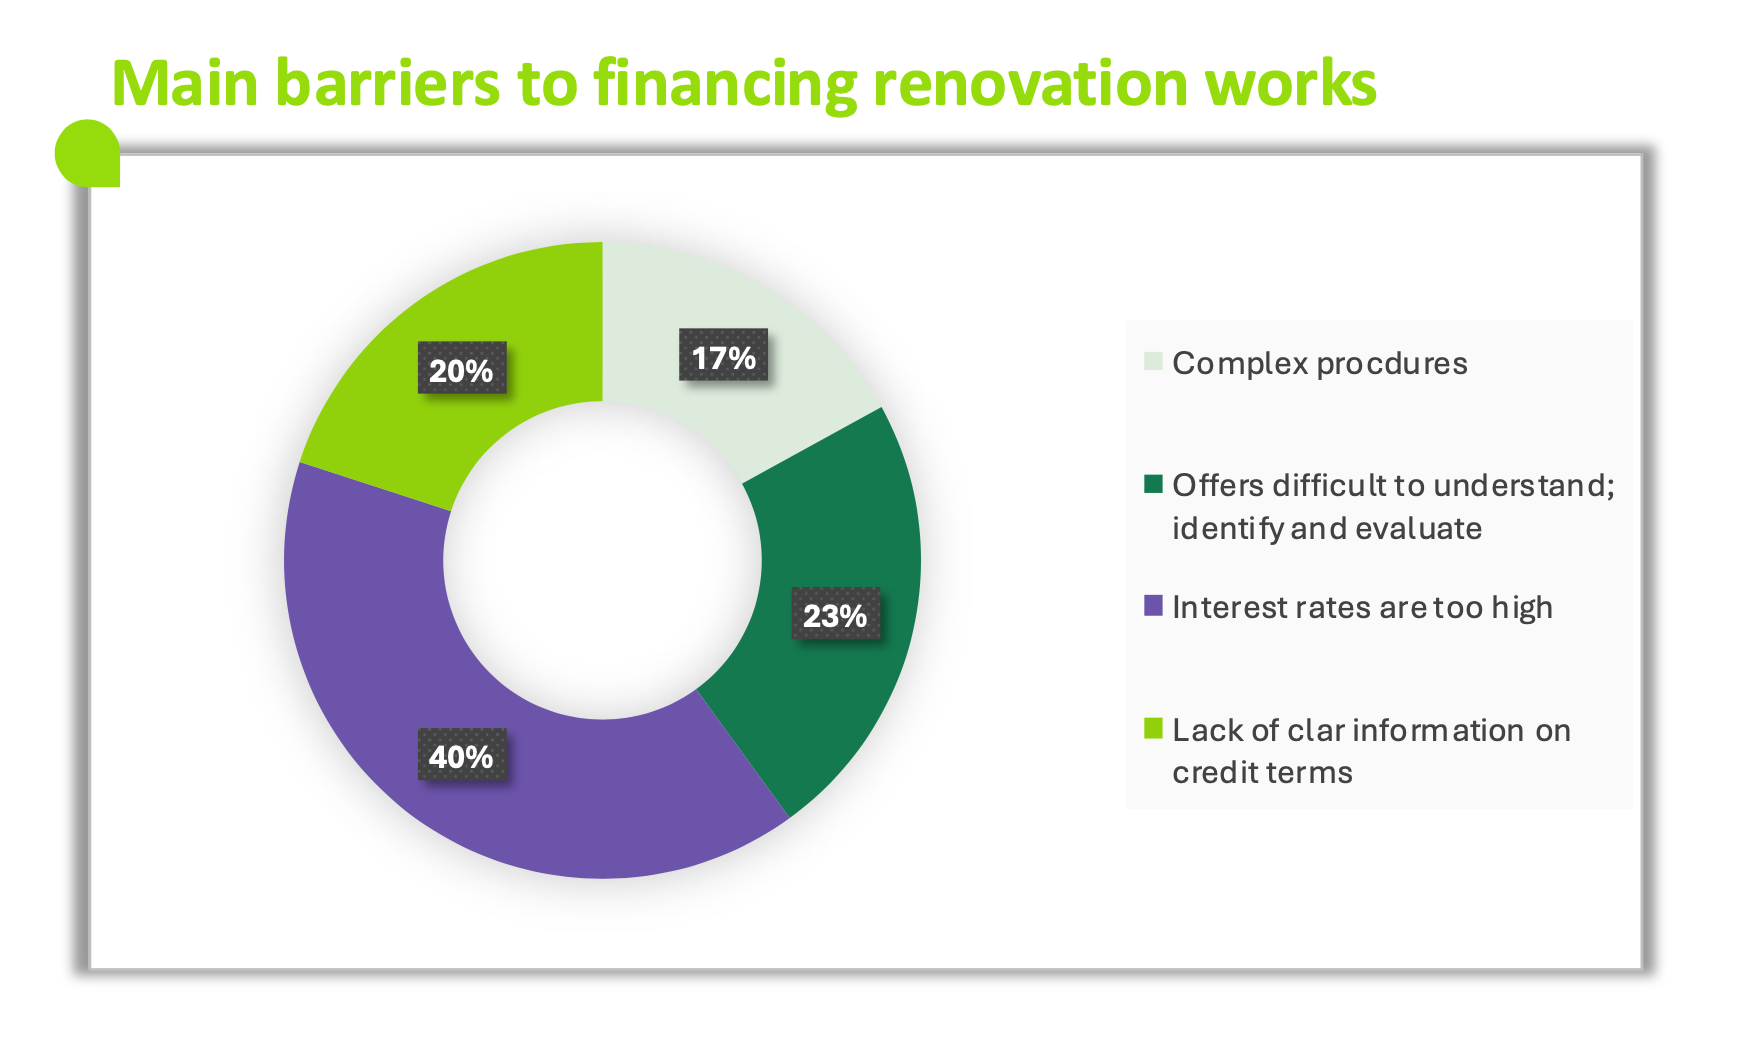 The image presents a ring diagram listing four obstacles identified for financing work.
The data displayed is:
Complex procedures: 17%.
Offers difficult to understand, identify, and evaluate: 23%.
High interest rates: 40%.
Lack of clear information on credit terms: 20%.
The most frequently cited obstacle is high interest rates, followed by the difficulty in analyzing financing offers.
The image presents a ring diagram listing four obstacles identified for financing work.
The data displayed is:
Complex procedures: 17%.
Offers difficult to understand, identify, and evaluate: 23%.
High interest rates: 40%.
Lack of clear information on credit terms: 20%.
The most frequently cited obstacle is high interest rates, followed by the difficulty in analyzing financing offers.
A quick ROI: A condition for commitment, difficult to meet
- 57% of Europeans expect profitability within 5 years for their energy renovation. (Fig.19)
- 45% of Europeans think that the cost of works is a priority criterion when deciding on renovation projects. (Fig.20)
Fig 19 – Perceived acceptable deadline for an investment to be profitable
Download this infographic for your presentations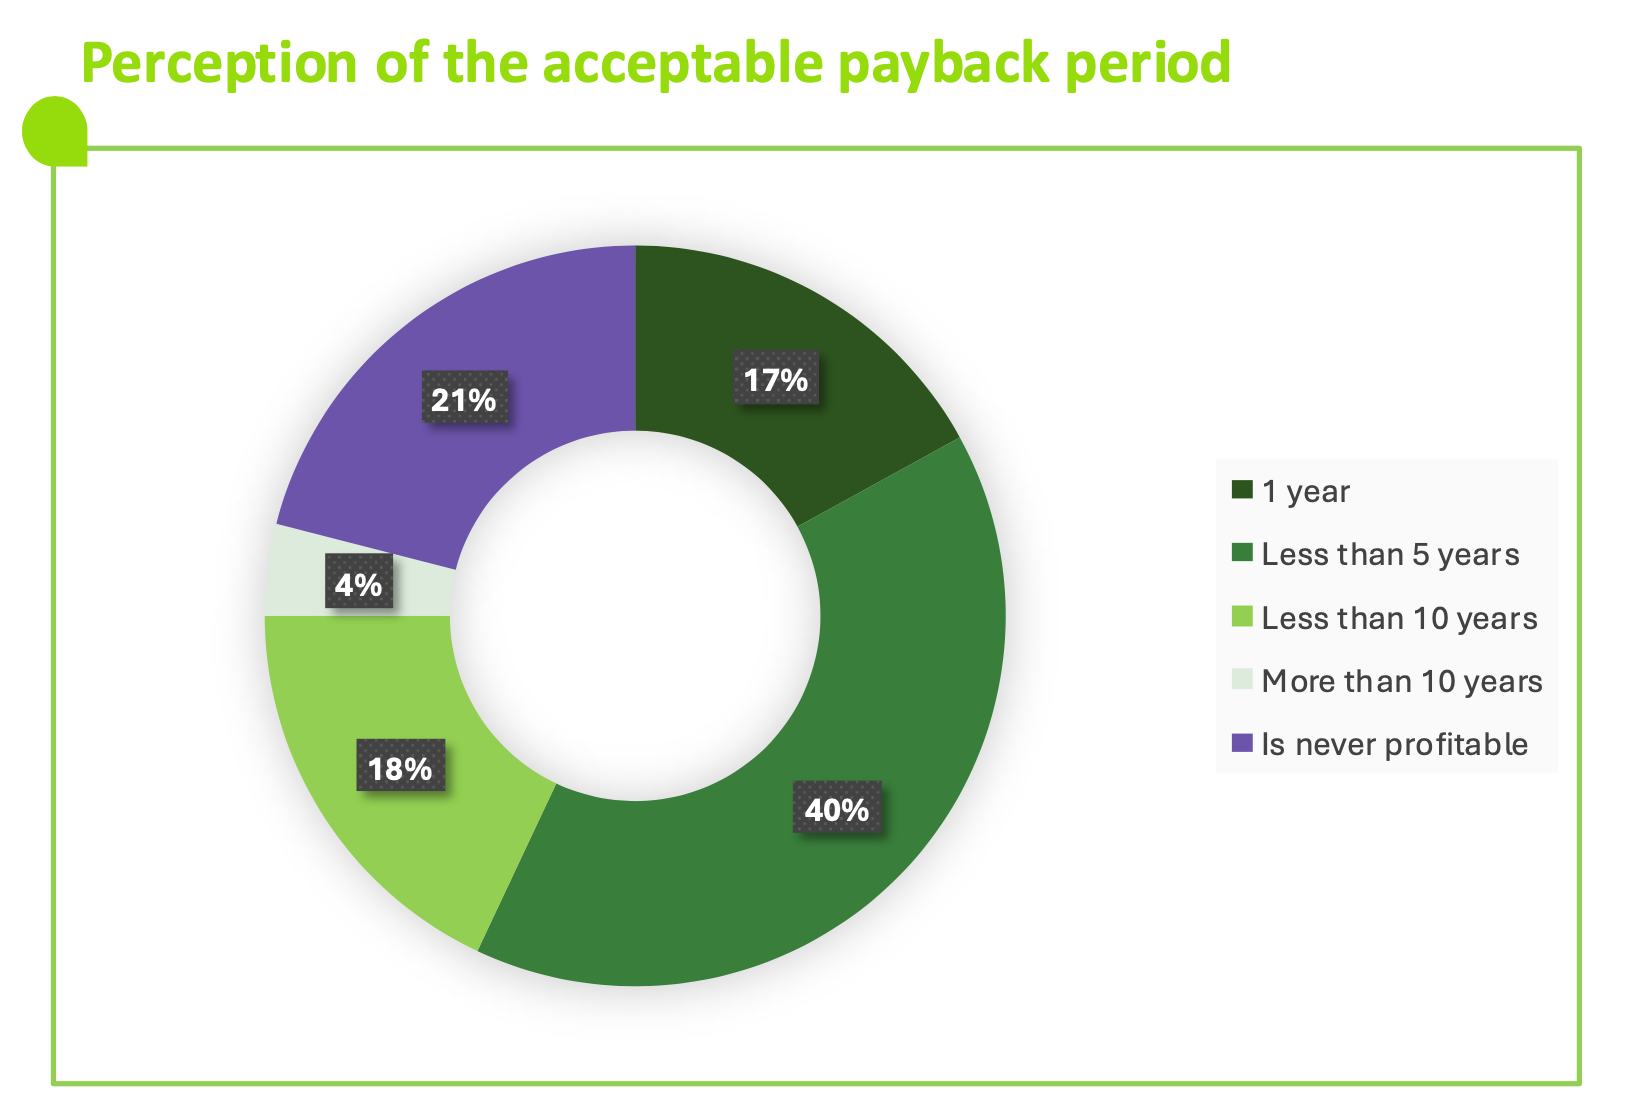 The visual presents a ring diagram indicating the duration considered acceptable for an investment to be considered profitable.
The data displayed is:
1 year: 17%.
Less than 5 years: 40%.
Less than 10 years: 18%.
More than 10 years: 4%.
Never profitable: 21%.
This distribution shows that the majority considers that an investment should be profitable in less than five years, while one in five respondents believes it will never be profitable.
The visual presents a ring diagram indicating the duration considered acceptable for an investment to be considered profitable.
The data displayed is:
1 year: 17%.
Less than 5 years: 40%.
Less than 10 years: 18%.
More than 10 years: 4%.
Never profitable: 21%.
This distribution shows that the majority considers that an investment should be profitable in less than five years, while one in five respondents believes it will never be profitable.
Fig 20 – Priority criteria for choosing work
Download this infographic for your presentations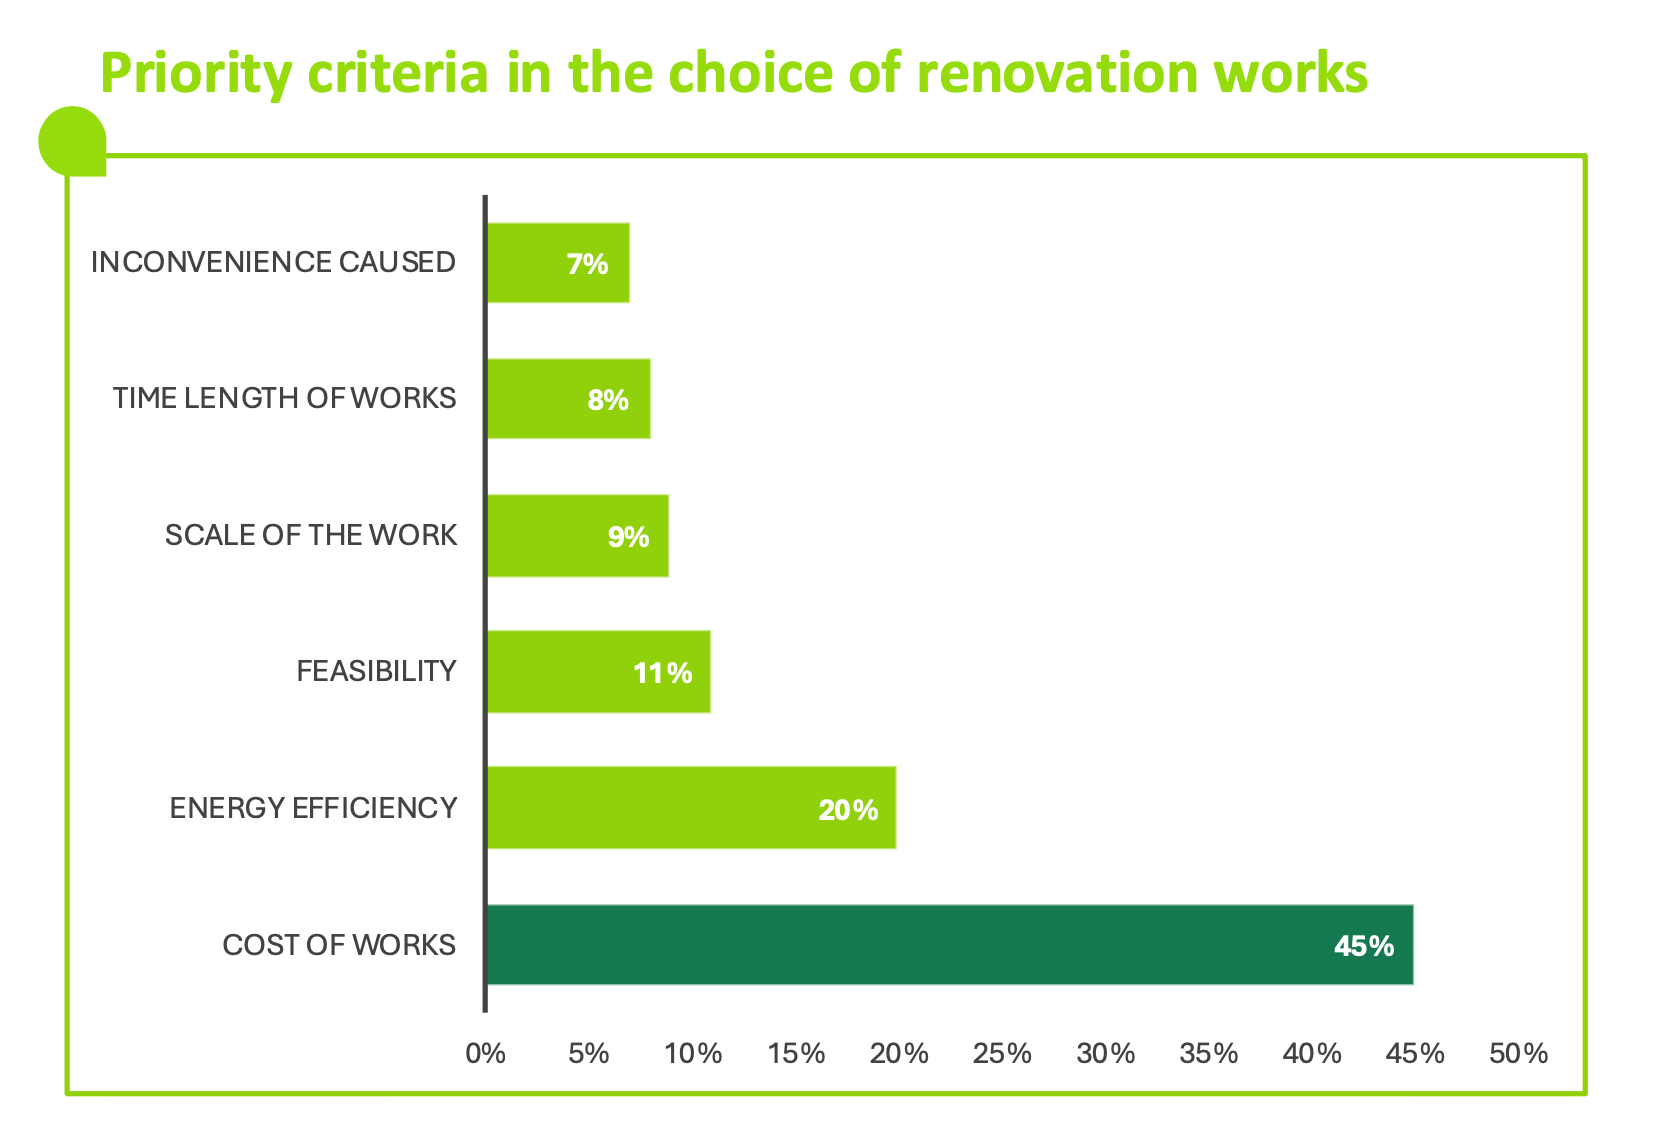 The infographic presents a horizontal histogram listing six criteria that may influence the choice of type of work to be done.
The data displayed is:
Disruption caused: 7%.
Duration of work: 8%.
Scope of work: 9%.
Feasibility: 11%.
Energy efficiency: 20%.
Cost of work: 45%.
The most cited criterion is the cost of work, followed by energy efficiency.
The infographic presents a horizontal histogram listing six criteria that may influence the choice of type of work to be done.
The data displayed is:
Disruption caused: 7%.
Duration of work: 8%.
Scope of work: 9%.
Feasibility: 11%.
Energy efficiency: 20%.
Cost of work: 45%.
The most cited criterion is the cost of work, followed by energy efficiency.