Awareness and perception of the low-cost market


The English language has a gift for turning simple words into popular generic expressions that are used around the world. It has the ability to neatly denote a vast array of products, services, companies and even attitudes, which in spite of their diversity are linked together by a single idea, in this case low prices. It seemed essential for a survey devoted to the topic to underline the power of the concept and the degree to which it has been embraced by consumers.
Awareness and perception of the low-cost market
“Low cost” is one of those expressions that have slowly established themselves over time, without it being possible to accurately pinpoint their origin (see part 3). Today, the term has become part of the economic vocabulary of industry professionals and consumers alike.
A concept that is widely known and recognised
9 out of 10 Europeans interviewed for this survey had heard of the low-cost concept.
In some cases, the term is almost universally recognised, with scores approaching 100% in a number of countries, including Italy, Bulgaria, Spain and Portugal.
Most have more than a passing acquaintance with the notion, with 55% of respondents stating that they understand specifically what the term means. The most perceptive consumers can be found in Southern Europe, with 8 out of 10 Italians, Spaniards and Portuguese able to define exactly what the two words signify. In contrast, Poles, Austrians and Slovaks are not as familiar with the concept, with less than 3 in 10 being able to clearly define what is meant by “low cost” (Fig. 2).
Fig 2 – Declared knowledge of low-cost in Europe
Download this infographic for your presentations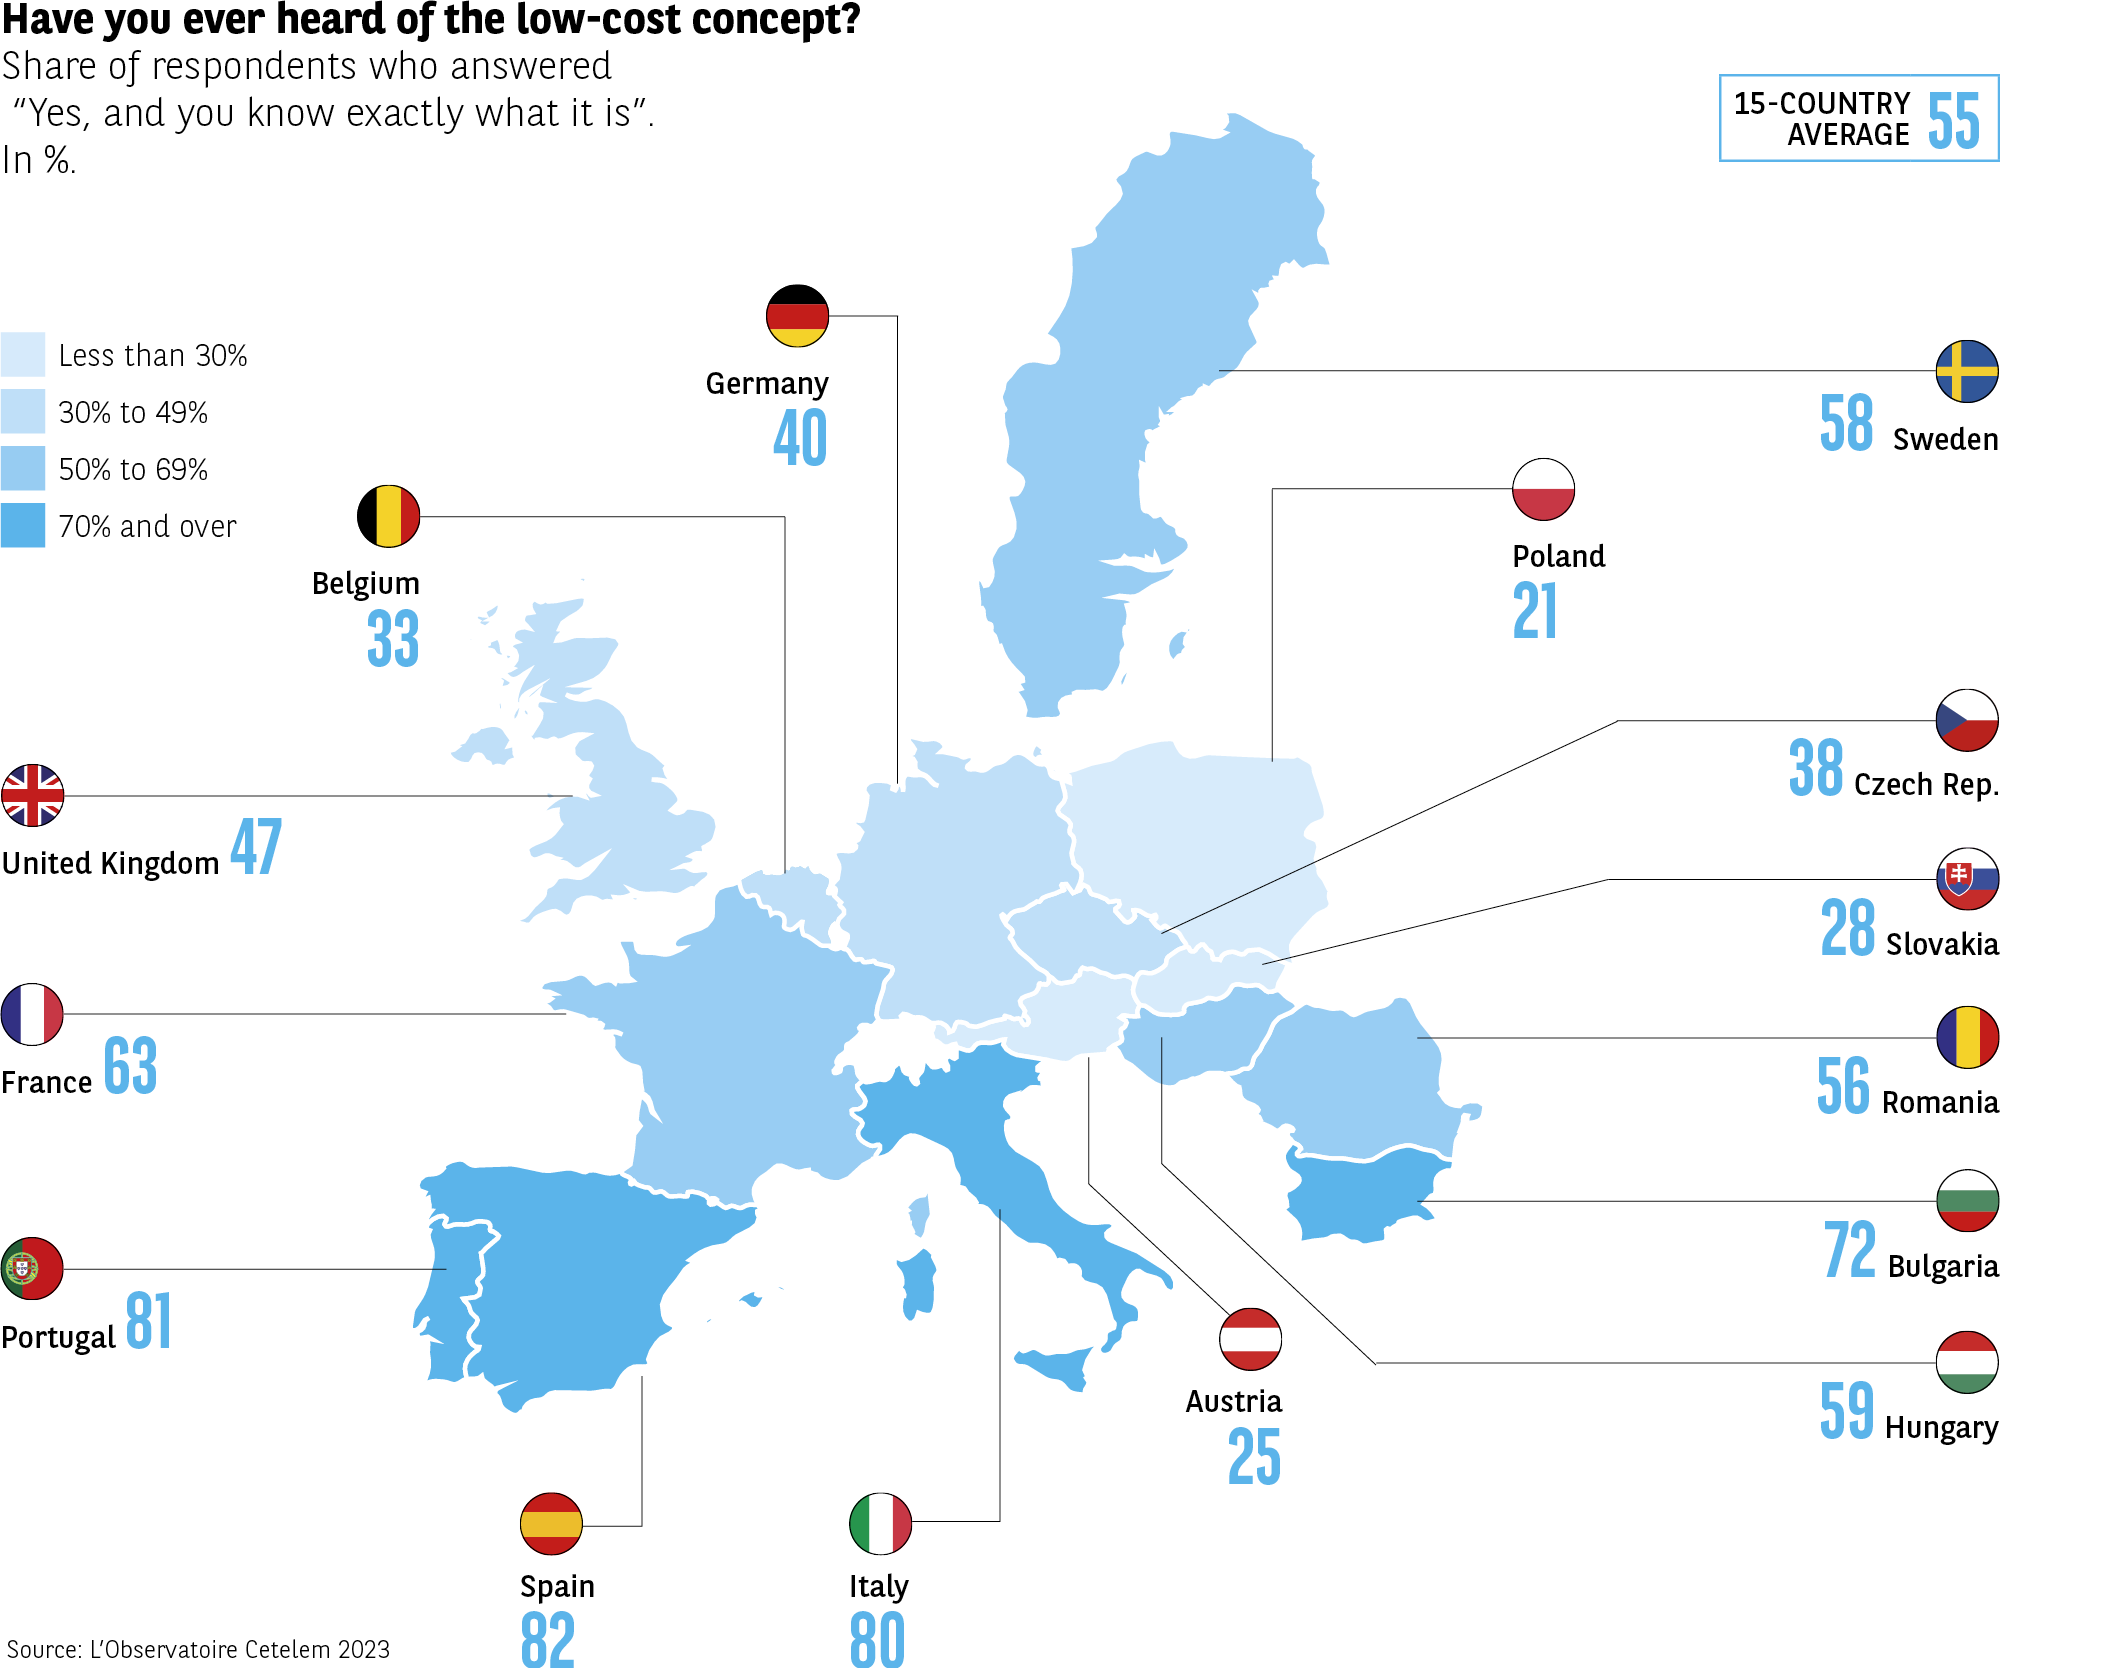 The infographic presents a map of 15 European countries, indicating the proportion of respondents who declare having already heard of low-cost and understanding what it means. The results are expressed as a percentage. The average of the 15 countries is 55%.
Data by country:
Spain: 82%
Portugal: 81%
Italy: 80%
Bulgaria: 72%
France: 63%
Sweden: 58%
Romania: 56%
Hungary: 59%
United Kingdom: 47%
Czech Republic: 38%
Germany: 40%
Belgium: 33%
Slovakia: 28%
Austria: 25%
Poland: 21%
The declared understanding of low-cost varies widely: it often exceeds 70% in Southern Europe, while several Central European countries have lower levels.
Source: Cetelem Observatory 2023
The infographic presents a map of 15 European countries, indicating the proportion of respondents who declare having already heard of low-cost and understanding what it means. The results are expressed as a percentage. The average of the 15 countries is 55%.
Data by country:
Spain: 82%
Portugal: 81%
Italy: 80%
Bulgaria: 72%
France: 63%
Sweden: 58%
Romania: 56%
Hungary: 59%
United Kingdom: 47%
Czech Republic: 38%
Germany: 40%
Belgium: 33%
Slovakia: 28%
Austria: 25%
Poland: 21%
The declared understanding of low-cost varies widely: it often exceeds 70% in Southern Europe, while several Central European countries have lower levels.
Source: Cetelem Observatory 2023
A noted level of development
A similar proportion of Europeans also consider the low-cost market to be well developed in their country. 6 out of 10 respondents are of this view. Only 11% go as far as saying that it is very well developed, which leaves the low-cost sector considerable scope to boost its visibility and therefore its economic clout. Geographically speaking, the highest proportions of consumers who state that the low-cost market is well developed can be found in Northern and Western Europe (7 out of 10 in Sweden, the UK and France) (Fig. 3).
Fig 3 – Perceived development of the low-cost market in Europe
Download this infographic for your presentations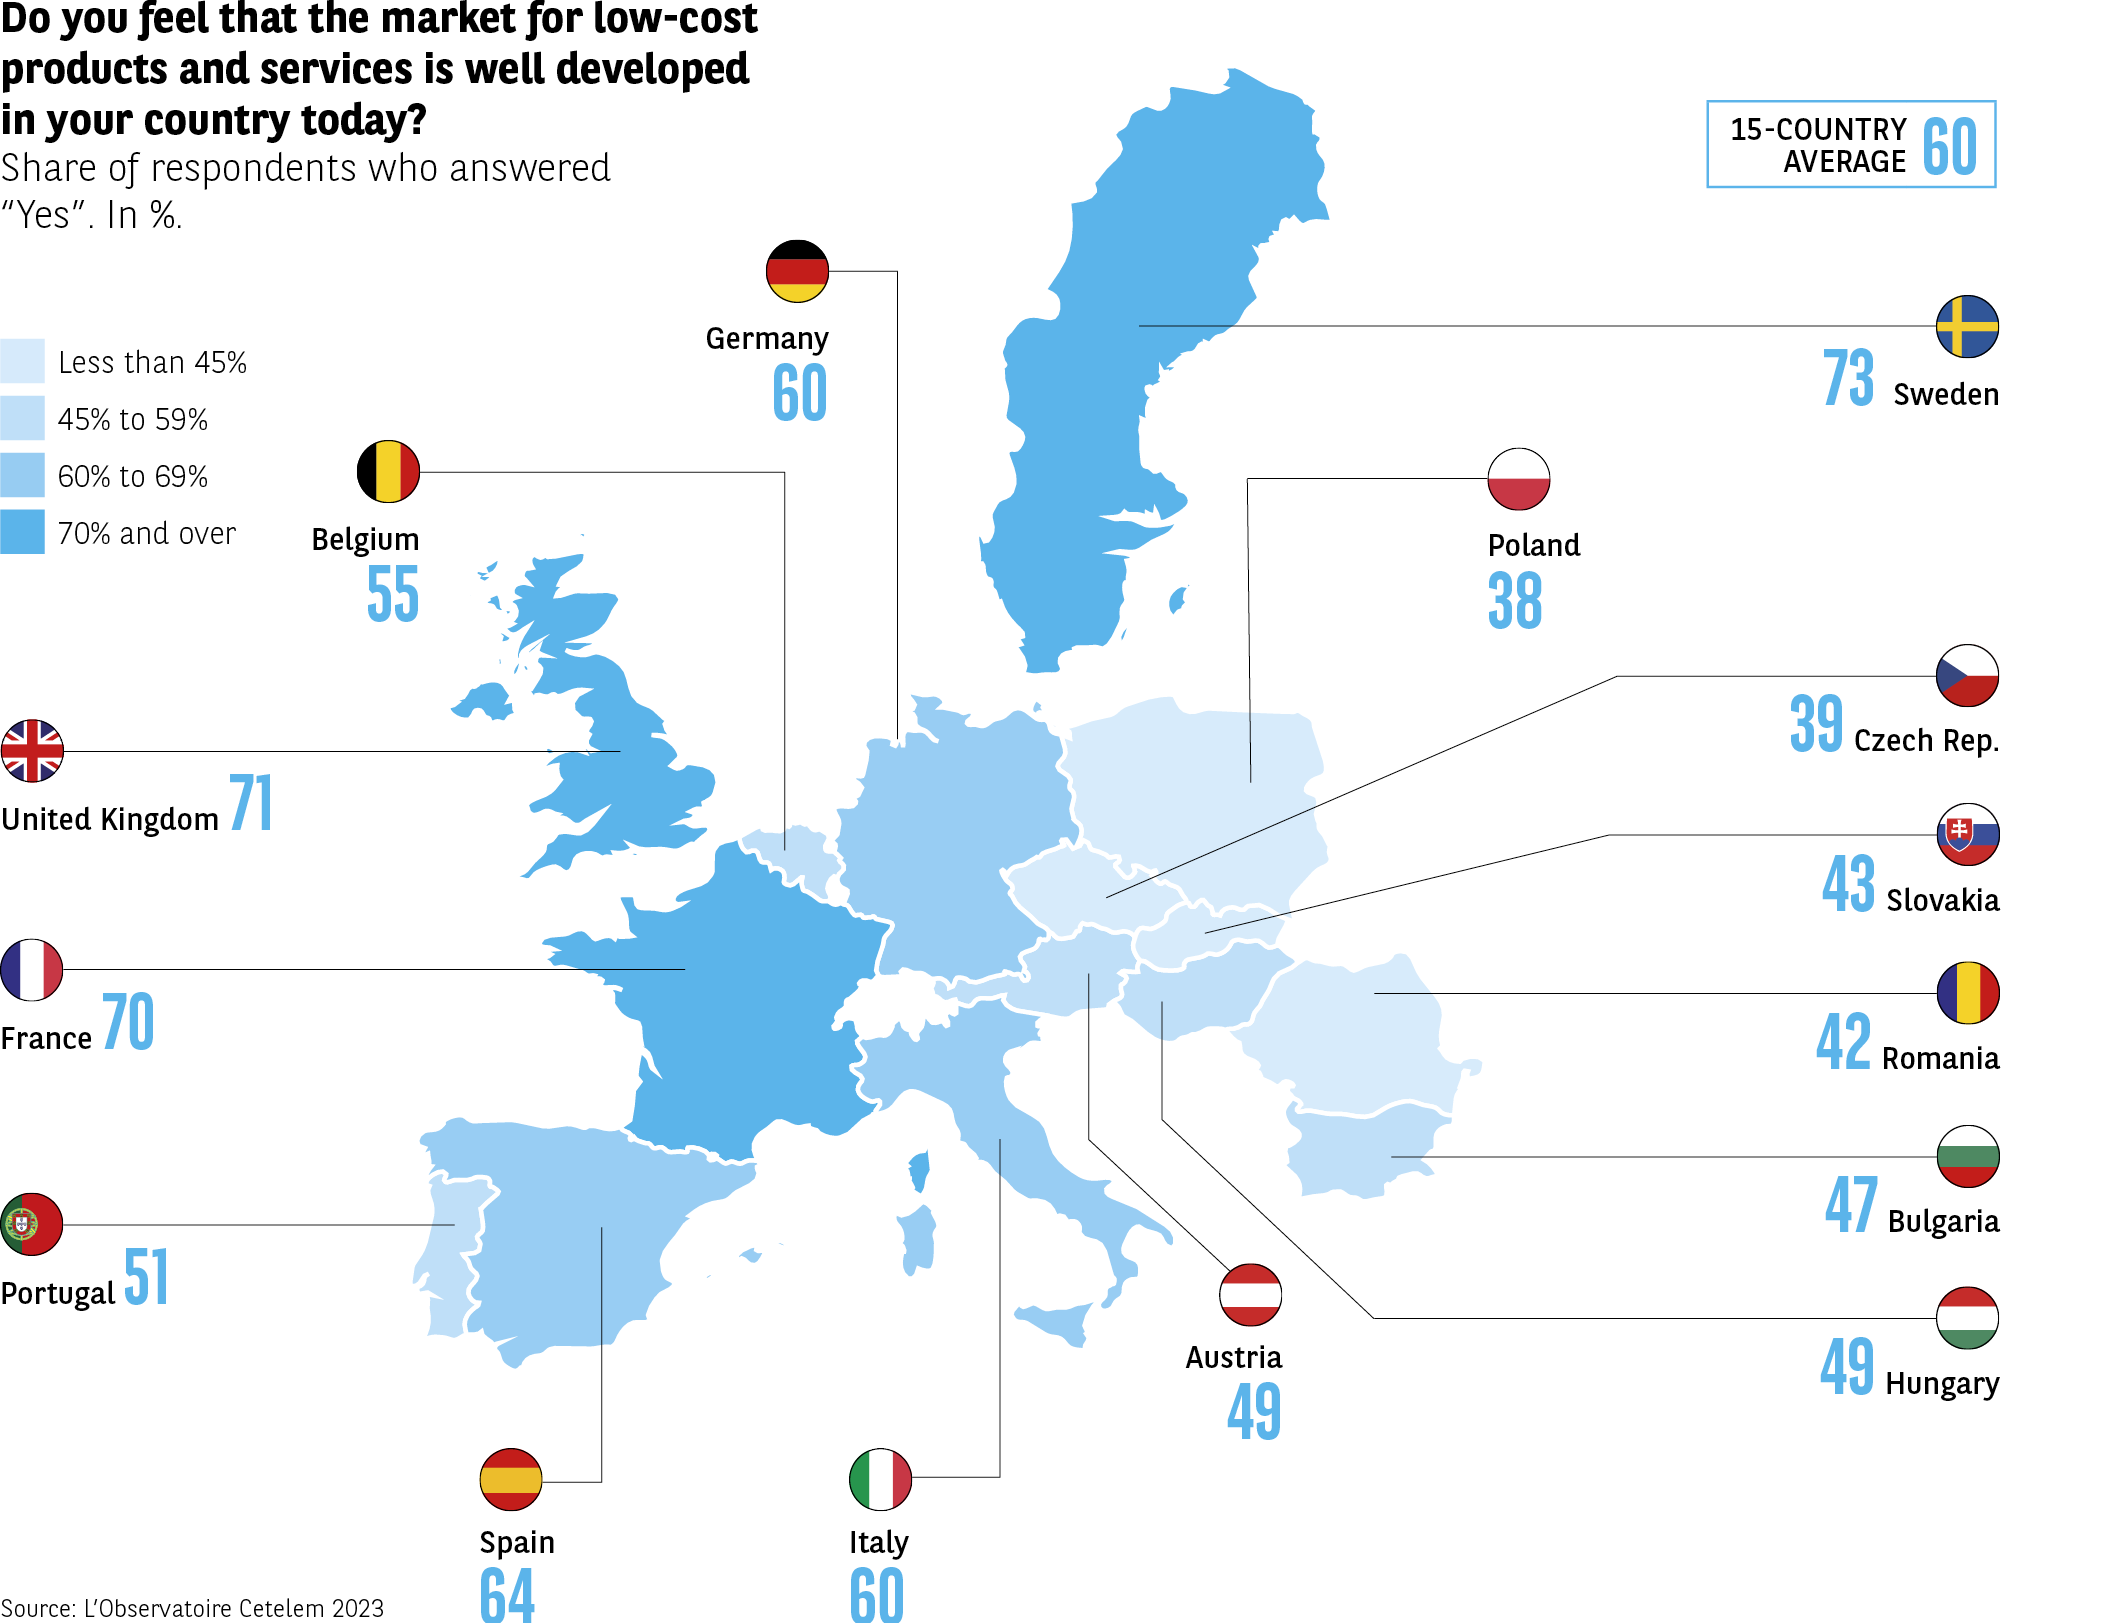 The infographic presents a map of 15 European countries, with the proportion of respondents stating that the low-cost market is developed in their country. The values are expressed as a percentage of “Yes” responses. The average of the 15 countries is 60%.
Data by country:
Sweden: 73%
United Kingdom: 71%
France: 70%
Spain: 64%
Germany: 60%
Italy: 60%
Belgium: 55%
Portugal: 51%
Austria: 49%
Hungary: 49%
Bulgaria: 47%
Slovakia: 43%
Romania: 42%
Czech Republic: 39%
Poland: 38%
The proportions vary greatly from country to country: several Western European countries exceed 60%, while some Central and Eastern European countries have lower levels.
Source: Cetelem Observatory 2023
The infographic presents a map of 15 European countries, with the proportion of respondents stating that the low-cost market is developed in their country. The values are expressed as a percentage of “Yes” responses. The average of the 15 countries is 60%.
Data by country:
Sweden: 73%
United Kingdom: 71%
France: 70%
Spain: 64%
Germany: 60%
Italy: 60%
Belgium: 55%
Portugal: 51%
Austria: 49%
Hungary: 49%
Bulgaria: 47%
Slovakia: 43%
Romania: 42%
Czech Republic: 39%
Poland: 38%
The proportions vary greatly from country to country: several Western European countries exceed 60%, while some Central and Eastern European countries have lower levels.
Source: Cetelem Observatory 2023
Low cost: an entire concept in two words
While different terminology is employed depending on the sector, from “low fare” to “hard discount” to “economy class”, the definition of low cost nonetheless rests upon several points of consensus. This is a business model geared towards significantly reducing prices, one that is based on the implementation of a particular logistical and personnel management rationale, but also a functional service. These attributes provide a tangible description of an economic innovation that enables prices to be reduced by at least 25% compared to traditional retail (Fig. 4).
Fig 4 – Scope of the low-cost model
Download this infographic for your presentations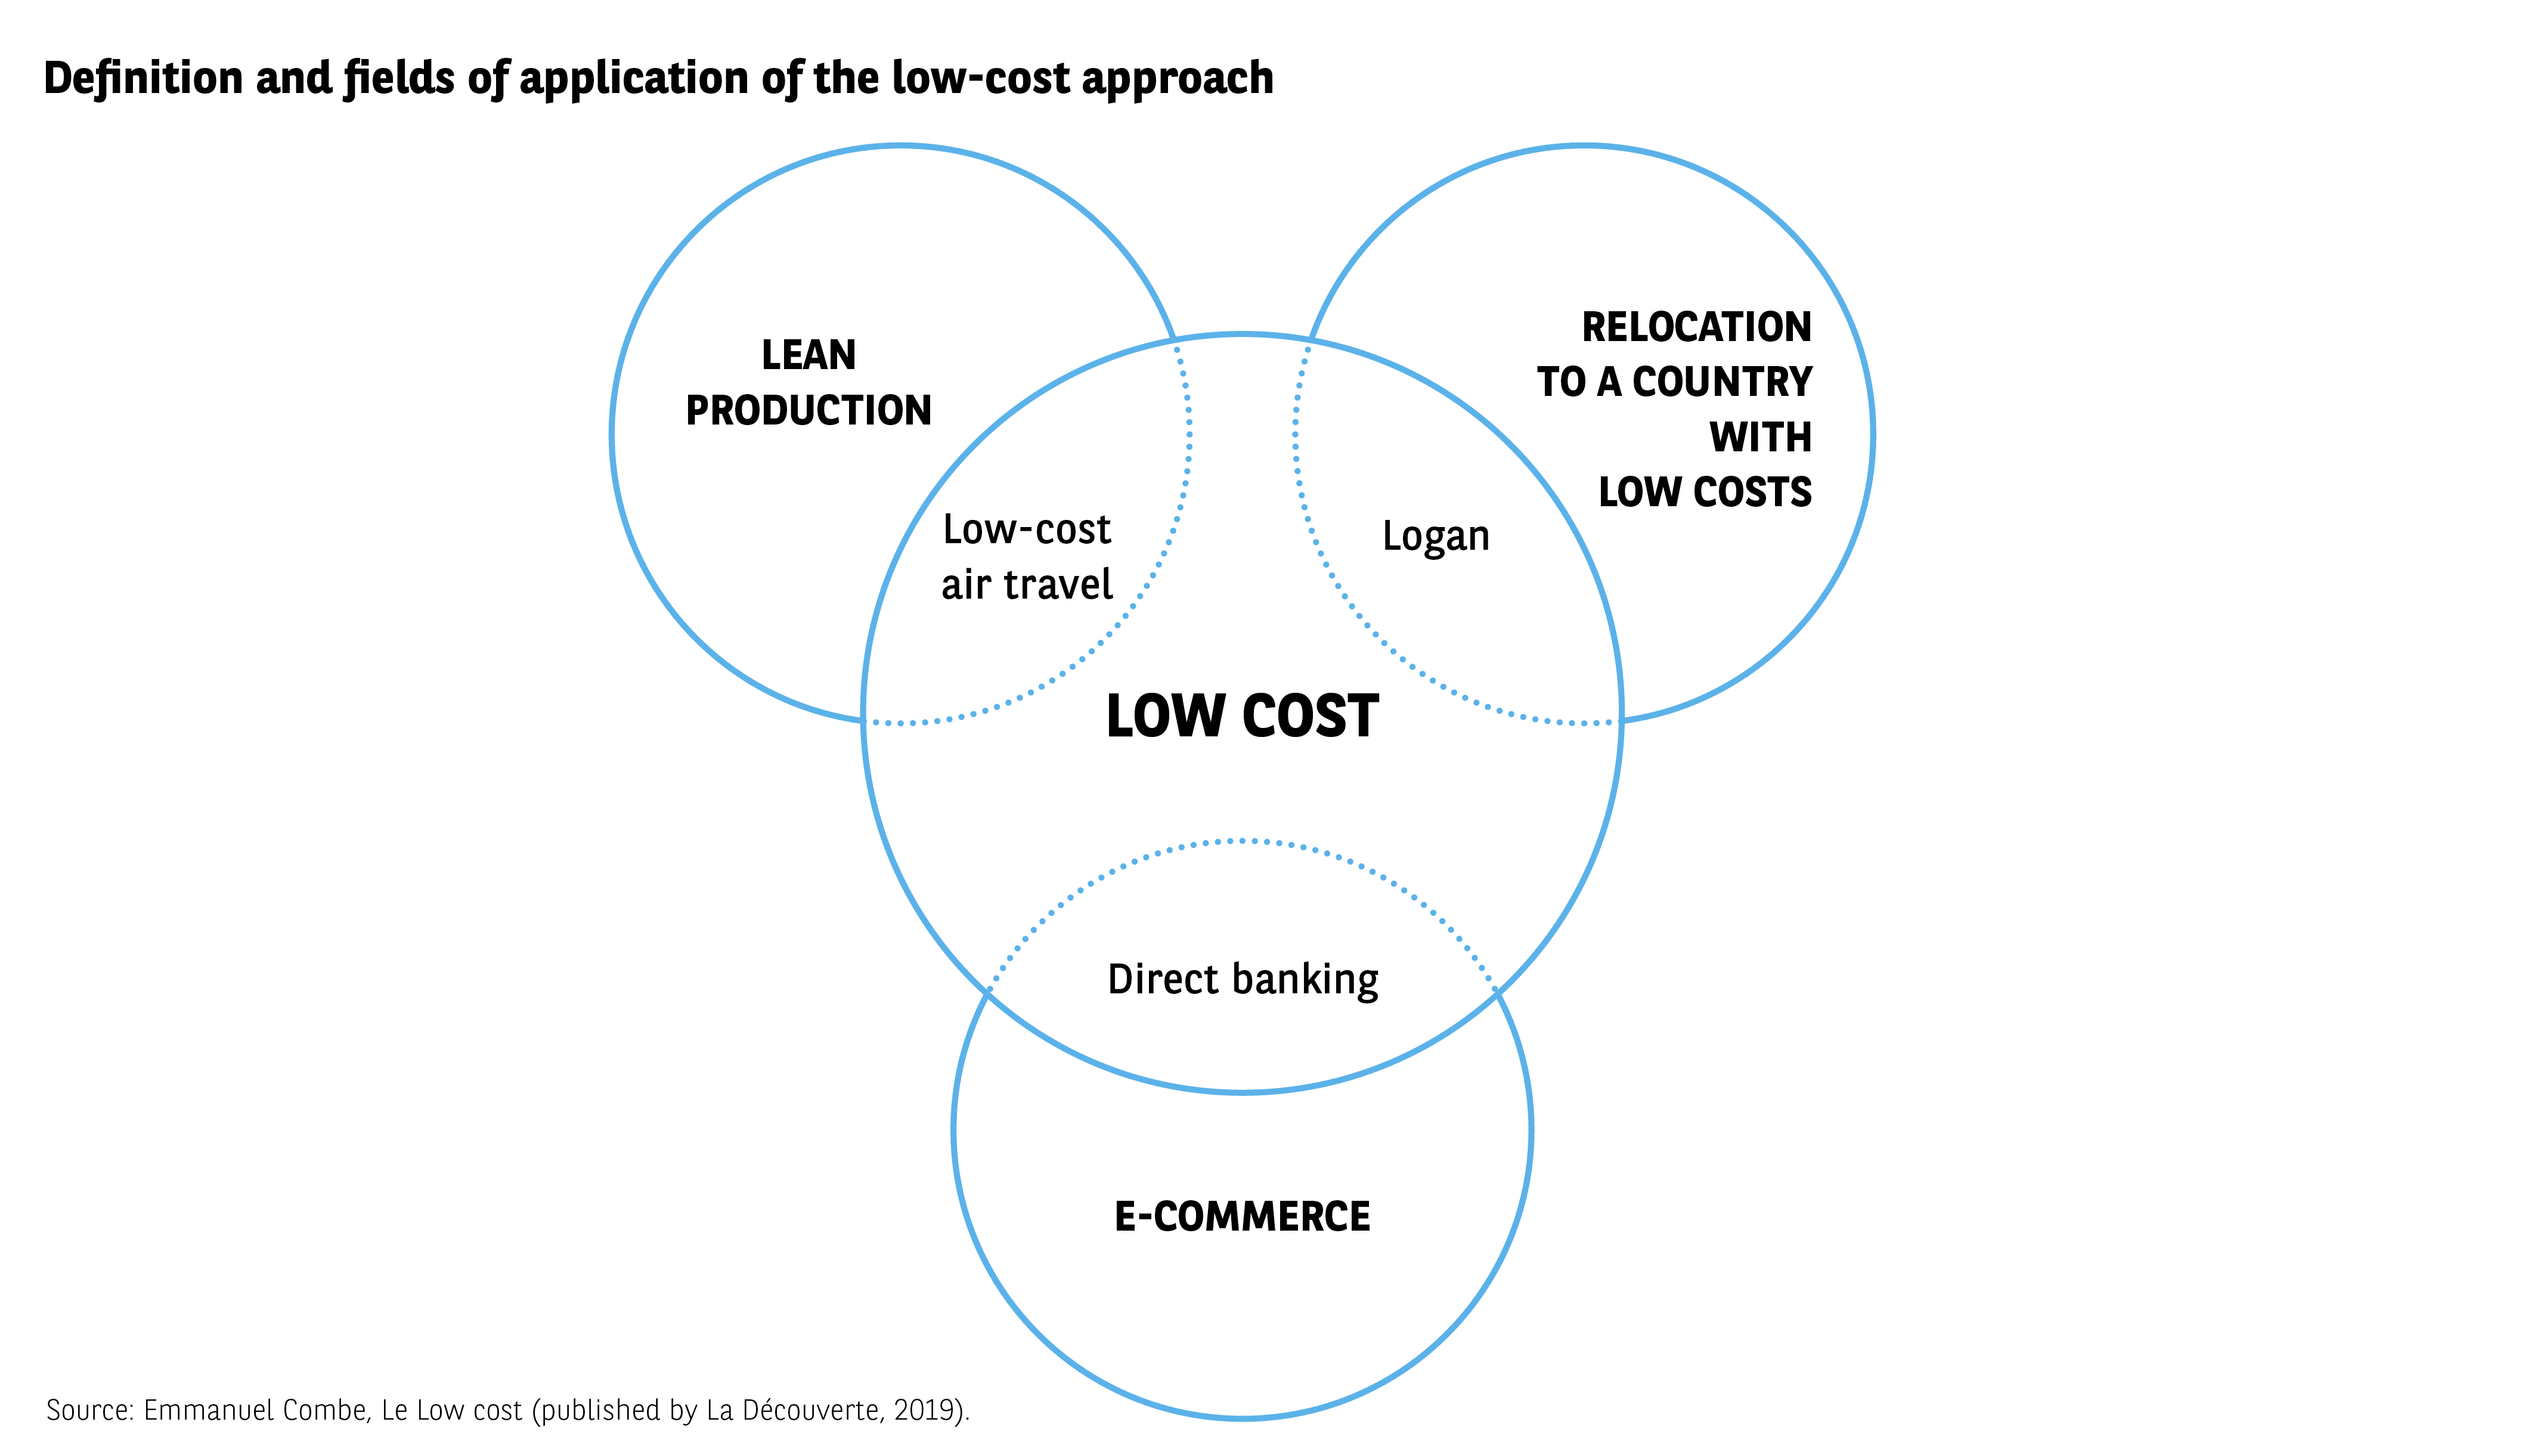 The infographic presents three circles representing different fields related to low-cost. Each circle partially overlaps a central circle. The text begins with “Definition and scope of low-cost”.
Diagram structure:
Left circle: Lean production
Internal mention: “Low-cost airline”
Right circle: Offshoring to a low-cost country
Internal mention: “Logan”
Bottom circle: Online sales
Internal mention: “Direct bank”
Central circle (intersection of the three): Low-cost
The diagram illustrates that low-cost results from approaches combining industrial optimization, offshoring, and digital distribution, with examples of associated sectors or products.
Source: Emmanuel Combe, Le Low cost (La Découverte, 2019)
The infographic presents three circles representing different fields related to low-cost. Each circle partially overlaps a central circle. The text begins with “Definition and scope of low-cost”.
Diagram structure:
Left circle: Lean production
Internal mention: “Low-cost airline”
Right circle: Offshoring to a low-cost country
Internal mention: “Logan”
Bottom circle: Online sales
Internal mention: “Direct bank”
Central circle (intersection of the three): Low-cost
The diagram illustrates that low-cost results from approaches combining industrial optimization, offshoring, and digital distribution, with examples of associated sectors or products.
Source: Emmanuel Combe, Le Low cost (La Découverte, 2019)
Consumers are clearly well aware of this, since the words they are most likely to associate with the low-cost concept relate to this aspect: “low price”, “value range” and “promotion”. They also link the concept to the notion of “poor quality”, echoing an image of the low-cost market that evokes extremely sparse sales floors, the availability of only the most basic entry-level products, and minimal customer service (Fig. 5).
Fig 5 – Main associations with the concept of low-cost
Download this infographic for your presentations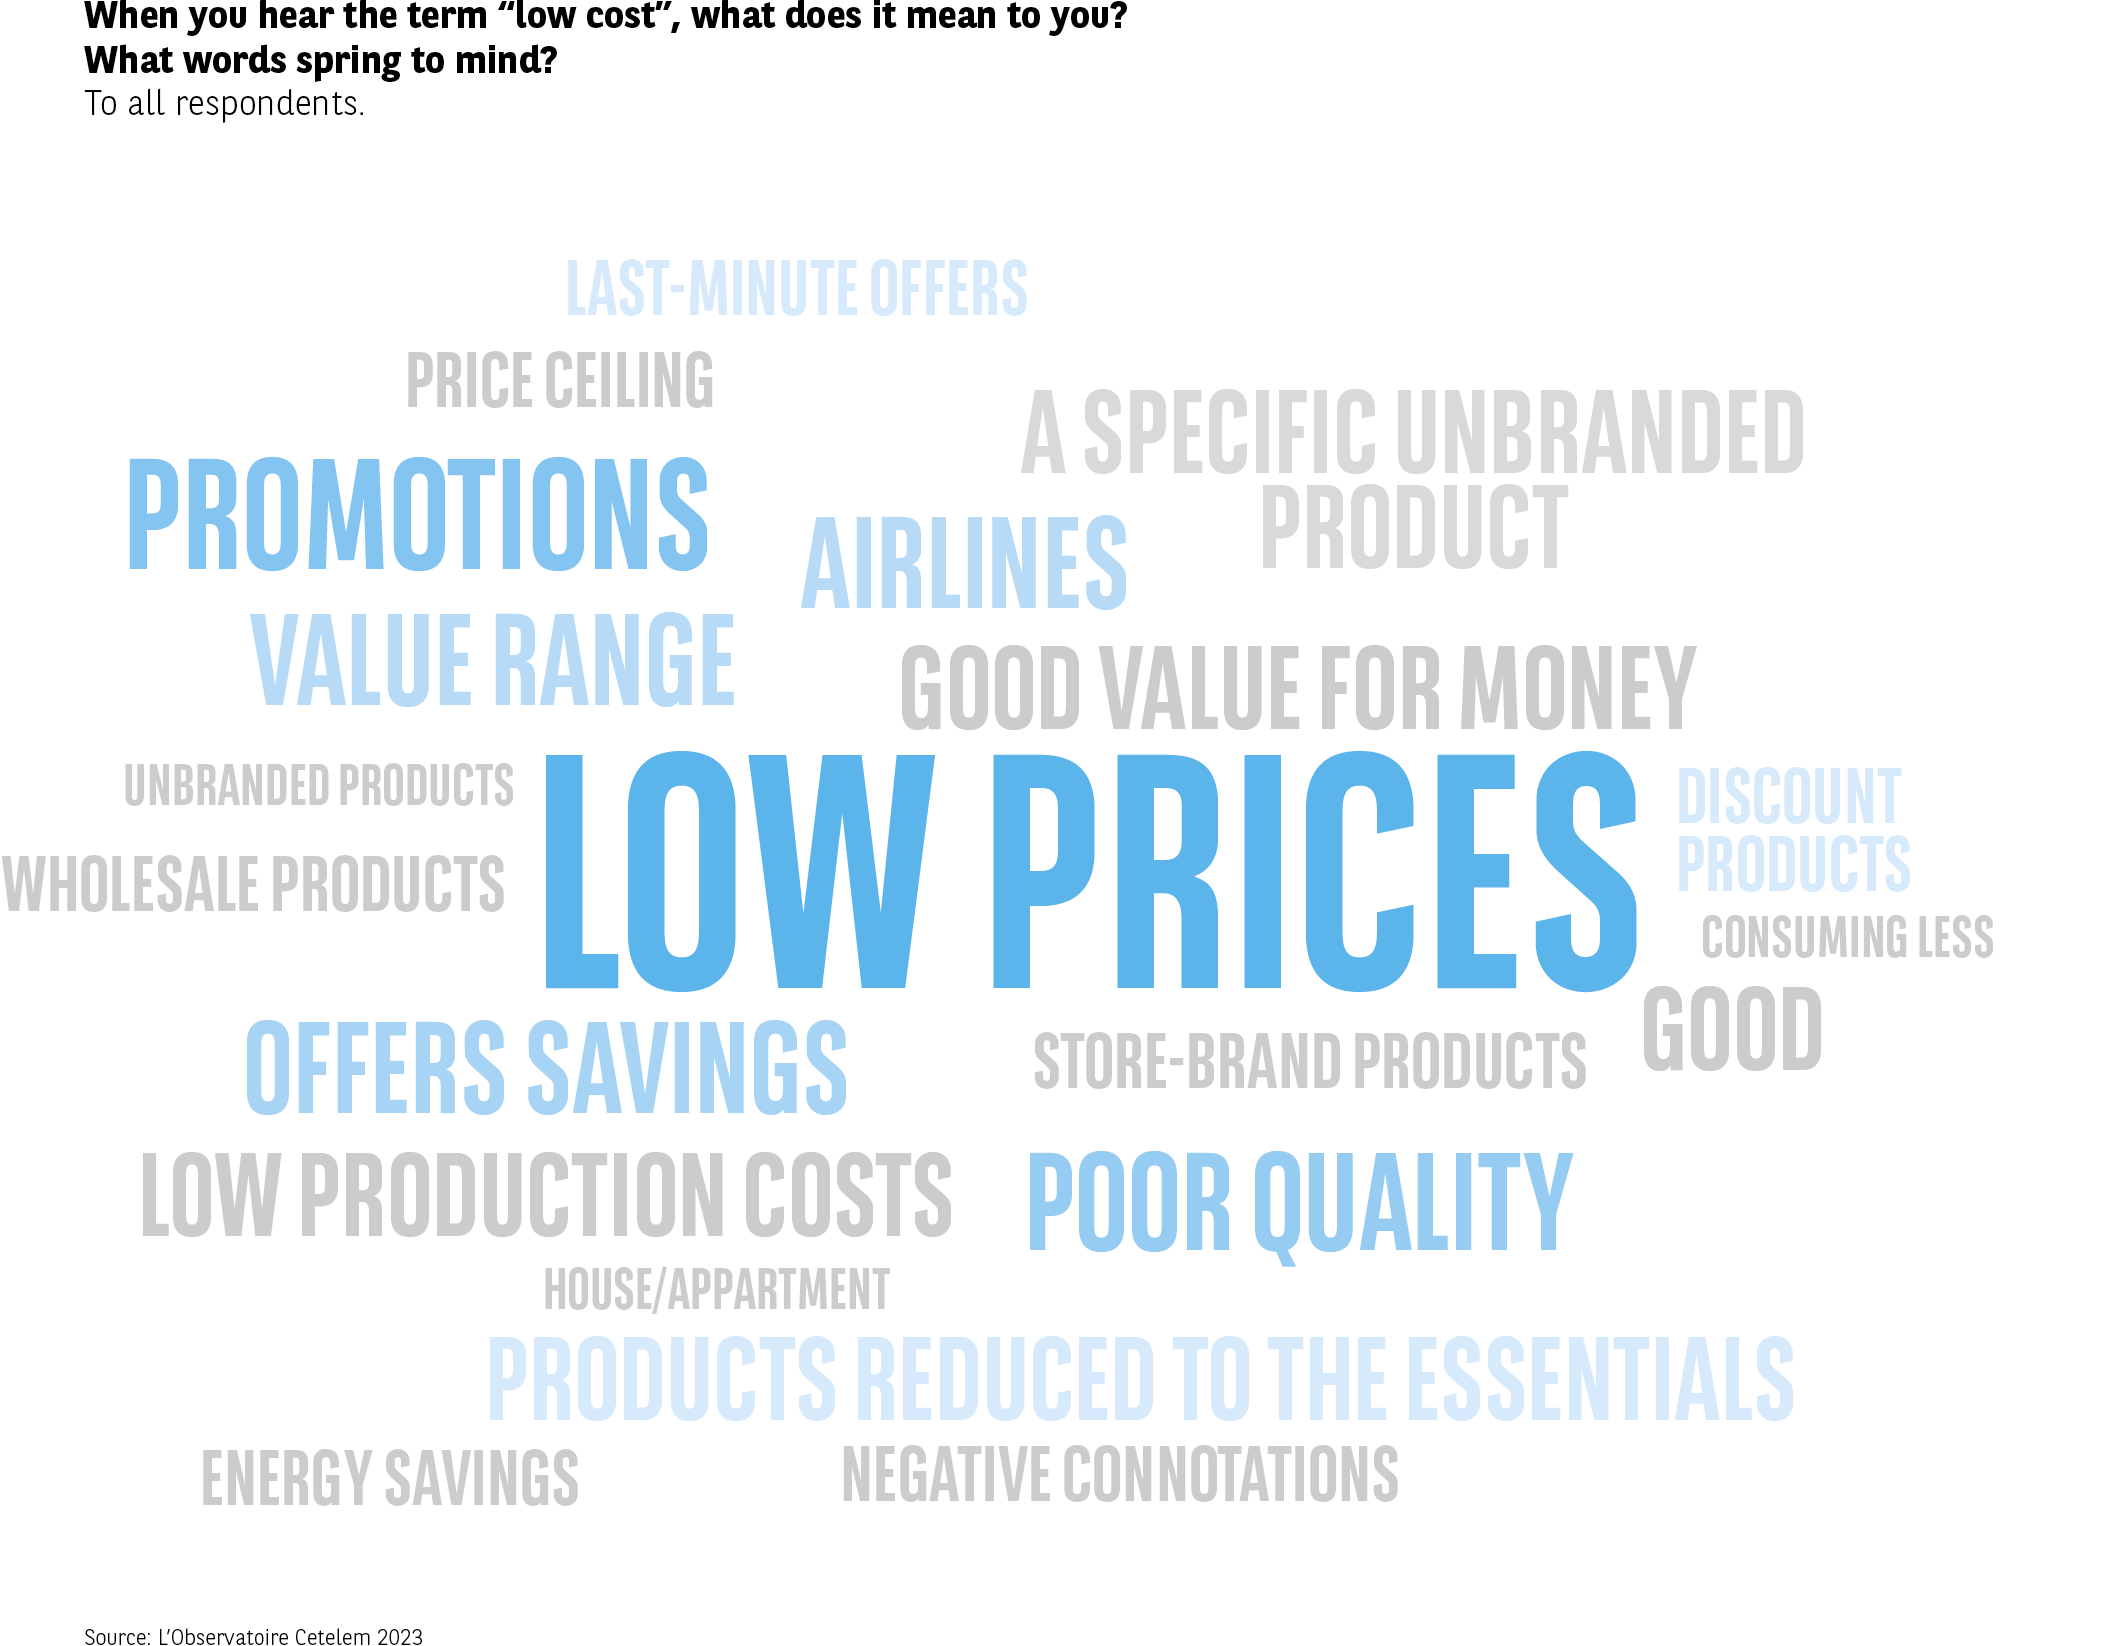 The infographic presents a word cloud from the question: “When you think of low-cost, what comes to mind? What words do you associate with it?”. The most cited terms appear in larger or blue font.
Terms present (exhaustive list, without invented hierarchy):
Low prices; promotions; first price; allows saving; low production cost; products reduced to essentials; poor quality; good quality/price ratio; airlines; last-minute offers; price capping; unbranded products; discount products; consume less; unbranded products; products sold in bulk; distributor-branded products; house/apartment; energy saving; negative connotations; good.
The most visible association concerns “low prices”, followed by terms related to savings, promotions, or perceived quality.
Source: Cetelem Observatory 2023
The infographic presents a word cloud from the question: “When you think of low-cost, what comes to mind? What words do you associate with it?”. The most cited terms appear in larger or blue font.
Terms present (exhaustive list, without invented hierarchy):
Low prices; promotions; first price; allows saving; low production cost; products reduced to essentials; poor quality; good quality/price ratio; airlines; last-minute offers; price capping; unbranded products; discount products; consume less; unbranded products; products sold in bulk; distributor-branded products; house/apartment; energy saving; negative connotations; good.
The most visible association concerns “low prices”, followed by terms related to savings, promotions, or perceived quality.
Source: Cetelem Observatory 2023

The low-cost approach allows prices to be reduced by at least 25% compared to traditional retail.
A decent image that could be enhanced
As we have seen, the low-cost market is well known, widely recognised and well established in the eyes of consumers, in addition to enjoying a generally satisfactory image. The average score assigned by Europeans as a whole is 6.5, with Romanians proving to be the most enthusiastic (7.3) and the Austrians and French the most sceptical (5.8 and 5.9). Indeed, not one country produces a score under 5 out of 10.
It should also be noted that the bulk of opinions can be found in the median range between 5 and 7. The low-cost market is neither shunned nor very popular (Fig. 6).
Fig 6 – Perceived image of low-cost products and services
Download this infographic for your presentations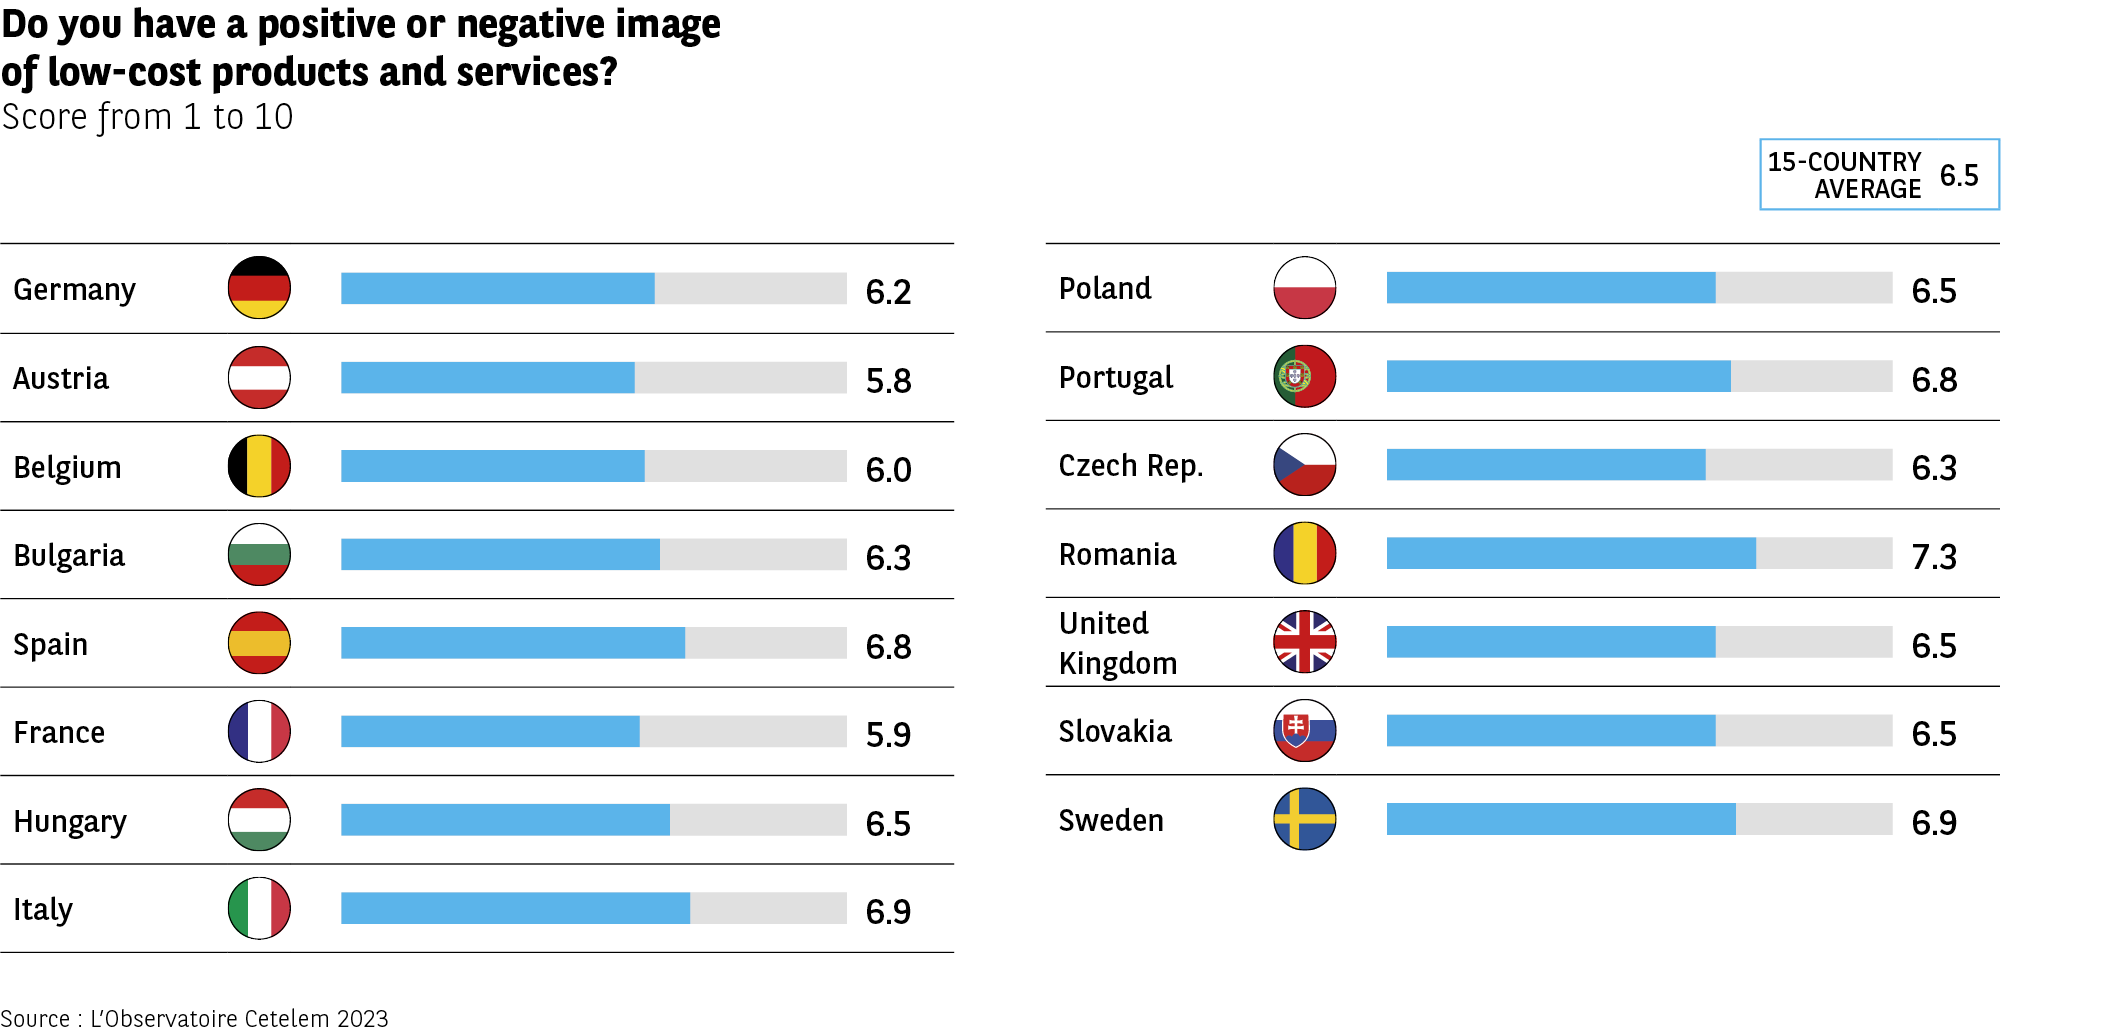 The infographic presents a series of horizontal bars indicating the average rating, from 1 to 10, given by respondents to the question: “Do you have a good or bad image of low-cost products and services?”. A general average of 6.5 is displayed.
Data by country:
Germany: 6.2
Austria: 5.8
Belgium: 6.0
Bulgaria: 6.3
Spain: 6.8
France: 5.9
Hungary: 6.5
Italy: 6.9
Poland: 6.5
Portugal: 6.8
Czech Republic: 6.3
Romania: 7.3
United Kingdom: 6.5
Slovakia: 6.5
Sweden: 6.9
The ratings range from 5.8 to 7.3, indicating a generally rather positive perception, with moderate variations.
Source: Cetelem Observatory 2023
The infographic presents a series of horizontal bars indicating the average rating, from 1 to 10, given by respondents to the question: “Do you have a good or bad image of low-cost products and services?”. A general average of 6.5 is displayed.
Data by country:
Germany: 6.2
Austria: 5.8
Belgium: 6.0
Bulgaria: 6.3
Spain: 6.8
France: 5.9
Hungary: 6.5
Italy: 6.9
Poland: 6.5
Portugal: 6.8
Czech Republic: 6.3
Romania: 7.3
United Kingdom: 6.5
Slovakia: 6.5
Sweden: 6.9
The ratings range from 5.8 to 7.3, indicating a generally rather positive perception, with moderate variations.
Source: Cetelem Observatory 2023
With an average score of 6.5/10, the image people have of the low-cost model is no more negative than it is positive.
The word cloud was generated automatically based on the exhaustivity of the spontaneous answers to the open-ended question. The size of each word in the image reflects the frequency with which it is used. The word displayed in the largest characters is that used most frequently in the answers of respondents. A word’s position in the cloud has no special significance.
This impression that people feel somewhat ambivalent is reflected in the values they associate with the low-cost concept. For most of the items on which Europeans were asked for their opinion, there is a roughly equal share of positive and negative responses. 58% of consumers believe that low-cost companies respect human rights, while 42% believe the opposite. 55% believe these firms are in tune with their own ethical values, while 45% do not. The issues of environmental friendliness and fair pay for both staff and suppliers also split the individuals surveyed almost equally (53% and 47%). And again there is near parity on the topics of employment and transparency regarding the manufacture of products (Fig. 7). While people’s opinions on the the low-cost market’s values are not especially negative, they do seem to indicate that there is some scope for the concept to evolve by embracing practices that are more in line with current trends and consumer expectations.
Fig 7 – Ethical perception of low-cost companies
Download this infographic for your presentations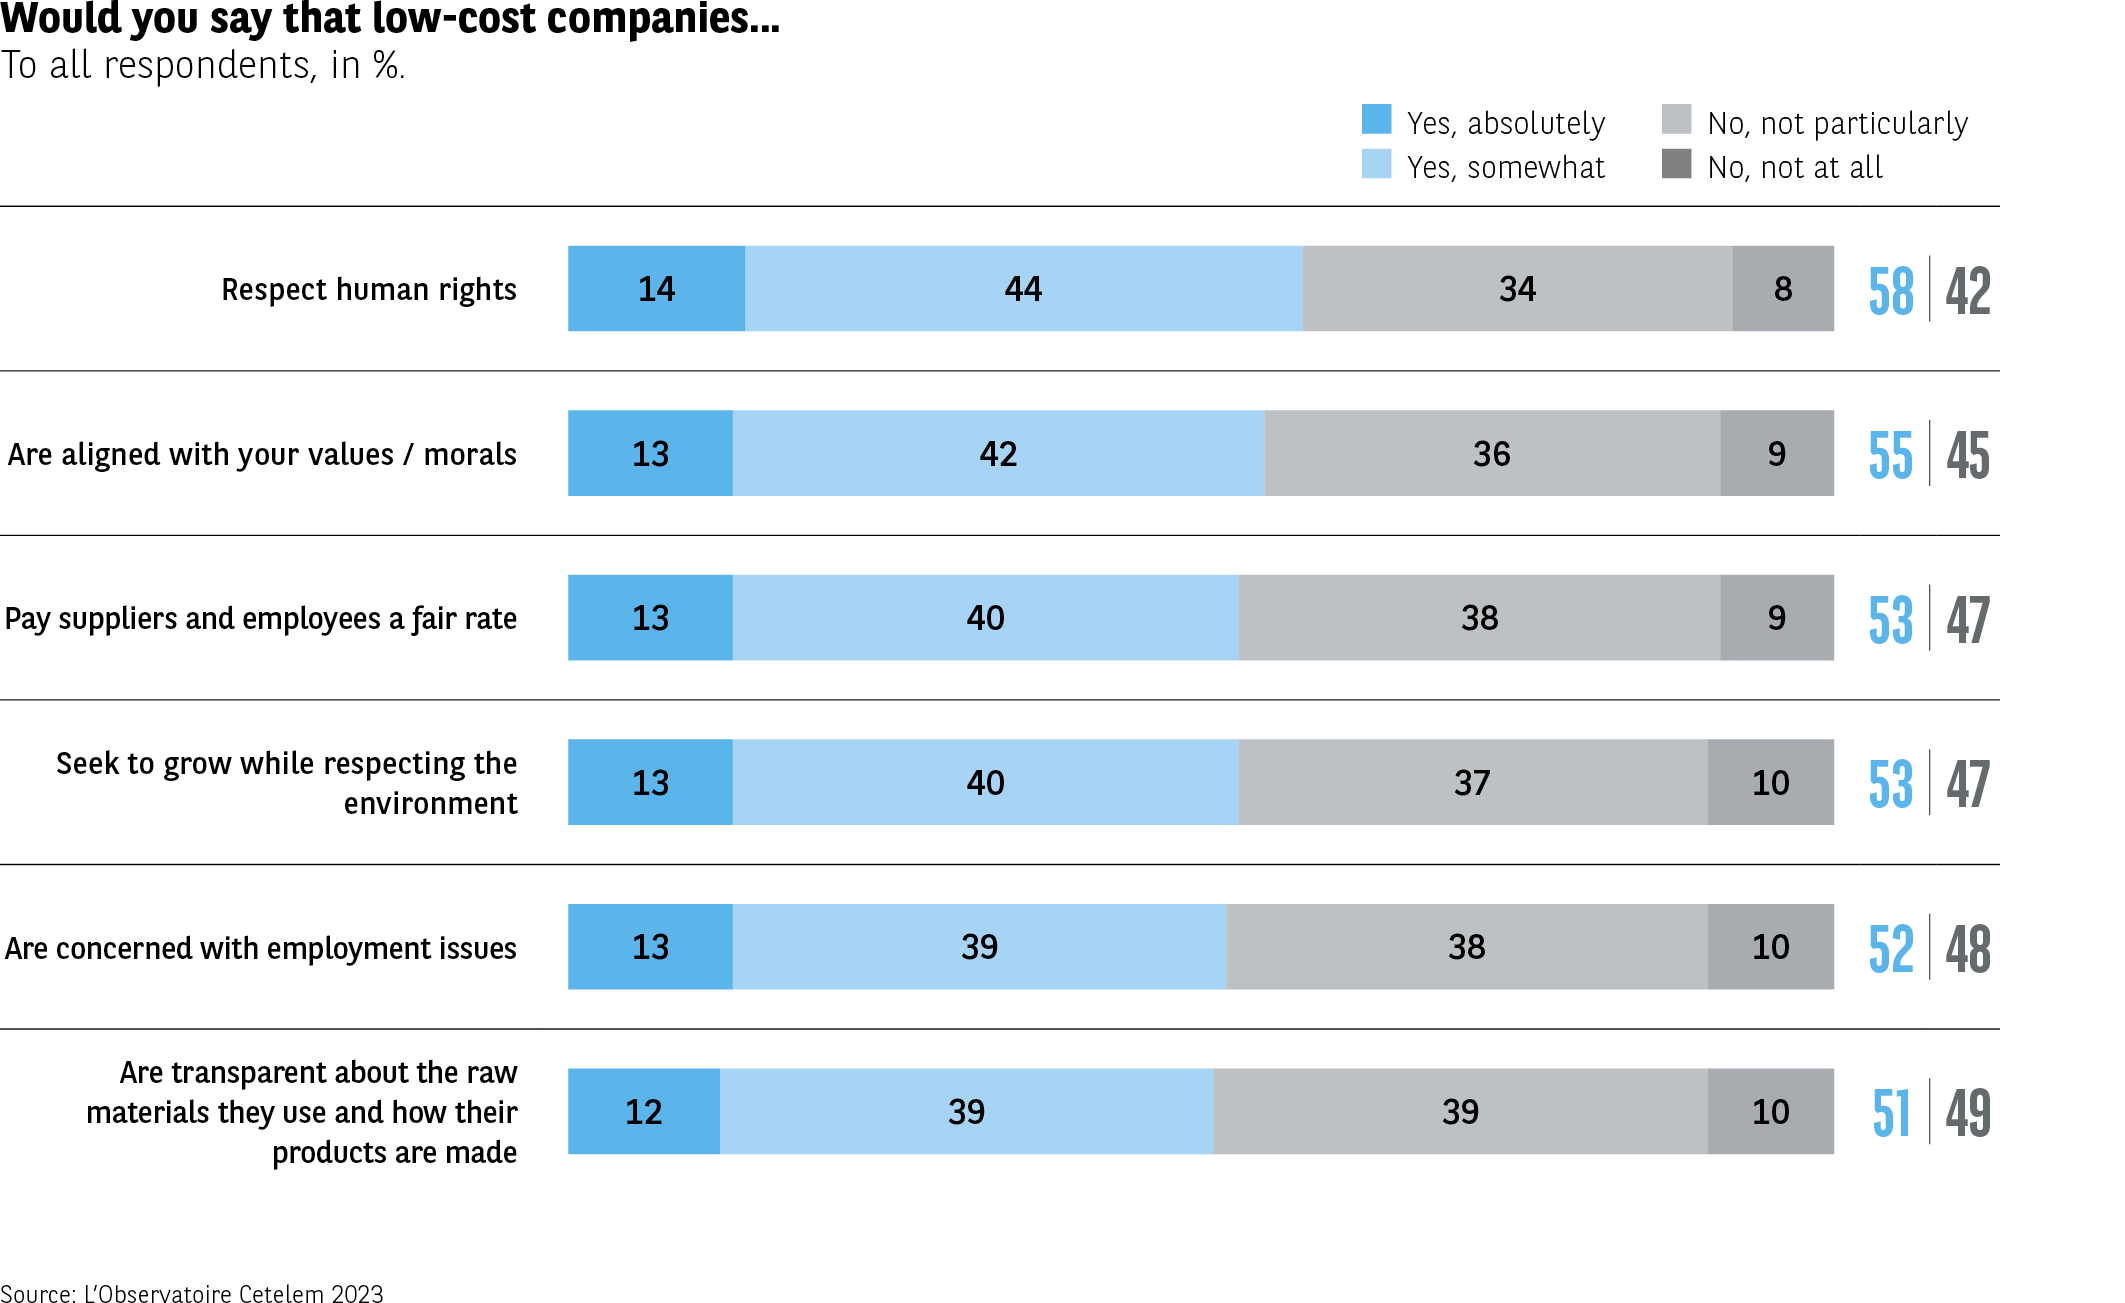 The infographic presents the percentage of respondents indicating, in percentage, to what extent they believe that low-cost companies respect different ethical requirements. The responses are divided into four categories: “Yes, totally”, “Yes, rather”, “No, rather not”, “No, not at all”.
Data by item:
1. Respect human rights
Yes, totally: 14%
Yes, rather: 44%
No, rather not: 34%
No, not at all: 8%
Total yes: 58% – Total no: 42%
2. Are in line with your values/ethics
Yes, totally: 13%
Yes, rather: 42%
No, rather not: 36%
No, not at all: 9%
Total yes: 55% – Total no: 45%
3. Pay suppliers and collaborators a fair price
Yes, totally: 13%
Yes, rather: 40%
No, rather not: 38%
No, not at all: 9%
Total yes: 53% – Total no: 47%
4. Develop while respecting the environment
Yes, totally: 13%
Yes, rather: 40%
No, rather not: 37%
No, not at all: 10%
Total yes: 53% – Total no: 47%
5. Care about employment issues
Yes, totally: 13%
Yes, rather: 39%
No, rather not: 38%
No, not at all: 10%
Total yes: 52% – Total no: 48%
6. Are transparent about raw materials and manufacturing
Yes, totally: 12%
Yes, rather: 39%
No, rather not: 39%
No, not at all: 10%
Total yes: 51% – Total no: 49%
7. The levels of agreement remain relatively moderate, with “yes” totals ranging from 51% to 58% depending on the evaluated dimensions.
Source: Cetelem Observatory 2023
The infographic presents the percentage of respondents indicating, in percentage, to what extent they believe that low-cost companies respect different ethical requirements. The responses are divided into four categories: “Yes, totally”, “Yes, rather”, “No, rather not”, “No, not at all”.
Data by item:
1. Respect human rights
Yes, totally: 14%
Yes, rather: 44%
No, rather not: 34%
No, not at all: 8%
Total yes: 58% – Total no: 42%
2. Are in line with your values/ethics
Yes, totally: 13%
Yes, rather: 42%
No, rather not: 36%
No, not at all: 9%
Total yes: 55% – Total no: 45%
3. Pay suppliers and collaborators a fair price
Yes, totally: 13%
Yes, rather: 40%
No, rather not: 38%
No, not at all: 9%
Total yes: 53% – Total no: 47%
4. Develop while respecting the environment
Yes, totally: 13%
Yes, rather: 40%
No, rather not: 37%
No, not at all: 10%
Total yes: 53% – Total no: 47%
5. Care about employment issues
Yes, totally: 13%
Yes, rather: 39%
No, rather not: 38%
No, not at all: 10%
Total yes: 52% – Total no: 48%
6. Are transparent about raw materials and manufacturing
Yes, totally: 12%
Yes, rather: 39%
No, rather not: 39%
No, not at all: 10%
Total yes: 51% – Total no: 49%
7. The levels of agreement remain relatively moderate, with “yes” totals ranging from 51% to 58% depending on the evaluated dimensions.
Source: Cetelem Observatory 2023