A simple offering


Low prices and reduced services
Low-cost offerings are marketed by powerful specialist brands and enjoy a strong presence in three key sectors, but does that mean they are well regarded by Europeans? The answer is a resounding yes. The overall image that just over 8 out of 10 consumers have of such offerings reflects the idea that these companies focus on keeping prices as low as possible, while providing services that are stripped down to the essentials. Ultimately, this is the “dictionary definition” of the low-cost approach. Almost as many associate low-cost offerings with companies that specialise in this approach. More interestingly, a similar number of Europeans associate the concept with the low-cost offerings of “traditional” brands that have chosen to develop products and services specifically for this market, in some cases selling them through specialist subsidiaries (Fig. 12). This result suggests that the sector is not solely the preserve of “pure plays”, but that it is open and constantly evolving, offering opportunities to brands whose roots are elsewhere. From a geographical perspective, respondents from Mediterranean countries are again the most vocal on these issues.

Marketed by powerful specialist brands, low-cost product offerings are viewed in a positive light by 8 out of 10 Europeans.
Fig 12 – Agreement with statements about the low-cost market
Download this infographic for your presentations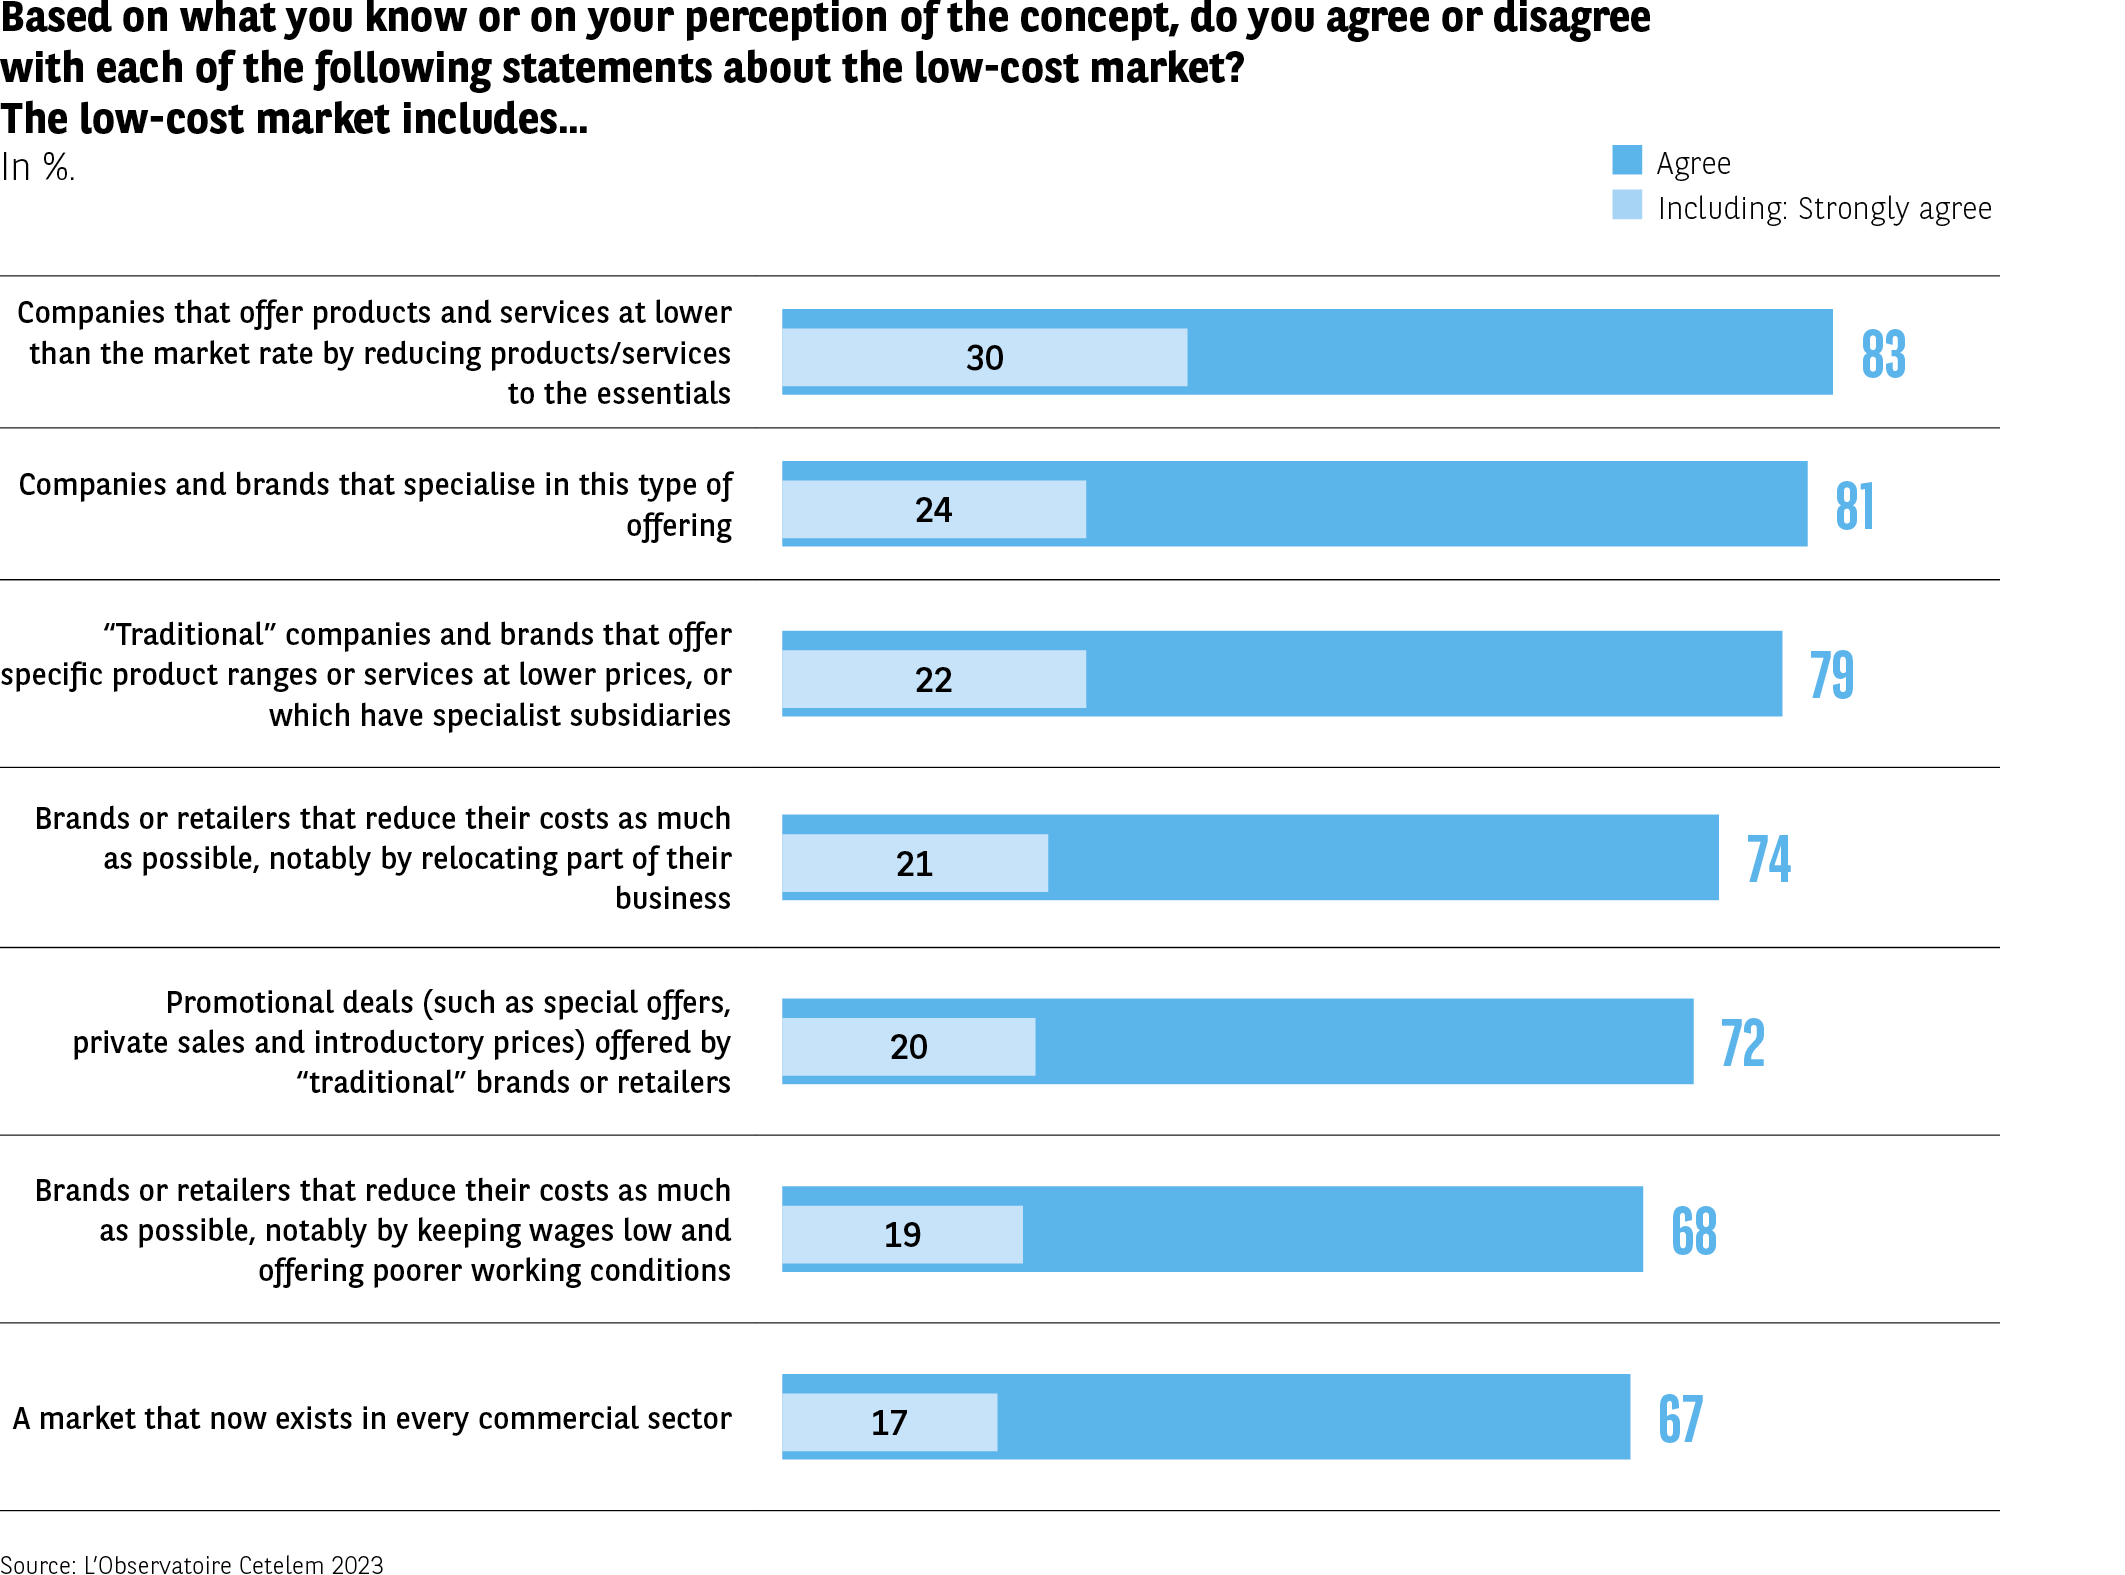 The infographic presents the percentage of respondents who agree with several descriptions of the low-cost market. Each item includes the total percentage of agreement and the percentage of those who are “completely in agreement”.
Data by statement
Products are cheaper because they are reduced to the essentials
Completely in agreement: 30%
Total agreement: 83%
Companies specialize in this type of offer
Completely in agreement: 24%
Total agreement: 81%
Traditional companies offer lower-cost ranges
Completely in agreement: 22%
Total agreement: 79%
Maximum cost reduction through offshoring
Completely in agreement: 21%
Total agreement: 74%
Promotional offers proposed by traditional retailers
Completely in agreement: 20%
Total agreement: 72%
Cost reduction through pressure on wages and working conditions
Completely in agreement: 19%
Total agreement: 68%
Market present in all commercial sectors
Completely in agreement: 17%
Total agreement: 67%
Main lesson
Respondents predominantly associate low-cost with cost reduction, specialization of certain companies, and the presence of the model in many sectors.
Source: Cetelem Observatory 2023
The infographic presents the percentage of respondents who agree with several descriptions of the low-cost market. Each item includes the total percentage of agreement and the percentage of those who are “completely in agreement”.
Data by statement
Products are cheaper because they are reduced to the essentials
Completely in agreement: 30%
Total agreement: 83%
Companies specialize in this type of offer
Completely in agreement: 24%
Total agreement: 81%
Traditional companies offer lower-cost ranges
Completely in agreement: 22%
Total agreement: 79%
Maximum cost reduction through offshoring
Completely in agreement: 21%
Total agreement: 74%
Promotional offers proposed by traditional retailers
Completely in agreement: 20%
Total agreement: 72%
Cost reduction through pressure on wages and working conditions
Completely in agreement: 19%
Total agreement: 68%
Market present in all commercial sectors
Completely in agreement: 17%
Total agreement: 67%
Main lesson
Respondents predominantly associate low-cost with cost reduction, specialization of certain companies, and the presence of the model in many sectors.
Source: Cetelem Observatory 2023
Clearly identified products and services
To define the low-cost concept more precisely, Europeans identify four key criteria (Fig. 13). First of all, nearly 8 out of 10 say that low-cost products are identifiable by their lack of frills, in terms of packaging, optional extras, etc. This is a view held most firmly by the Italians and Spanish, while the Slovaks and Swedes are the least likely to point to this characteristic.
Fig 13 – Perception of characteristics associated with low-cost
Download this infographic for your presentations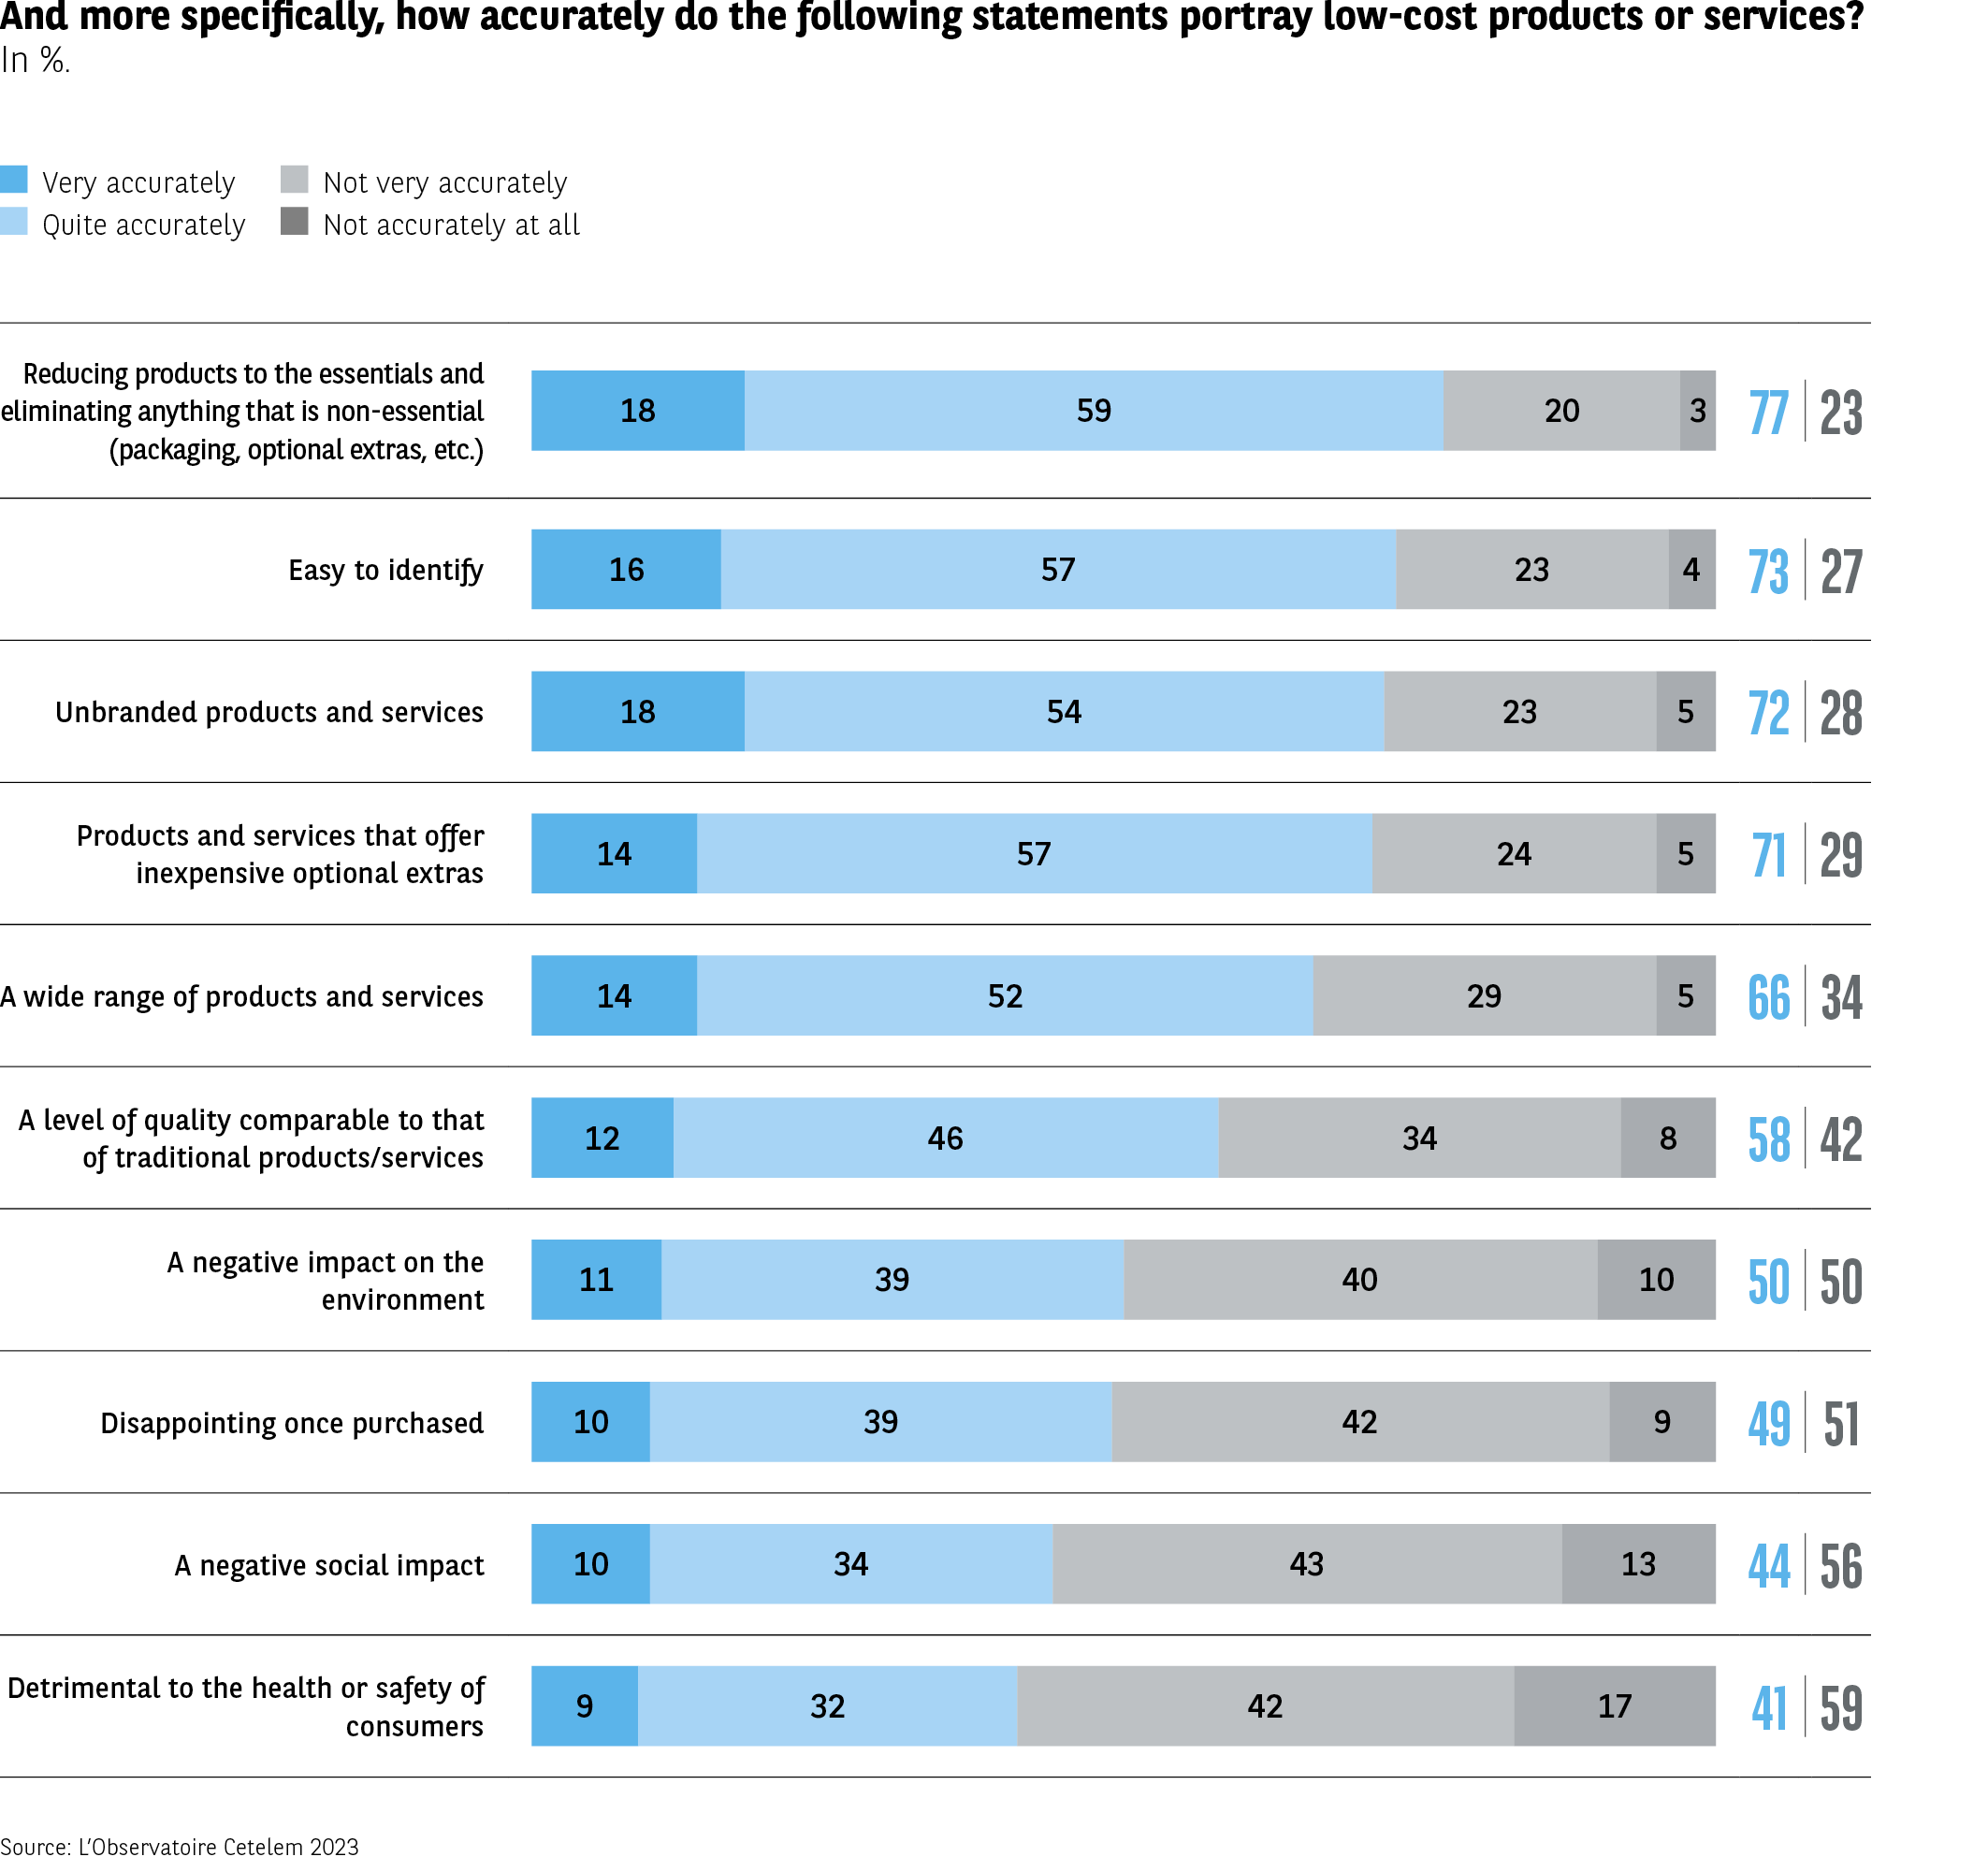 The infographic measures, in percentage, the extent to which ten characteristics “fit well or poorly” with low-cost products or services. Four categories are represented: “Fits very well”, “Fits rather well”, “Fits rather poorly”, “Fits very poorly”.
Data by aspect:
Preserve the essentials of products and eliminate the superfluous (packaging, options)
Fits very well: 18%
Fits rather well: 59%
Fits rather poorly: 20%
Fits very poorly: 3%
Total fits well: 77% – Total fits poorly: 23%
Easy to identify
16% / 57% / 23% / 4%
Total fits well: 73% – Fits poorly: 27%
Unbranded products and services
18% / 54% / 23% / 5%
Total fits well: 72% – Fits poorly: 28%
Products with expensive additional options
14% / 57% / 24% / 5%
Total fits well: 71% – Fits poorly: 29%
Products and services offering a wide range of choices
14% / 52% / 29% / 5%
Total fits well: 66% – Fits poorly: 34%
Quality equivalent to traditional products
12% / 46% / 34% / 8%
Total fits well: 58% – Fits poorly: 42%
Negative impact on the environment
11% / 39% / 40% / 10%
Total fits well: 50% – Fits poorly: 50%
Disappointing once purchased
10% / 39% / 42% / 9%
Total fits well: 49% – Fits poorly: 51%
Negative social impact
10% / 34% / 43% / 13%
Total fits well: 44% – Fits poorly: 56%
Dangerous to health or safety
9% / 32% / 42% / 17%
Total fits well: 41% – Fits poorly: 59%
Aspects related to simplicity and the absence of superfluous features are perceived as the most closely associated with low-cost. Negative dimensions (social impact, health, quality) are more divisive.
Source: Cetelem Observatory 2023
The infographic measures, in percentage, the extent to which ten characteristics “fit well or poorly” with low-cost products or services. Four categories are represented: “Fits very well”, “Fits rather well”, “Fits rather poorly”, “Fits very poorly”.
Data by aspect:
Preserve the essentials of products and eliminate the superfluous (packaging, options)
Fits very well: 18%
Fits rather well: 59%
Fits rather poorly: 20%
Fits very poorly: 3%
Total fits well: 77% – Total fits poorly: 23%
Easy to identify
16% / 57% / 23% / 4%
Total fits well: 73% – Fits poorly: 27%
Unbranded products and services
18% / 54% / 23% / 5%
Total fits well: 72% – Fits poorly: 28%
Products with expensive additional options
14% / 57% / 24% / 5%
Total fits well: 71% – Fits poorly: 29%
Products and services offering a wide range of choices
14% / 52% / 29% / 5%
Total fits well: 66% – Fits poorly: 34%
Quality equivalent to traditional products
12% / 46% / 34% / 8%
Total fits well: 58% – Fits poorly: 42%
Negative impact on the environment
11% / 39% / 40% / 10%
Total fits well: 50% – Fits poorly: 50%
Disappointing once purchased
10% / 39% / 42% / 9%
Total fits well: 49% – Fits poorly: 51%
Negative social impact
10% / 34% / 43% / 13%
Total fits well: 44% – Fits poorly: 56%
Dangerous to health or safety
9% / 32% / 42% / 17%
Total fits well: 41% – Fits poorly: 59%
Aspects related to simplicity and the absence of superfluous features are perceived as the most closely associated with low-cost. Negative dimensions (social impact, health, quality) are more divisive.
Source: Cetelem Observatory 2023
An almost equal proportion believe that low-cost products are easy to identify, because they are unbranded and feature add-ons that are inexpensive when they are available (73%, 72% and 71%). These are attributes that the Spanish and Italians are the most likely to highlight, along with the French and the British on certain points.
Certain more “qualitative” criteria generate mixed responses in the European countries with the most advanced economies. Indeed, more than 1 in 2 German, French and British respondents believe that low-cost products have a negative impact on the environment or are disappointing once purchased. The majority of German and French consumers also agree that low-cost products have a negative social impact.
Decent value for money
Overall, the qualitative aspects of low-cost products leave Europeans somewhat divided. 57% feel that they offer good value for money (Fig. 14).
The vast majority of people are of this opinion and this is especially true in Hungary, Portugal and Slovakia. However, this is a minority view in Belgium and Bulgaria. Regular buyers of low-cost items are more likely to state that they offer good value for money (66%).
Fig 14 – General perception of the quality of low-cost products
Download this infographic for your presentations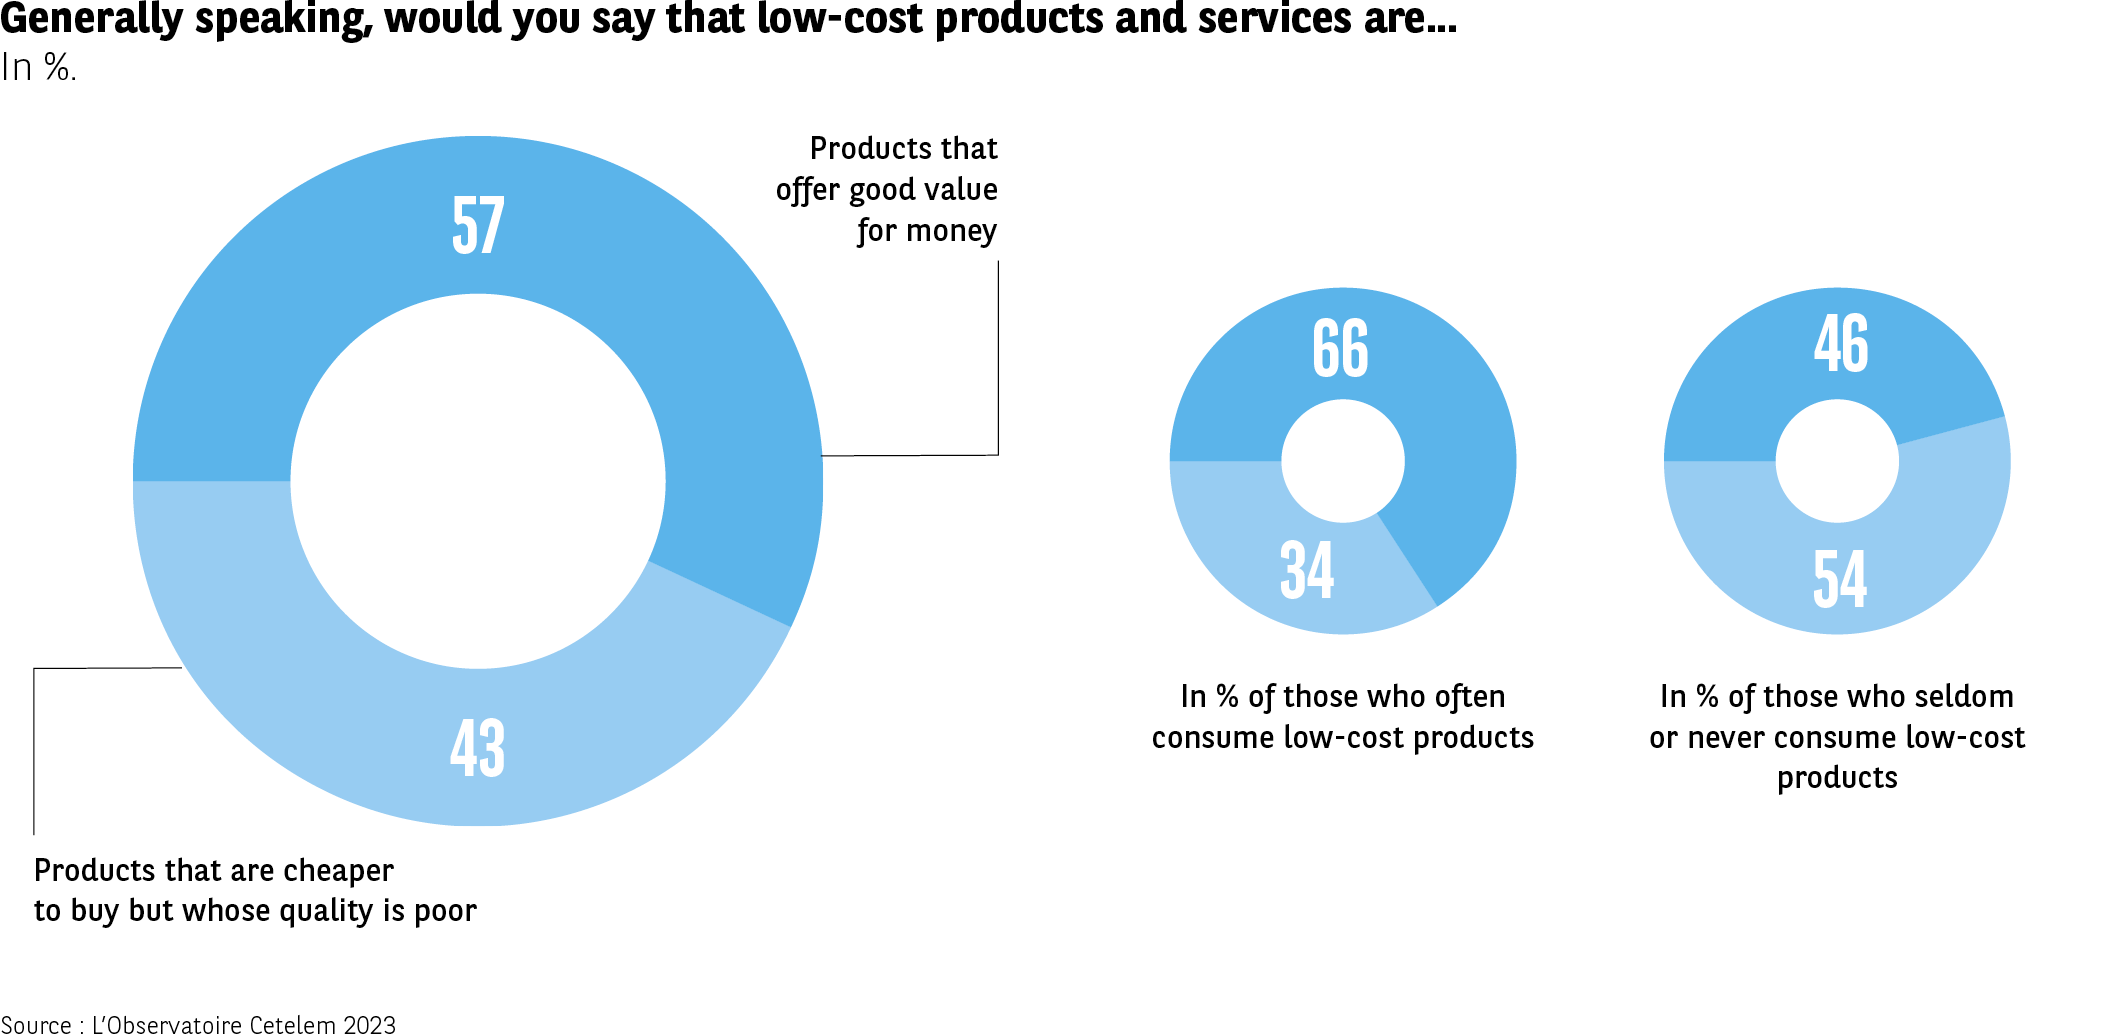 The infographic presents three ring charts. They compare the perception of the quality of low-cost products according to whether respondents consume them frequently or rarely/never.
Chart 1 – Entire population
Good quality/price ratio: 57%
Poor quality: 43%
Chart 2 – Frequent low-cost consumers
Good quality/price ratio: 66%
Poor quality: 34%
Chart 3 – Infrequent or non-consumers
Good quality/price ratio: 46%
Poor quality: 54%
The perception of quality varies greatly depending on usage intensity: frequent consumers are significantly more positive than non-consumers.
Source: Cetelem Observatory 2023
The infographic presents three ring charts. They compare the perception of the quality of low-cost products according to whether respondents consume them frequently or rarely/never.
Chart 1 – Entire population
Good quality/price ratio: 57%
Poor quality: 43%
Chart 2 – Frequent low-cost consumers
Good quality/price ratio: 66%
Poor quality: 34%
Chart 3 – Infrequent or non-consumers
Good quality/price ratio: 46%
Poor quality: 54%
The perception of quality varies greatly depending on usage intensity: frequent consumers are significantly more positive than non-consumers.
Source: Cetelem Observatory 2023
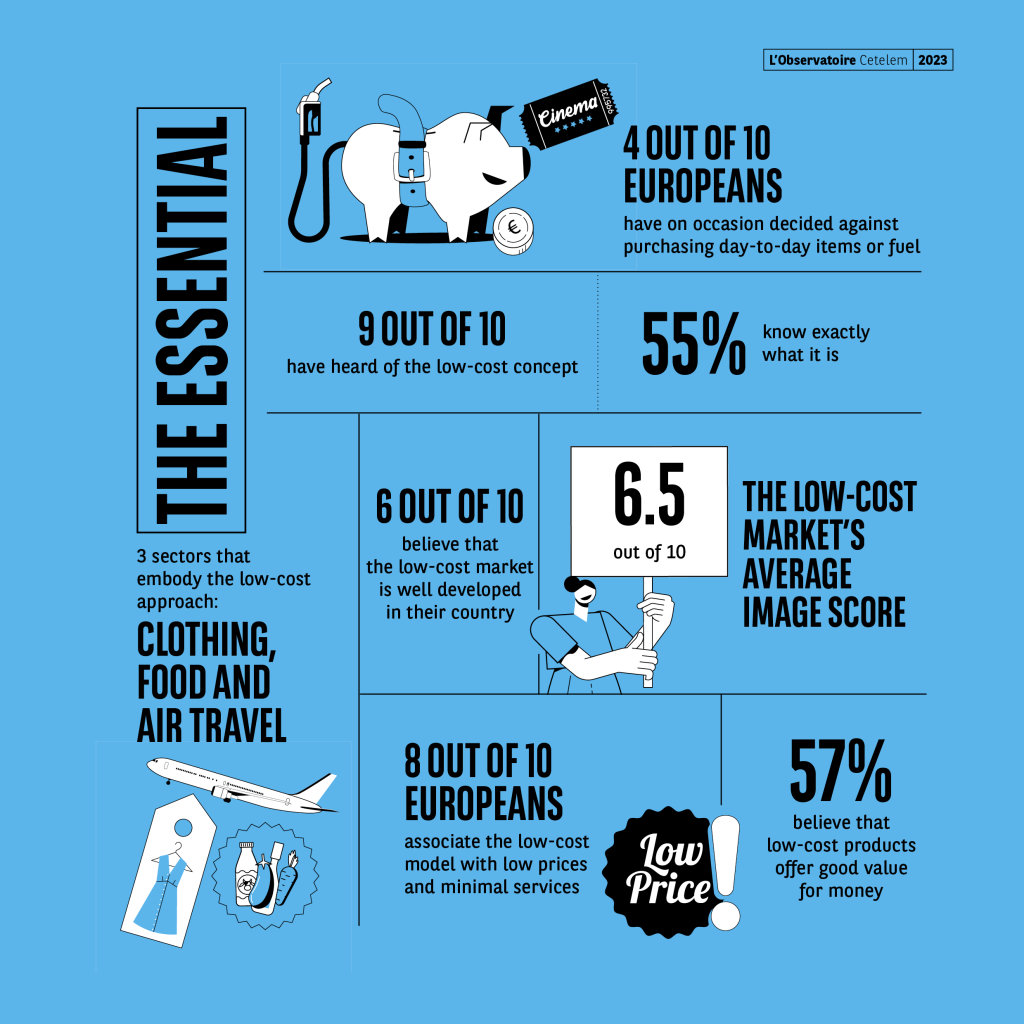
The Essential