Consumption: still a question of price first and foremost


For a long time, at least in the minds of those who were unfamiliar with the concept, it was generally assumed that consumers of low-cost products were keen to keep a low profile. Stores with a stripped-down interior design, limited product ranges and a minimal level of service were considered emblematic of a low-cost model aimed at households that could not afford to shop elsewhere. O tempora, o mores, as Cicero might have remarked. Although it is not exactly fashionable (yet?) to embrace low-cost shopping, the practice is now widespread, whether it be out of choice or necessity.
Consumption: still a question of price first and foremost
The sudden eruption of inflation, like a volcano long thought to be extinct but which has suddenly reawakened, has meant that the issue of price is back at the heart of the economic debate and the daily lives of consumers.
Price above all, especially for those on low incomes
The Europeans surveyed consider price to be the most important criterion when buying a product, far ahead of quality. Overall, this is true for 6 out of 10 respondents (Fig. 15). It is particularly important for the Portuguese, Poles, Slovaks and Hungarians (76%, 74%, 69% and 69%), while Swedish and French consumers pay almost as much attention to price as they do to quality (52% and 55%).
While all the generations place an equal emphasis on price, the differences observed between income groups are naturally much clearer. 70% of Europeans on low incomes place this criterion above the rest, compared with only 51% of those on high incomes.
Fig 15 – Main selection criterion between price and quality
Download this infographic for your presentations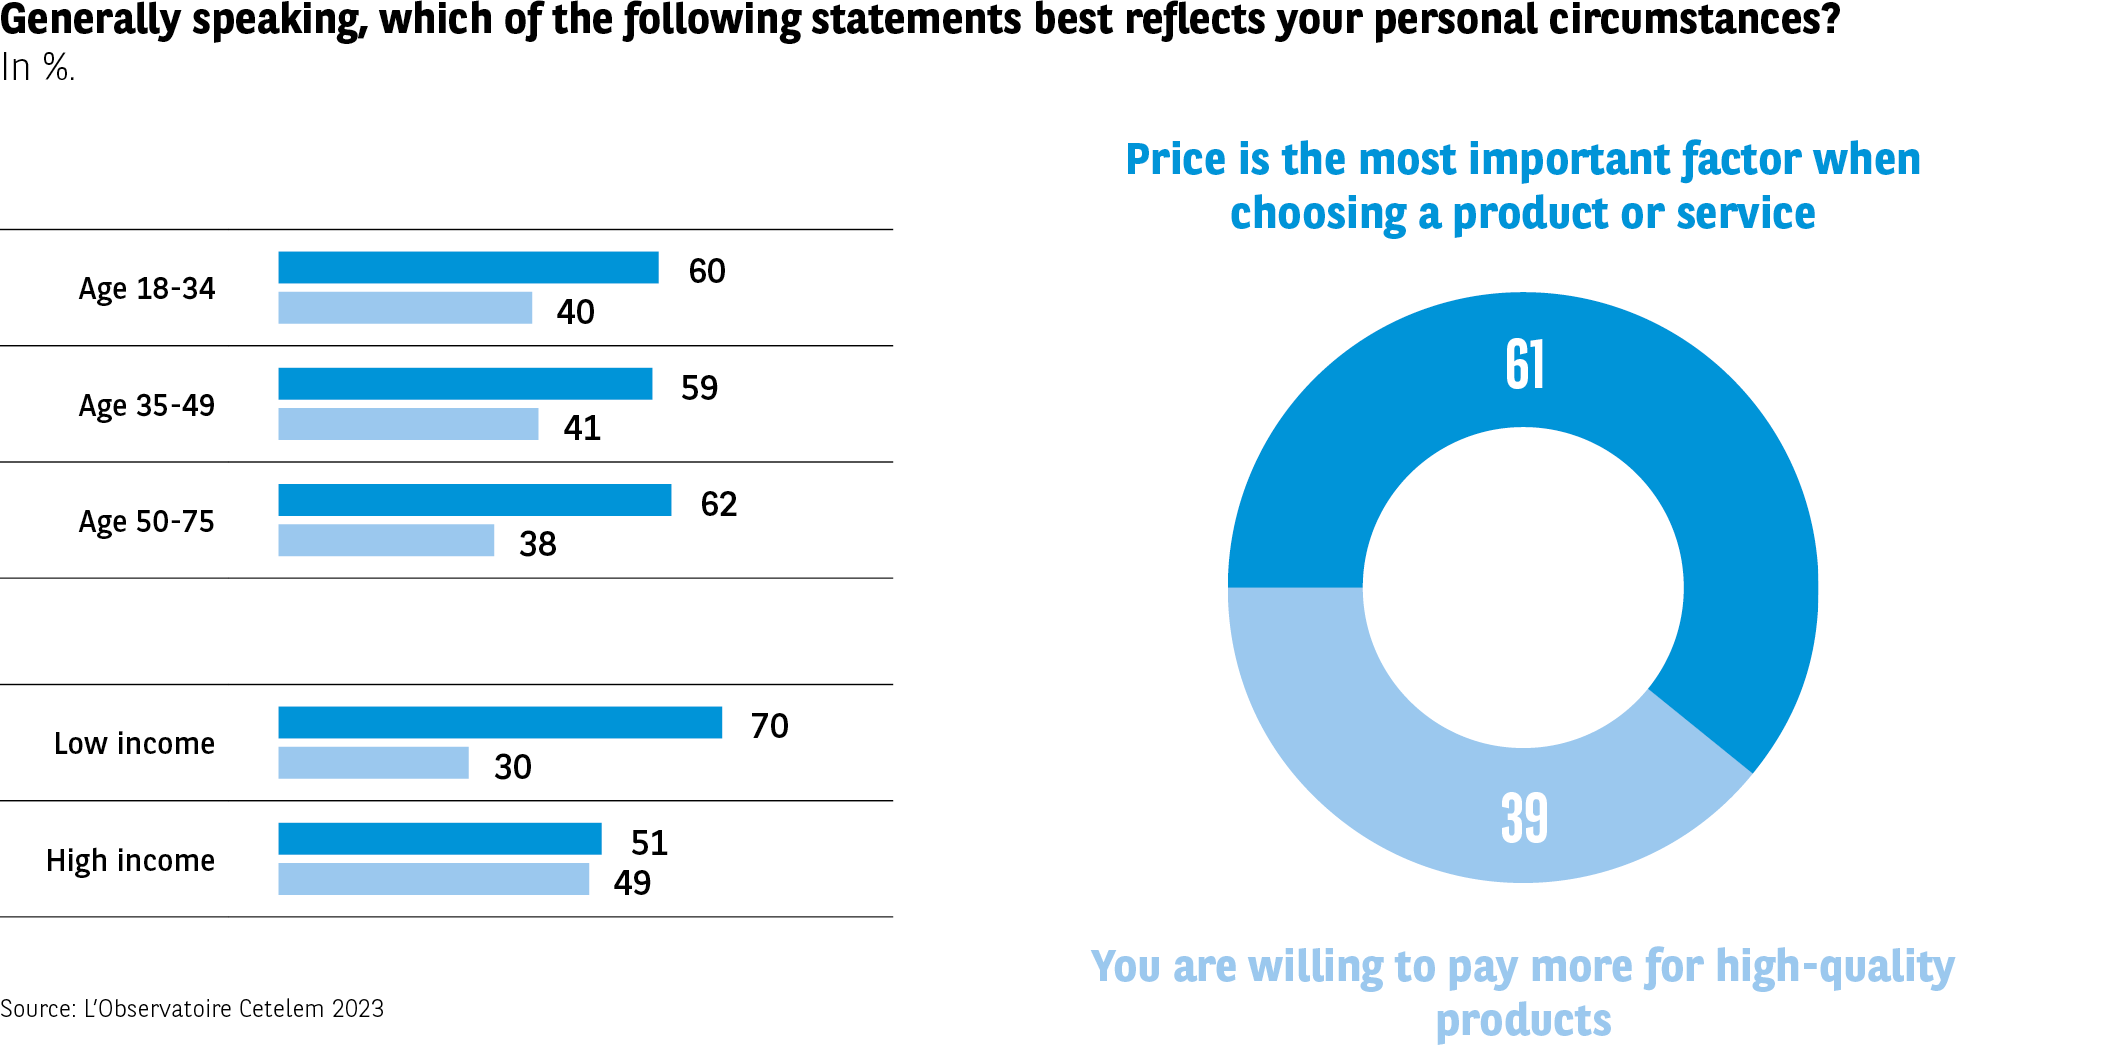 The infographic presents the responses to the question: “In general, which of the following statements best corresponds to your personal situation?” Two options are proposed:
“The price is the most important criterion”
“You are willing to pay more for quality products”
The results are broken down by age and income level, and then represented globally in a ring chart.
Data by age:
18-34 years
Price priority: 60%
Quality priority: 40%
35-49 years
Price: 59%
Quality: 41%
50-75 years
Price: 62%
Quality: 38%
Data by income level:
Low income
Price: 70%
Quality: 30%
High income
Price: 51%
Quality: 49%
Ring chart (all respondents)
Price priority: 61%
Quality priority: 39%
The majority of respondents prioritize price, with significant differences between income levels. Differences between age groups exist but are more limited.
Source: Cetelem Observatory 2023
The infographic presents the responses to the question: “In general, which of the following statements best corresponds to your personal situation?” Two options are proposed:
“The price is the most important criterion”
“You are willing to pay more for quality products”
The results are broken down by age and income level, and then represented globally in a ring chart.
Data by age:
18-34 years
Price priority: 60%
Quality priority: 40%
35-49 years
Price: 59%
Quality: 41%
50-75 years
Price: 62%
Quality: 38%
Data by income level:
Low income
Price: 70%
Quality: 30%
High income
Price: 51%
Quality: 49%
Ring chart (all respondents)
Price priority: 61%
Quality priority: 39%
The majority of respondents prioritize price, with significant differences between income levels. Differences between age groups exist but are more limited.
Source: Cetelem Observatory 2023
Price or quality, it all depends on the sector
And yet, this overarching perspective and the dominance of the price factor mask the more diverse views expressed when consumer sectors are considered individually.
In some sectors, price is clearly stated as being the dominant factor in spending decisions.
For energy, the gap between price and quality is 24 points (55% vs. 31%), while for transport it stands at 18 points (53% vs. 35%).
In contrast, people’s pursuit of quality clearly prevails when it comes to buying household appliances (+14 points), digital devices (+11 points) or vehicles (+8 points). Although these products tend to be costly, which one might imagine would prompt consumers to seek the lowest prices possible, their reliability, their durability and, therefore, their quality are nonetheless essential in their eyes. It is also worth noting that regardless of the sector in question, the brand or retailer is never the overriding criterion governing people’s choices.
In the three sectors best known for their low-cost offerings, opinions are balanced
If we focus on the three sectors that best represent the low-cost philosophy, price takes priority when it comes to air travel and clothing, but only to a moderate extent. Indeed, the gap between price and quality is 10 points for air travel and just 3 points for clothing. In the food sector, quality has a slim 1-point lead (Fig. 16).
Fig 16 – Primary selection criterion by sector
Download this infographic for your presentations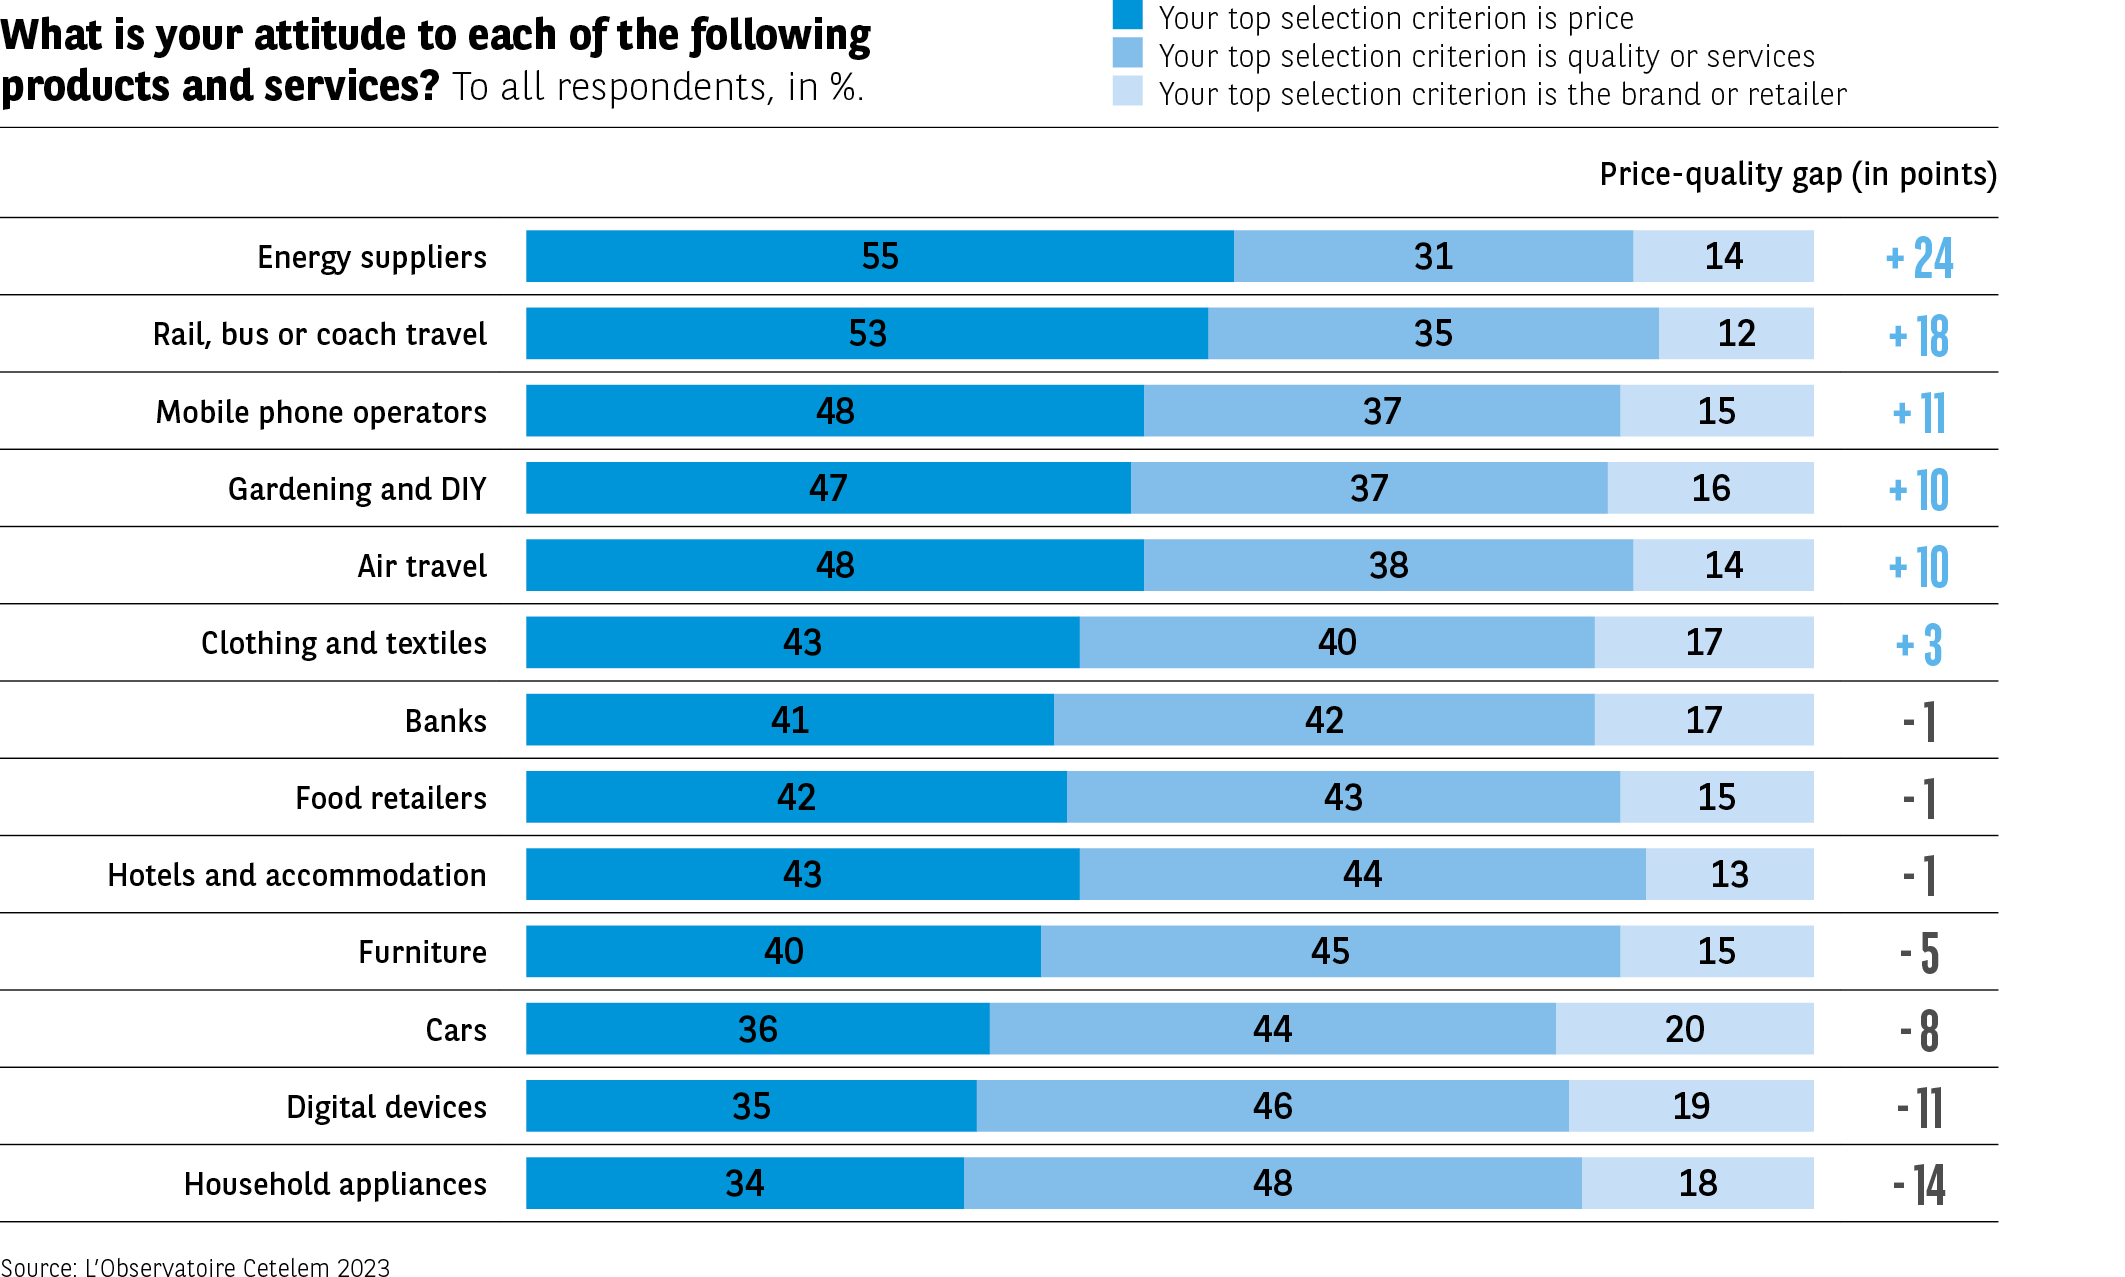 The infographic shows, for various products and services, how respondents prioritise their purchase criteria:
Detailed data by sector:
Energy suppliers: 55%, 31%, 14%, gap +24.
Rail and coach/bus transport: 53%, 35%, 12%, gap +18.
Mobile operators: 48%, 37%, 15%, gap +11.
Gardening and DIY: 47%, 37%, 16%, gap +10.
Air transport: 48%, 38%, 14%, gap +10.
Clothing and textiles: 43%, 40%, 17%, gap +3.
Banks: 41%, 42%, 17%, gap –1.
Food retailers: 42%, 43%, 15%, gap –1.
Hotels and accommodation: 41%, 44%, 13%, gap –1.
Furniture: 40%, 45%, 15%, gap –5.
Automotive: 36%, 44%, 20%, gap –8.
Digital tools: 35%, 46%, 19%, gap –11.
Home appliances: 34%, 48%, 18%, gap –14.
Price is dominant in essential or highly competitive sectors, while quality is more decisive in categories like appliances, cars and digital tools.
The infographic shows, for various products and services, how respondents prioritise their purchase criteria:
Detailed data by sector:
Energy suppliers: 55%, 31%, 14%, gap +24.
Rail and coach/bus transport: 53%, 35%, 12%, gap +18.
Mobile operators: 48%, 37%, 15%, gap +11.
Gardening and DIY: 47%, 37%, 16%, gap +10.
Air transport: 48%, 38%, 14%, gap +10.
Clothing and textiles: 43%, 40%, 17%, gap +3.
Banks: 41%, 42%, 17%, gap –1.
Food retailers: 42%, 43%, 15%, gap –1.
Hotels and accommodation: 41%, 44%, 13%, gap –1.
Furniture: 40%, 45%, 15%, gap –5.
Automotive: 36%, 44%, 20%, gap –8.
Digital tools: 35%, 46%, 19%, gap –11.
Home appliances: 34%, 48%, 18%, gap –14.
Price is dominant in essential or highly competitive sectors, while quality is more decisive in categories like appliances, cars and digital tools.
Regarding air travel, only Italy and Spain choose quality over price, while the opposite is true chiefly in Eastern European countries.
As for clothing, Italy and Spain are again the keenest on quality, along with the UK and Sweden. Once again, two Eastern European countries, the Czech Republic and Slovakia, place the greatest emphasis on price. When it comes to food, six countries choose quality over price, with Italy leading the way in this area. Once more, Eastern Europeans prioritise price.
An opportunity to consume more
In the current climate, where price is a crucial factor in people’s consumption, the low-cost model evidently allows them to consume more. Indeed, 77% of respondents take this view. This is a similar score to that reported by L’Observatoire Cetelem de la Consommation in 2009. If one considers that 82% of consumers believe that the hard-discount model, a close relation of the low-cost approach, is also a good way of achieving this goal, there is no doubt that they are well aware of how these two concepts are positioned (Fig. 17). However, there is one solution that seems to be even more effective: reducing spending on non-priority items so as to boost one’s purchasing potential (86%). When it comes to this trio of strategies for freeing up funds in order to spend more, Portugal and Romania clearly stand out from the other countries, while Belgium and France sit at the other end of the scale.
Fig 17 – Solutions considered for increasing consumption
Download this infographic for your presentations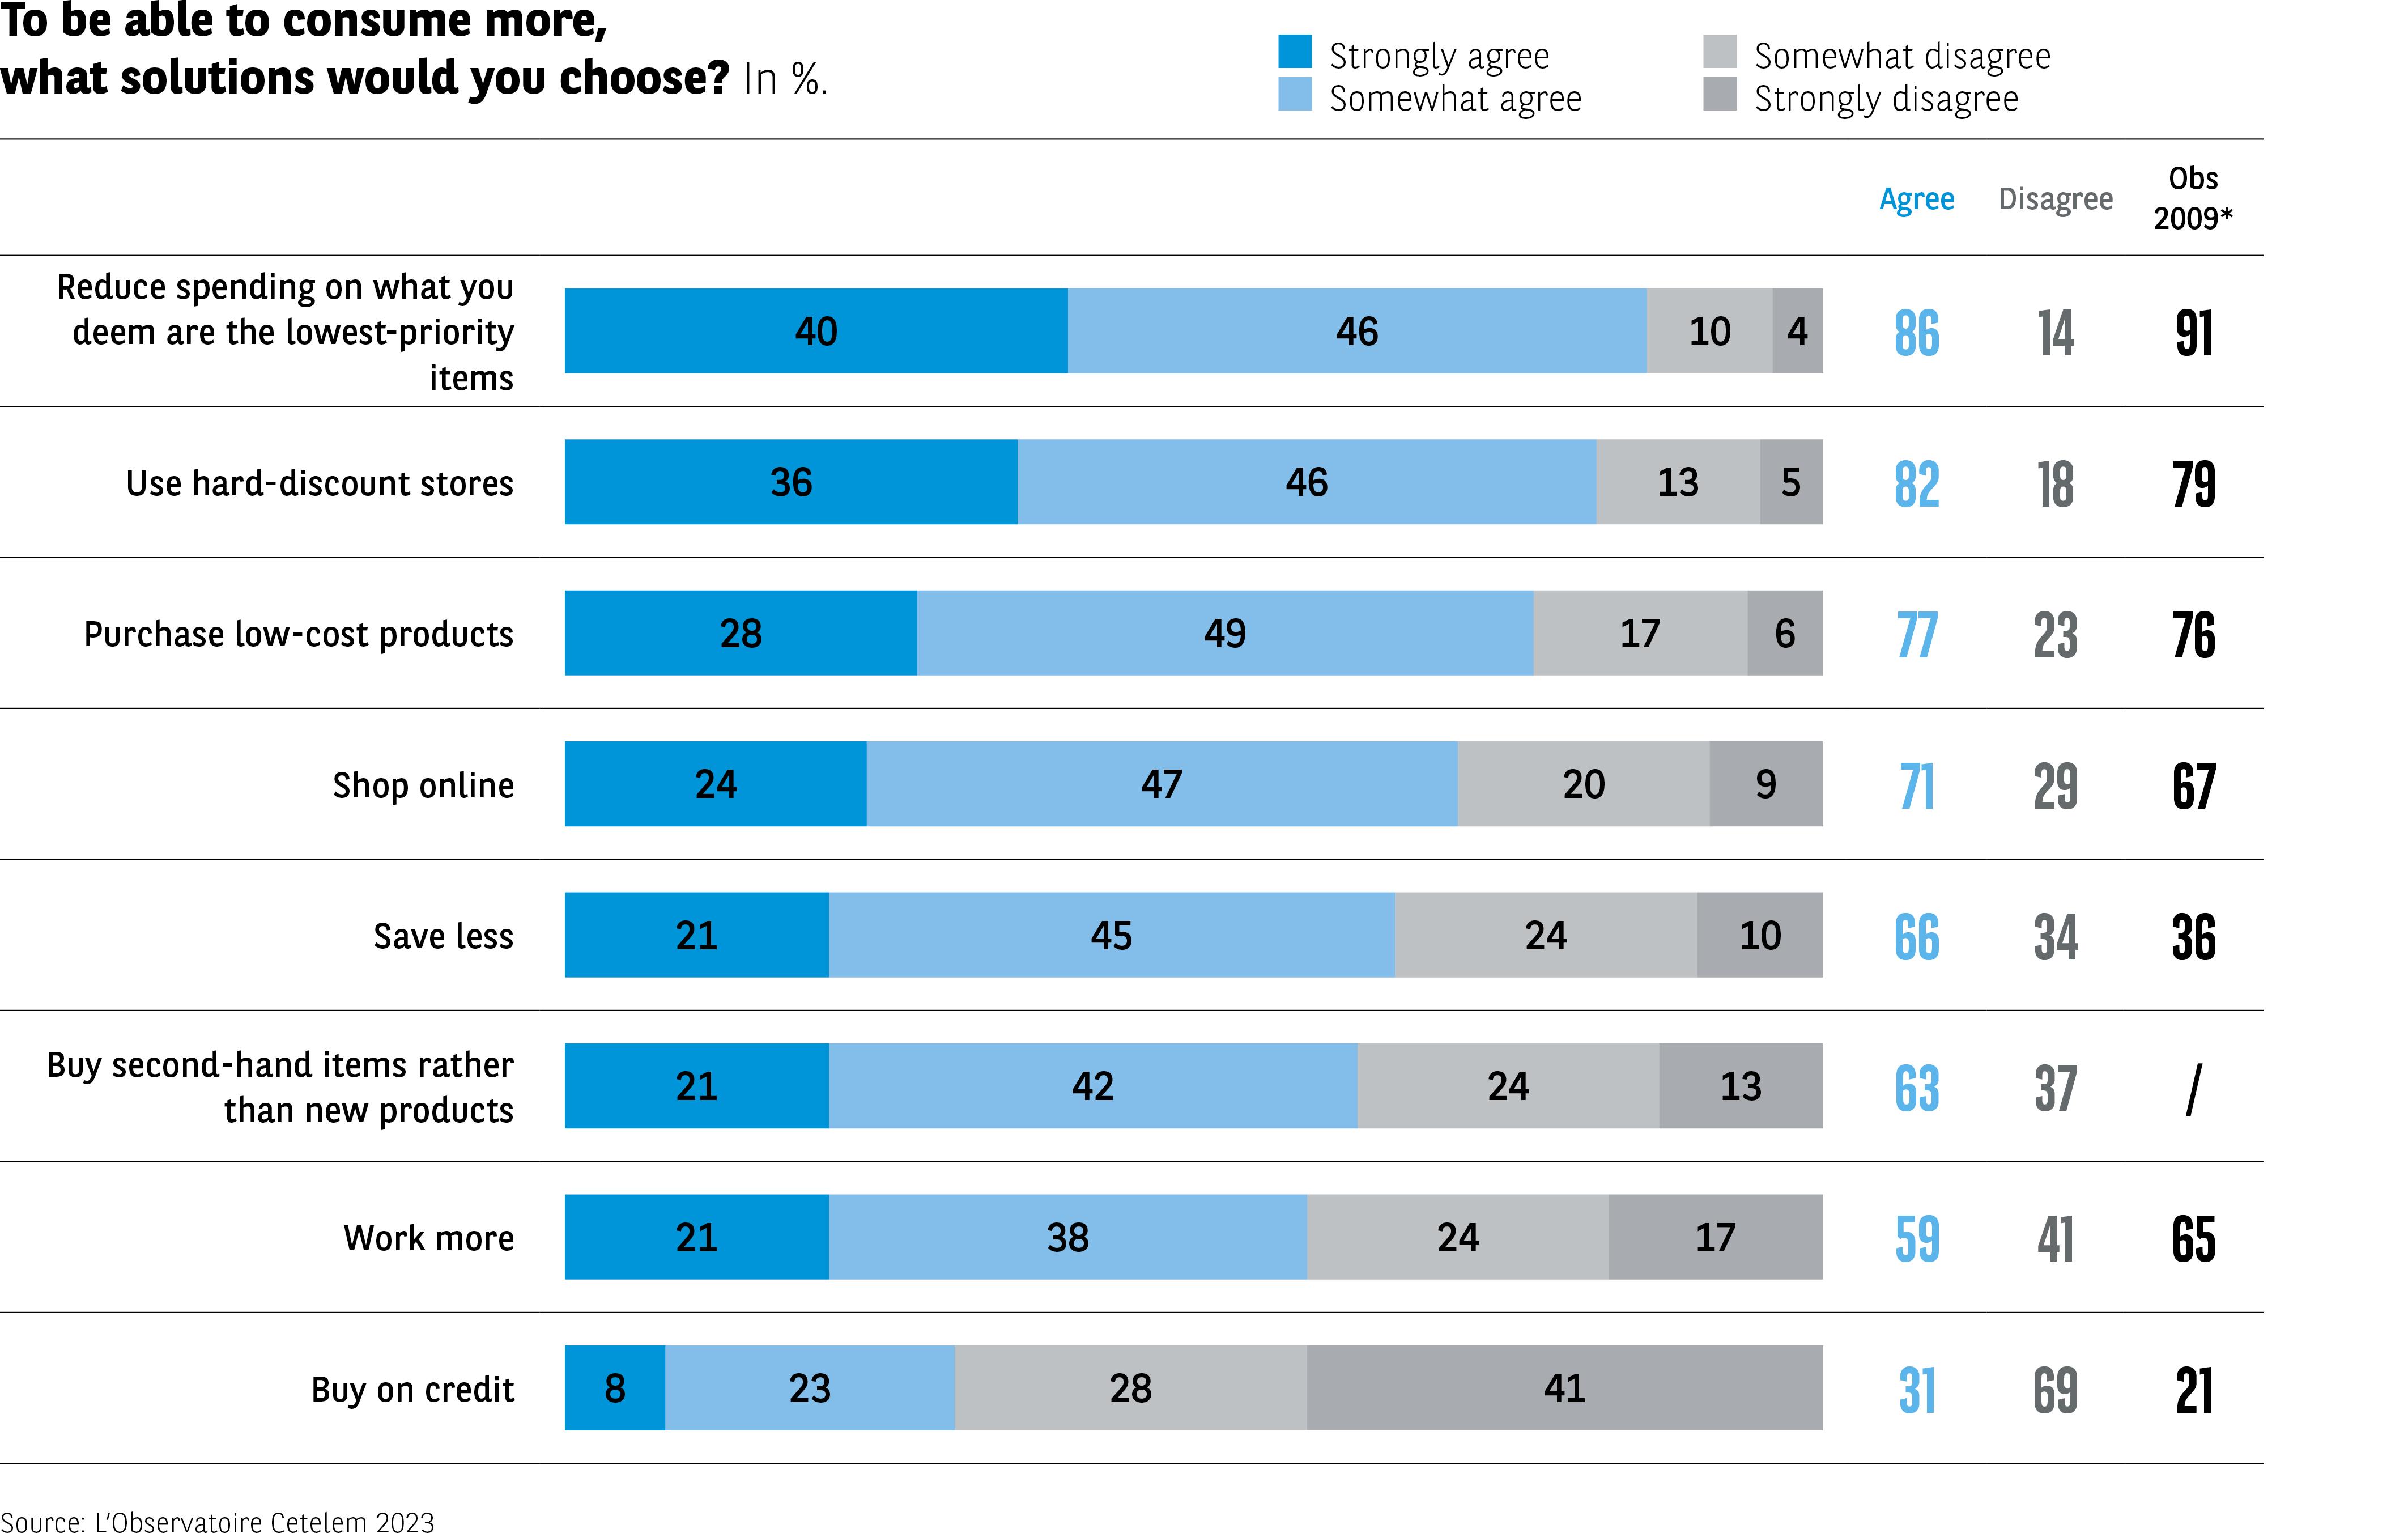 The infographic indicates, in percentage, the level of agreement with different types of solutions for consuming more. Four modalities are proposed: “Completely agree”, “Rather agree”, “Rather disagree”, “Completely disagree”. The totals “agree” and “disagree” are displayed at the end of the line, with the observed value in 2009 when available.
Data by solution:
Reduce spending on less priority items
Completely agree: 40%
Rather agree: 46%
Rather disagree: 10%
Completely disagree: 4%
Total agree: 86% – Disagree: 14% – Obs. 2009: 91%
Use hard discount
36% / 46% / 13% / 5%
Total agree: 82% – Disagree: 18% – Obs. 2009: 79%
Use low-cost options
28% / 49% / 17% / 6%
Total agree: 77% – Disagree: 23% – Obs. 2009: 76%
Buy online
24% / 47% / 20% / 9%
Total agree: 71% – Disagree: 29% – Obs. 2009: 67%
Reduce savings
21% / 45% / 24% / 10%
Total agree: 66% – Disagree: 34% – Obs. 2009: 36%
Buy second-hand instead of new
21% / 42% / 24% / 13%
Total agree: 63% – Disagree: 37% – Obs. 2009: not indicated
Work more
21% / 38% / 24% / 17%
Total agree: 59% – Disagree: 41% – Obs. 2009: 65%
Use credit
8% / 23% / 28% / 41%
Total agree: 31% – Disagree: 69% – Obs. 2009: 21%
The preferred solutions focus on adjusting the budget (reducing secondary items, discount formats). Using credit remains the least popular solution.
Source: Cetelem Observatory 2023
The infographic indicates, in percentage, the level of agreement with different types of solutions for consuming more. Four modalities are proposed: “Completely agree”, “Rather agree”, “Rather disagree”, “Completely disagree”. The totals “agree” and “disagree” are displayed at the end of the line, with the observed value in 2009 when available.
Data by solution:
Reduce spending on less priority items
Completely agree: 40%
Rather agree: 46%
Rather disagree: 10%
Completely disagree: 4%
Total agree: 86% – Disagree: 14% – Obs. 2009: 91%
Use hard discount
36% / 46% / 13% / 5%
Total agree: 82% – Disagree: 18% – Obs. 2009: 79%
Use low-cost options
28% / 49% / 17% / 6%
Total agree: 77% – Disagree: 23% – Obs. 2009: 76%
Buy online
24% / 47% / 20% / 9%
Total agree: 71% – Disagree: 29% – Obs. 2009: 67%
Reduce savings
21% / 45% / 24% / 10%
Total agree: 66% – Disagree: 34% – Obs. 2009: 36%
Buy second-hand instead of new
21% / 42% / 24% / 13%
Total agree: 63% – Disagree: 37% – Obs. 2009: not indicated
Work more
21% / 38% / 24% / 17%
Total agree: 59% – Disagree: 41% – Obs. 2009: 65%
Use credit
8% / 23% / 28% / 41%
Total agree: 31% – Disagree: 69% – Obs. 2009: 21%
The preferred solutions focus on adjusting the budget (reducing secondary items, discount formats). Using credit remains the least popular solution.
Source: Cetelem Observatory 2023
A multi-faceted appeal
But while the low-cost model appeals for reasons of price, it is not the only argument that might convince consumers of its merits. A whole array of factors make it an attractive proposition.
As well as allowing people to spend less so that they can afford to buy more products, the low-cost model caters for various expectations, particularly when it comes to offering value for money (26% vs. 25%). The majority of Italians place the first of these criteria at the top of their list, while the Portuguese favour the second (34% and 35%).
Another often-cited element, which this time has little to do with choice, is the idea that low-cost offerings are the only option for Europeans with modest financial resources, an issue that we will expand upon later (16%). Residents of Eastern European countries are more likely to stress this point than other respondents.
Going down the low-cost route is also seen as an effective way of reducing spending or avoiding paying more for products that look the same, irrespective of where they are bought (13% and 12%). Lastly, people choose low-cost options due to their ease of access (8 %) (Fig. 18).
Fig 18 – Primary reason for choosing low-cost products or services
Download this infographic for your presentations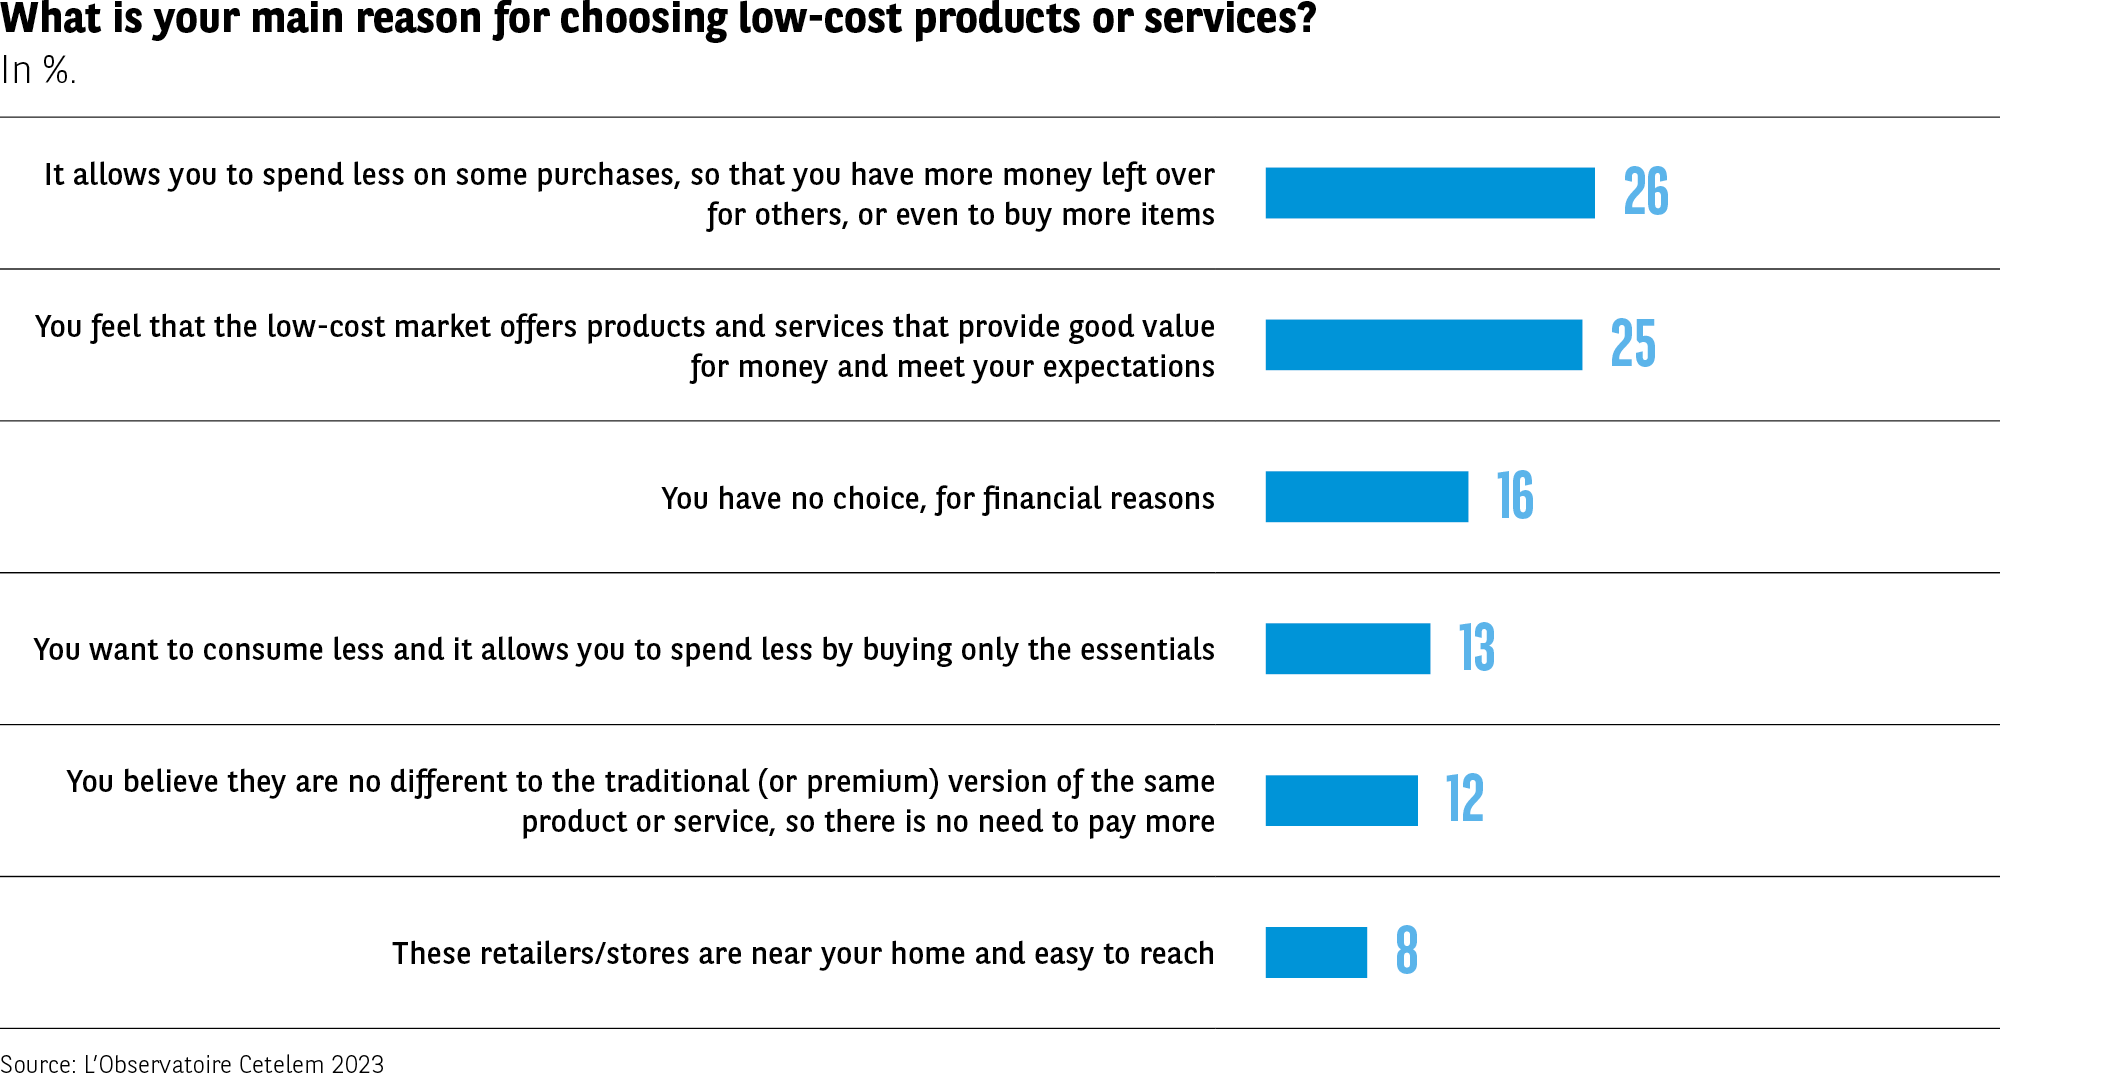 The infographic details the main reasons motivating the purchase of low-cost products or services. The percentages correspond to the share of respondents citing each reason as the primary one.
Data
Reduce certain expenses to buy more or buy something else: 26%
Good quality-price ratio that meets expectations: 25%
Lack of choice due to financial reasons: 16%
Desire to consume less / limit oneself to the essentials: 13%
No perceived difference with traditional products: 12%
Convenient and easily accessible stores: 8%
The primary motivations relate to optimizing purchasing power and the quality-price ratio. Financial constraints come in third place.
Source: Cetelem Observatory 2023
The infographic details the main reasons motivating the purchase of low-cost products or services. The percentages correspond to the share of respondents citing each reason as the primary one.
Data
Reduce certain expenses to buy more or buy something else: 26%
Good quality-price ratio that meets expectations: 25%
Lack of choice due to financial reasons: 16%
Desire to consume less / limit oneself to the essentials: 13%
No perceived difference with traditional products: 12%
Convenient and easily accessible stores: 8%
The primary motivations relate to optimizing purchasing power and the quality-price ratio. Financial constraints come in third place.
Source: Cetelem Observatory 2023