A future secured…


While the low-cost model was immediately able to win over the least wealthy consumers, it took a while to be accepted by a wider clientele. There were also variations from sector to sector. It is undeniable that the concept’s adoption by the airline industry, among others, has done a great deal to accelerate the trend. But as is often the case when we talk about growth and success, one might wonder if a ceiling has been attained – regardless of whether or not it is “glass” – or even if the model is losing ground. However, the low-cost approach is clearly not struggling yet, although it will need to remain true to itself if that is to continue.
A future secured…
The low-cost philosophy is now firmly established in the European consumer landscape. As noted earlier, the model successfully appeals to many outside what might be considered its natural target group, namely low-income households, although this appeal remains moderate and the concept arouses little passion.
Consumption is rising
The low-cost market appears to be able to rely on the trust of consumers for its continued growth. Over the last year, almost 4 out of 10 Europeans have increased their consumption of low-cost products. Only 16% have reduced it over the same period (Fig. 28). The price advantages of low-cost products have a lot to do with this, especially in the current inflationary climate.
Fig 28 – Evolution of low-cost purchases over one year
Download this infographic for your presentations Infographic presenting the evolution of low-cost product or service purchases over the past year, among concerned consumers. A ring chart displays three possible responses: more, less, or neither more nor less. Two horizontal bars detail these same responses according to whether low-cost consumption is a choice or a constraint.
Visual elements and data:
Ring chart (global responses, in %)
More: 39%
Less: 16%
Neither more nor less: 45%
Low-cost consumption by choice (horizontal bar, in %)
More: 35%
Less: 14%
Neither more nor less: 51%
Low-cost consumption by constraint (horizontal bar, in %)
More: 43%
Less: 19%
Neither more nor less: 38%
The majority declare buying the same amount or more low-cost products than a year ago, with a higher proportion of “increased” purchases among constrained consumers.
Source: Cetelem Observatory 2023.
Infographic presenting the evolution of low-cost product or service purchases over the past year, among concerned consumers. A ring chart displays three possible responses: more, less, or neither more nor less. Two horizontal bars detail these same responses according to whether low-cost consumption is a choice or a constraint.
Visual elements and data:
Ring chart (global responses, in %)
More: 39%
Less: 16%
Neither more nor less: 45%
Low-cost consumption by choice (horizontal bar, in %)
More: 35%
Less: 14%
Neither more nor less: 51%
Low-cost consumption by constraint (horizontal bar, in %)
More: 43%
Less: 19%
Neither more nor less: 38%
The majority declare buying the same amount or more low-cost products than a year ago, with a higher proportion of “increased” purchases among constrained consumers.
Source: Cetelem Observatory 2023.
More low-cost consumption in the future
Many people have said yes to more low-cost purchases in recent times, and just over 4 out of 10 Europeans will also say yes in the near future. Just as many say they will consume the same amount. One country, Portugal, stands apart for its keenness to ramp up its low-cost purchases, with 6 out of 10 Portuguese respondents expressing this intention.
There are no significant differences between the survey’s 14 remaining nations, with each country posting scores close to the overall average. With only 37% of consumers thinking of increasing their low-cost consumption, France posts the lowest figure, just ahead of Bulgaria and Belgium (39% and 40%) (Fig. 29).
Fig 29 – Future intentions for low-cost consumption
Download this infographic for your presentations Infographic presenting, by country, the intention to consume more, less, or the same amount of low-cost products in the future.
Legend:
Less
Neither more nor less
More
Average of 15 countries:
Less: 13%
Neither more nor less: 44%
More: 43%
Data by country (Less / Neither more nor less / More)
Germany: 17 / 39 / 44
Austria: 16 / 39 / 45
Belgium: 13 / 47 / 40
Bulgaria: 17 / 44 / 39
Spain: 9 / 48 / 43
France: 10 / 53 / 37
Hungary: 15 / 40 / 45
Italy: 12 / 45 / 43
Poland: 14 / 44 / 42
Portugal: 6 / 34 / 60
Czech Republic: 14 / 41 / 45
Romania: 19 / 33 / 48
United Kingdom: 11 / 42 / 47
Slovakia: 18 / 40 / 42
Sweden: 12 / 46 / 42
In the majority of countries, the intention to consume more low-cost products exceeds or equals the intention to remain stable, with significant variations depending on national markets.
Source: Cetelem Observatory 2023.
Infographic presenting, by country, the intention to consume more, less, or the same amount of low-cost products in the future.
Legend:
Less
Neither more nor less
More
Average of 15 countries:
Less: 13%
Neither more nor less: 44%
More: 43%
Data by country (Less / Neither more nor less / More)
Germany: 17 / 39 / 44
Austria: 16 / 39 / 45
Belgium: 13 / 47 / 40
Bulgaria: 17 / 44 / 39
Spain: 9 / 48 / 43
France: 10 / 53 / 37
Hungary: 15 / 40 / 45
Italy: 12 / 45 / 43
Poland: 14 / 44 / 42
Portugal: 6 / 34 / 60
Czech Republic: 14 / 41 / 45
Romania: 19 / 33 / 48
United Kingdom: 11 / 42 / 47
Slovakia: 18 / 40 / 42
Sweden: 12 / 46 / 42
In the majority of countries, the intention to consume more low-cost products exceeds or equals the intention to remain stable, with significant variations depending on national markets.
Source: Cetelem Observatory 2023.
Continued growth in most sectors
If European consumers are to be believed, further growth is set to take place in the majority of sectors. Two of the industries that best represent the low-cost concept, namely food and clothing, enjoy the strongest growth prospects (54% and 52%). The third sector that typifies the concept, air travel, scores slightly lower, but remains in line with the overall average (44%). This could be a sign that Europeans believe the sector has matured, but also that the current economic and political climate is less conducive to travel.
Other sectors, which up until now had not been particularly closely associated with the low-cost model, are now fuelling the expectations of Europeans, who see new technologies, mobile telephony, energy and household appliances heading more resolutely down this path over the coming years. This is much less true for banking and housing, the two areas perceived as having the weakest growth prospects (Fig. 30).
Fig 30 – Perception of the future of the low-cost market by sector
Download this infographic for your presentations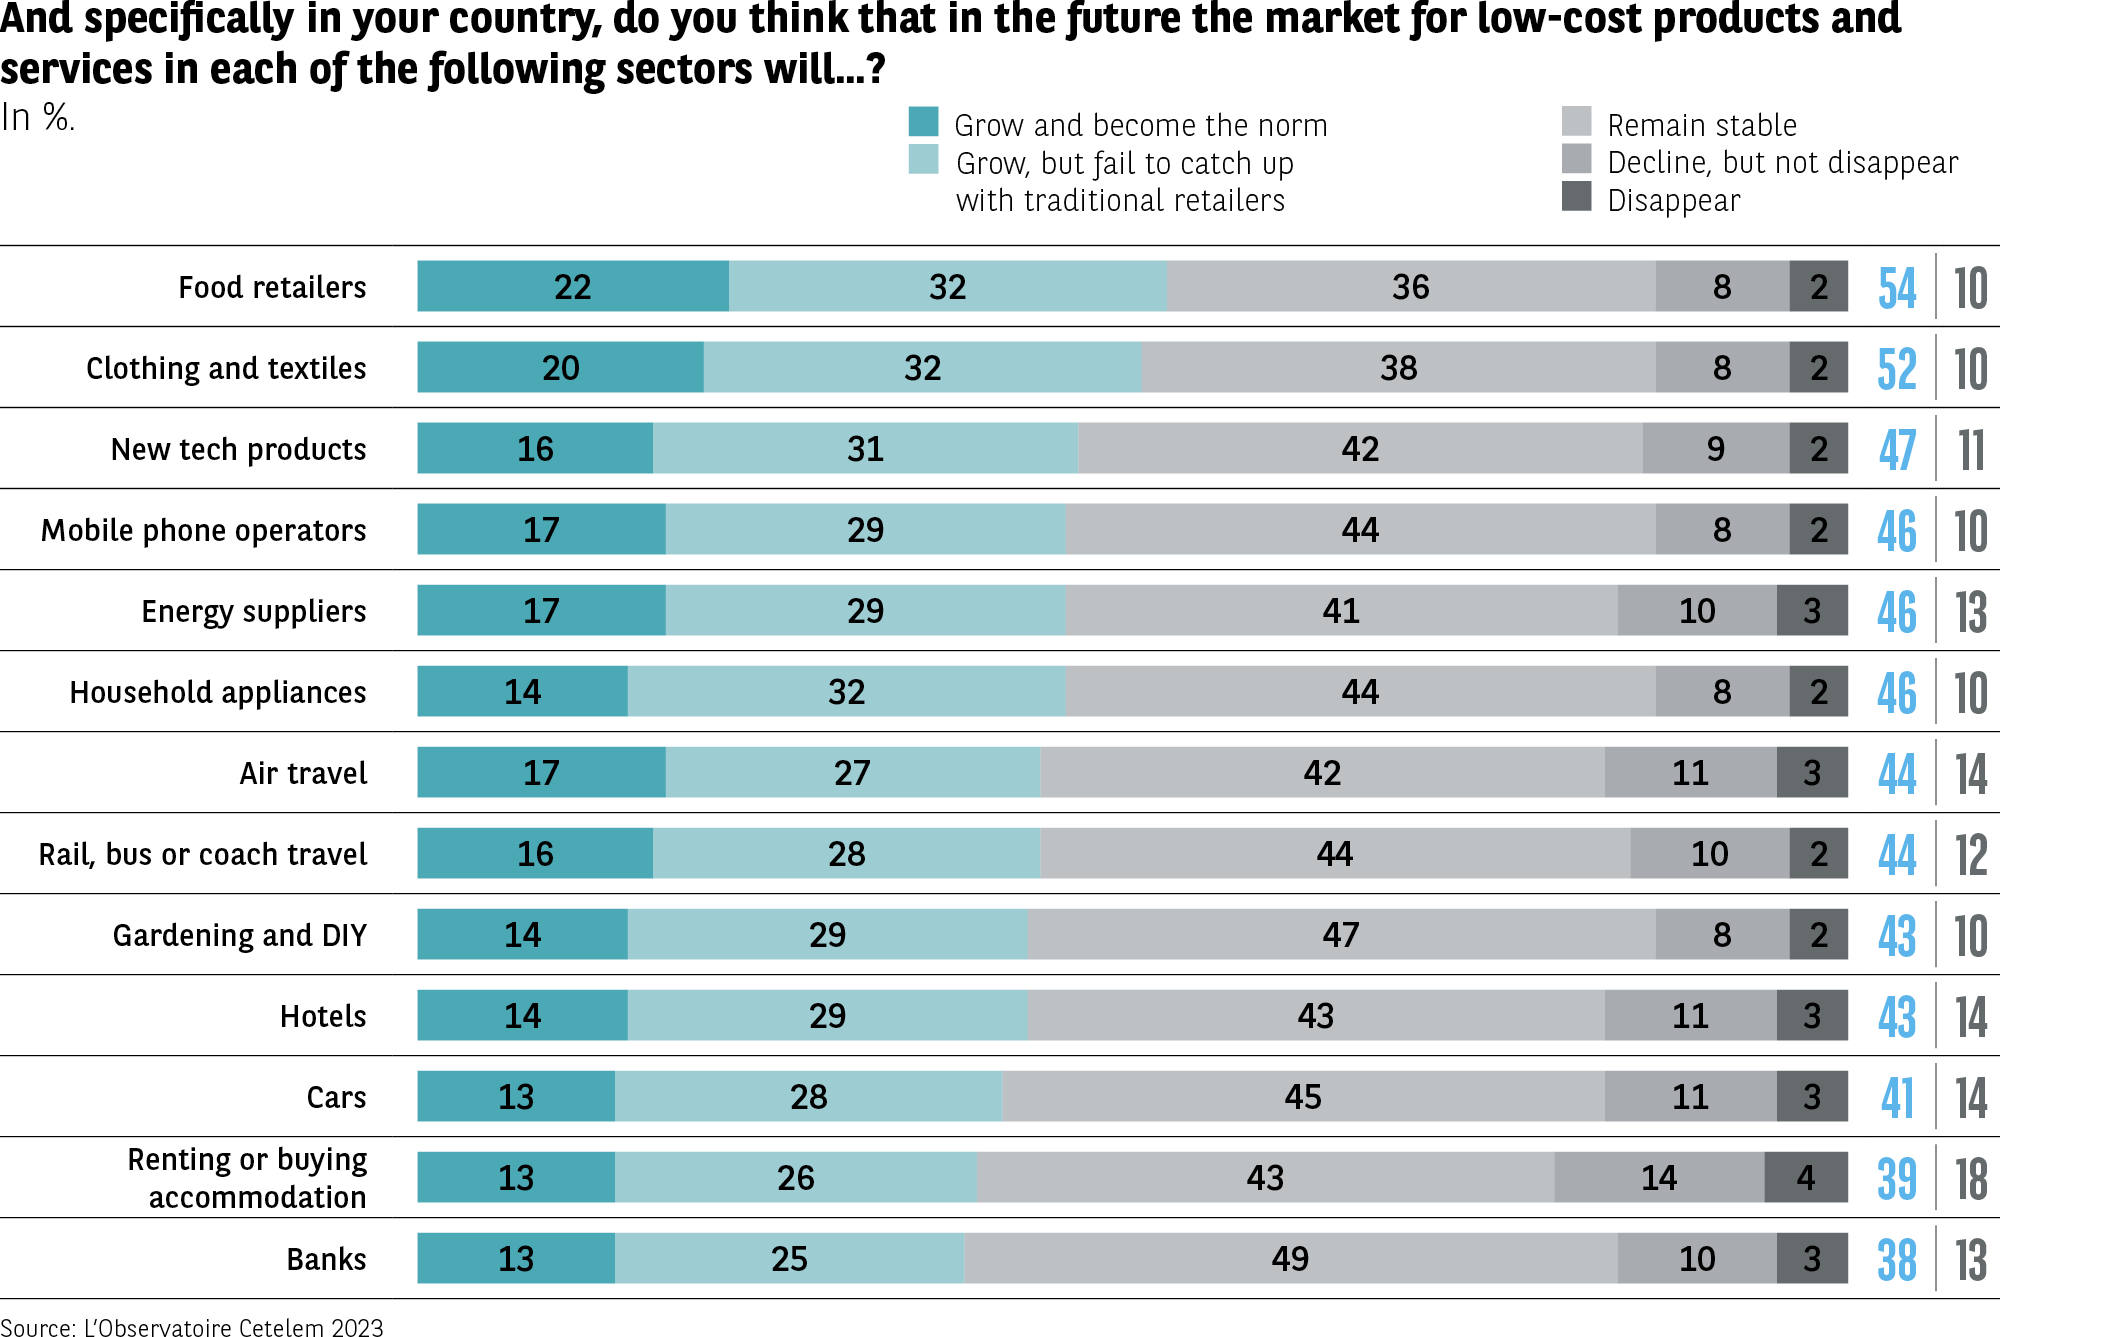 Infographic presenting the opinion of consumers, in %, on the future evolution of the low-cost product and service market in different sectors of activity.
Legend (response categories):
Will develop and become the norm
Will develop but remain less important
Will remain stable
Will decline but not disappear
Will disappear
Each line corresponds to a sector with the associated percentages.
Data by sector (in %):
Food retailers: 22 / 32 / 36 / 8 / 2
Clothing, textiles: 20 / 32 / 38 / 8 / 2
New technology products: 16 / 31 / 42 / 9 / 2
Mobile phone operators: 17 / 29 / 44 / 8 / 2
Energy providers: 17 / 29 / 41 / 10 / 3
Appliances: 14 / 32 / 44 / 8 / 2
Air transportation: 17 / 27 / 42 / 11 / 3
Rail, bus, car transportation: 16 / 28 / 44 / 10 / 2
Gardening and DIY: 14 / 29 / 47 / 8 / 2
Hotels: 14 / 29 / 43 / 11 / 3
Automobiles: 13 / 28 / 45 / 11 / 3
Housing rental or purchase: 13 / 26 / 43 / 14 / 4
Banks: 13 / 25 / 49 / 10 / 3
Each line is followed by two blue numbers on the right (total positive score and total negative score), here:
Total positive scores between 38 and 54 depending on the sector
Total negative scores between 10 and 18
In all sectors, a majority believes that the low-cost market will be maintained or progress, but rarely become the norm.
Source: Cetelem Observatory 2023.
Infographic presenting the opinion of consumers, in %, on the future evolution of the low-cost product and service market in different sectors of activity.
Legend (response categories):
Will develop and become the norm
Will develop but remain less important
Will remain stable
Will decline but not disappear
Will disappear
Each line corresponds to a sector with the associated percentages.
Data by sector (in %):
Food retailers: 22 / 32 / 36 / 8 / 2
Clothing, textiles: 20 / 32 / 38 / 8 / 2
New technology products: 16 / 31 / 42 / 9 / 2
Mobile phone operators: 17 / 29 / 44 / 8 / 2
Energy providers: 17 / 29 / 41 / 10 / 3
Appliances: 14 / 32 / 44 / 8 / 2
Air transportation: 17 / 27 / 42 / 11 / 3
Rail, bus, car transportation: 16 / 28 / 44 / 10 / 2
Gardening and DIY: 14 / 29 / 47 / 8 / 2
Hotels: 14 / 29 / 43 / 11 / 3
Automobiles: 13 / 28 / 45 / 11 / 3
Housing rental or purchase: 13 / 26 / 43 / 14 / 4
Banks: 13 / 25 / 49 / 10 / 3
Each line is followed by two blue numbers on the right (total positive score and total negative score), here:
Total positive scores between 38 and 54 depending on the sector
Total negative scores between 10 and 18
In all sectors, a majority believes that the low-cost market will be maintained or progress, but rarely become the norm.
Source: Cetelem Observatory 2023.
Food and clothes are the most popular items
The types of low-cost product most commonly consumed by Europeans confirm the degree to which this model has become a part of their daily lives. Food and clothing are the two biggest winners in the growth of low-cost consumption. 41% and 34% of recipients, respectively, state that they have increased the number of purchases they make in these two categories. As regards the other types of product examined, there is something of a status quo, with more than half of Europeans saying that they engage in neither more nor less low-cost consumption than in the past. In the food sector, the proportion of individuals who have increased their low-cost consumption is particularly striking in the United Kingdom, Portugal, Austria and Germany, where the figure reaches or approaches the 50% mark. When it comes to clothing, Portugal and Austria top the ranking, along with Spain and Italy, with scores of around 40% (Fig. 31).
Fig 31 – Prioritization of low-cost by type of purchase
Download this infographic for your presentations Infographic presenting, for different products or services, the proportion of consumers who declare that they prioritize low-cost more, the same, or less than a year ago.
Three categories are represented: More, Neither more nor less, Less.
Data by purchase category (in %) with the order of values more / neither more nor less / less:
Food products: 41 / 40 / 19
Clothing: 34 / 43 / 23
Train, bus, car tickets: 24 / 54 / 22
Accommodation: 23 / 54 / 23
Furniture and decoration: 23 / 54 / 23
Energy providers: 22 / 57 / 21
Mobile phone services: 22 / 57 / 21
Airline tickets: 22 / 56 / 22
Gardening and DIY: 22 / 55 / 23
Appliances: 21 / 55 / 24
Digital tools (computers, smartphones, tablets): 20 / 56 / 24
Banking services: 17 / 61 / 22
Vehicles: 16 / 61 / 23
The majority of categories show strong stability (“neither more nor less”), but some sectors show an increased use of low-cost, particularly food and clothing.
Source: Cetelem Observatory 2023.
Infographic presenting, for different products or services, the proportion of consumers who declare that they prioritize low-cost more, the same, or less than a year ago.
Three categories are represented: More, Neither more nor less, Less.
Data by purchase category (in %) with the order of values more / neither more nor less / less:
Food products: 41 / 40 / 19
Clothing: 34 / 43 / 23
Train, bus, car tickets: 24 / 54 / 22
Accommodation: 23 / 54 / 23
Furniture and decoration: 23 / 54 / 23
Energy providers: 22 / 57 / 21
Mobile phone services: 22 / 57 / 21
Airline tickets: 22 / 56 / 22
Gardening and DIY: 22 / 55 / 23
Appliances: 21 / 55 / 24
Digital tools (computers, smartphones, tablets): 20 / 56 / 24
Banking services: 17 / 61 / 22
Vehicles: 16 / 61 / 23
The majority of categories show strong stability (“neither more nor less”), but some sectors show an increased use of low-cost, particularly food and clothing.
Source: Cetelem Observatory 2023.
Low-cost food, an unstoppable force
In the food sector, the rising market share of hard-discount and soft-discount chains supports the views expressed by Europeans via this Observatoire Cetelem de la Consommation survey. Between 2014 and 2022, this market share grew by 5 points, from 21% to 26% (Fig. 32).
Fig 32 – Evolution and distribution of the discount market
Download this infographic for your presentations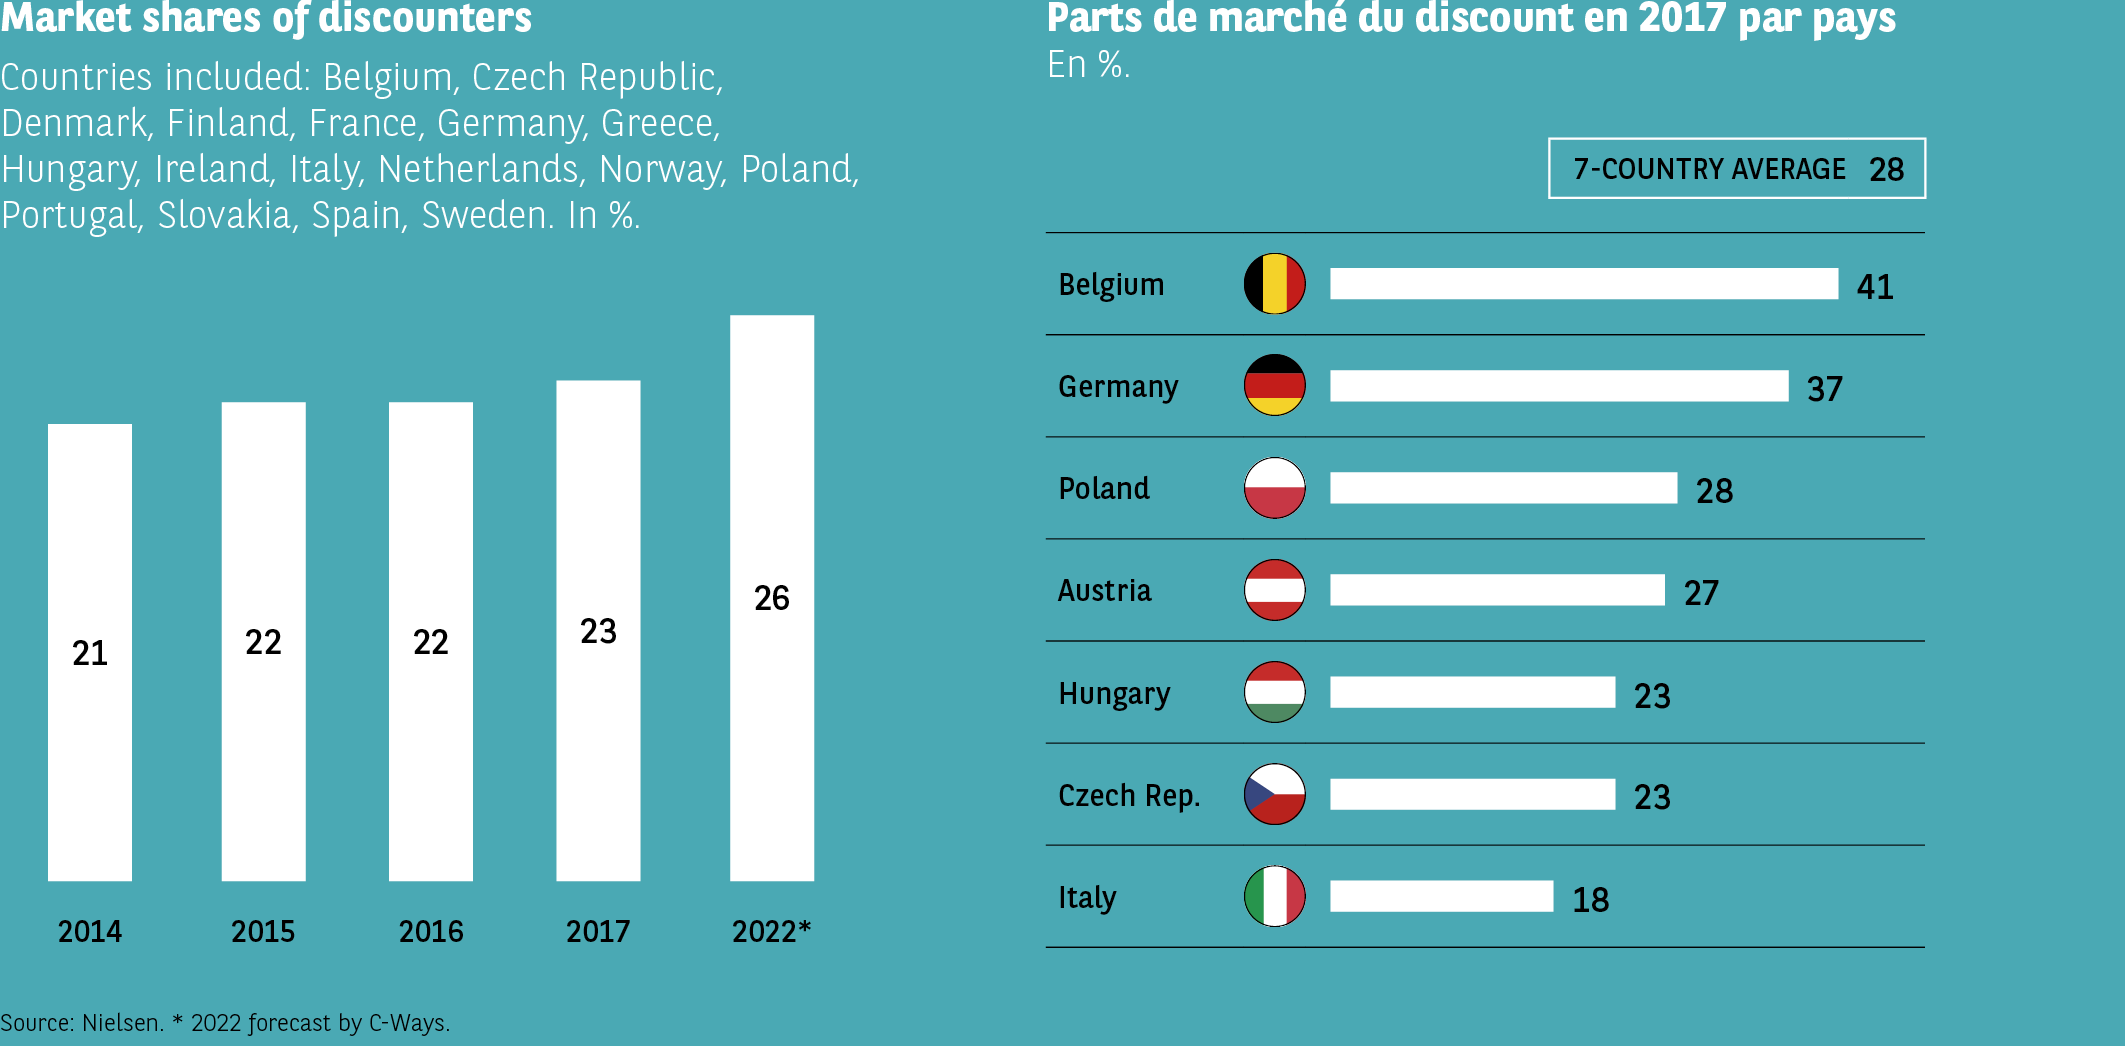 The infographic includes:
The evolution of the market shares of discounters in a set of European countries between 2014 and 2022.
The market shares of discount, by country, for the year 2017.
The countries in the scope are: Belgium, Czech Republic, Denmark, Finland, France, Germany, Greece, Hungary, Ireland, Italy, Netherlands, Norway, Poland, Portugal, Slovakia, Spain, and Sweden.
Evolution of market shares of discounters (2014-2022)
Values in %:
2014: 21%
2015: 22%
2016: 22%
2017: 23%
2022: 26%*
(*) 2022 is a C-Ways forecast.
Market shares of discount in 2017 by country (in %):
The average of the 7 countries displayed is 28%.
Belgium: 41%
Germany: 37%
Poland: 28%
Austria: 27%
Hungary: 23%
Czech Republic: 23%
Italy: 18%
The share of discount has slightly increased over the observed period and remains highly variable by country, ranging from 18% to 41% in 2017.
Source: Nielsen. 2022 forecast C-Ways.
The infographic includes:
The evolution of the market shares of discounters in a set of European countries between 2014 and 2022.
The market shares of discount, by country, for the year 2017.
The countries in the scope are: Belgium, Czech Republic, Denmark, Finland, France, Germany, Greece, Hungary, Ireland, Italy, Netherlands, Norway, Poland, Portugal, Slovakia, Spain, and Sweden.
Evolution of market shares of discounters (2014-2022)
Values in %:
2014: 21%
2015: 22%
2016: 22%
2017: 23%
2022: 26%*
(*) 2022 is a C-Ways forecast.
Market shares of discount in 2017 by country (in %):
The average of the 7 countries displayed is 28%.
Belgium: 41%
Germany: 37%
Poland: 28%
Austria: 27%
Hungary: 23%
Czech Republic: 23%
Italy: 18%
The share of discount has slightly increased over the observed period and remains highly variable by country, ranging from 18% to 41% in 2017.
Source: Nielsen. 2022 forecast C-Ways.

The eight-fold growth of low-cost air travel over the last 20 years has been by far the most impressive of all the sectors examined.
Low-cost flights: a blistering take off
The growth of low-cost air travel has undoubtedly been the most remarkable of all the sectors examined. In 2001, low-cost airlines accounted for just 5% of the overall market. Today, they are on their way to securing the lion’s share of business in the sector, with the current figure totalling 45% (Fig. 33).
Fig 33 – Market share of low-cost in air travel from 2001 to 2020
Download this infographic for your presentations Graph presenting the evolution of the market share of low-cost airlines between 2001 and 2020. The data is indicated year by year in the form of vertical bars.
Market share of low-cost by year (in %):
2001: 5.3%
2002: 7.4%
2003: 10.2%
2004: 11.5%
2005: 14.4%
2006: 16.9%
2007: 20.3%
2008: 22.5%
2009: 24.0%
2010: 24.9%
2011: 25.7%
2012: 27.4%
2013: 28.2%
2014: 29.9%
2015: 31.6%
2016: 33.3%
2017: 34.9%
2018: 36.5%
2019: 37.3%
2020: 44.5%
The market share of low-cost airlines in air travel has continuously increased over two decades, with a notable acceleration from the second half of the 2010s.
Source: OAG Schedules Analyser, CAPA Center for Aviation.
Graph presenting the evolution of the market share of low-cost airlines between 2001 and 2020. The data is indicated year by year in the form of vertical bars.
Market share of low-cost by year (in %):
2001: 5.3%
2002: 7.4%
2003: 10.2%
2004: 11.5%
2005: 14.4%
2006: 16.9%
2007: 20.3%
2008: 22.5%
2009: 24.0%
2010: 24.9%
2011: 25.7%
2012: 27.4%
2013: 28.2%
2014: 29.9%
2015: 31.6%
2016: 33.3%
2017: 34.9%
2018: 36.5%
2019: 37.3%
2020: 44.5%
The market share of low-cost airlines in air travel has continuously increased over two decades, with a notable acceleration from the second half of the 2010s.
Source: OAG Schedules Analyser, CAPA Center for Aviation.