Maintaining perspective

ESSENTIAL FOR THE DAY TO DAY
While those who are car-free doubt their utility, those who do own a vehicle feel the very opposite. Nearly 8 out of 10 young people say their car is indispensable on a daily basis, significantly higher than the score for seniors. One has to go to Norway or the UK to find more nuanced opinions, while utilitarianism is the order of the day in Asia.
While there is little to separate the views of urbanites and rural dwellers on this question, couples with children are more likely to state that cars are an essential part of their daily lives. When it comes to taking children to school or to their extra-curricular activities, not to mention food shopping, cars are a long way from being superseded by cargo bikes (Fig. 16).
RATIONAL PURCHASING CRITERIA
People’s purchasing criteria are also rooted in rationality. As successive editions of L’Observatoire Cetelem have reminded us, price is the number one consideration when buying any type of good. And when young people acquire a vehicle, this is invariably what they think about first. However, it is less important in their eyes than in those of seniors, who score this criterion almost 10 points higher. Once again, the Chinese and Turks are by far the least sensitive to this factor, while for residents of towns with fewer than 20,000 inhabitants it is a crucial one.
Again, both generations are in agreement on safety, which they put forward as their second most important purchasing criterion, with seniors placing slightly more emphasis on the issue. However, while mileage comes third for young people (given their tendency to opt for second-hand vehicles), running costs occupy this position for seniors (Fig. 17).
Fig 16 – Indispensability of the car, by age
Download this infographic for your presentations The infographic presents the responses to the question: “Is your car essential to you on a daily basis?”, asked to people who have at least one car in their household. Two answers are possible: “yes” and “no”. The results are compared for three age groups: 18-29 years old, 30-49 years old, and 50 years old and over.
The data displayed are:
18-29 years old: yes 77%, no 23%
30-49 years old: yes 83%, no 17%
50 years old and over: yes 70%, no 30%
The results show that a large majority of respondents, regardless of age, consider the car essential on a daily basis. This proportion is highest among 30-49 year olds, slightly lower among 18-29 year olds, and even lower among 50 year olds and over.
Source: Cetelem Automobile Observatory 2025
The infographic presents the responses to the question: “Is your car essential to you on a daily basis?”, asked to people who have at least one car in their household. Two answers are possible: “yes” and “no”. The results are compared for three age groups: 18-29 years old, 30-49 years old, and 50 years old and over.
The data displayed are:
18-29 years old: yes 77%, no 23%
30-49 years old: yes 83%, no 17%
50 years old and over: yes 70%, no 30%
The results show that a large majority of respondents, regardless of age, consider the car essential on a daily basis. This proportion is highest among 30-49 year olds, slightly lower among 18-29 year olds, and even lower among 50 year olds and over.
Source: Cetelem Automobile Observatory 2025
Fig 17 – Car purchase criteria, by age
Download this infographic for your presentations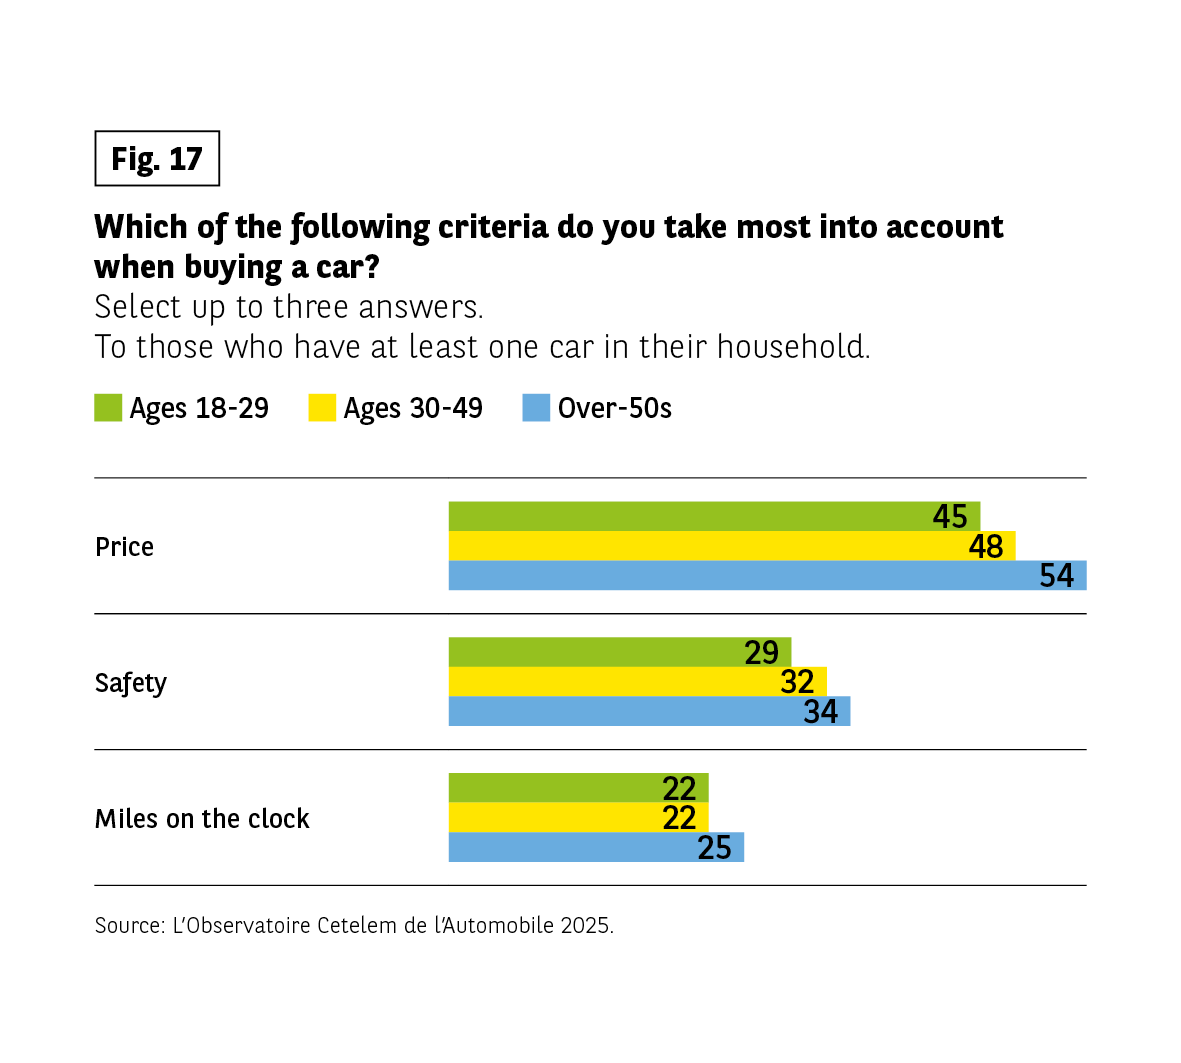 The infographic presents the responses to the question: “Among the following criteria, which ones would you consider most when buying a car?”, asked to people who have at least one car in their household. Three answers could be given. The criteria presented are: price, safety, and mileage. The results are compared for three age groups: 18-29 years old, 30-49 years old, and 50 years old and over.
The data displayed are:
Price: 18-29 years old 45%, 30-49 years old 48%, 50 years old and over 54%
Safety: 18-29 years old 29%, 30-49 years old 32%, 50 years old and over 34%
Mileage: 18-29 years old 22%, 30-49 years old 22%, 50 years old and over 25%
The results show that price is the most frequently cited criterion, with increasing importance according to age. Safety is an important criterion but less often mentioned than price, and mileage appears to be a secondary consideration.
Source: Cetelem Automobile Observatory 2025
The infographic presents the responses to the question: “Among the following criteria, which ones would you consider most when buying a car?”, asked to people who have at least one car in their household. Three answers could be given. The criteria presented are: price, safety, and mileage. The results are compared for three age groups: 18-29 years old, 30-49 years old, and 50 years old and over.
The data displayed are:
Price: 18-29 years old 45%, 30-49 years old 48%, 50 years old and over 54%
Safety: 18-29 years old 29%, 30-49 years old 32%, 50 years old and over 34%
Mileage: 18-29 years old 22%, 30-49 years old 22%, 50 years old and over 25%
The results show that price is the most frequently cited criterion, with increasing importance according to age. Safety is an important criterion but less often mentioned than price, and mileage appears to be a secondary consideration.
Source: Cetelem Automobile Observatory 2025
SAFETY, CONVENIENCE AND FREEDOM: A COMMON MANTRA
If we must get caught up in metaphor and compare cars to people, then it makes sense to talk about their qualities and shortcomings.
When it comes to the former, three in particular stand apart from the rest: safety, convenience and freedom. These qualities are highlighted by young people and seniors alike, but to varying degrees.
For instance, 30% of young people believe that safety is a car’s most important attribute, compared with 43% of seniors. The gap begins to narrow when the topic is convenience, which comes in second place. This quality is mentioned by 27% of young people and 38% of seniors. In third place is freedom, a topic on which the views of young people and seniors are more similar, with scores of 27% and 32% respectively (Fig. 18).
It is worth noting that, outside of this top three, speed and pleasure are the qualities most commonly mentioned by young people, while seniors rarely mention the former.
SHARED CRITICISMS
As for the “shortcomings” of cars, young people and seniors agree once again when it comes to their top three, but with even greater convergence of opinion.
The stress caused by cars is the number one issue and is cited by 3 in 10 people in both age categories. A similar proportion see them as a constraint (23% of young people and 22% of seniors). The third “flaw” is somewhat less obvious, in that it relates to a form of pollution that receives less publicity than CO2 emissions, but which is particularly noticeable in urban environments. The issue here is noise, which is decried primarily by young people, with a quarter of them citing this problem (Fig. 19).
Fig 18 – Characteristics associated with the car, by age
Download this infographic for your presentations The infographic presents the responses to the question: “Among the following characteristics, which ones apply best to the car?”, asked to people who have at least one car in their household. The characteristics proposed are: “Freedom”, “Safety”, and “Practicality”. The results are compared for three age groups: 18-29 years old, 30-49 years old, and 50 years old and over.
The data displayed are:
18-29 years old: freedom 27%, safety 30%, practicality 27%
30-49 years old: freedom 31%, safety 34%, practicality 30%
50 years old and over: freedom 32%, safety 43%, practicality 38%
The results show that the three characteristics are widely recognized in all age groups. Safety is more emphasized by 50 year olds and over, while younger people distribute their responses more evenly between freedom, safety, and practicality.
Source: Cetelem Automobile Observatory 2025
The infographic presents the responses to the question: “Among the following characteristics, which ones apply best to the car?”, asked to people who have at least one car in their household. The characteristics proposed are: “Freedom”, “Safety”, and “Practicality”. The results are compared for three age groups: 18-29 years old, 30-49 years old, and 50 years old and over.
The data displayed are:
18-29 years old: freedom 27%, safety 30%, practicality 27%
30-49 years old: freedom 31%, safety 34%, practicality 30%
50 years old and over: freedom 32%, safety 43%, practicality 38%
The results show that the three characteristics are widely recognized in all age groups. Safety is more emphasized by 50 year olds and over, while younger people distribute their responses more evenly between freedom, safety, and practicality.
Source: Cetelem Automobile Observatory 2025
Fig 19 – Negative characteristics associated with the car, by age
Download this infographic for your presentations The infographic presents the responses to the question: “Among the following characteristics, which ones apply least well to the car?”, asked to people who have at least one car in their household. Three characteristics are proposed: “constraint”, “stress”, and “noise”. Three age groups are compared: 18-29 years old, 30-49 years old, and 50 years old and over.
The data displayed are:
18-29 years old: constraint 23%, stress 29%, noise 26%
30-49 years old: constraint 22%, stress 29%, noise 24%
50 years old and over: constraint 22%, stress 31%, noise 22%
Overall, stress appears to be slightly more cited than constraint or noise in all age groups, with a more marked increase among 50 year olds and over. The proportions of “constraint” and “noise” remain relatively close between age groups.
Source: Cetelem Automobile Observatory 2025
The infographic presents the responses to the question: “Among the following characteristics, which ones apply least well to the car?”, asked to people who have at least one car in their household. Three characteristics are proposed: “constraint”, “stress”, and “noise”. Three age groups are compared: 18-29 years old, 30-49 years old, and 50 years old and over.
The data displayed are:
18-29 years old: constraint 23%, stress 29%, noise 26%
30-49 years old: constraint 22%, stress 29%, noise 24%
50 years old and over: constraint 22%, stress 31%, noise 22%
Overall, stress appears to be slightly more cited than constraint or noise in all age groups, with a more marked increase among 50 year olds and over. The proportions of “constraint” and “noise” remain relatively close between age groups.
Source: Cetelem Automobile Observatory 2025