Europeans, who are attached to their homes, want to improve their energy efficiency

Housing: A strong attachment at the heart of European’s lives
- 89% of Europeans are attached to their housing. (Fig.1)
- 92% are satisfied with their housing. (Fig.2)
Fig 1 – Level of attachment to one’s housing
Download this infographic for your presentations The ring diagram presents the distribution of levels of attachment to housing. Four categories are distinguished: “Very attached”, “Rather attached”, “Not attached”, and “Not at all attached”.
The visible data is:
Very attached: 48%
Rather attached: 41%
Not attached: 8%
Not at all attached: 3%
The majority of respondents declare themselves attached to their housing, with a cumulative total of 89% for the two levels of attachment. The responses expressing a lack of attachment remain minority.
The ring diagram presents the distribution of levels of attachment to housing. Four categories are distinguished: “Very attached”, “Rather attached”, “Not attached”, and “Not at all attached”.
The visible data is:
Very attached: 48%
Rather attached: 41%
Not attached: 8%
Not at all attached: 3%
The majority of respondents declare themselves attached to their housing, with a cumulative total of 89% for the two levels of attachment. The responses expressing a lack of attachment remain minority.
Fig 2 – Satisfaction with housing
Download this infographic for your presentations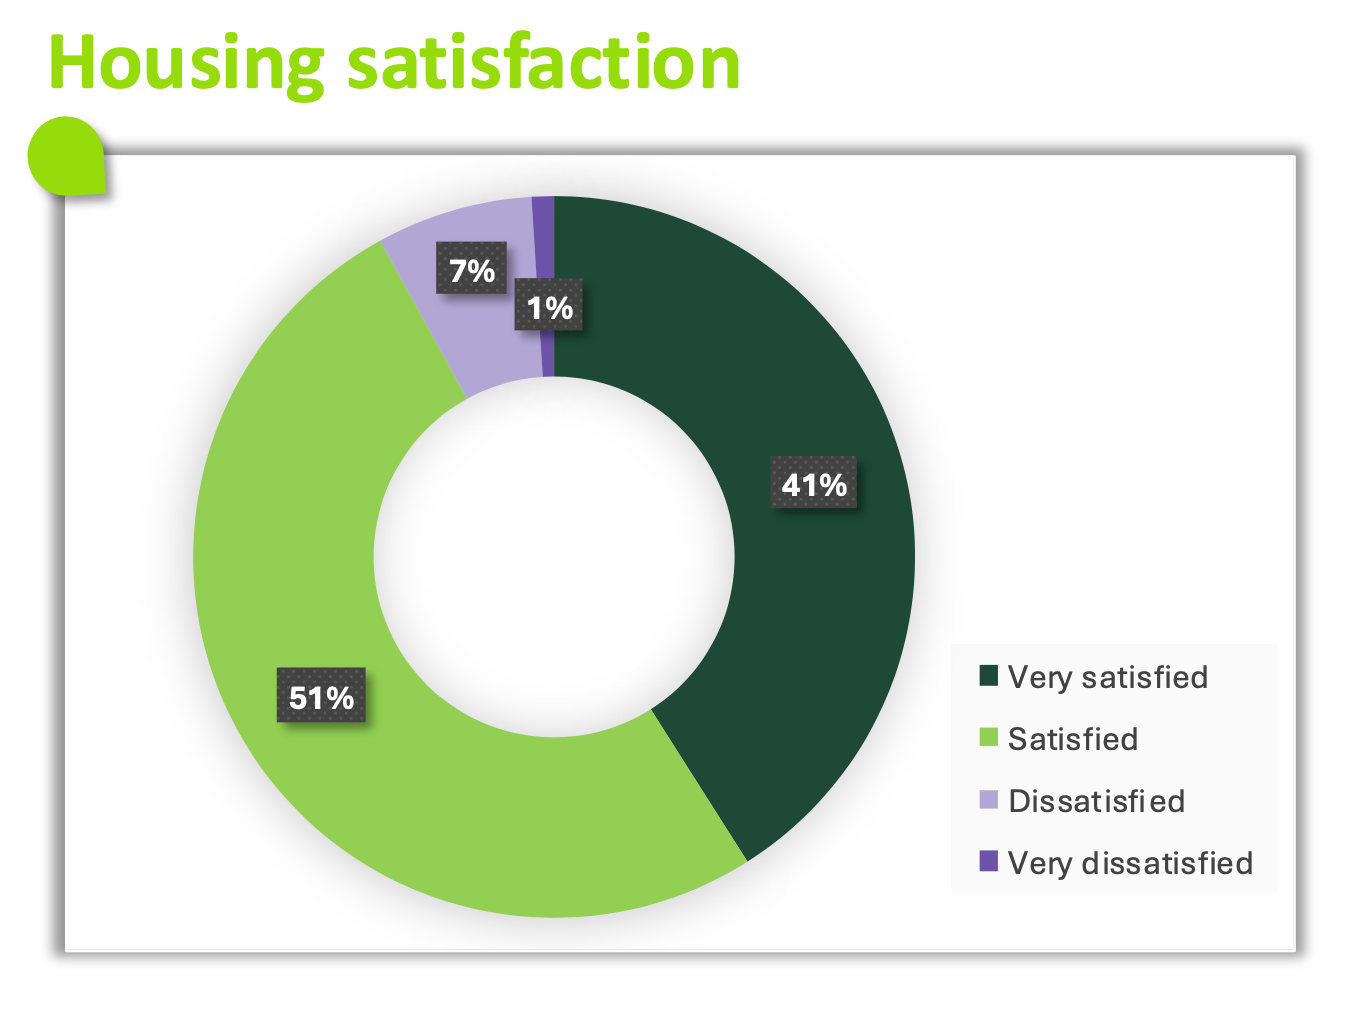 The ring diagram presents the declared levels of satisfaction with housing. Four categories are proposed: “Completely satisfied”, “Satisfied”, “Not satisfied”, and “Not at all satisfied”.
The data displayed is:
Completely satisfied: 41%
Satisfied: 51%
Not satisfied: 7%
Not at all satisfied: 1%
A large majority of respondents declare themselves satisfied or very satisfied, totaling 92%. The responses expressing dissatisfaction remain very limited. The figures describe a perceived state without proposing an explanatory reason.
The ring diagram presents the declared levels of satisfaction with housing. Four categories are proposed: “Completely satisfied”, “Satisfied”, “Not satisfied”, and “Not at all satisfied”.
The data displayed is:
Completely satisfied: 41%
Satisfied: 51%
Not satisfied: 7%
Not at all satisfied: 1%
A large majority of respondents declare themselves satisfied or very satisfied, totaling 92%. The responses expressing dissatisfaction remain very limited. The figures describe a perceived state without proposing an explanatory reason.
The reasons for this attachment are various: between satisfaction and importance
Fig 3 – Importance and satisfaction of housing criteria
Download this infographic for your presentations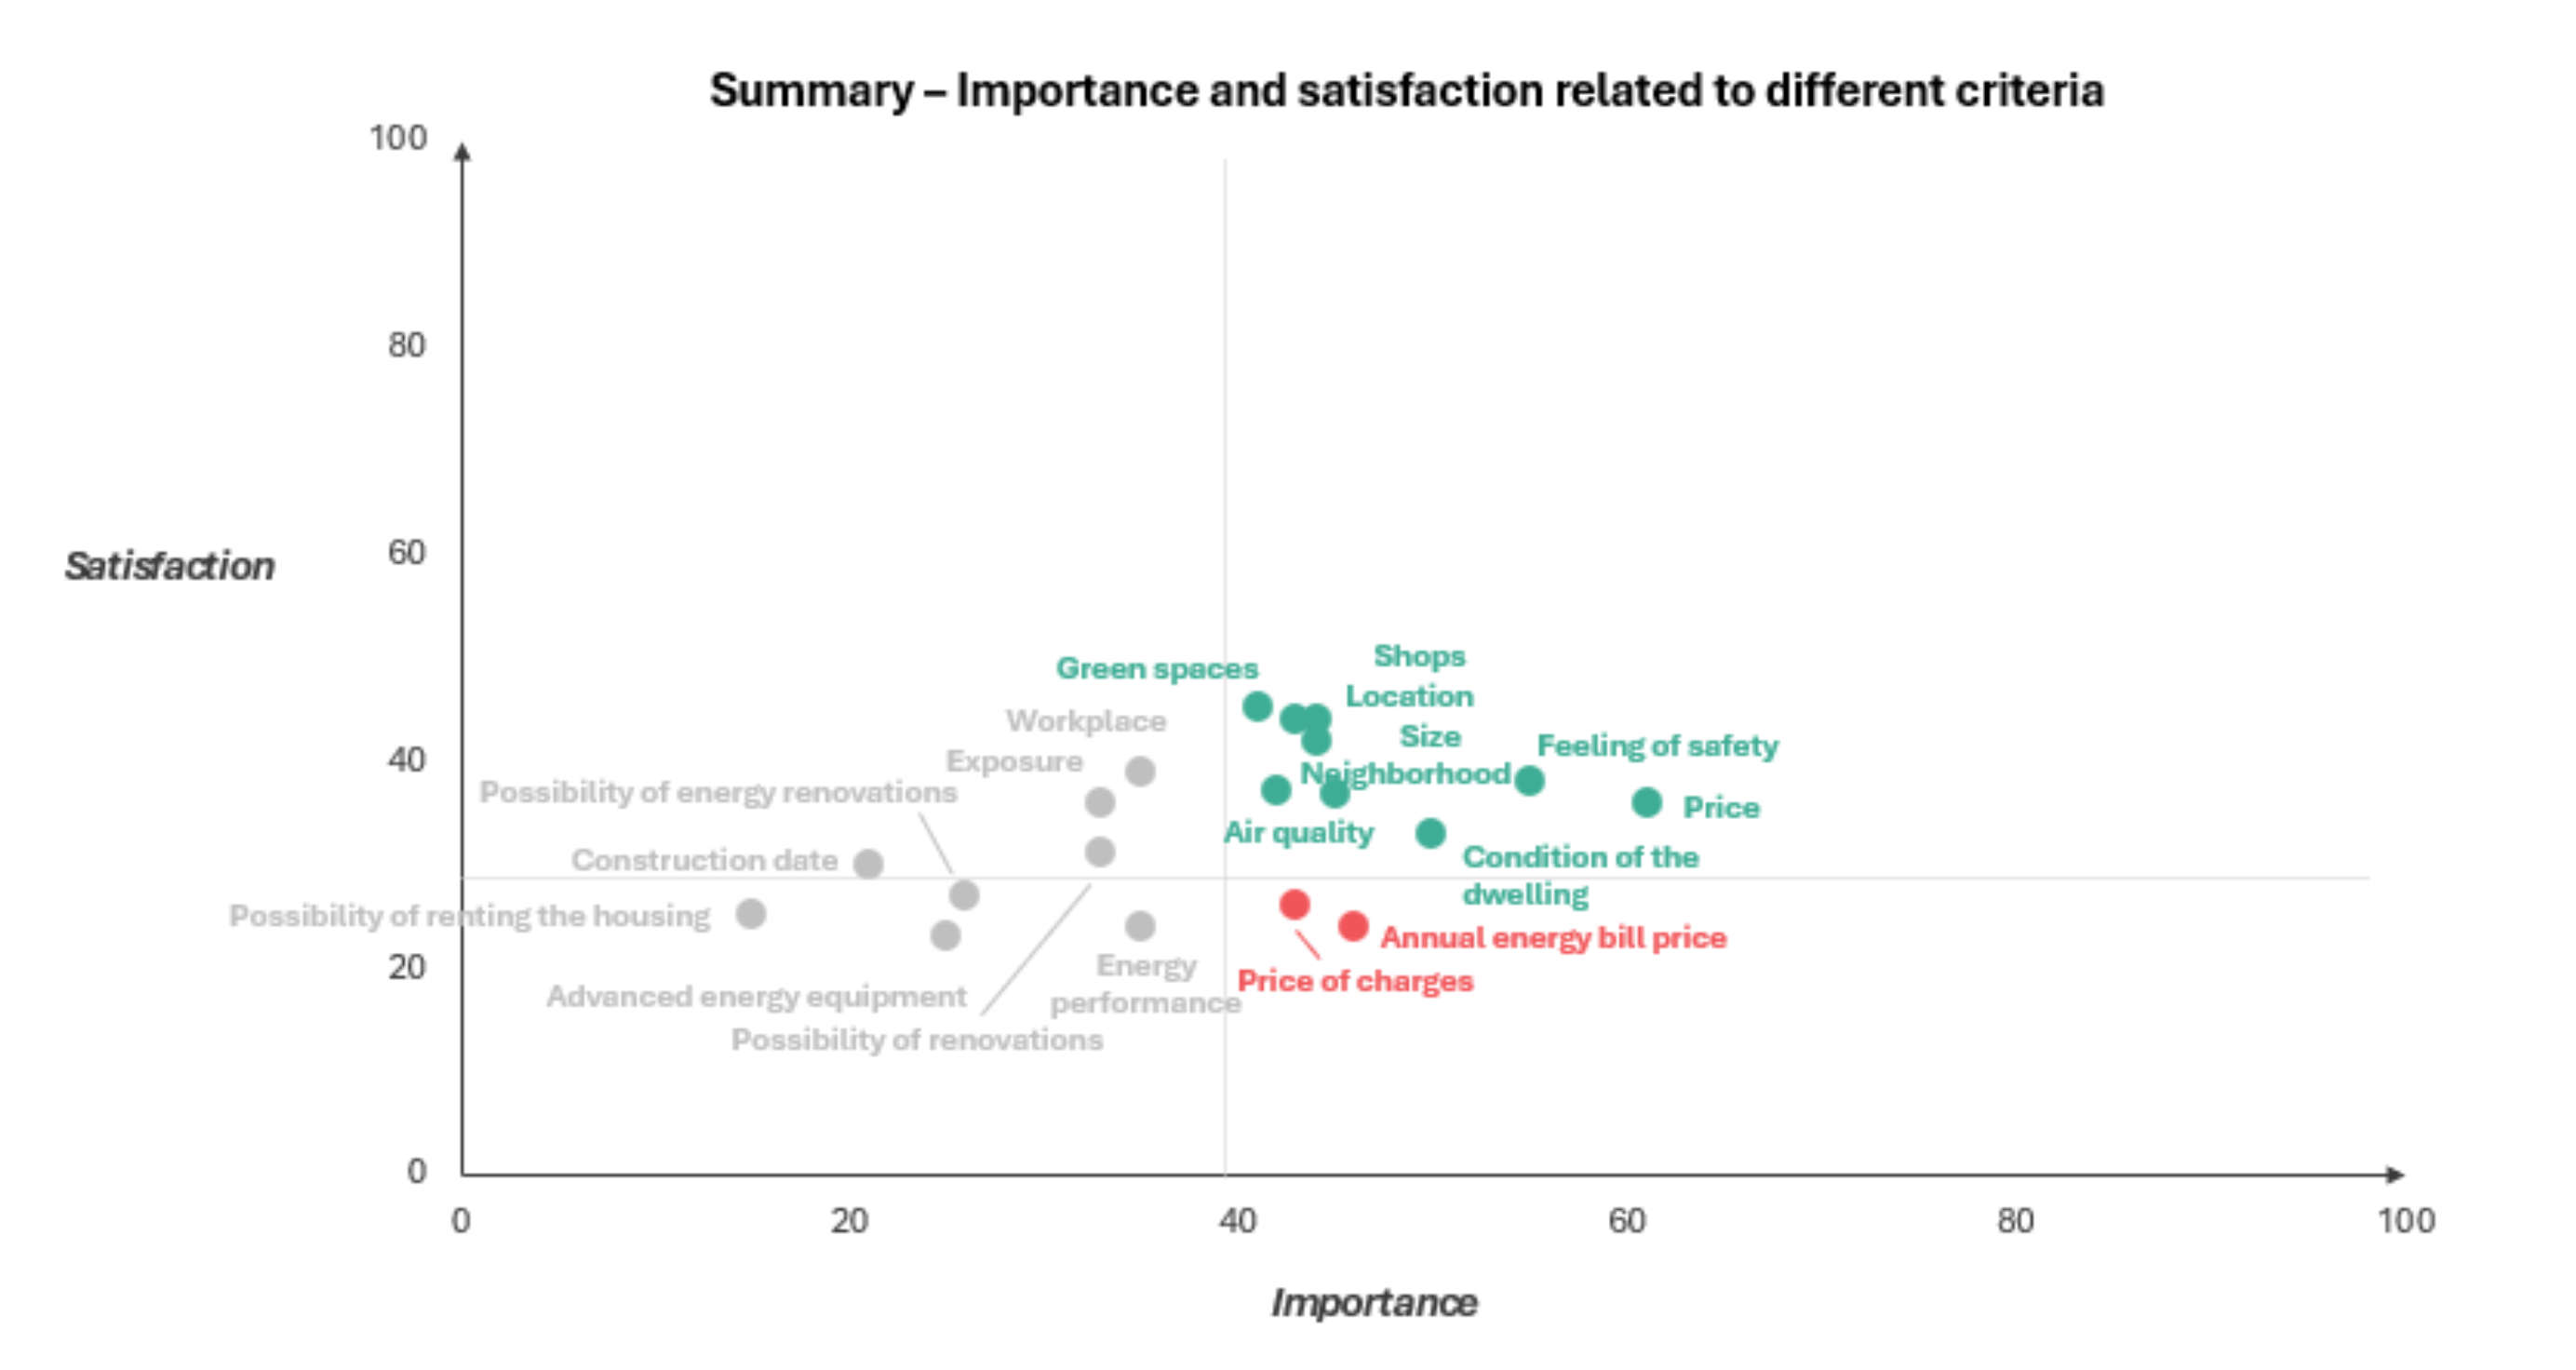 The visual presents a cloud of points crossing two measures: the importance given to different housing criteria (horizontal axis from 0 to 100) and the declared level of satisfaction for these same criteria (vertical axis from 0 to 100).
The displayed criteria are:
Gray points (low to medium importance, low to medium satisfaction) Possibility of energy transformations; Date of construction; Possibility of renting the housing; Advanced energy equipment; Possibility of transformations; Exposure; Workplace; Energy performance.
Green points (medium to high importance, medium to high satisfaction) Green spaces; Shops; Location; Surface area; Neighborhood; Sense of security; Air quality; State of housing; Price.
Red points (high importance, low satisfaction) Amount of charges; Annual energy bill amount.
Overall, the criteria related to costs (charges and energy bill) are located in an area where importance is high but satisfaction is significantly lower than for other criteria. The criteria of daily life and living environment (location, shops, security, surface area, neighborhood) are concentrated in an area combining high importance and relatively high satisfaction. The technical or structural criteria (date of construction, transformations, energy performance) appear as less important and are associated with low to medium levels of satisfaction.
The visual presents a cloud of points crossing two measures: the importance given to different housing criteria (horizontal axis from 0 to 100) and the declared level of satisfaction for these same criteria (vertical axis from 0 to 100).
The displayed criteria are:
Gray points (low to medium importance, low to medium satisfaction) Possibility of energy transformations; Date of construction; Possibility of renting the housing; Advanced energy equipment; Possibility of transformations; Exposure; Workplace; Energy performance.
Green points (medium to high importance, medium to high satisfaction) Green spaces; Shops; Location; Surface area; Neighborhood; Sense of security; Air quality; State of housing; Price.
Red points (high importance, low satisfaction) Amount of charges; Annual energy bill amount.
Overall, the criteria related to costs (charges and energy bill) are located in an area where importance is high but satisfaction is significantly lower than for other criteria. The criteria of daily life and living environment (location, shops, security, surface area, neighborhood) are concentrated in an area combining high importance and relatively high satisfaction. The technical or structural criteria (date of construction, transformations, energy performance) appear as less important and are associated with low to medium levels of satisfaction.
Price, energy, security – The blind spots of satisfaction: What still needs improvement
Top 6 criteria – importance & satisfaction
Fig 4 – Importance and satisfaction of priority criteria
Download this infographic for your presentations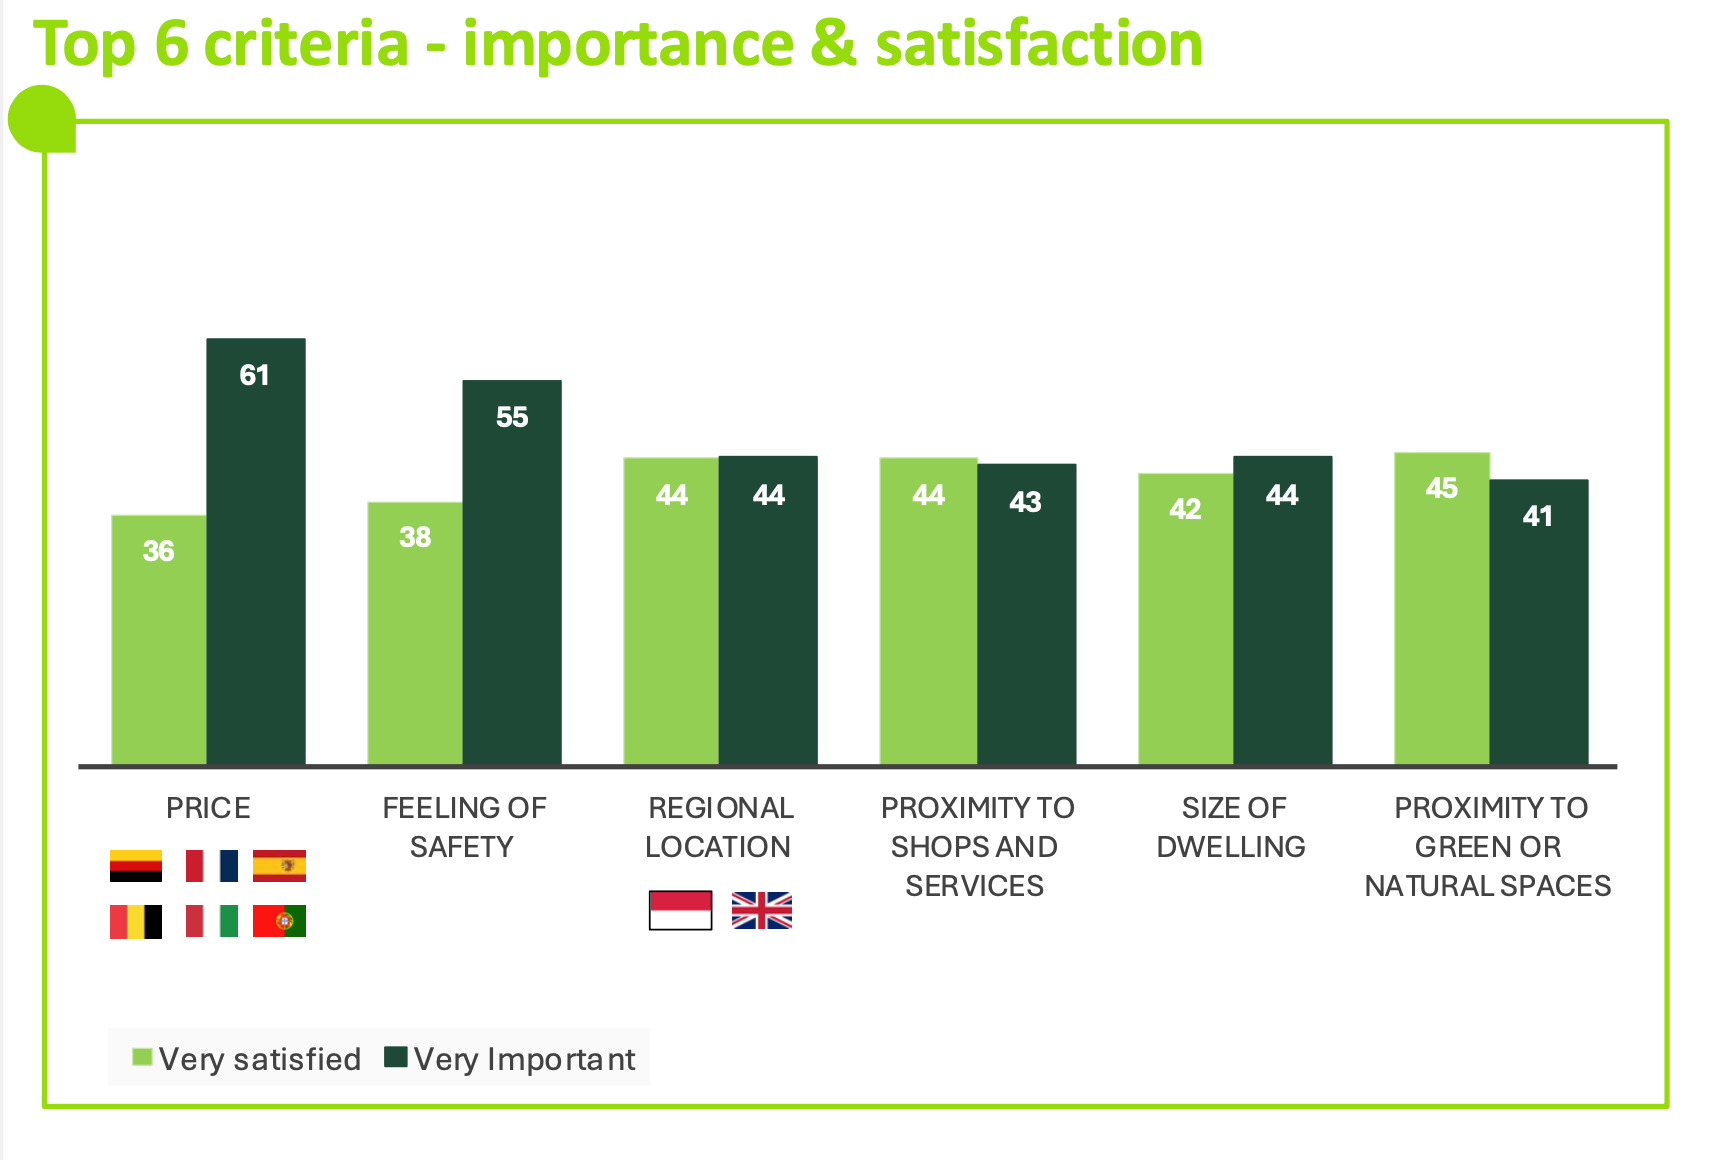 The image presents a histogram comparing, for six housing-related criteria, the proportion of people who declare themselves “very satisfied” and those who consider these criteria “very important”. Each criterion appears with two vertical bars: a light green bar for the level of satisfaction, and a dark green bar for importance.
The data indicated in the visual is:
Price: 36% very satisfied; 61% consider the criterion very important.
Sense of security: 38% very satisfied; 55% very important.
Regional location: 44% very satisfied; 44% very important.
Proximity to shops and services: 44% very satisfied; 43% very important.
Housing surface area: 42% very satisfied; 44% very important.
Proximity to green spaces or natural areas: 45% very satisfied; 41% very important.
A legend at the bottom of the image specifies the association of colors: light green for “Very satisfied” and dark green for “Very important”.
The overall shows that, among the most cited criteria, price and sense of security present the most marked gaps between high importance and lower satisfaction, while other criteria display relatively close levels of importance and satisfaction.
The image presents a histogram comparing, for six housing-related criteria, the proportion of people who declare themselves “very satisfied” and those who consider these criteria “very important”. Each criterion appears with two vertical bars: a light green bar for the level of satisfaction, and a dark green bar for importance.
The data indicated in the visual is:
Price: 36% very satisfied; 61% consider the criterion very important.
Sense of security: 38% very satisfied; 55% very important.
Regional location: 44% very satisfied; 44% very important.
Proximity to shops and services: 44% very satisfied; 43% very important.
Housing surface area: 42% very satisfied; 44% very important.
Proximity to green spaces or natural areas: 45% very satisfied; 41% very important.
A legend at the bottom of the image specifies the association of colors: light green for “Very satisfied” and dark green for “Very important”.
The overall shows that, among the most cited criteria, price and sense of security present the most marked gaps between high importance and lower satisfaction, while other criteria display relatively close levels of importance and satisfaction.
Top 6 gaps – importance & satisfaction
Fig 5 – Gaps between importance and satisfaction of criteria
Download this infographic for your presentations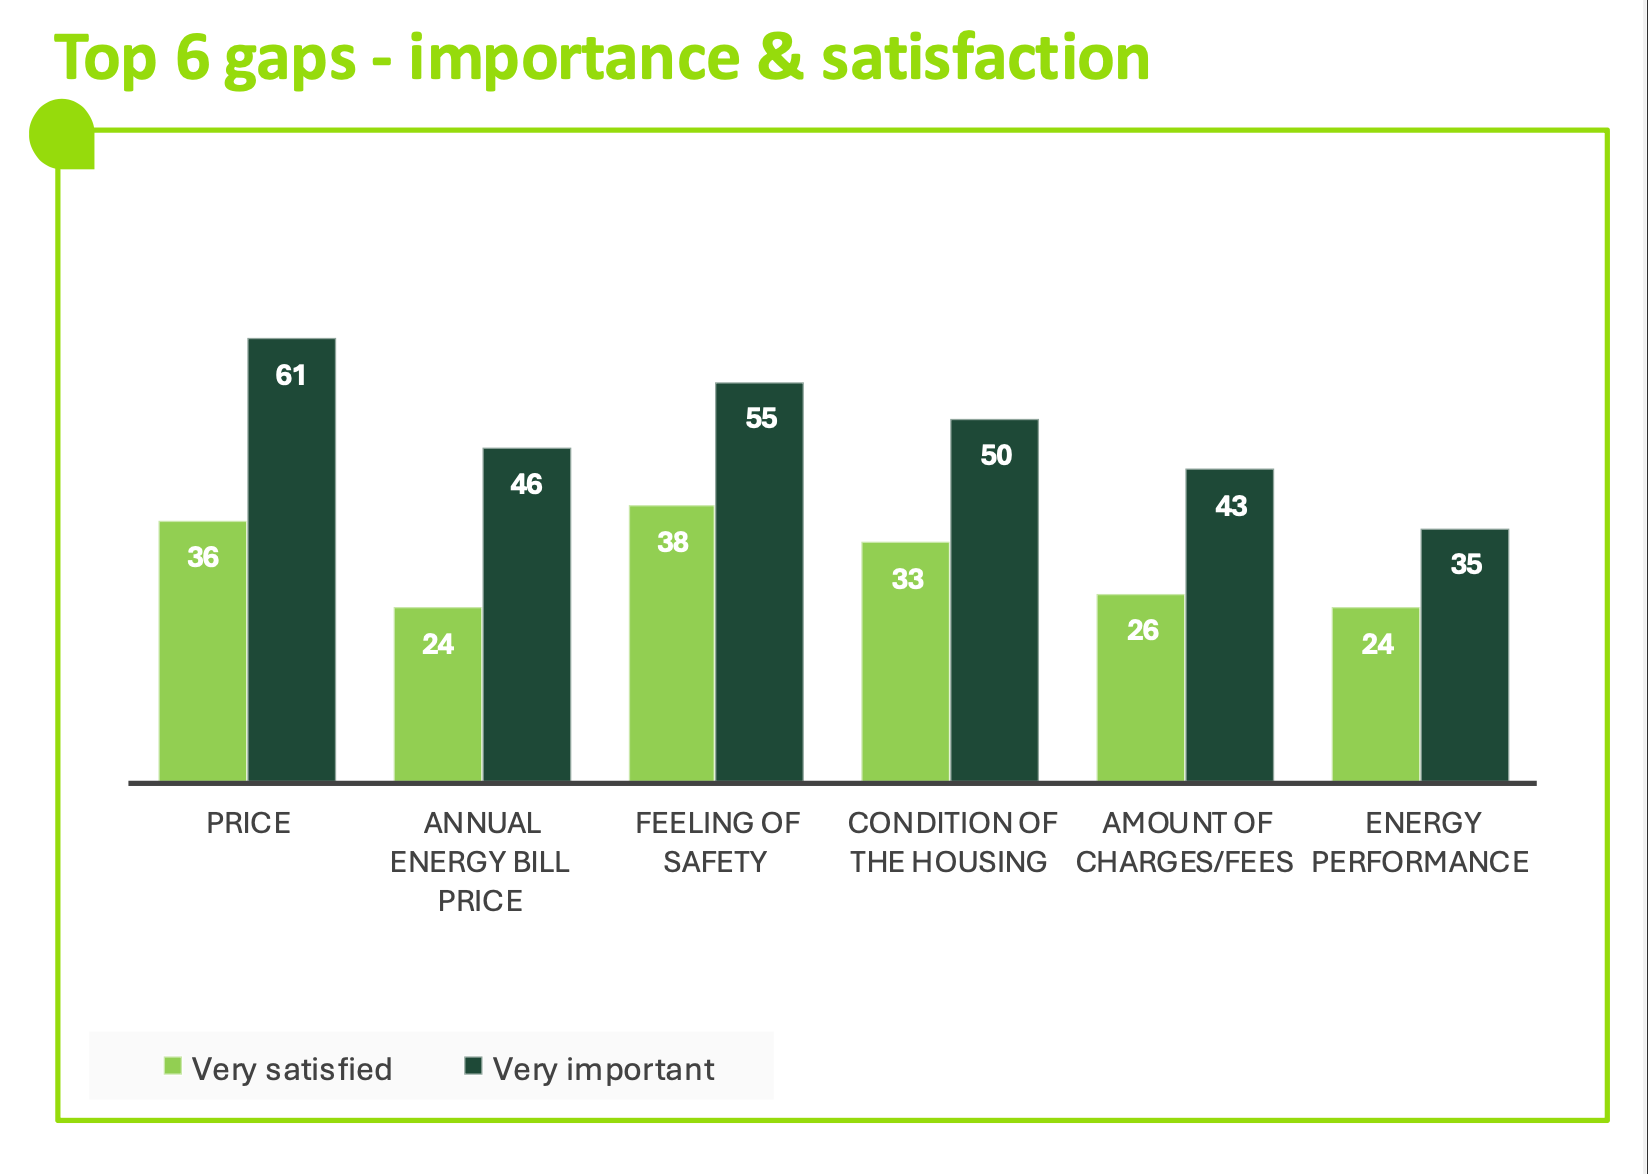 The image presents a histogram comparing, for six housing criteria, the proportion of people who declare themselves “very satisfied” and those who consider these criteria “very important”. Each criterion is represented by two vertical bars side by side: a light green bar for satisfaction and a dark green bar for importance.
The data displayed is:
Price: 36% very satisfied; 61% very important.
Annual energy bill amount: 24% very satisfied; 46% very important.
Sense of security: 38% very satisfied; 55% very important.
State of the housing: 33% very satisfied; 50% very important.
Amount of charges: 26% very satisfied; 43% very important.
Energy performance: 24% very satisfied; 35% very important.
A legend at the bottom of the image specifies: light green for “Very satisfied” and dark green for “Very important”.
The comparison reveals significant gaps between high importance and lower satisfaction, particularly for price, security, state of housing, and energy aspects.
The image presents a histogram comparing, for six housing criteria, the proportion of people who declare themselves “very satisfied” and those who consider these criteria “very important”. Each criterion is represented by two vertical bars side by side: a light green bar for satisfaction and a dark green bar for importance.
The data displayed is:
Price: 36% very satisfied; 61% very important.
Annual energy bill amount: 24% very satisfied; 46% very important.
Sense of security: 38% very satisfied; 55% very important.
State of the housing: 33% very satisfied; 50% very important.
Amount of charges: 26% very satisfied; 43% very important.
Energy performance: 24% very satisfied; 35% very important.
A legend at the bottom of the image specifies: light green for “Very satisfied” and dark green for “Very important”.
The comparison reveals significant gaps between high importance and lower satisfaction, particularly for price, security, state of housing, and energy aspects.
Importance given to advanced energetic equipment, symptomatic of a two-speed Europe
Fig 6 – Levels of satisfaction with housing by European country
Download this infographic for your presentations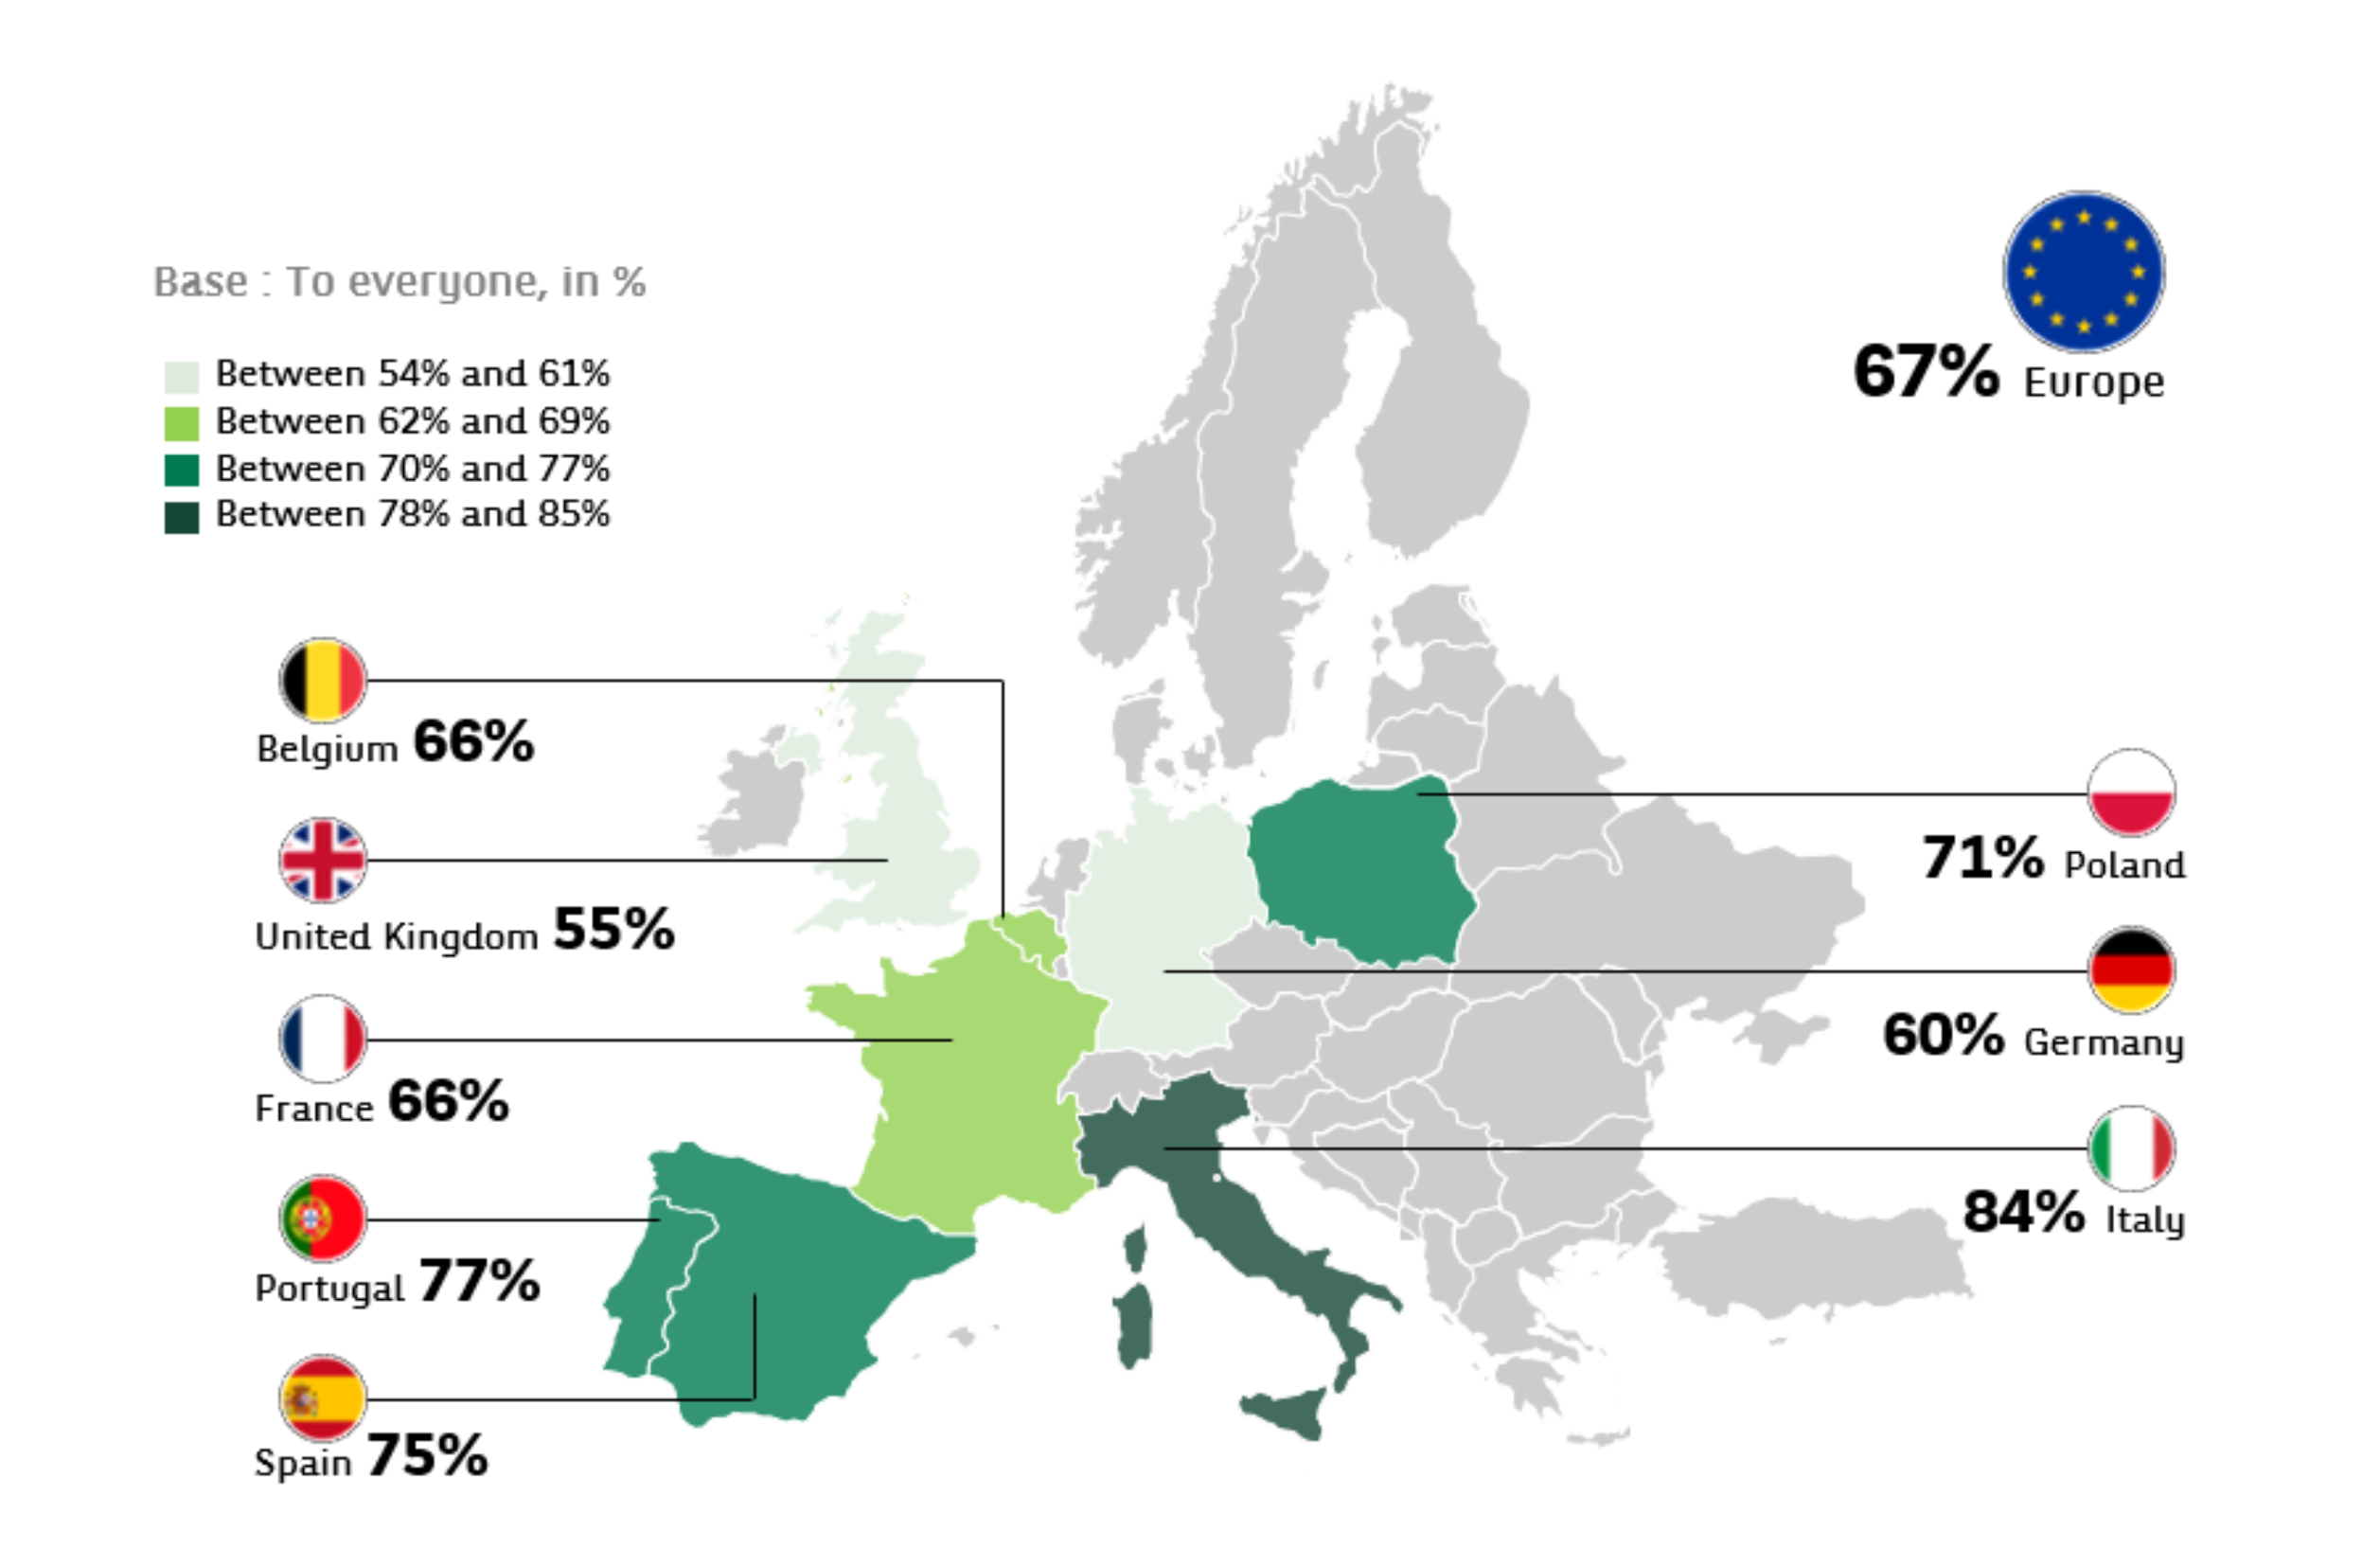 The image presents a map of Europe highlighting the levels of satisfaction related to housing in eight countries.
The percentages displayed for each country are:
Belgium: 66%
United Kingdom: 55%
France: 66%
Portugal: 77%
Spain: 75%
Poland: 71%
Germany: 60%
Italy: 84%
At the top right, an indicator displays “67% Europe”, representing the European average.
The map allows for a quick visualization of the differences in satisfaction: the highest levels appear in Italy and Portugal, while the United Kingdom and Germany are among the lowest.
Source indicated: Cetelem Observatory 2025.
The image presents a map of Europe highlighting the levels of satisfaction related to housing in eight countries.
The percentages displayed for each country are:
Belgium: 66%
United Kingdom: 55%
France: 66%
Portugal: 77%
Spain: 75%
Poland: 71%
Germany: 60%
Italy: 84%
At the top right, an indicator displays “67% Europe”, representing the European average.
The map allows for a quick visualization of the differences in satisfaction: the highest levels appear in Italy and Portugal, while the United Kingdom and Germany are among the lowest.
Source indicated: Cetelem Observatory 2025.
Energy and its financing increasingly undermine households’ future
- 65% of Europeans fear a decline in purchasing power (vs 58% in 2024). (Fig.7)
Fig 7 – Evolution of main concerns expressed
Download this infographic for your presentations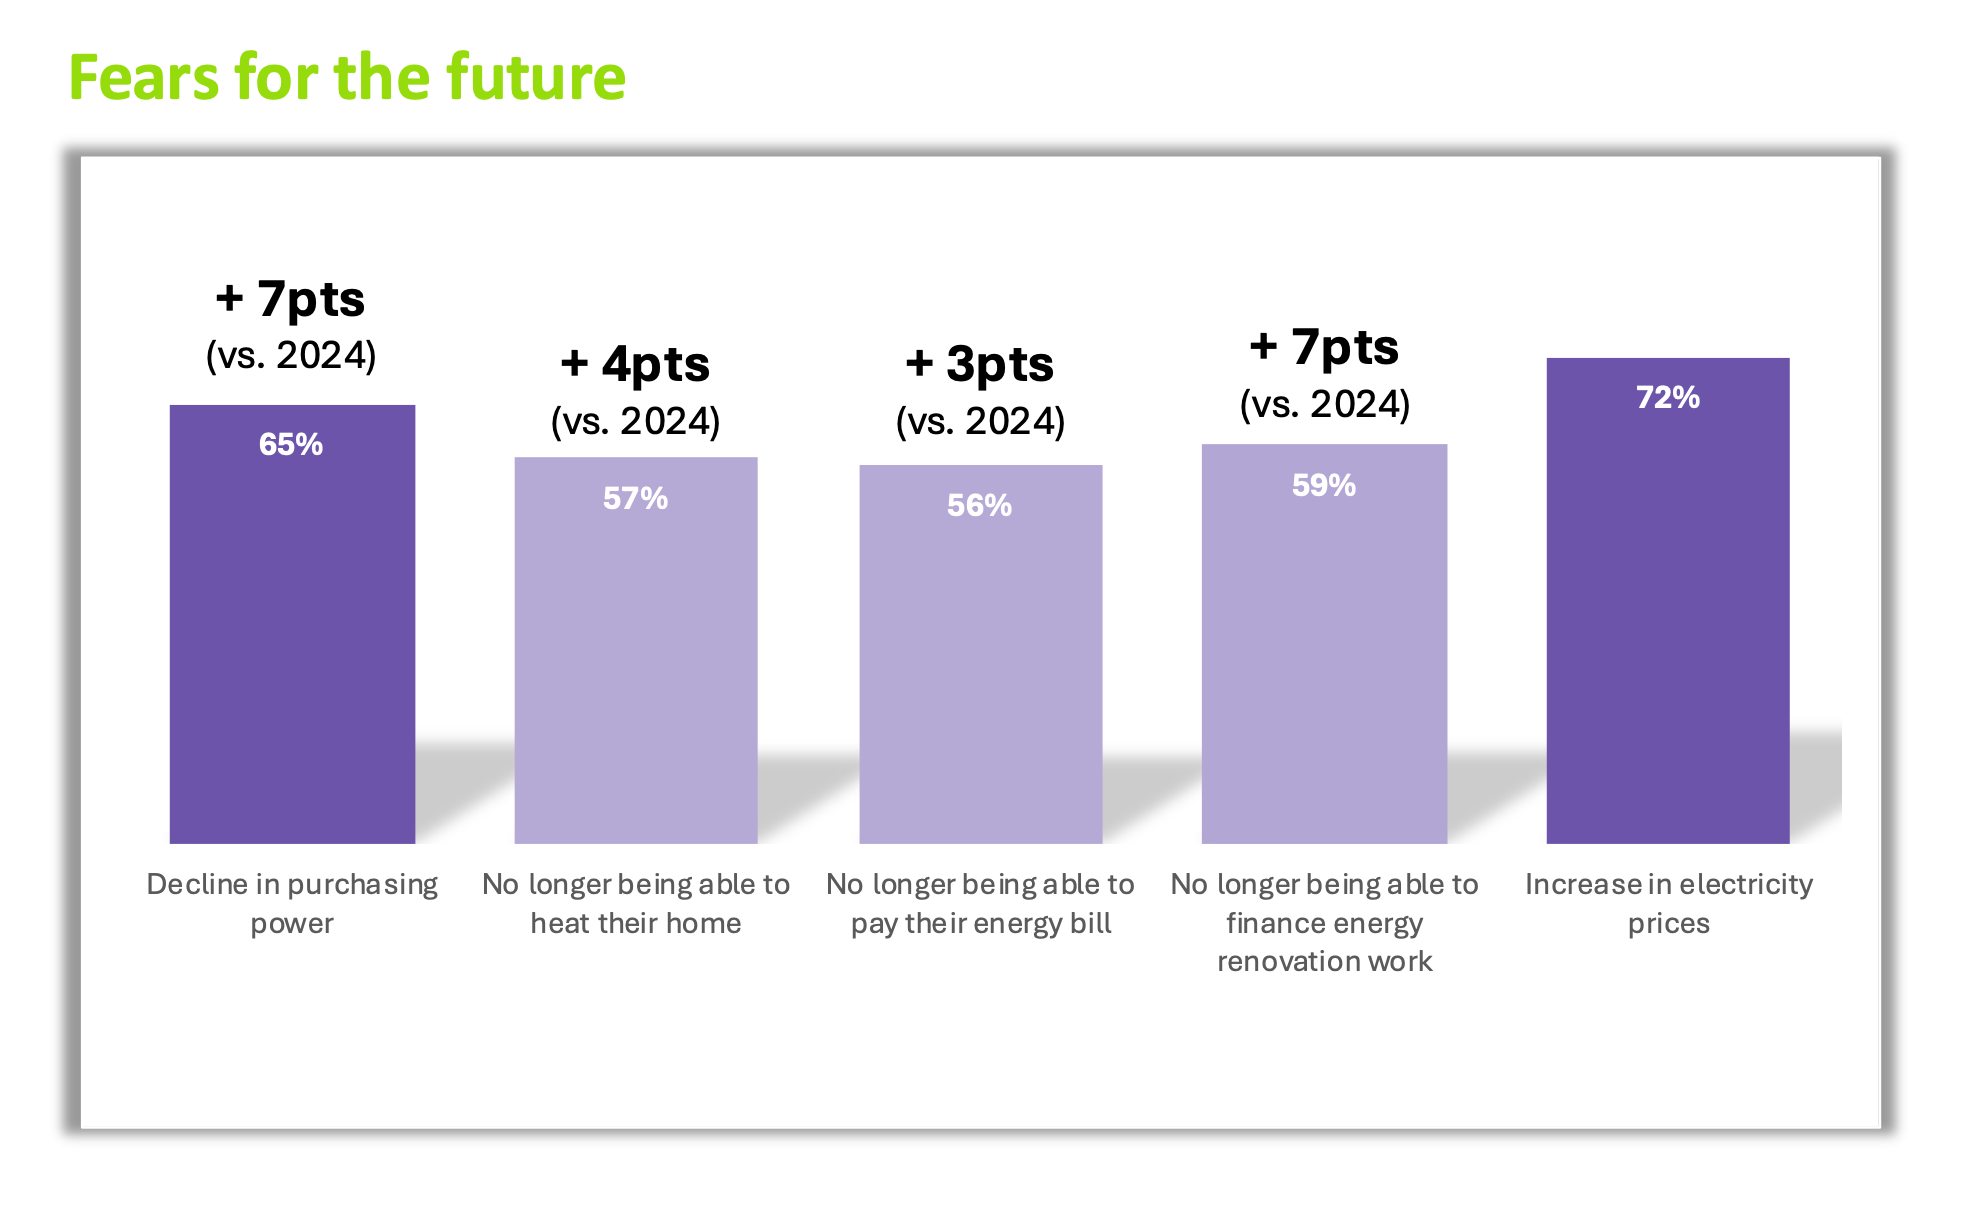 The image presents a composite histogram of five vertical bars representing different concerns expressed for the future. Each bar displays a percentage corresponding to the level of concern, as well as a progression expressed in points compared to 2024.
The data displayed is:
Decrease in purchasing power: 65%, i.e. +7 points compared to 2024.
No longer being able to heat one’s home: 57%, i.e. +4 points.
No longer being able to pay energy bills: 56%, i.e. +3 points.
No longer being able to finance energy renovation work: 59%, i.e. +7 points.
Increase in the price of electricity: 72%, with no evolution indicated.
These values show that concerns related to energy costs and purchasing power are among the most frequently cited, with a notable progression compared to the previous year.
The image presents a composite histogram of five vertical bars representing different concerns expressed for the future. Each bar displays a percentage corresponding to the level of concern, as well as a progression expressed in points compared to 2024.
The data displayed is:
Decrease in purchasing power: 65%, i.e. +7 points compared to 2024.
No longer being able to heat one’s home: 57%, i.e. +4 points.
No longer being able to pay energy bills: 56%, i.e. +3 points.
No longer being able to finance energy renovation work: 59%, i.e. +7 points.
Increase in the price of electricity: 72%, with no evolution indicated.
These values show that concerns related to energy costs and purchasing power are among the most frequently cited, with a notable progression compared to the previous year.
Growing fears of not being able to pay for future energy bills
Fig 8 – Level of concerns related to housing in Europe
Download this infographic for your presentations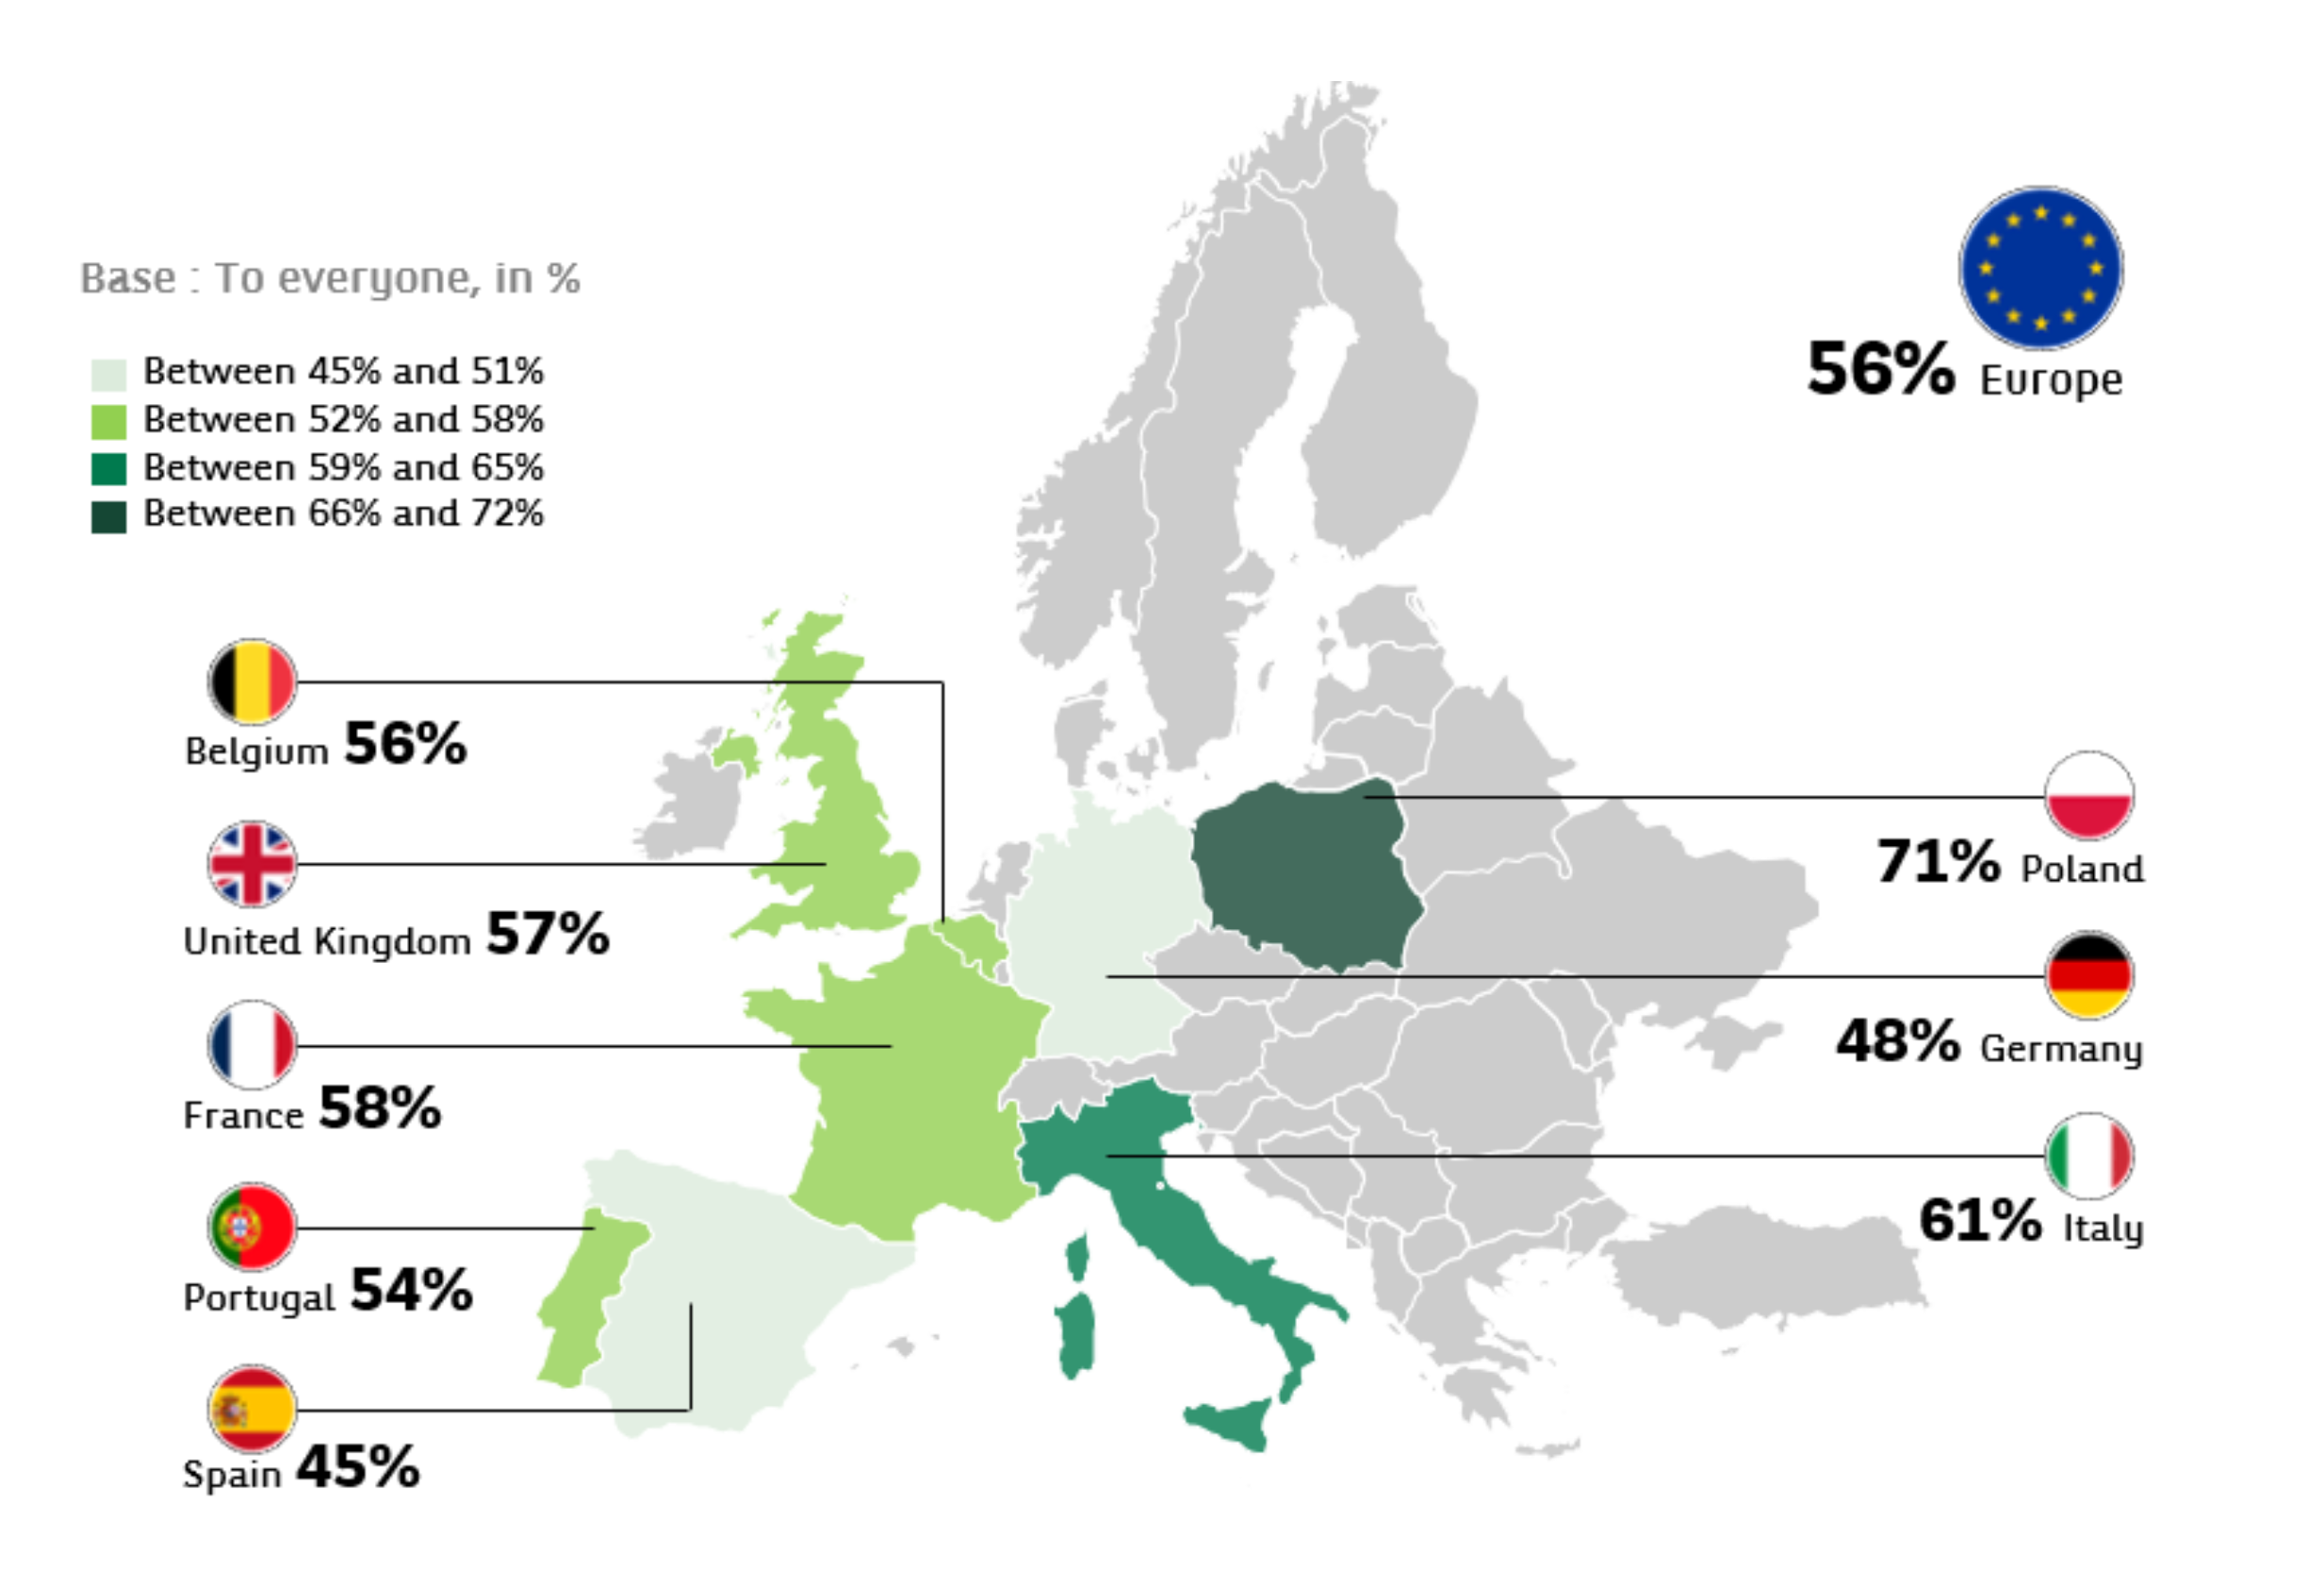 The image presents a map of Europe highlighting the levels of concerns related to housing in eight countries.
The percentages indicated are:
Belgium: 56%
United Kingdom: 57%
France: 58%
Portugal: 54%
Spain: 45%
Poland: 71%
Germany: 48%
Italy: 61%
At the top right, an indicator displays 56% – Europe, corresponding to the European average.
The map allows for a quick visualization of the differences in concerns: the highest levels appear in Poland and Italy, while the United Kingdom and Germany are among the lowest.
The image presents a map of Europe highlighting the levels of concerns related to housing in eight countries.
The percentages indicated are:
Belgium: 56%
United Kingdom: 57%
France: 58%
Portugal: 54%
Spain: 45%
Poland: 71%
Germany: 48%
Italy: 61%
At the top right, an indicator displays 56% – Europe, corresponding to the European average.
The map allows for a quick visualization of the differences in concerns: the highest levels appear in Poland and Italy, while the United Kingdom and Germany are among the lowest.
A two-speed European dynamic for investing in the energy transition
- 62% of Europeans want to change their habits to reduce their energy consumption. (Fig.9)
- 51% of Europeans want to invest in new equipment. (Fig.9)
Fig 9 – Priorities for energy efficiency work
Download this infographic for your presentations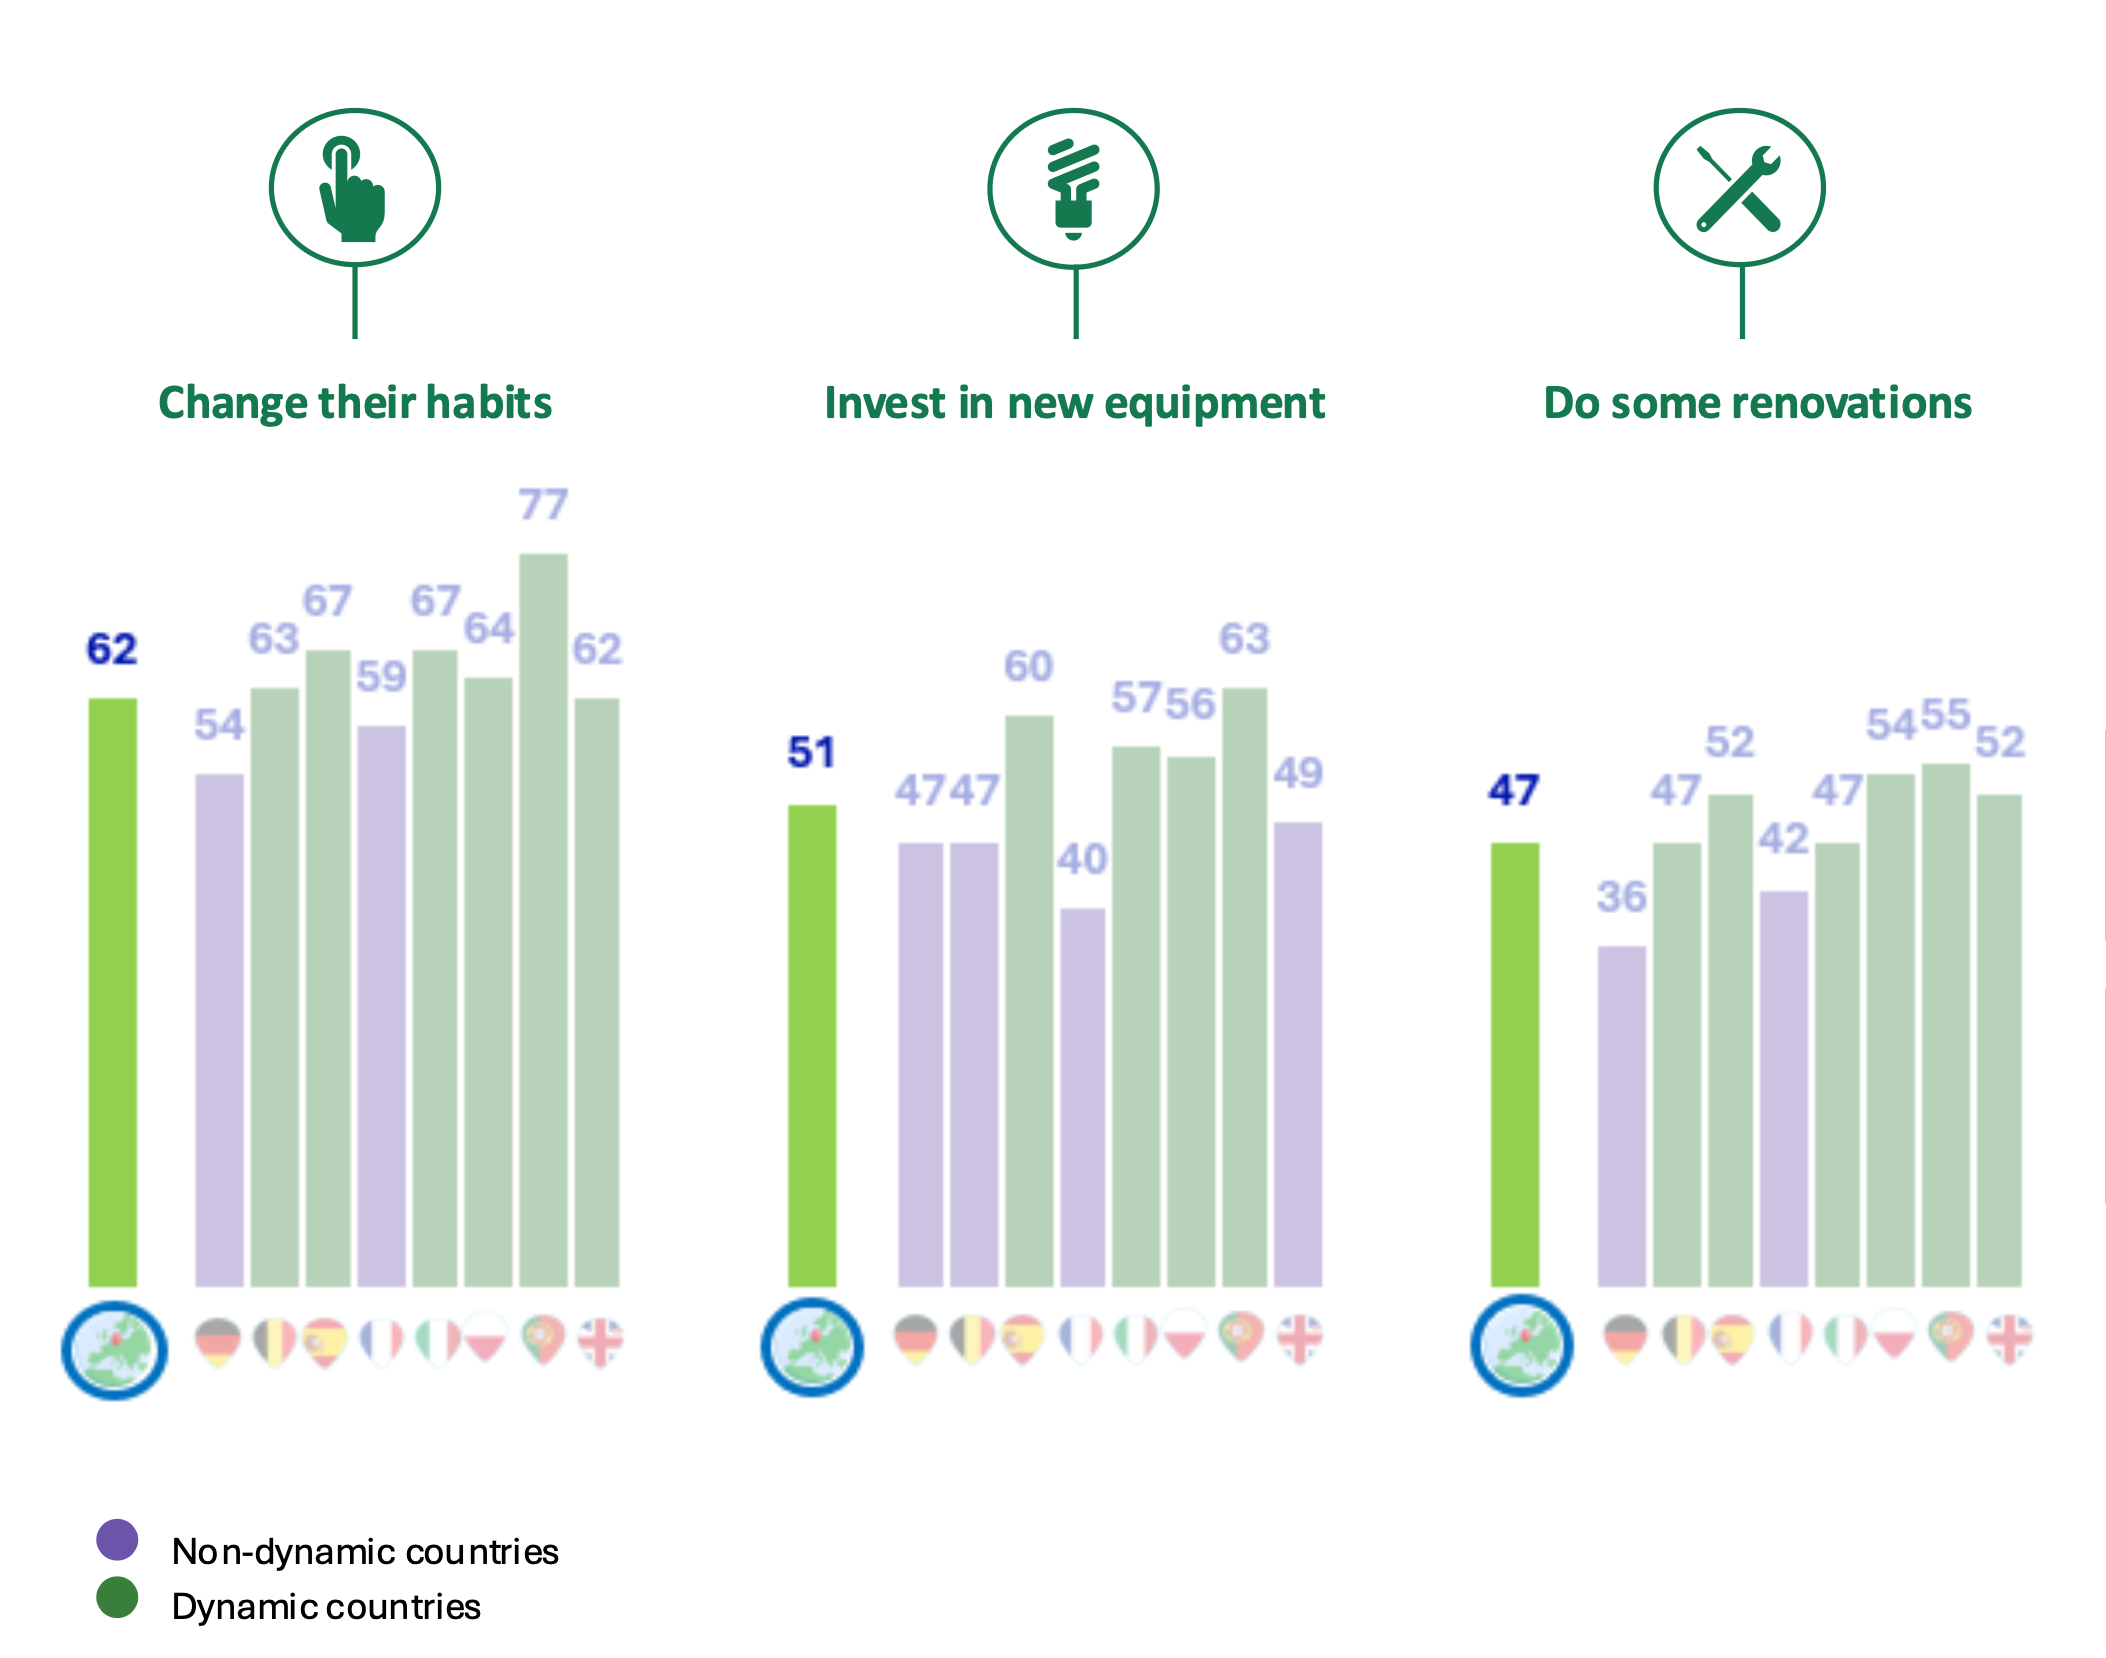 The visual presents a horizontal histogram showing the work that respondents want to do to improve the energy efficiency of their home.
The data displayed is:
Equipment with low-consumption appliances: 30%.
Replacement of windows: 28%.
Insulation of the roof and/or walls: 26%.
Installation or renewal of a high-performance heating system: 24%.
Equipment with programming and regulation tools: 22%.
Insulation of the attic and/or floor: 20%.
Installation or renewal of a heat pump: 18%.
Replacement of a gas or oil boiler: 18%.
No work: 14%.
Installation of ventilation: 13%.
Do not know: 10%.
The distribution shows that the most frequently cited actions concern reducing energy consumption through equipment or insulation improvements.
The visual presents a horizontal histogram showing the work that respondents want to do to improve the energy efficiency of their home.
The data displayed is:
Equipment with low-consumption appliances: 30%.
Replacement of windows: 28%.
Insulation of the roof and/or walls: 26%.
Installation or renewal of a high-performance heating system: 24%.
Equipment with programming and regulation tools: 22%.
Insulation of the attic and/or floor: 20%.
Installation or renewal of a heat pump: 18%.
Replacement of a gas or oil boiler: 18%.
No work: 14%.
Installation of ventilation: 13%.
Do not know: 10%.
The distribution shows that the most frequently cited actions concern reducing energy consumption through equipment or insulation improvements.
Targeted renovation: Specific projects rather than a full transformation
- In Europe, almost 1 in 3 households see LED equipment (30%) and window replacement (28%) as the top priorities to improve their home’s energy efficiency. (Fig.10)
- 76% of Europeans ideally have in mind at least one project to enhance energy efficiency. (Fig.10)
Fig 10 – Planned actions according to the energy dynamics of the household
Download this infographic for your presentations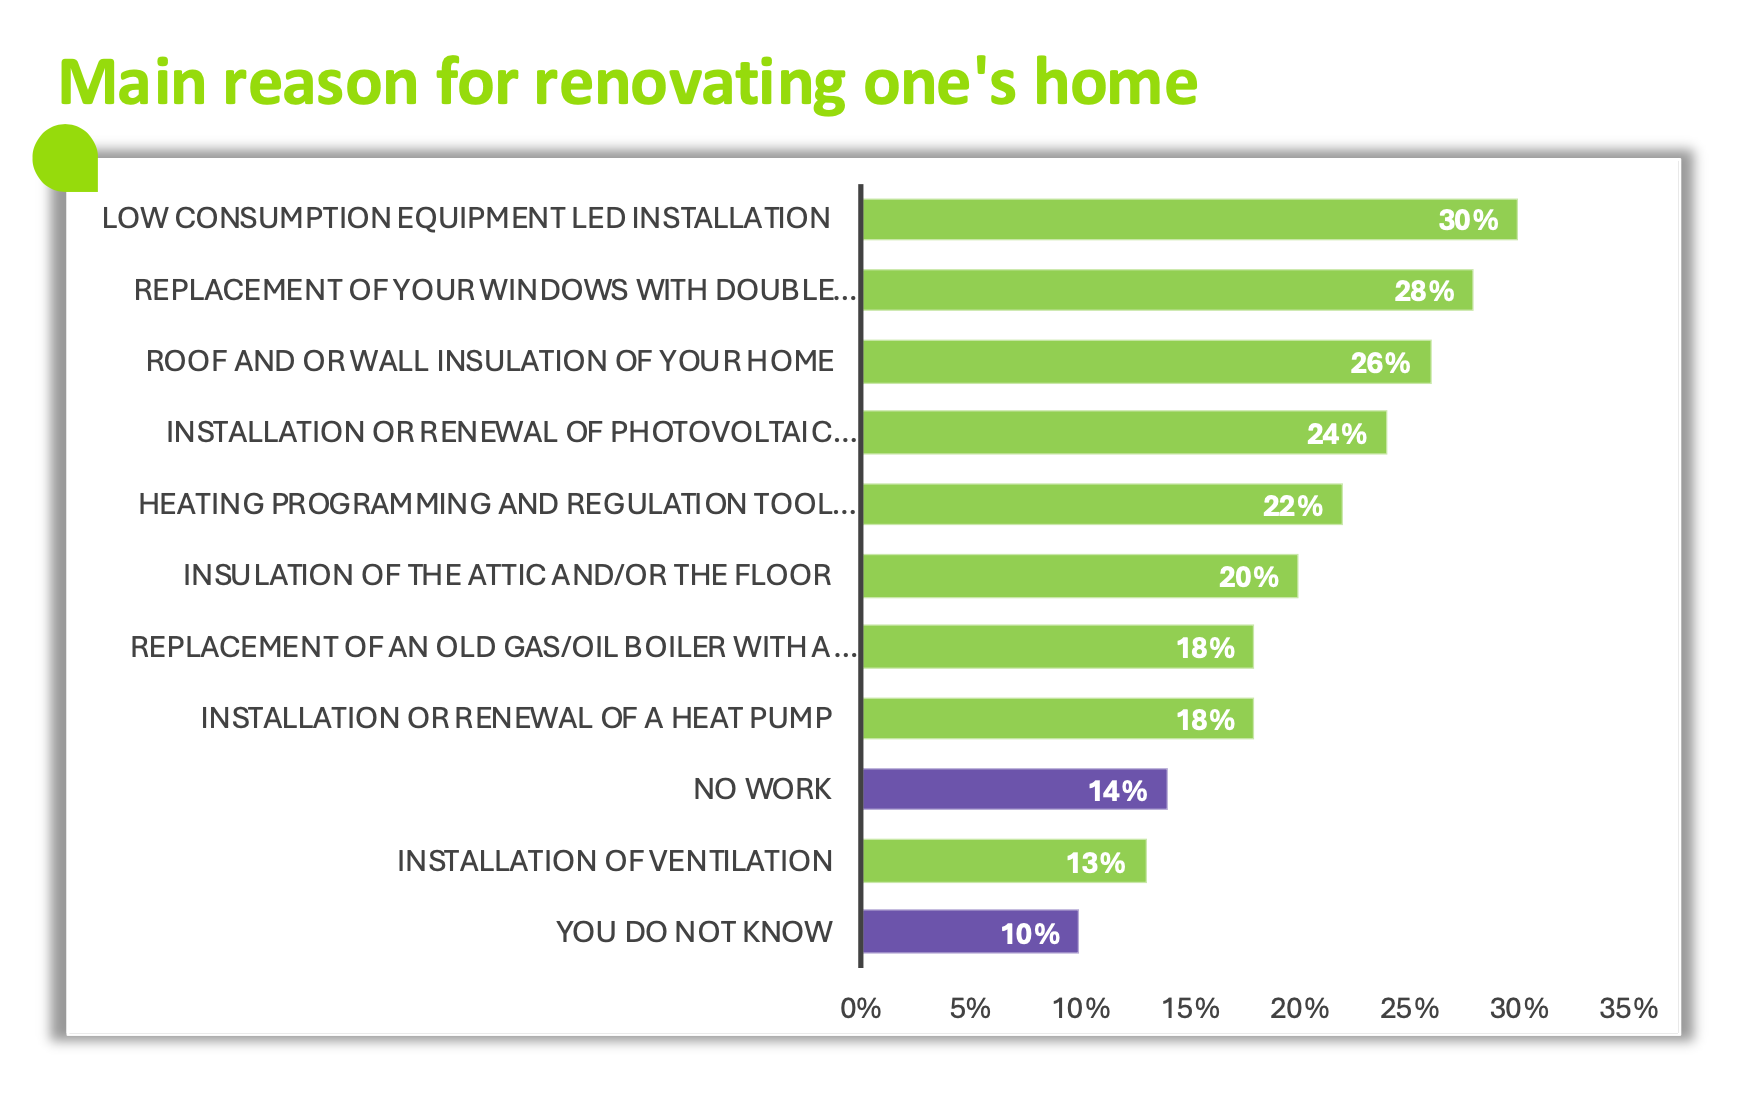 The image shows three groups of vertical bars comparing the level of adoption of different energy-related actions according to two categories of households: “weak dynamics” (purple bars) and “strong dynamics” (light green bars).
The three main actions are: Modify habits: European average 62%. The bars associated with countries show values ranging from 54% to 77%.
Invest in new equipment: European average 51%. Countries display values ranging from 40% to 63%.
Carry out work: European average 47%. The bars by country range from 36% to 55%.
The comparison highlights that the action “modify habits” presents the highest levels of adoption, particularly in countries with strong dynamics. The other two actions (equipment and work) show more moderate levels.
The image shows three groups of vertical bars comparing the level of adoption of different energy-related actions according to two categories of households: “weak dynamics” (purple bars) and “strong dynamics” (light green bars).
The three main actions are: Modify habits: European average 62%. The bars associated with countries show values ranging from 54% to 77%.
Invest in new equipment: European average 51%. Countries display values ranging from 40% to 63%.
Carry out work: European average 47%. The bars by country range from 36% to 55%.
The comparison highlights that the action “modify habits” presents the highest levels of adoption, particularly in countries with strong dynamics. The other two actions (equipment and work) show more moderate levels.
Targeted renovation: A specific willingness to produce energy through solar panels
Fig 11 – Intention to carry out energy renovation work (installation of solar panels) by country
Download this infographic for your presentations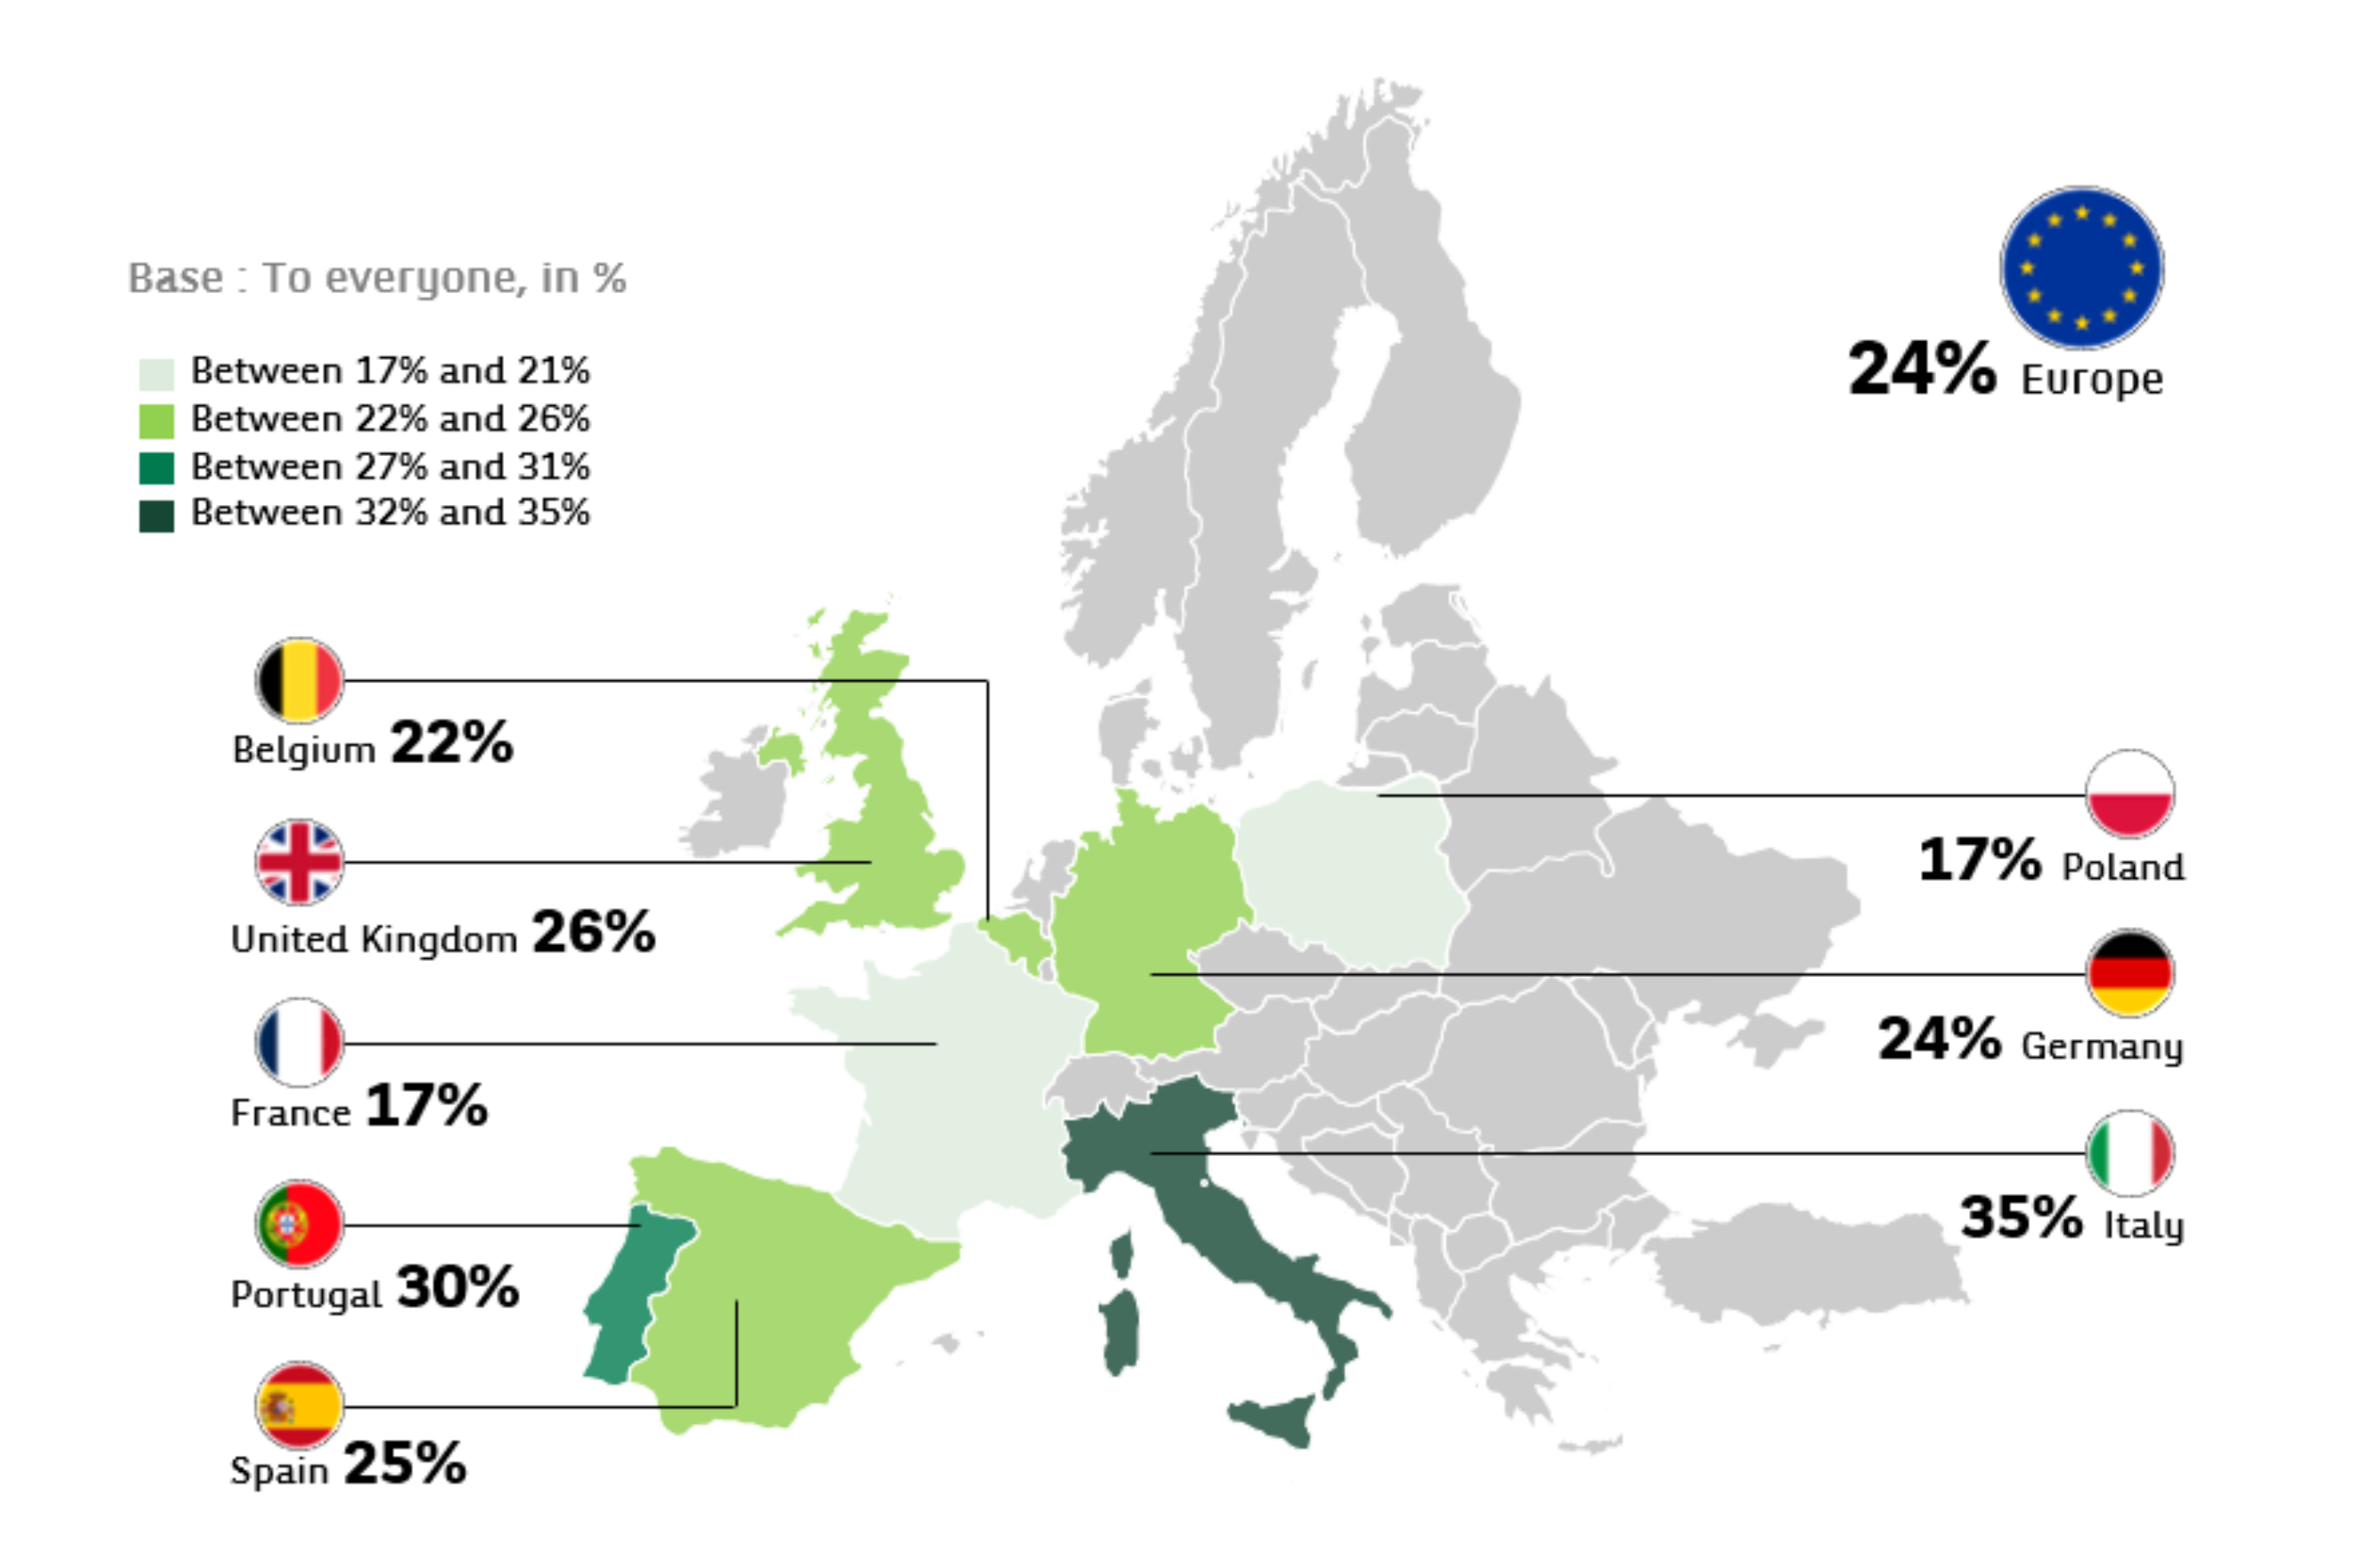 The image presents a map of Europe displaying the levels of intention to carry out energy renovation work in eight countries.
The percentages indicated for each country are:
Belgium: 22%
United Kingdom: 26%
France: 17%
Portugal: 30%
Spain: 25%
Poland: 17%
Germany: 24%
Italy: 35%
At the top right, an indicator displays 24% – Europe, indicating the European average.
The map shows that the highest intentions are in Italy and Portugal, while France and Poland are in the lower range of intentions.
Source indicated: Cetelem Observatory 2025.
The image presents a map of Europe displaying the levels of intention to carry out energy renovation work in eight countries.
The percentages indicated for each country are:
Belgium: 22%
United Kingdom: 26%
France: 17%
Portugal: 30%
Spain: 25%
Poland: 17%
Germany: 24%
Italy: 35%
At the top right, an indicator displays 24% – Europe, indicating the European average.
The map shows that the highest intentions are in Italy and Portugal, while France and Poland are in the lower range of intentions.
Source indicated: Cetelem Observatory 2025.
Economy and Comfort: The concrete drivers of an ecological approach
- Ecological awareness of Europeans as a driver of renovation work has significantly declined since last year: – 10 points (Fig.12)
- 46% of Europeans consider comfort as the leading reason to renovate their home. (Fig.12)
Fig 12 – Main motivations for home renovation
Download this infographic for your presentations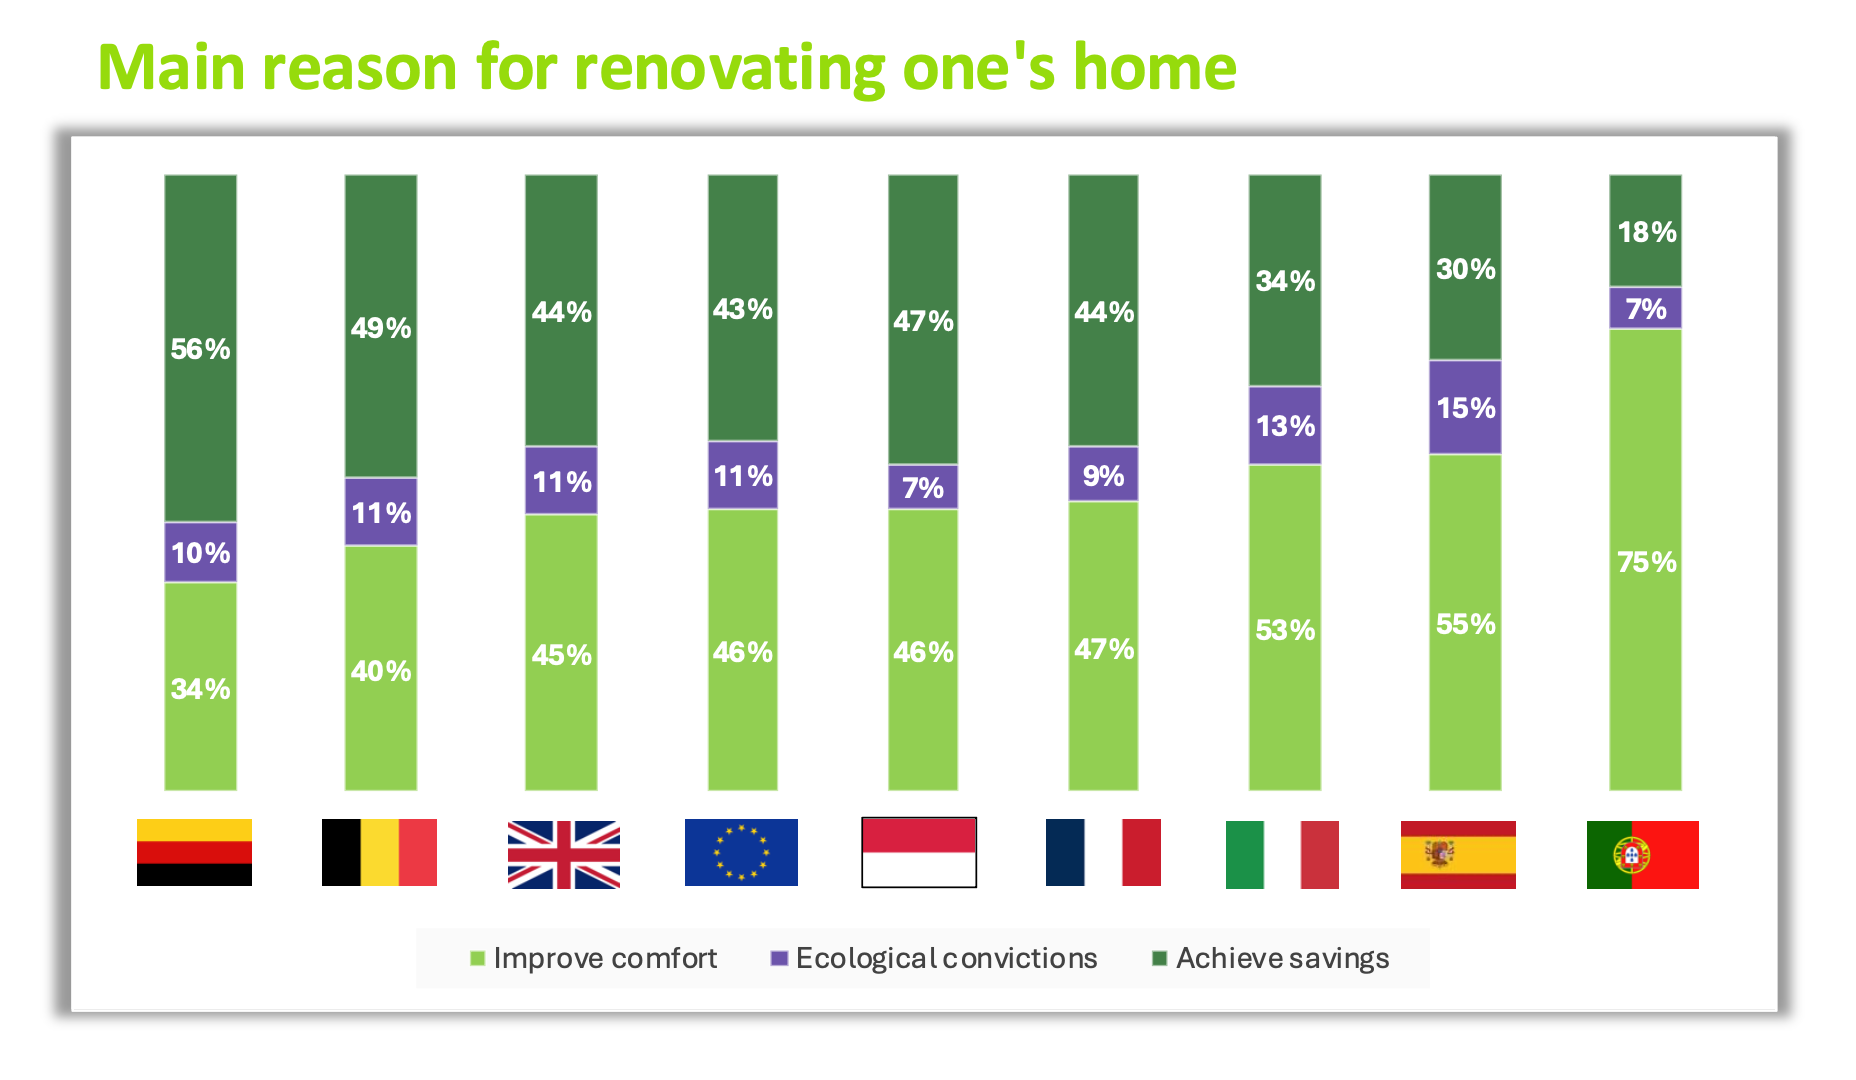 The visual presents a vertical bar chart indicating the main reason for home renovation in different European countries. Each bar contains three segments: light green: improve comfort, purple: ecological conviction, dark green: make savings.
The data displayed is:
Germany: 34% comfort, 10% ecological conviction, 56% savings.
Belgium: 40%, 11%, 49%.
United Kingdom: 45%, 11%, 44%.
Europe (average): 46%, 11%, 43%.
Poland: 46%, 7%, 47%.
France: 47%, 9%, 44%.
Italy: 53%, 13%, 34%.
Spain: 55%, 15%, 30%.
Portugal: 75%, 7%, 18%.
The distribution shows that motivations vary by country: some prioritize comfort, others reducing expenses.
The visual presents a vertical bar chart indicating the main reason for home renovation in different European countries. Each bar contains three segments: light green: improve comfort, purple: ecological conviction, dark green: make savings.
The data displayed is:
Germany: 34% comfort, 10% ecological conviction, 56% savings.
Belgium: 40%, 11%, 49%.
United Kingdom: 45%, 11%, 44%.
Europe (average): 46%, 11%, 43%.
Poland: 46%, 7%, 47%.
France: 47%, 9%, 44%.
Italy: 53%, 13%, 34%.
Spain: 55%, 15%, 30%.
Portugal: 75%, 7%, 18%.
The distribution shows that motivations vary by country: some prioritize comfort, others reducing expenses.