Slight Breeze of Optimism in Europe for 2026


MACROECONOMIC CONTEXT: IMPROVEMENT IN THE EURO ZONE
After holding up well in 2025 (1.5%), growth in the Eurozone should strengthen in 2026 (+1.6%) according to forecasts from BNP PARIBAS economic research. GDP growth of 1.4% in Germany in 2026 and increased military spending in Europe will help to sustain economic growth.
In addition, the buoyancy of the labour market combined with inflation that is likely to remain below the 2% target will also be factors supporting European morale and household consumption.
Against this backdrop, Spain will remain the driving force behind the Eurozone’s main economies, with growth expected to be well above 2%.
In France, supported by a revival in aerospace production and exports, as well as by investment from nonfinancial companies, growth is expected to rise from +0.8% in 2025 to +1.1% this year.
Disinflation is now clear, continuing in 2025 (1% on average compared with 2.3% in 2024 according to the harmonised index), which for the moment has not led to an acceleration in household consumption growth or a fall in the household savings rate.
Fig 1 – GDP growth and inflation by country
Download this infographic for your presentations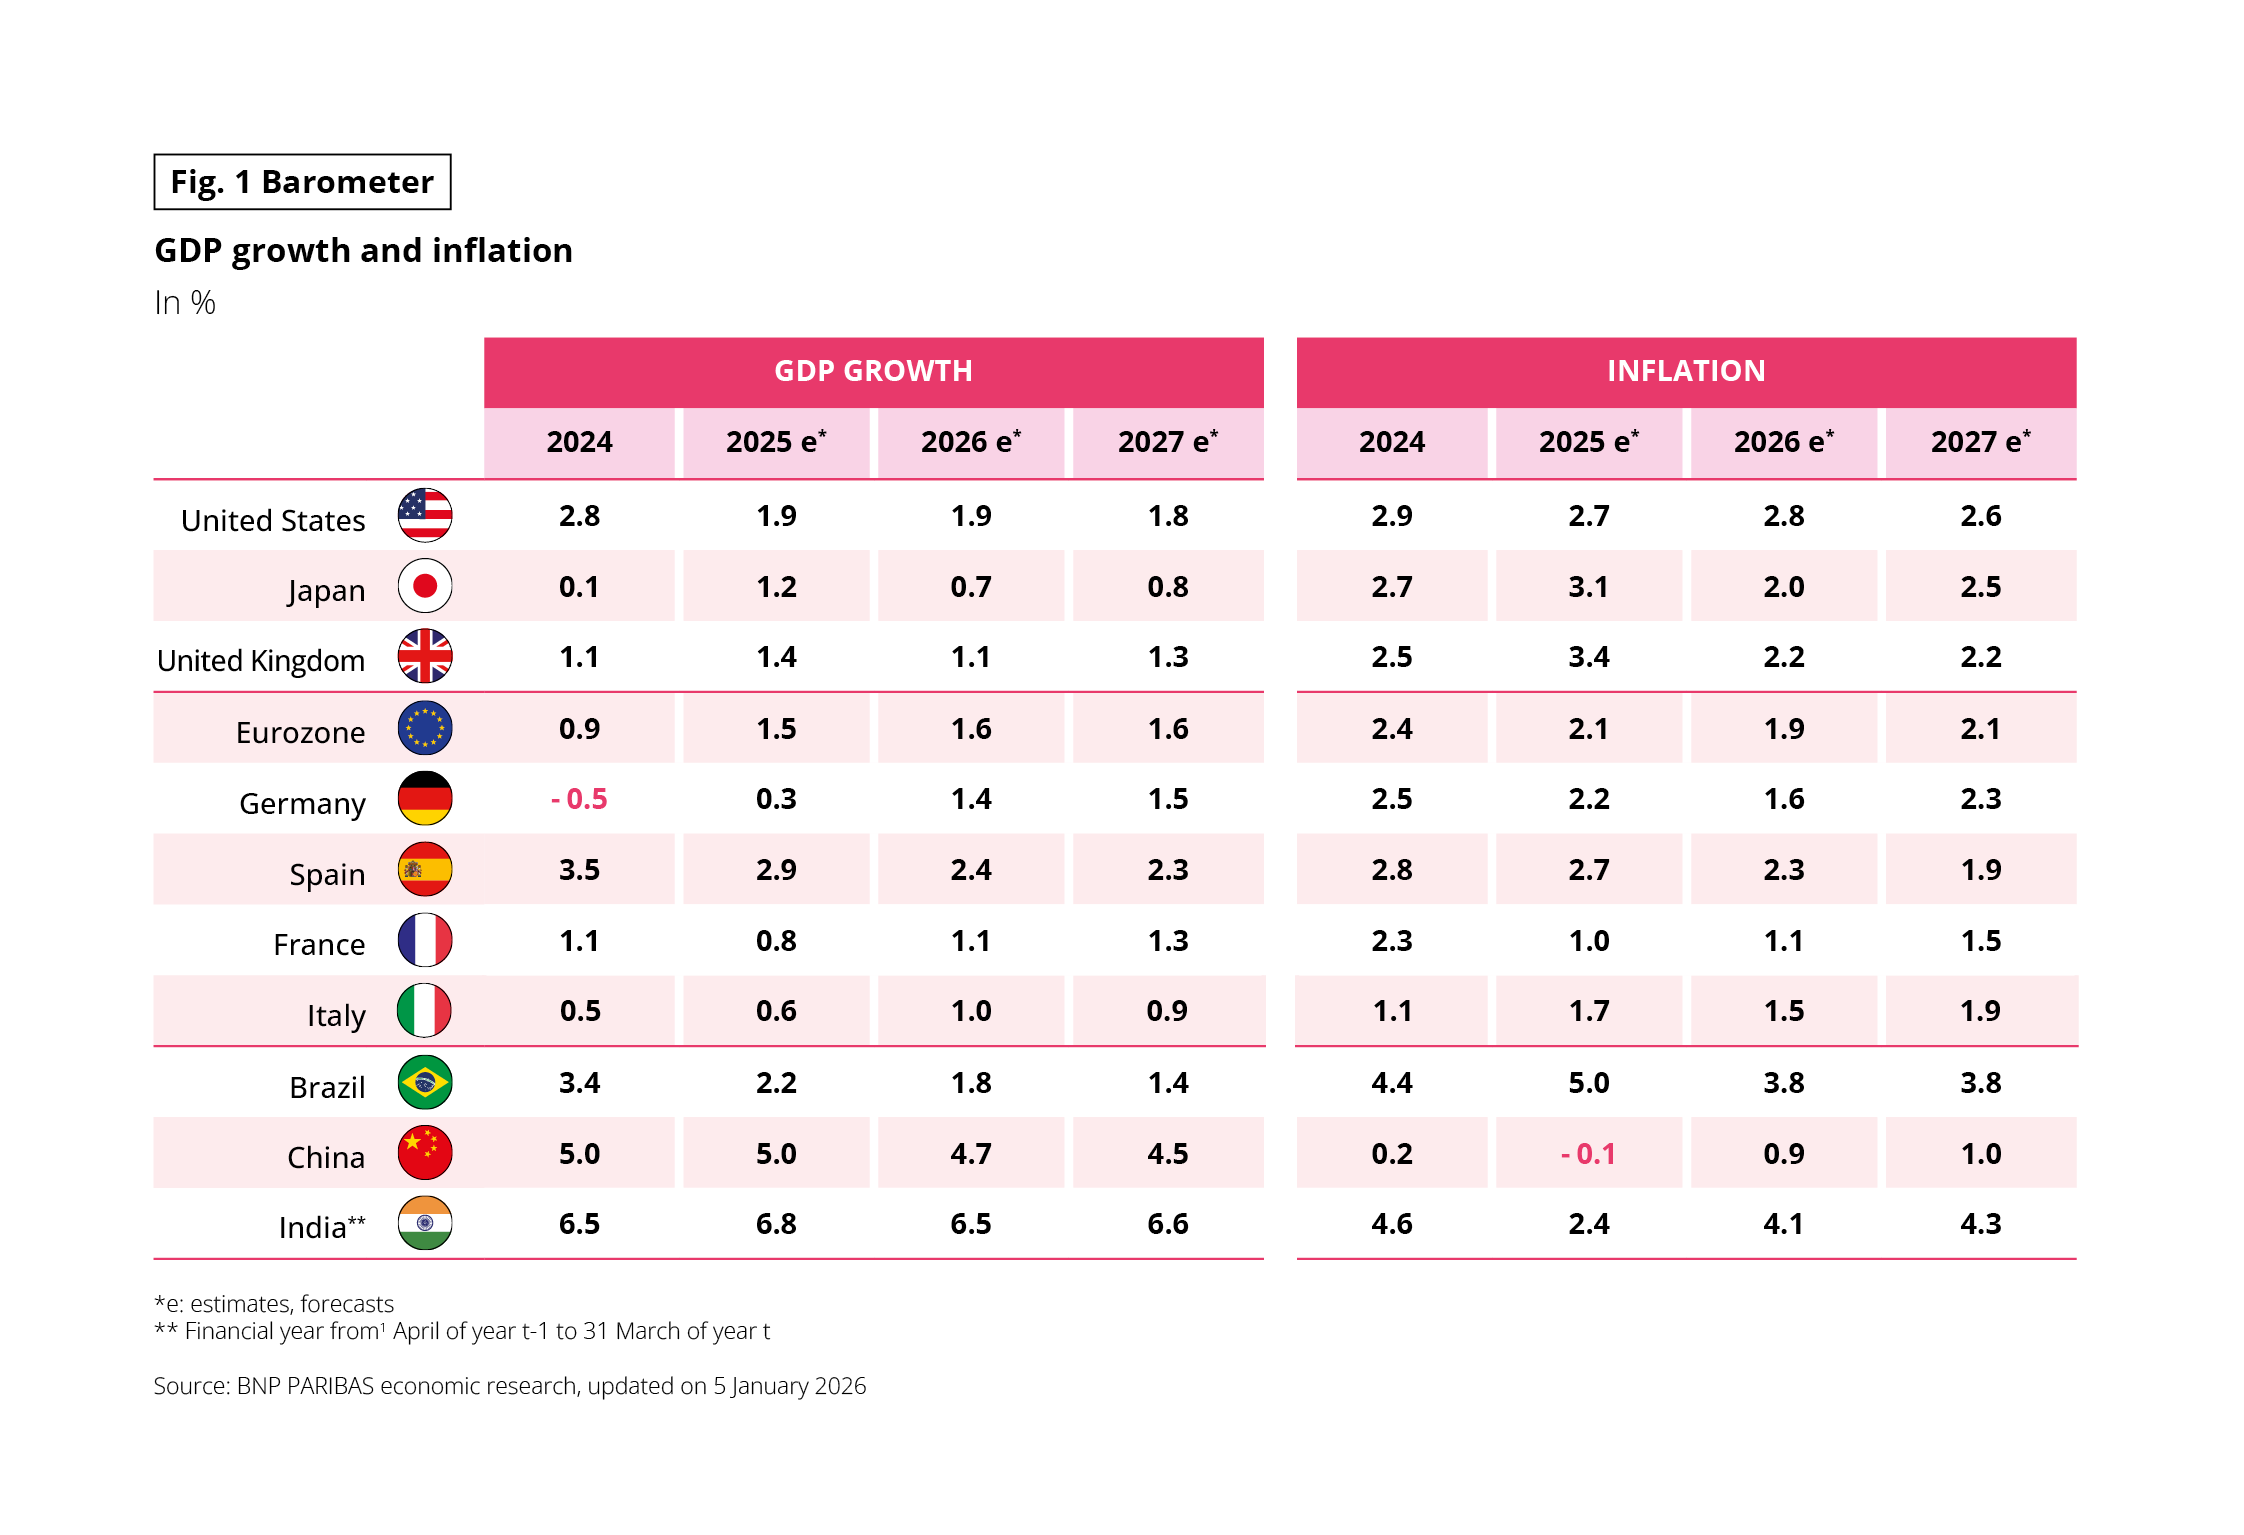 The visual presents an economic barometer comparing GDP growth and inflation rates, in percentage, for several countries between 2024 and 2027. Data from 2025 to 2027 are estimates.
Data
GDP Growth (in %):
United States: 2.8 (2024), 1.9 (2025e), 1.9 (2026e), 1.8 (2027e)
Japan: 0.1; 1.2; 0.7; 0.8
United Kingdom: 1.1; 1.4; 1.1; 1.3
Eurozone: 0.9; 1.5; 1.6; 1.6
Germany: -0.5; 0.3; 1.4; 1.5
Spain: 3.5; 2.9; 2.4; 2.3
France: 1.1; 0.8; 1.1; 1.3
Italy: 0.5; 0.6; 1.0; 0.9
Brazil: 3.4; 2.2; 1.8; 1.4
China: 5.0; 5.0; 4.7; 4.5
India: 6.5; 6.8; 6.5; 6.6
Inflation (in %):
United States: 2.9; 2.7; 2.8; 2.6
Japan: 2.7; 3.1; 2.0; 2.5
United Kingdom: 2.5; 3.4; 2.2; 2.2
Eurozone: 2.4; 2.1; 1.9; 2.1
Germany: 2.5; 2.2; 1.6; 2.3
Spain: 2.8; 2.7; 2.3; 1.9
France: 2.3; 1.0; 1.1; 1.5
Italy: 1.1; 1.7; 1.5; 1.9
Brazil: 4.4; 5.0; 3.8; 3.8
China: 0.2; -0.1; 0.9; 1.0
India: 4.6; 2.4; 4.1; 4.3
Main Finding
Growth and inflation rates vary significantly across countries, with higher growth levels in India and China, and generally lower inflation in the Eurozone in the medium term.
Source: BNP Paribas Economic Research, updated on January 5, 2026
Note: e = estimates; Indian fiscal year is shifted
The visual presents an economic barometer comparing GDP growth and inflation rates, in percentage, for several countries between 2024 and 2027. Data from 2025 to 2027 are estimates.
Data
GDP Growth (in %):
United States: 2.8 (2024), 1.9 (2025e), 1.9 (2026e), 1.8 (2027e)
Japan: 0.1; 1.2; 0.7; 0.8
United Kingdom: 1.1; 1.4; 1.1; 1.3
Eurozone: 0.9; 1.5; 1.6; 1.6
Germany: -0.5; 0.3; 1.4; 1.5
Spain: 3.5; 2.9; 2.4; 2.3
France: 1.1; 0.8; 1.1; 1.3
Italy: 0.5; 0.6; 1.0; 0.9
Brazil: 3.4; 2.2; 1.8; 1.4
China: 5.0; 5.0; 4.7; 4.5
India: 6.5; 6.8; 6.5; 6.6
Inflation (in %):
United States: 2.9; 2.7; 2.8; 2.6
Japan: 2.7; 3.1; 2.0; 2.5
United Kingdom: 2.5; 3.4; 2.2; 2.2
Eurozone: 2.4; 2.1; 1.9; 2.1
Germany: 2.5; 2.2; 1.6; 2.3
Spain: 2.8; 2.7; 2.3; 1.9
France: 2.3; 1.0; 1.1; 1.5
Italy: 1.1; 1.7; 1.5; 1.9
Brazil: 4.4; 5.0; 3.8; 3.8
China: 0.2; -0.1; 0.9; 1.0
India: 4.6; 2.4; 4.1; 4.3
Main Finding
Growth and inflation rates vary significantly across countries, with higher growth levels in India and China, and generally lower inflation in the Eurozone in the medium term.
Source: BNP Paribas Economic Research, updated on January 5, 2026
Note: e = estimates; Indian fiscal year is shifted
SITUATION IN DIFFERENT COUNTRIES: A STABLE OPINION
For the past two years, despite the international crises that have had a lasting impact on people’s minds, the score given to the current situation in the survey’s different countries has remained remarkably stable. For the second year running, it averages at 5.2 for the 10 countries included in this Observatoire Cetelem 2026, following the score of 5.1 recorded for the 2024 edition. France came in at a low 4.7, up 0.1 points but still well below the European average.
However, there were significant variations from one country to another. Romania saw the sharpest fall (-0.6 points) against a backdrop of political tension, marked by the cancellation of the presidential elections at the beginning of the year. Conversely, Spain, Poland, Portugal and, to a lesser extent, Italy, rode the wave of their good economic results to record a significant rise in this rating.
Since the Covid-19 period, there have also been significant changes. Germany was the most optimistic country at the time, with a score of 6.6, but has seen the sharpest drop (-1.4 points), and is now in the middle of the pack (5.2). This points to a deep crisis from which it is struggling to emerge. At the other end of the scale, Spain and Poland bounced back by 0.5 points, the latter country even becoming the most optimistic about its situation after Sweden.
Fig 2 – Perception of the general situation by country
Download this infographic for your presentations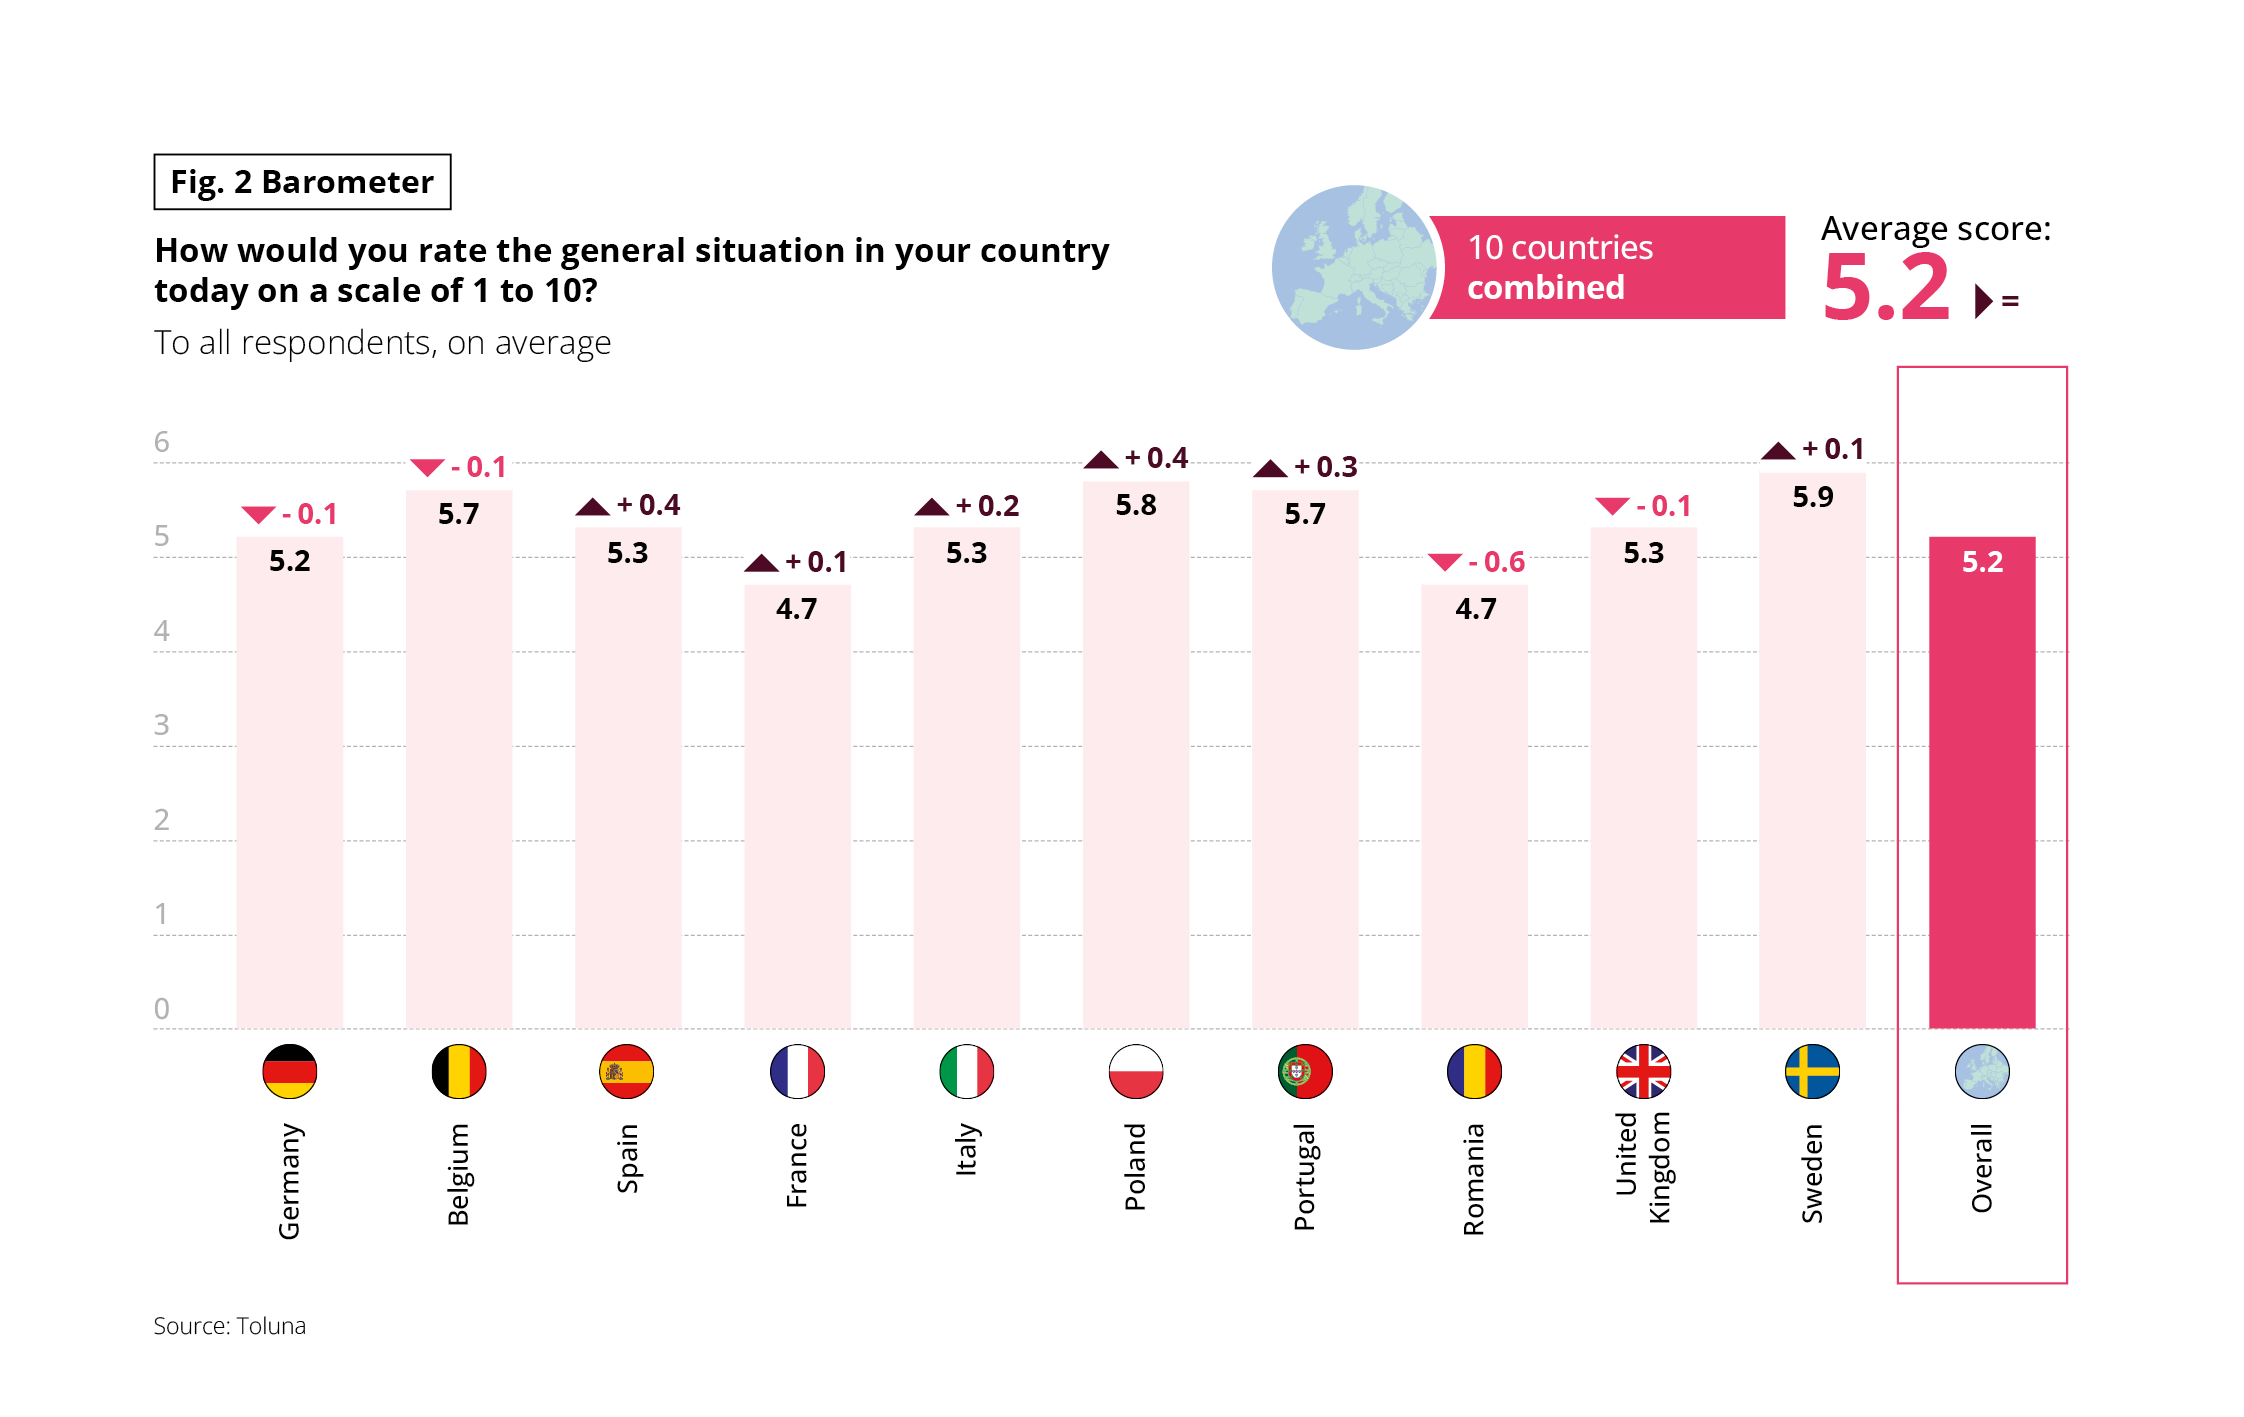 The graph presents the average evaluation of the current general situation of each country, on a scale of 1 to 10, expressed by the respondents.Data
Average ratings:
Germany: 5.2 (change -0.1)
Belgium: 5.7 (-0.1)
Spain: 5.3 (+0.4)
France: 4.7 (+0.1)
Italy: 5.3 (+0.2)
Poland: 5.8 (+0.4)
Portugal: 5.7 (+0.3)
Romania: 4.7 (-0.6)
United Kingdom: 5.3 (-0.1)
Sweden: 5.9 (+0.1)
Average of all 10 countries: 5.2 (stable)
Main Finding
National perceptions are generally around the average of 5.2, with moderate differences between countries.
Source: Toluna
The graph presents the average evaluation of the current general situation of each country, on a scale of 1 to 10, expressed by the respondents.Data
Average ratings:
Germany: 5.2 (change -0.1)
Belgium: 5.7 (-0.1)
Spain: 5.3 (+0.4)
France: 4.7 (+0.1)
Italy: 5.3 (+0.2)
Poland: 5.8 (+0.4)
Portugal: 5.7 (+0.3)
Romania: 4.7 (-0.6)
United Kingdom: 5.3 (-0.1)
Sweden: 5.9 (+0.1)
Average of all 10 countries: 5.2 (stable)
Main Finding
National perceptions are generally around the average of 5.2, with moderate differences between countries.
Source: Toluna
PERSONAL CIRCUMSTANCES: STILL IN GOOD SPIRITS
As usual, the score given to people’s own personal circumstances was more flattering, up slightly by 0.1 points since last year, now reaching 6.1. The trend is positive in 7 out of 10 countries, particularly Poland and Portugal (+0.4 and +0.3 points).
Once again, Romania saw the biggest drop (-0.5 points). The problems with the old and dilapidated urban heating system, which affects many inhabitants personally, undoubtedly have a direct impact on the way Romanians feel. The score was also down in Germany, which now occupies the penultimate place in the ranking. Over the long term, Germans once again stood out for their pessimism, with -0.6 points recorded since the Covid-19 period. The Portuguese and the French showed the biggest increase in morale over the same period (+0.3 points).
Fig 3 – Perception of the current personal situation
Download this infographic for your presentations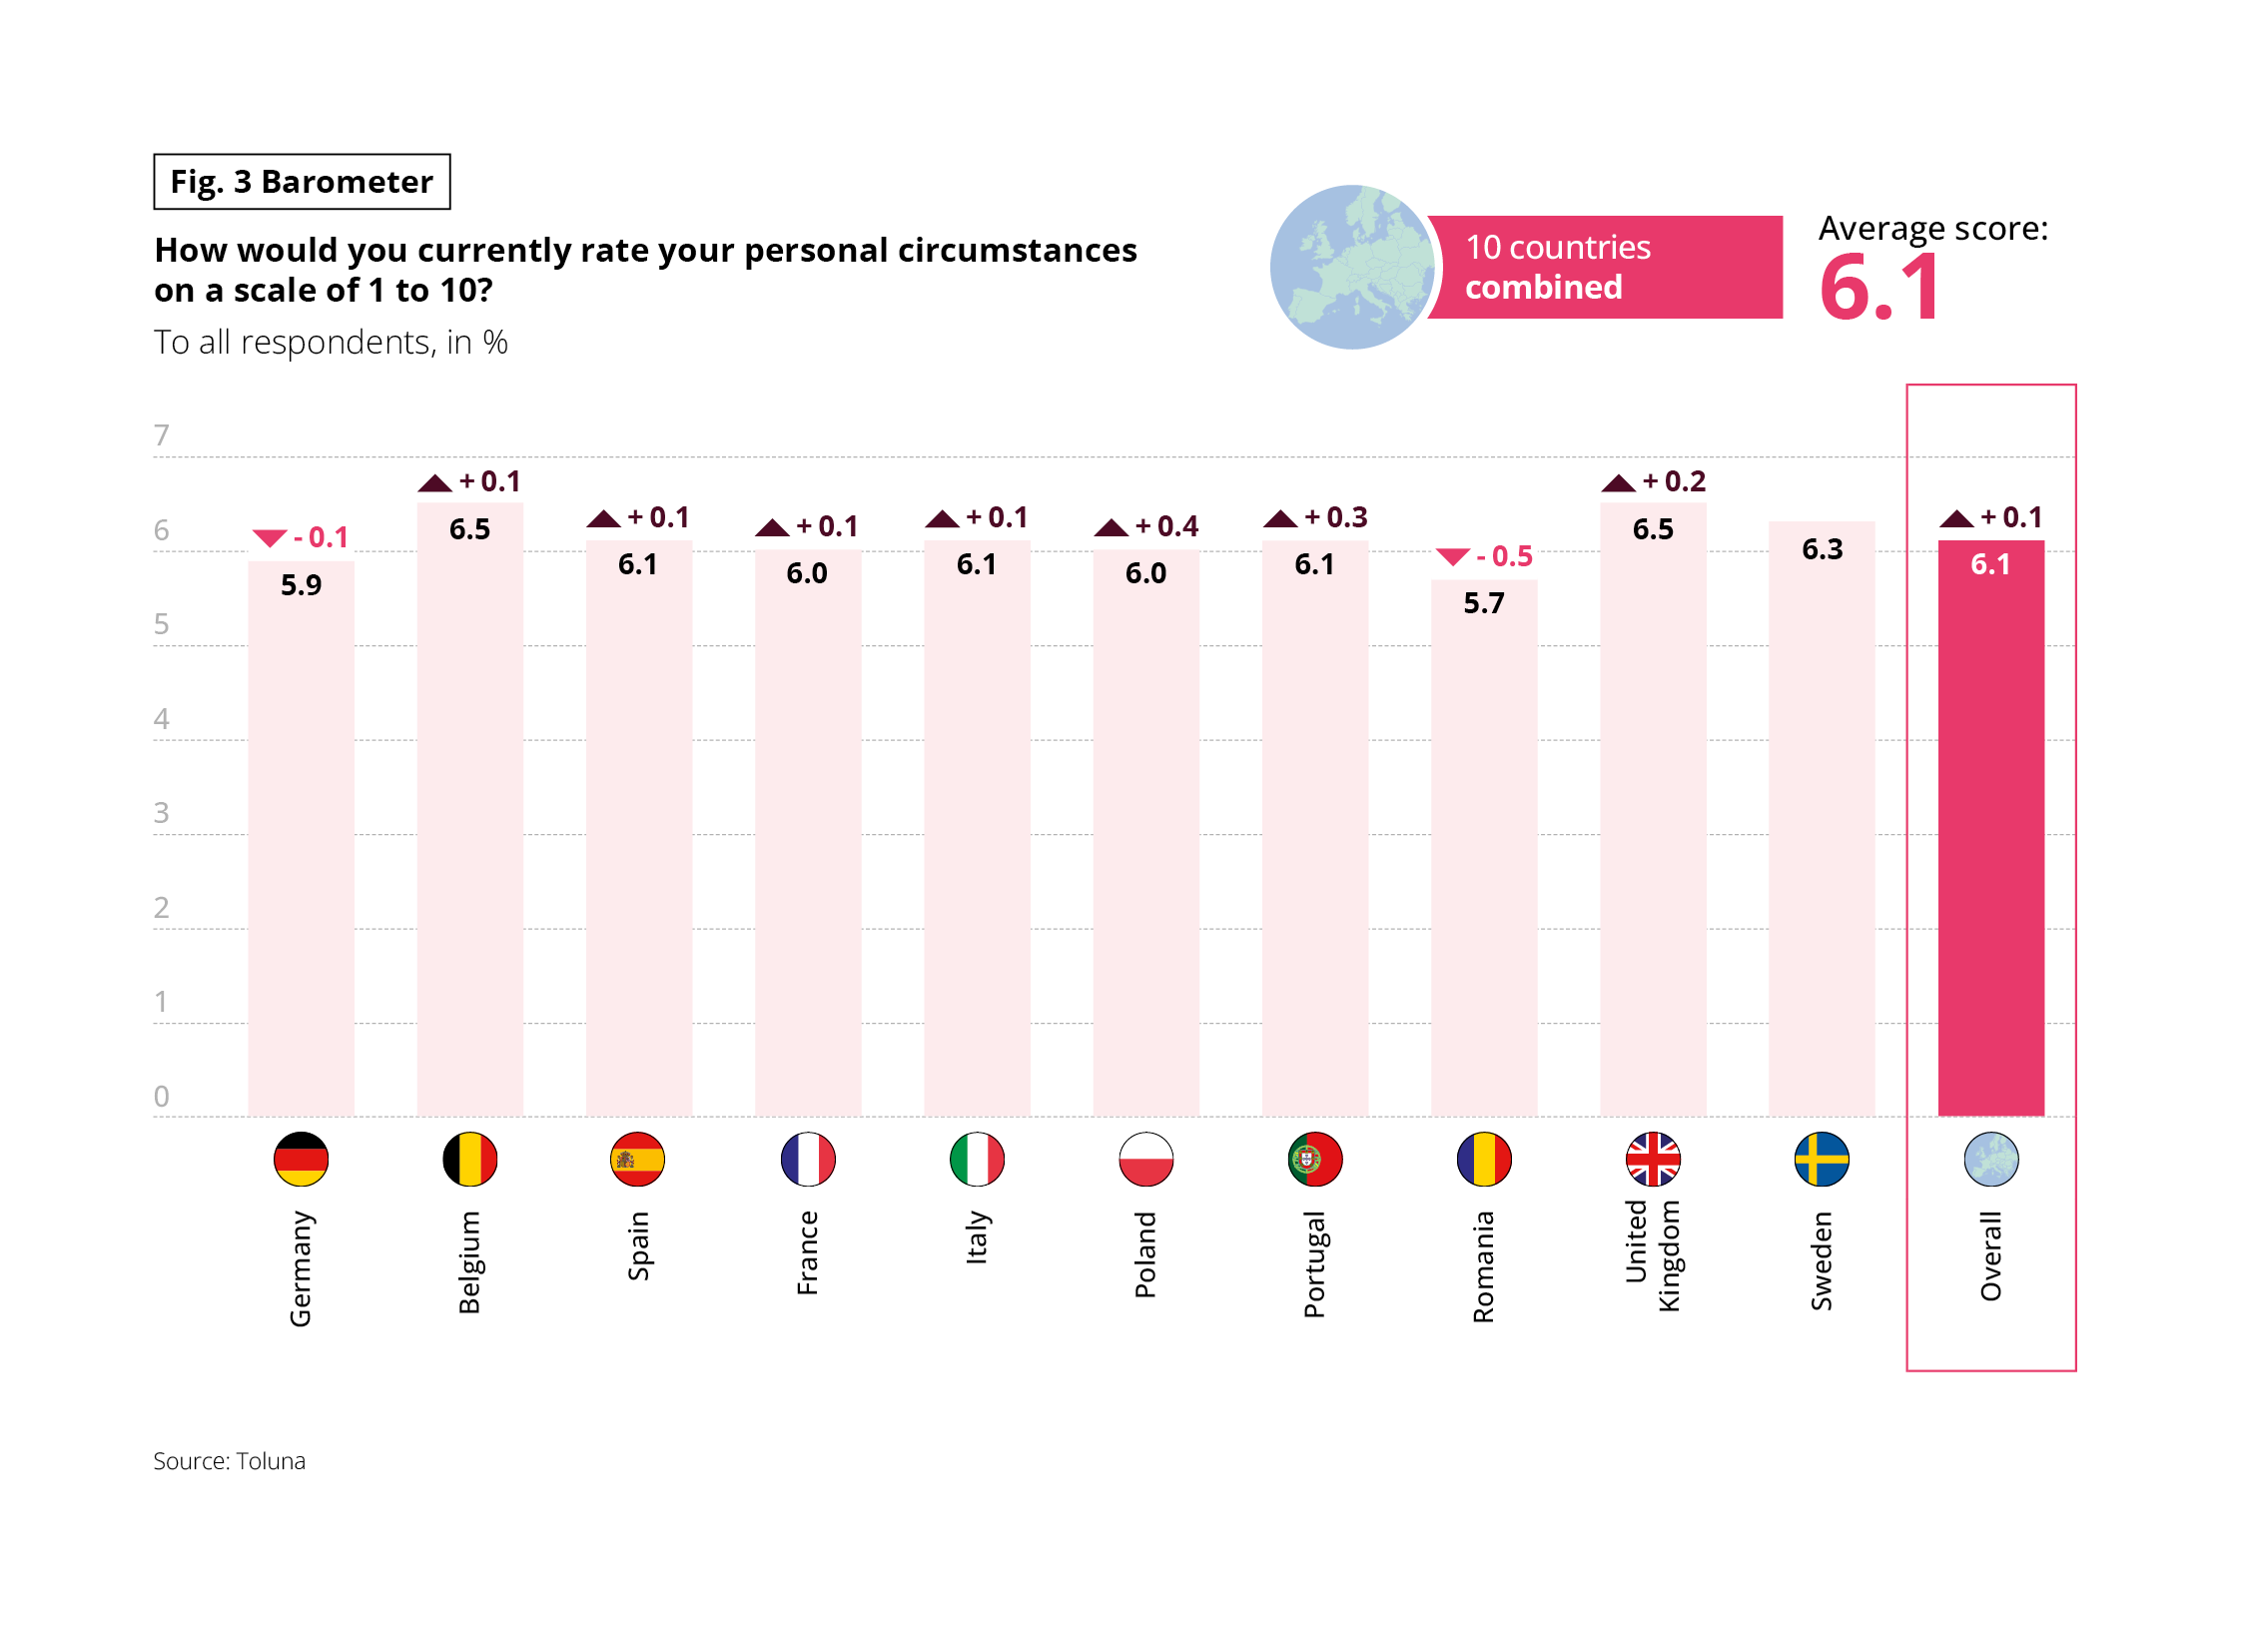 The graph measures the perception of the current personal situation of the respondents, on a scale of 1 to 10.
Data
Average ratings:
Germany: 5.9 (-0.1)
Belgium: 6.5 (+0.1)
Spain: 6.1 (+0.1)
France: 6.0 (+0.1)
Italy: 6.1 (+0.1)
Poland: 6.0 (+0.4)
Portugal: 6.1 (+0.3)
Romania: 5.7 (-0.5)
United Kingdom: 6.5 (+0.2)
Sweden: 6.3 (change not indicated)
Average of all 10 countries: 6.1 (+0.1)
Main Finding
The perception of the personal situation is, on average, more positive than that of the general situation, with an average above 6 out of 10.
Source: Toluna
The graph measures the perception of the current personal situation of the respondents, on a scale of 1 to 10.
Data
Average ratings:
Germany: 5.9 (-0.1)
Belgium: 6.5 (+0.1)
Spain: 6.1 (+0.1)
France: 6.0 (+0.1)
Italy: 6.1 (+0.1)
Poland: 6.0 (+0.4)
Portugal: 6.1 (+0.3)
Romania: 5.7 (-0.5)
United Kingdom: 6.5 (+0.2)
Sweden: 6.3 (change not indicated)
Average of all 10 countries: 6.1 (+0.1)
Main Finding
The perception of the personal situation is, on average, more positive than that of the general situation, with an average above 6 out of 10.
Source: Toluna
A POORER FINANCIAL SITUATION THAN THE MAJORITY
The discrepancy between people’s satisfaction with their country’s situation and with their personal circumstances leads Europeans to be cautious about their financial situation. Only a quarter of them thought it was better than that of the majority of other inhabitants. 40% saw no difference. 34% considered it inferior.
While the Germans were the most likely to report a negative gap, they were also the most likely to see a positive one. The Romanians, Swedes, French and Spanish were the most critical, while the British and Poles were both optimistic.
It should be noted, however, that the feeling that one’s income is lower than that of the majority has been declining over the last 10 years.
Fig 4 – Perception of income compared to the majority
Download this infographic for your presentations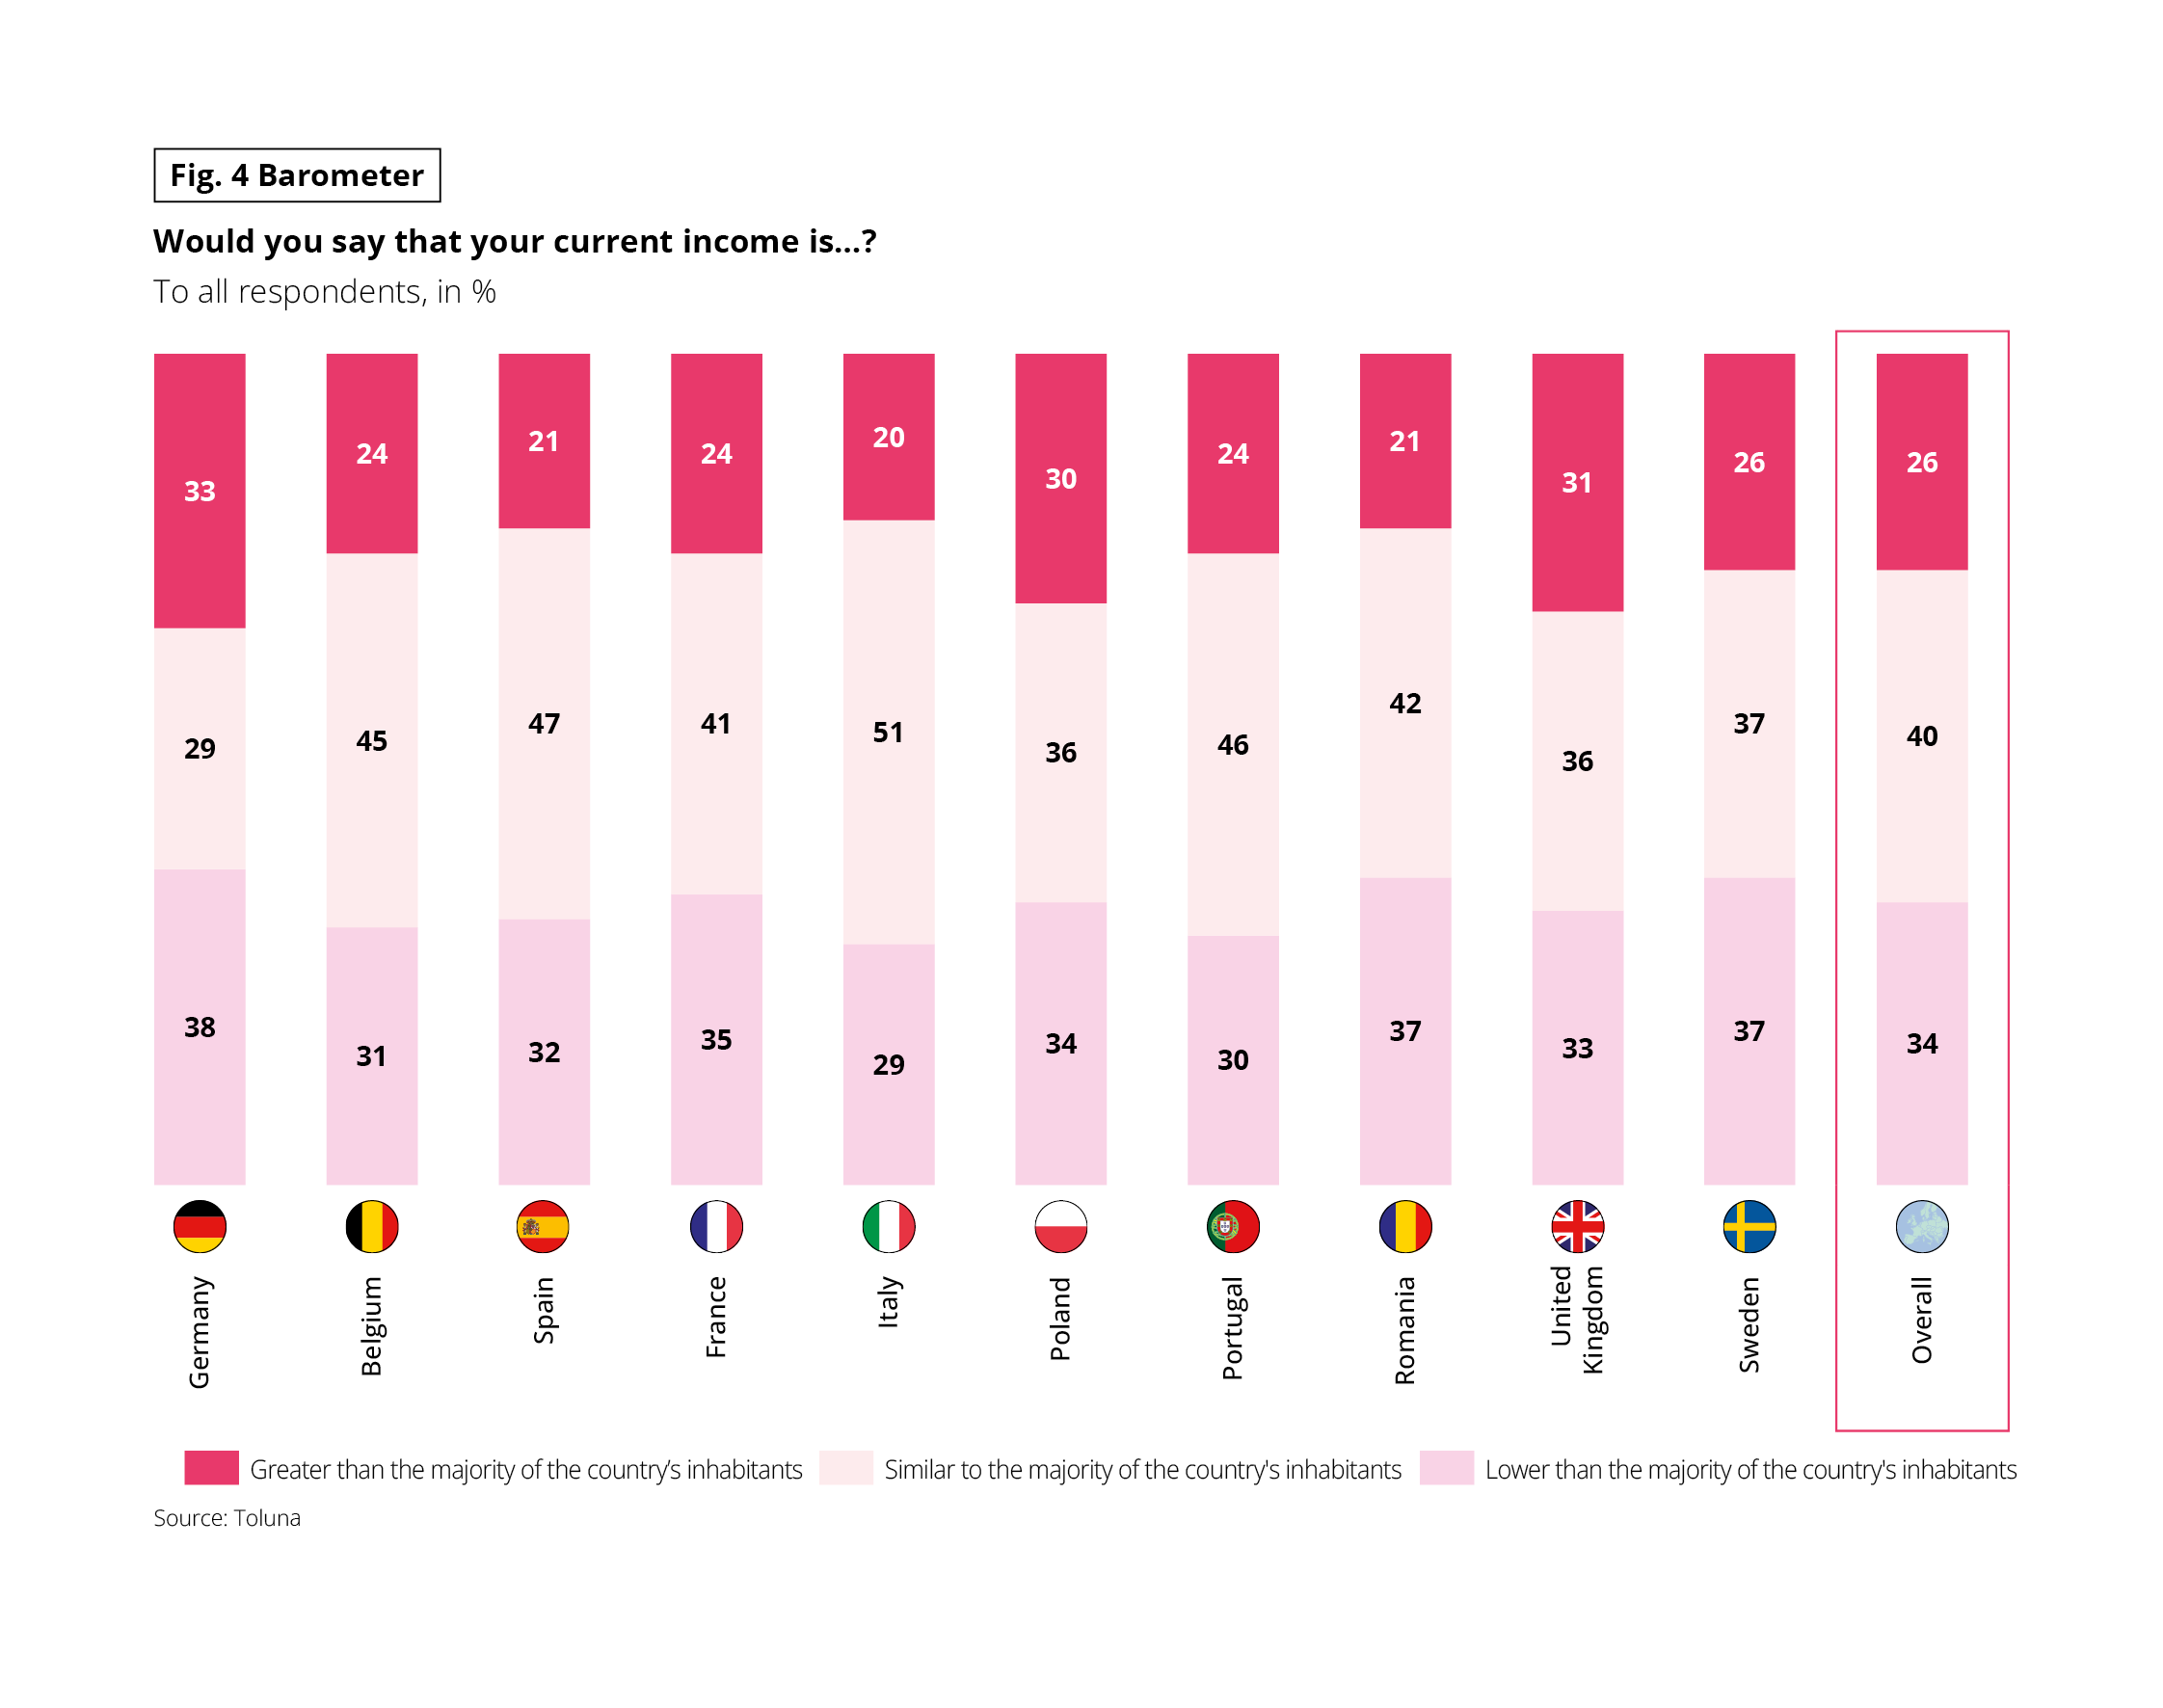 The graph presents the perception of the current income of the respondents compared to the majority of the inhabitants of their country.
Categories:
Higher than the majority
Similar to the majority
Lower than the majority
Distribution for all countries (in %):
Higher: 26
Similar: 40
Lower: 34
Examples by country:
Germany: 33 higher, 29 similar, 38 lower
France: 24 higher, 41 similar, 35 lower
Italy: 20 higher, 51 similar, 29 lower
United Kingdom: 31 higher, 36 similar, 33 lower
Sweden: 26 higher, 37 similar, 37 lower
Main Finding
In all countries, the most frequent perception is that of an income similar to the majority, followed by the perception of a lower income.
Source: Toluna
The graph presents the perception of the current income of the respondents compared to the majority of the inhabitants of their country.
Categories:
Higher than the majority
Similar to the majority
Lower than the majority
Distribution for all countries (in %):
Higher: 26
Similar: 40
Lower: 34
Examples by country:
Germany: 33 higher, 29 similar, 38 lower
France: 24 higher, 41 similar, 35 lower
Italy: 20 higher, 51 similar, 29 lower
United Kingdom: 31 higher, 36 similar, 33 lower
Sweden: 26 higher, 37 similar, 37 lower
Main Finding
In all countries, the most frequent perception is that of an income similar to the majority, followed by the perception of a lower income.
Source: Toluna
SPENDING POWER IN DECLINE
In roughly comparable proportions, Europeans are experiencing the opposite trend when it comes to their spending power. 40% of respondents said it had fallen over the last 12 months (+1 point). Around half of Romanians (+15 points) and French people (-1 point) said they were now faced with this reality, while Poles (-3 points), Swedes (-2 points) and British people (-1 point) were less aware of it.A closer look at the results recorded since the health crisis reveals clear, contrasting trends. Despite a score that remains very high, over this period, the French were the most likely to notice a decline in the feeling that their spending power had decreased (-12 points), with the Belgians the only Europeans who were also positive on this subject (-5 points). Conversely, Romanians and Germans were more pessimistic (+21 points and +20 points respectively).
Fig 5 – Perception of decrease in purchasing power by country
Download this infographic for your presentations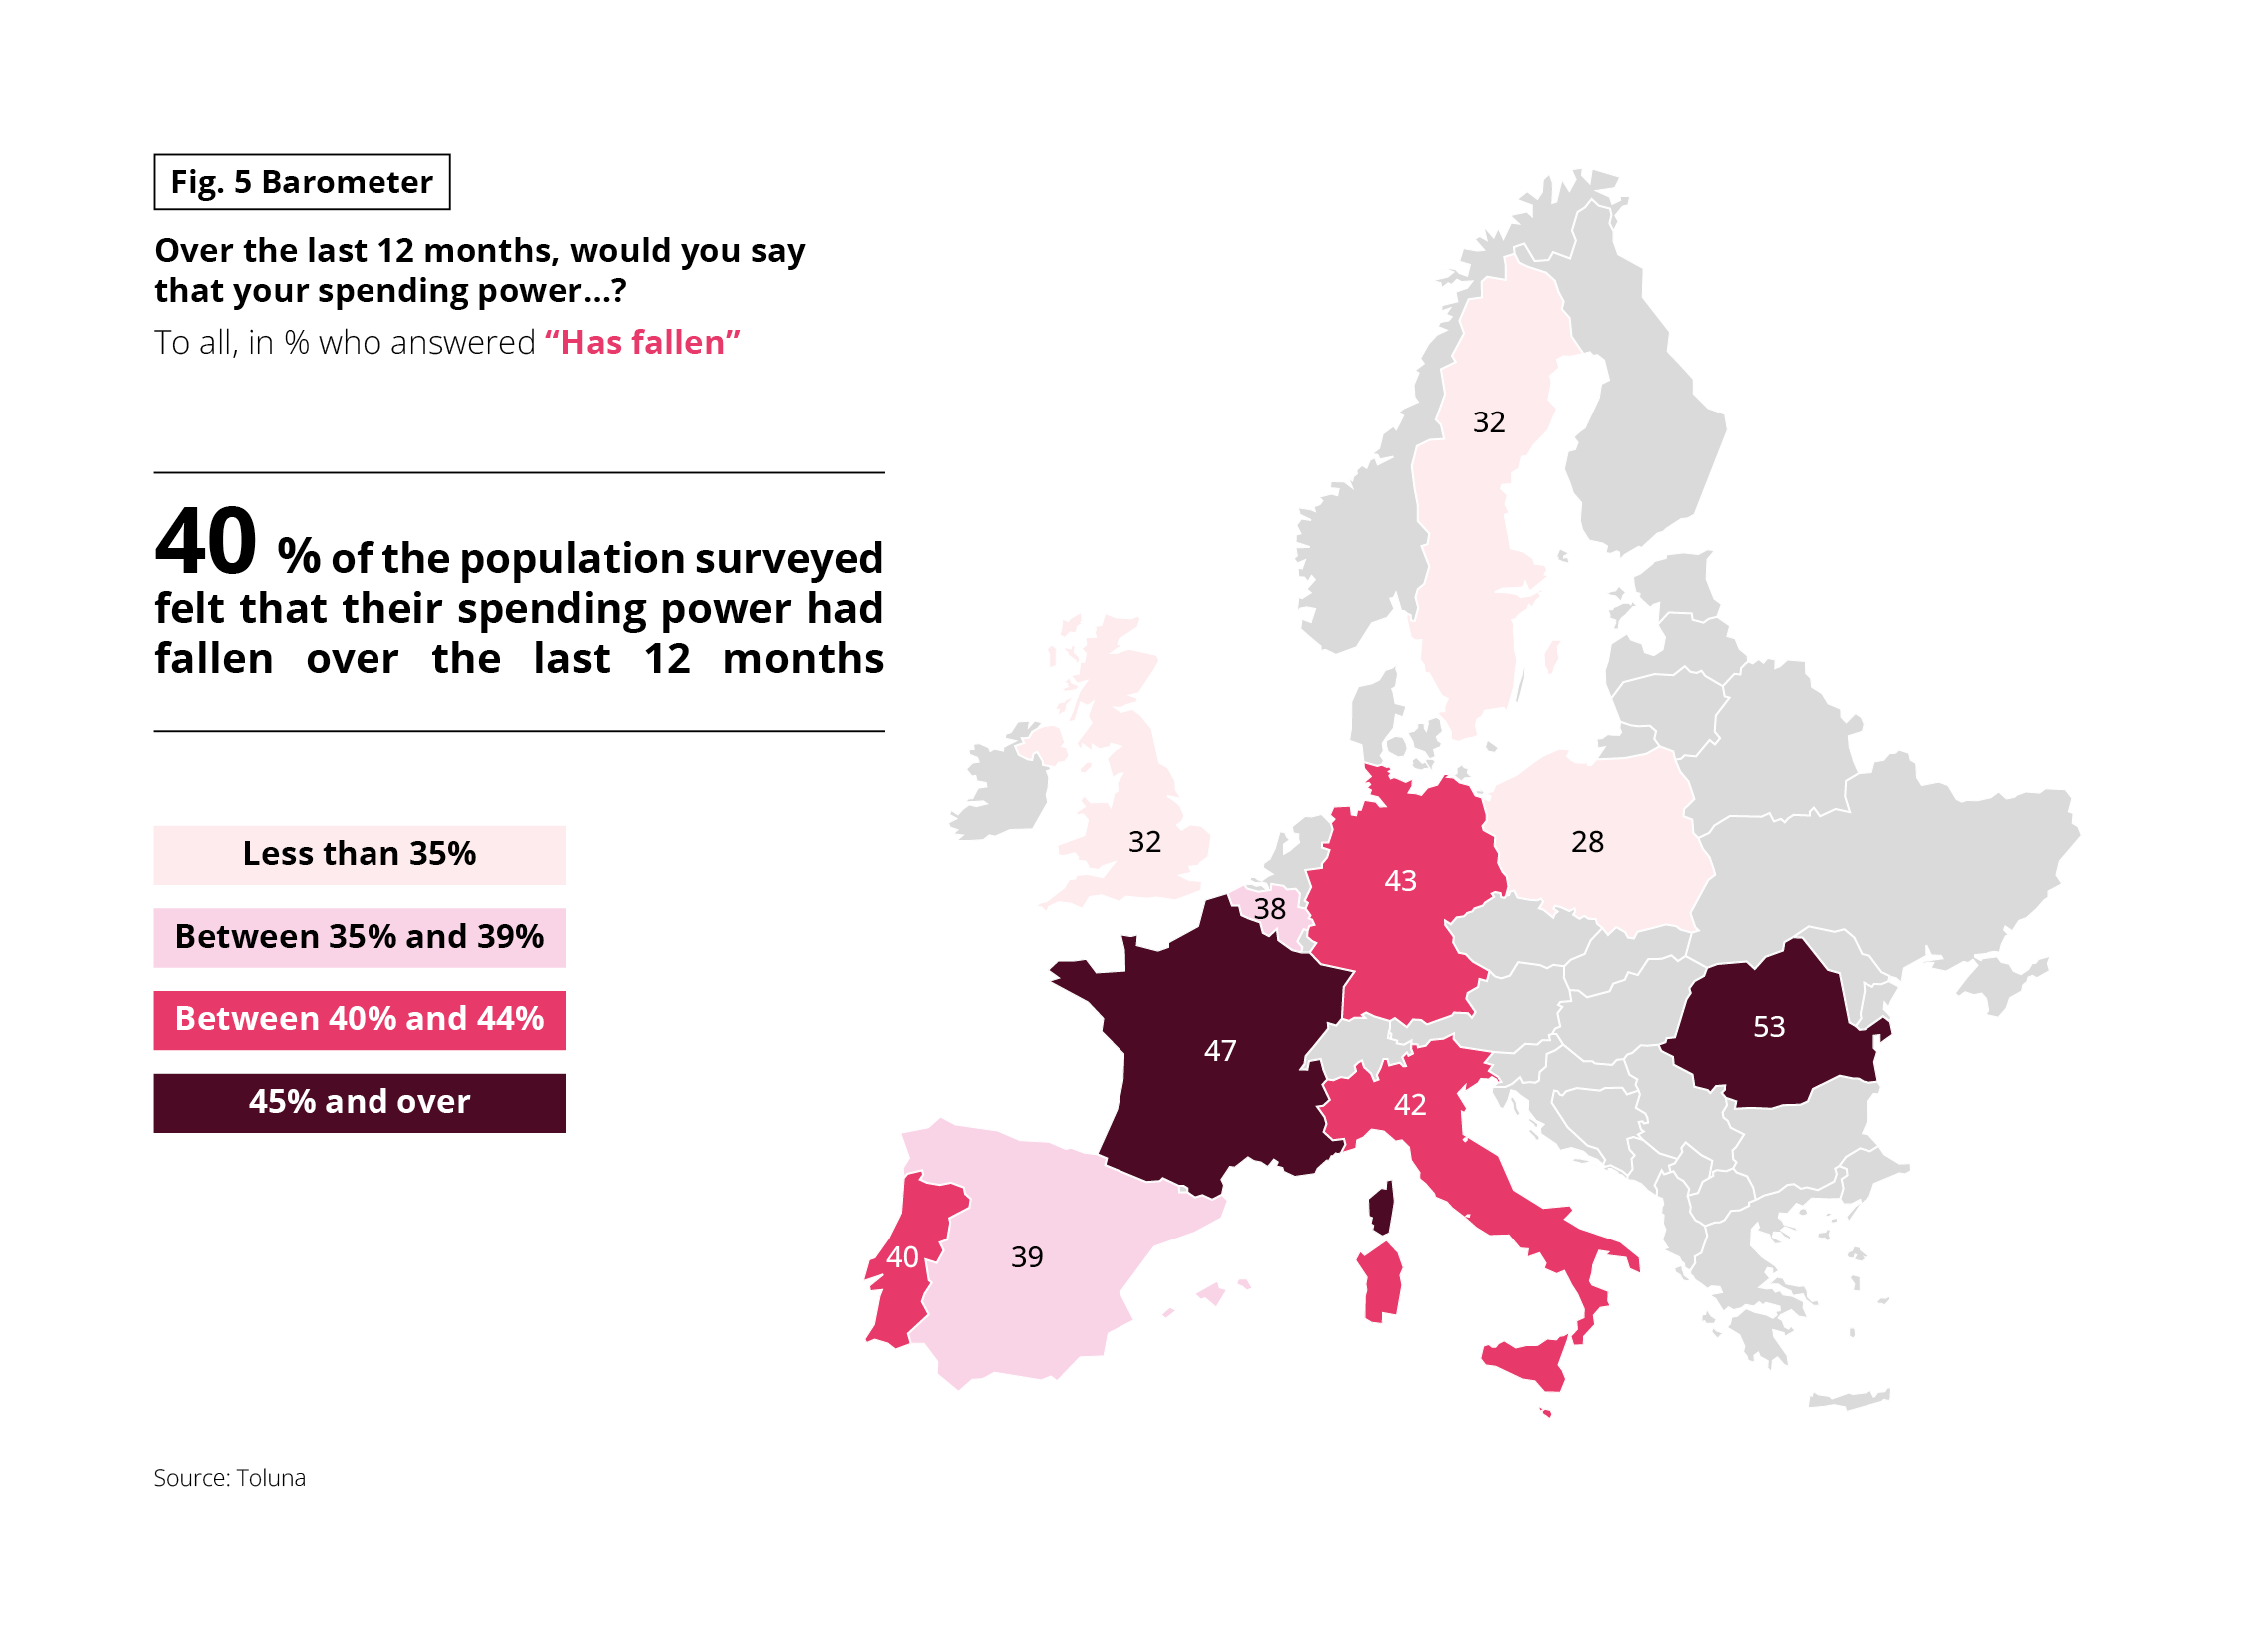 The visual presents, for several European countries, the proportion of respondents who declare that their purchasing power has decreased over the past 12 months.
Data
France: 47%
Italy: 42%
Germany: 43%
Spain: 39%
Portugal: 40%
Belgium: 38%
United Kingdom: 32%
Sweden: 32%
Poland: 28%
Romania: 53%
A synthesis value indicates that 40% of the surveyed population thinks their purchasing power has decreased over the past 12 months.
Main Finding In all observed countries, a significant proportion of the population declares a decrease in their purchasing power, with higher levels in some Eastern and Southern European countries.
Source: Toluna
The visual presents, for several European countries, the proportion of respondents who declare that their purchasing power has decreased over the past 12 months.
Data
France: 47%
Italy: 42%
Germany: 43%
Spain: 39%
Portugal: 40%
Belgium: 38%
United Kingdom: 32%
Sweden: 32%
Poland: 28%
Romania: 53%
A synthesis value indicates that 40% of the surveyed population thinks their purchasing power has decreased over the past 12 months.
Main Finding In all observed countries, a significant proportion of the population declares a decrease in their purchasing power, with higher levels in some Eastern and Southern European countries.
Source: Toluna
Fig 6 – Evolution of the feeling of decrease in purchasing power
Download this infographic for your presentations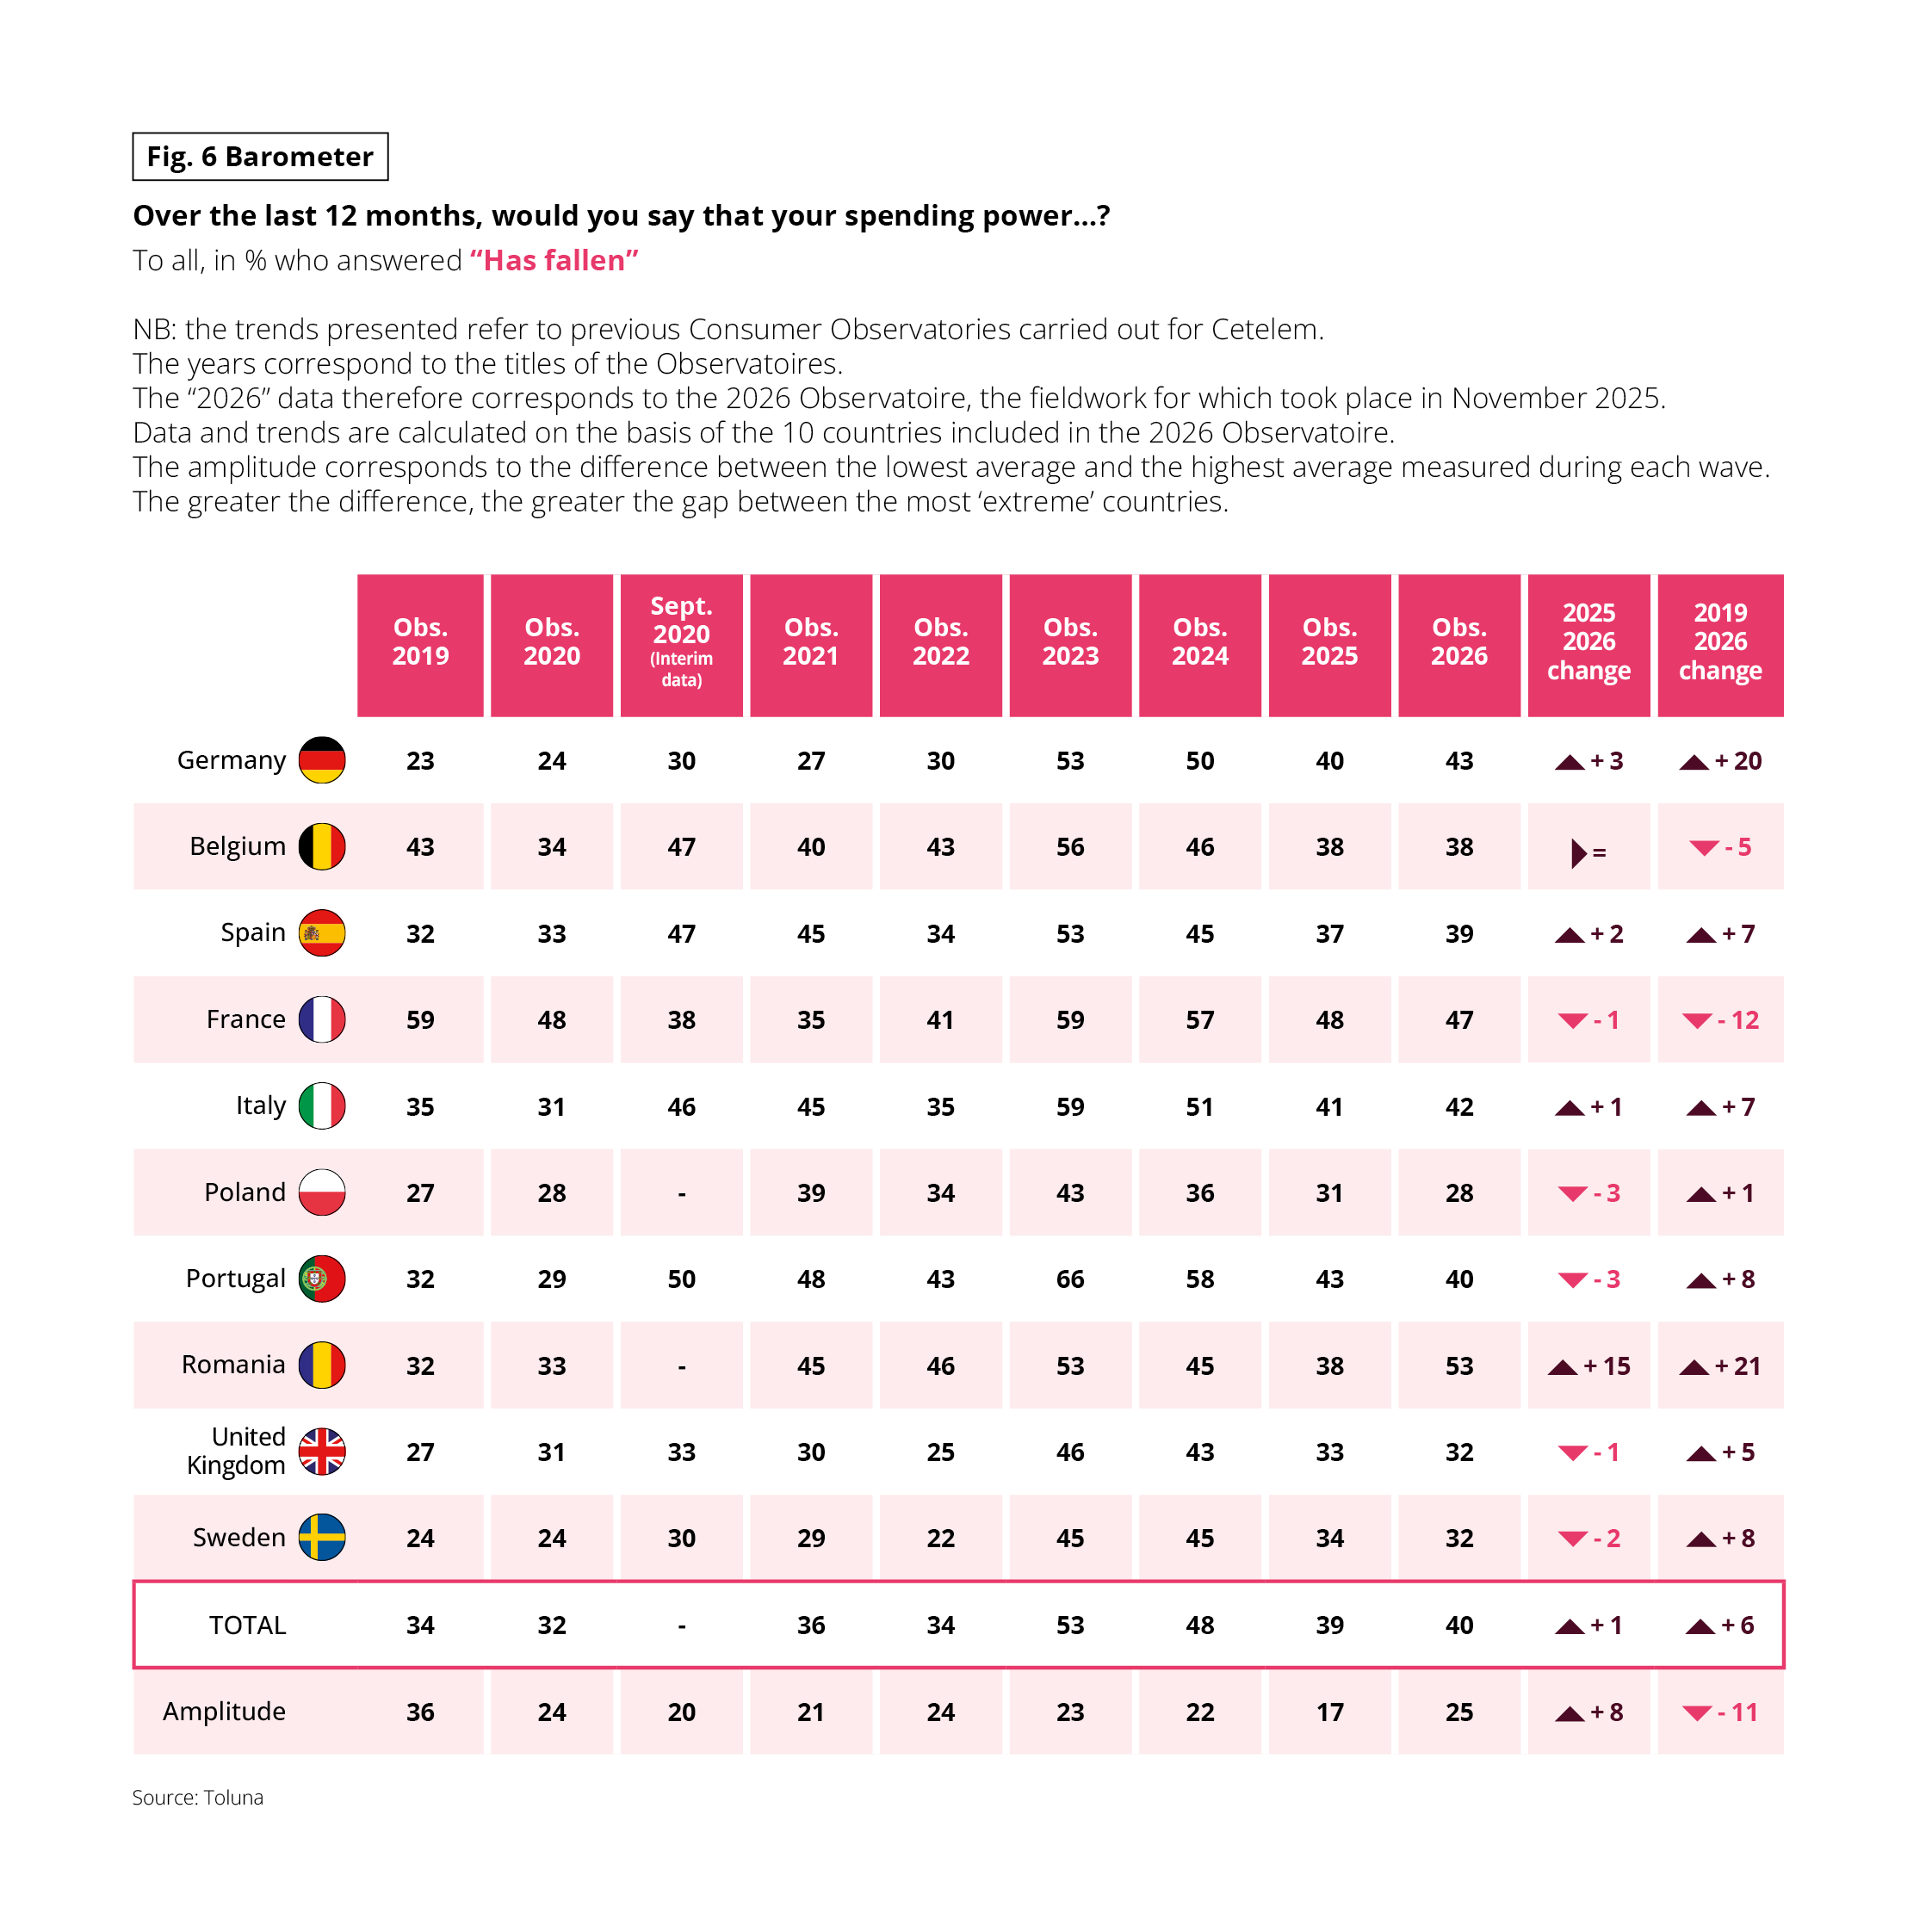 The table presents the evolution, by country, of the proportion of respondents who think their purchasing power has decreased, over several waves of observation between 2019 and 2026.
Values are expressed as a percentage of “decreased” responses.
Years correspond to the waves of the Consumer Observatory.
“2026” corresponds to a survey conducted in November 2025.
The “TOTAL” line corresponds to the average of the 10 countries.
“Amplitude” corresponds to the difference between the lowest and highest values for a given year.
Data (key extracts)
Total: 34% (2019), 32% (2020), 36% (2021), 34% (2022), 53% (2023), 48% (2024), 39% (2025), 40% (2026)
France: 59% (2019), 48% (2020), 38% (2021), 35% (2022), 59% (2023), 57% (2024), 48% (2025), 47% (2026)
Romania: 32% (2019), 33% (2020), 45% (2021), 46% (2022), 53% (2023), 45% (2024), 38% (2025), 53% (2026)
Main Finding The feeling of a decrease in purchasing power has strongly progressed since 2022, with a peak observed in 2023, and remains high in 2026 in several countries.
Source: Toluna
The table presents the evolution, by country, of the proportion of respondents who think their purchasing power has decreased, over several waves of observation between 2019 and 2026.
Values are expressed as a percentage of “decreased” responses.
Years correspond to the waves of the Consumer Observatory.
“2026” corresponds to a survey conducted in November 2025.
The “TOTAL” line corresponds to the average of the 10 countries.
“Amplitude” corresponds to the difference between the lowest and highest values for a given year.
Data (key extracts)
Total: 34% (2019), 32% (2020), 36% (2021), 34% (2022), 53% (2023), 48% (2024), 39% (2025), 40% (2026)
France: 59% (2019), 48% (2020), 38% (2021), 35% (2022), 59% (2023), 57% (2024), 48% (2025), 47% (2026)
Romania: 32% (2019), 33% (2020), 45% (2021), 46% (2022), 53% (2023), 45% (2024), 38% (2025), 53% (2026)
Main Finding The feeling of a decrease in purchasing power has strongly progressed since 2022, with a peak observed in 2023, and remains high in 2026 in several countries.
Source: Toluna
THE GHOST OF INFLATION IS STILL FRIGHTENING
Having now returned to around 2% a year, inflation is no longer an economic problem in Europe. However, its ghost still haunts European consumers. Nearly 1 in 2 believe that prices have increased significantly over the past year (+3 points), with almost 9 out of 10 seeing them increase. Let us give credit to the Romanians, who are the most likely to rail against a sharp rise in prices (76%, +11 points), for being in tune with the economic reality in their country, where inflation is running at over 7%. The same goes for the British (also up 11 points), who are still experiencing some price hikes. On the other hand, more Spanish and Italian citizens than last year think that prices have increased significantly, even though inflation in their country is under control. What about the French? Along with the Belgians, the French show more restraint. These attitudes have remained constant over time in both countries.
Fig 7 – Perception of general price evolution
Download this infographic for your presentations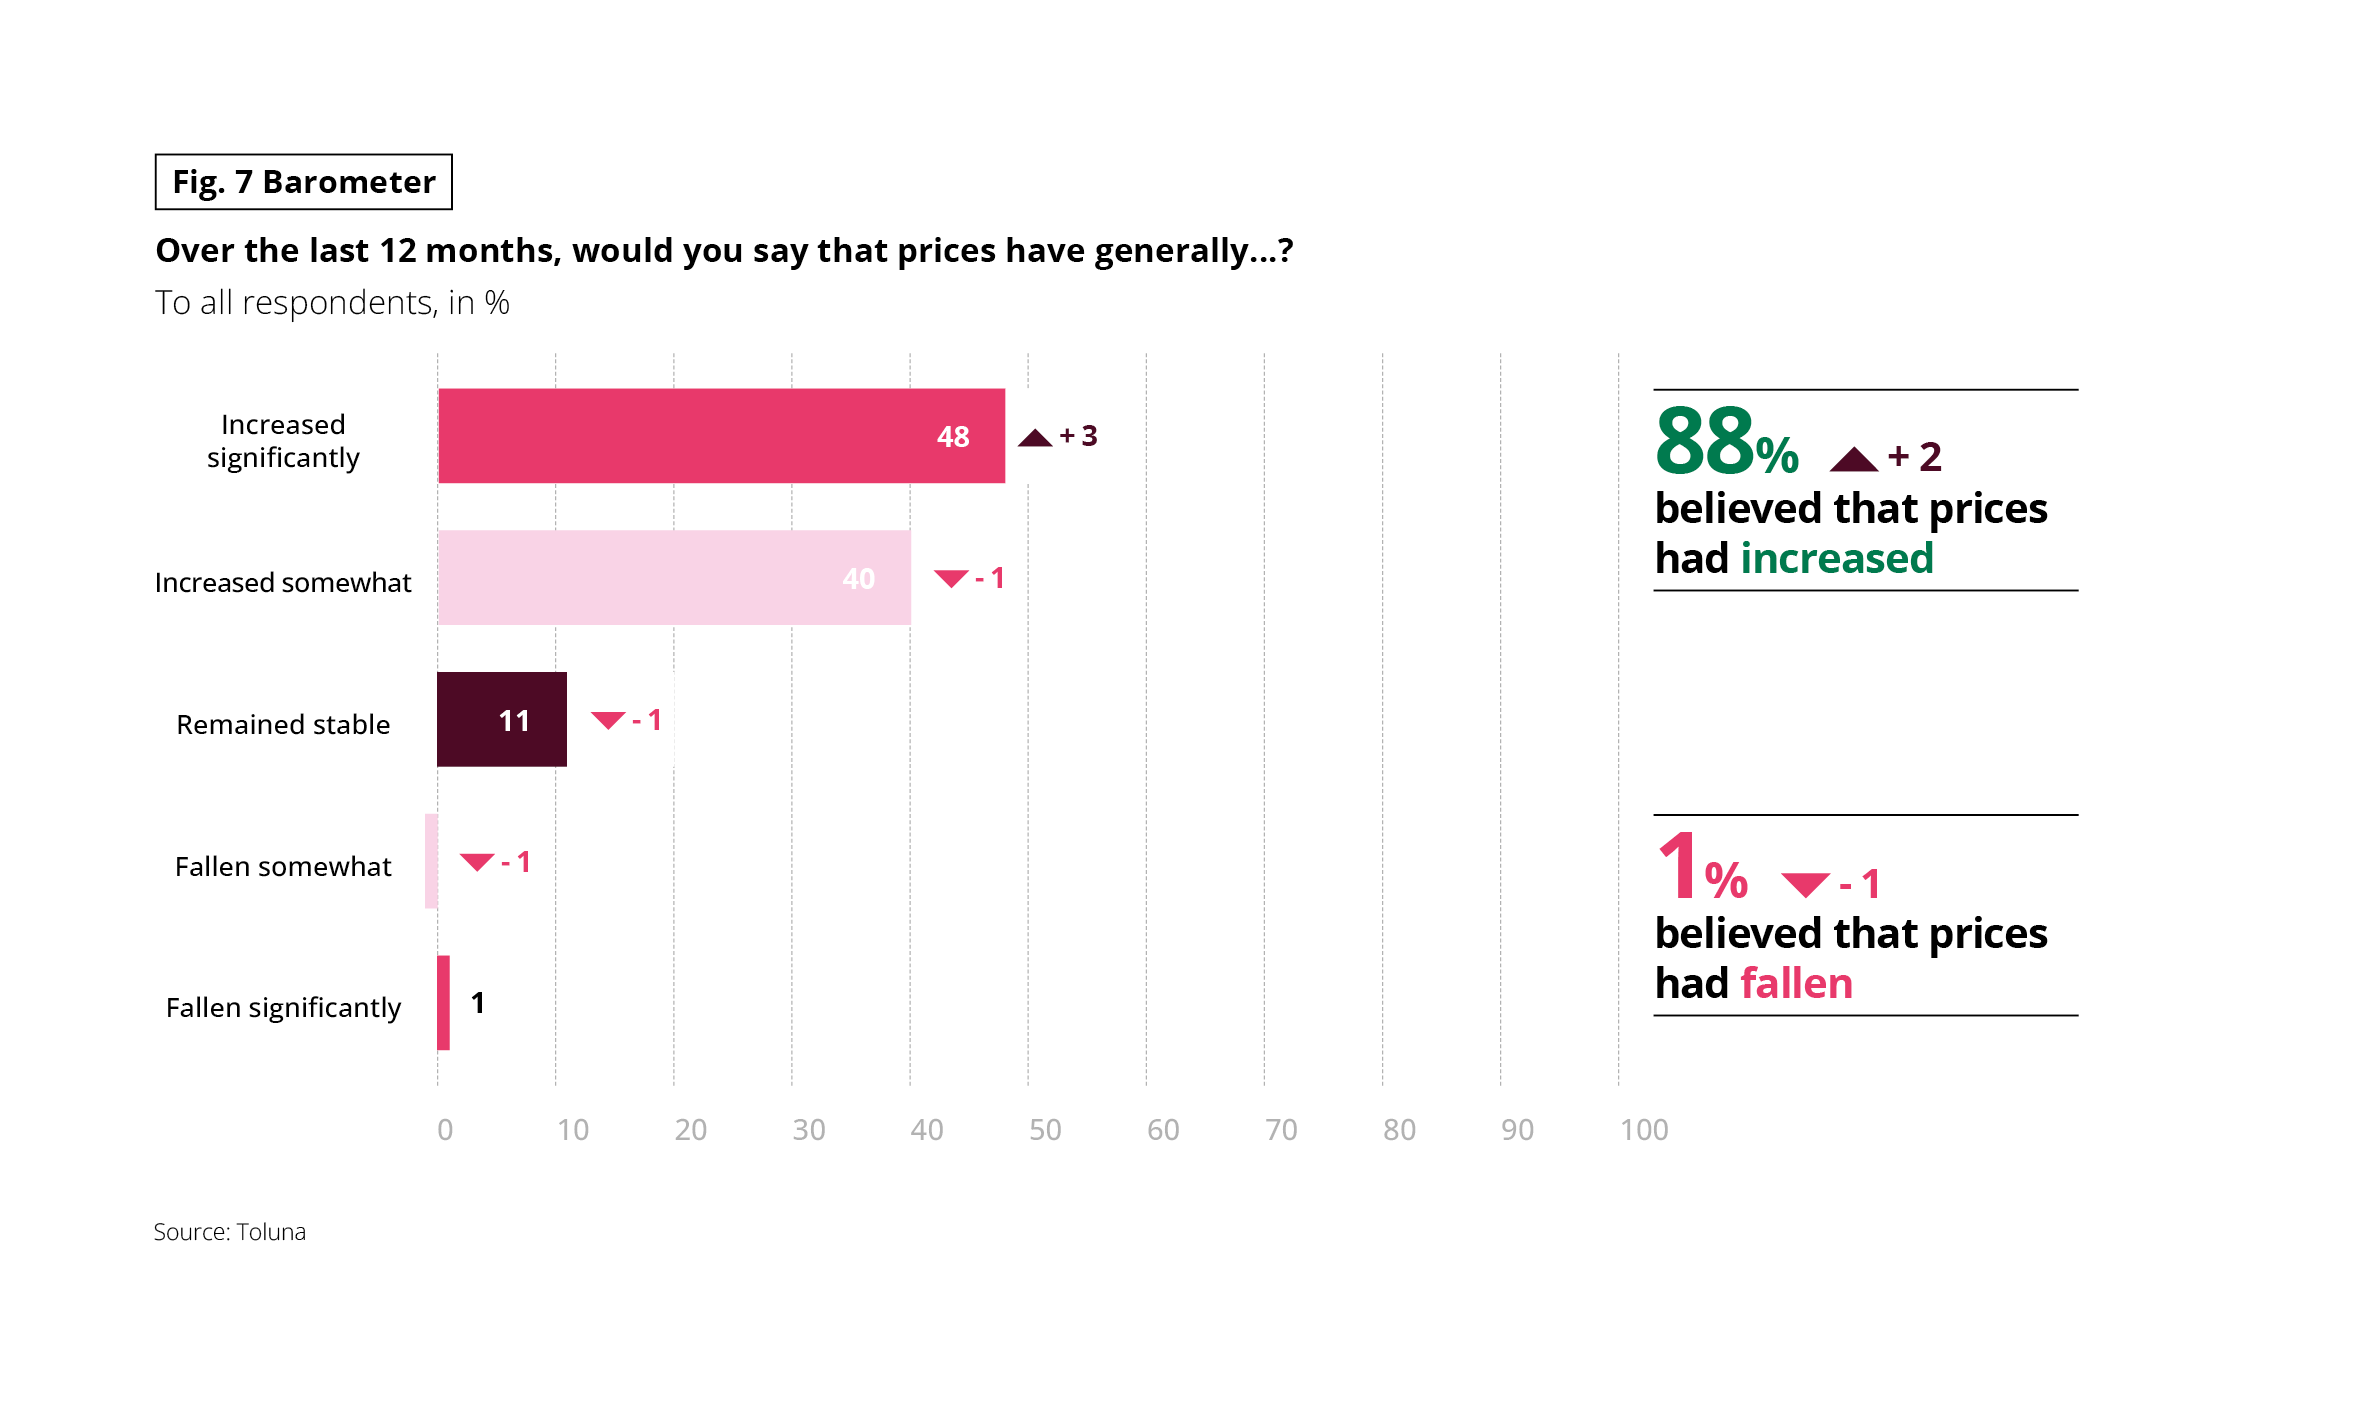 The graph presents the perception of the general evolution of prices over the past 12 months
Values are expressed as a percentage of respondents.
Data
Have clearly increased: 48%
Have rather increased: 40%
Have remained stable: 11%
Have rather decreased: (very low value, indicated graphically)
Have clearly decreased: 1%
A synthesis indicates that 88% of respondents think prices have increased, compared to 1% who think they have decreased.
Main Finding Almost all respondents perceive an increase in prices over the past 12 months.
Source: Toluna
The graph presents the perception of the general evolution of prices over the past 12 months
Values are expressed as a percentage of respondents.
Data
Have clearly increased: 48%
Have rather increased: 40%
Have remained stable: 11%
Have rather decreased: (very low value, indicated graphically)
Have clearly decreased: 1%
A synthesis indicates that 88% of respondents think prices have increased, compared to 1% who think they have decreased.
Main Finding Almost all respondents perceive an increase in prices over the past 12 months.
Source: Toluna
Fig 8 – Evolution of perceptions of strong price increases
Download this infographic for your presentations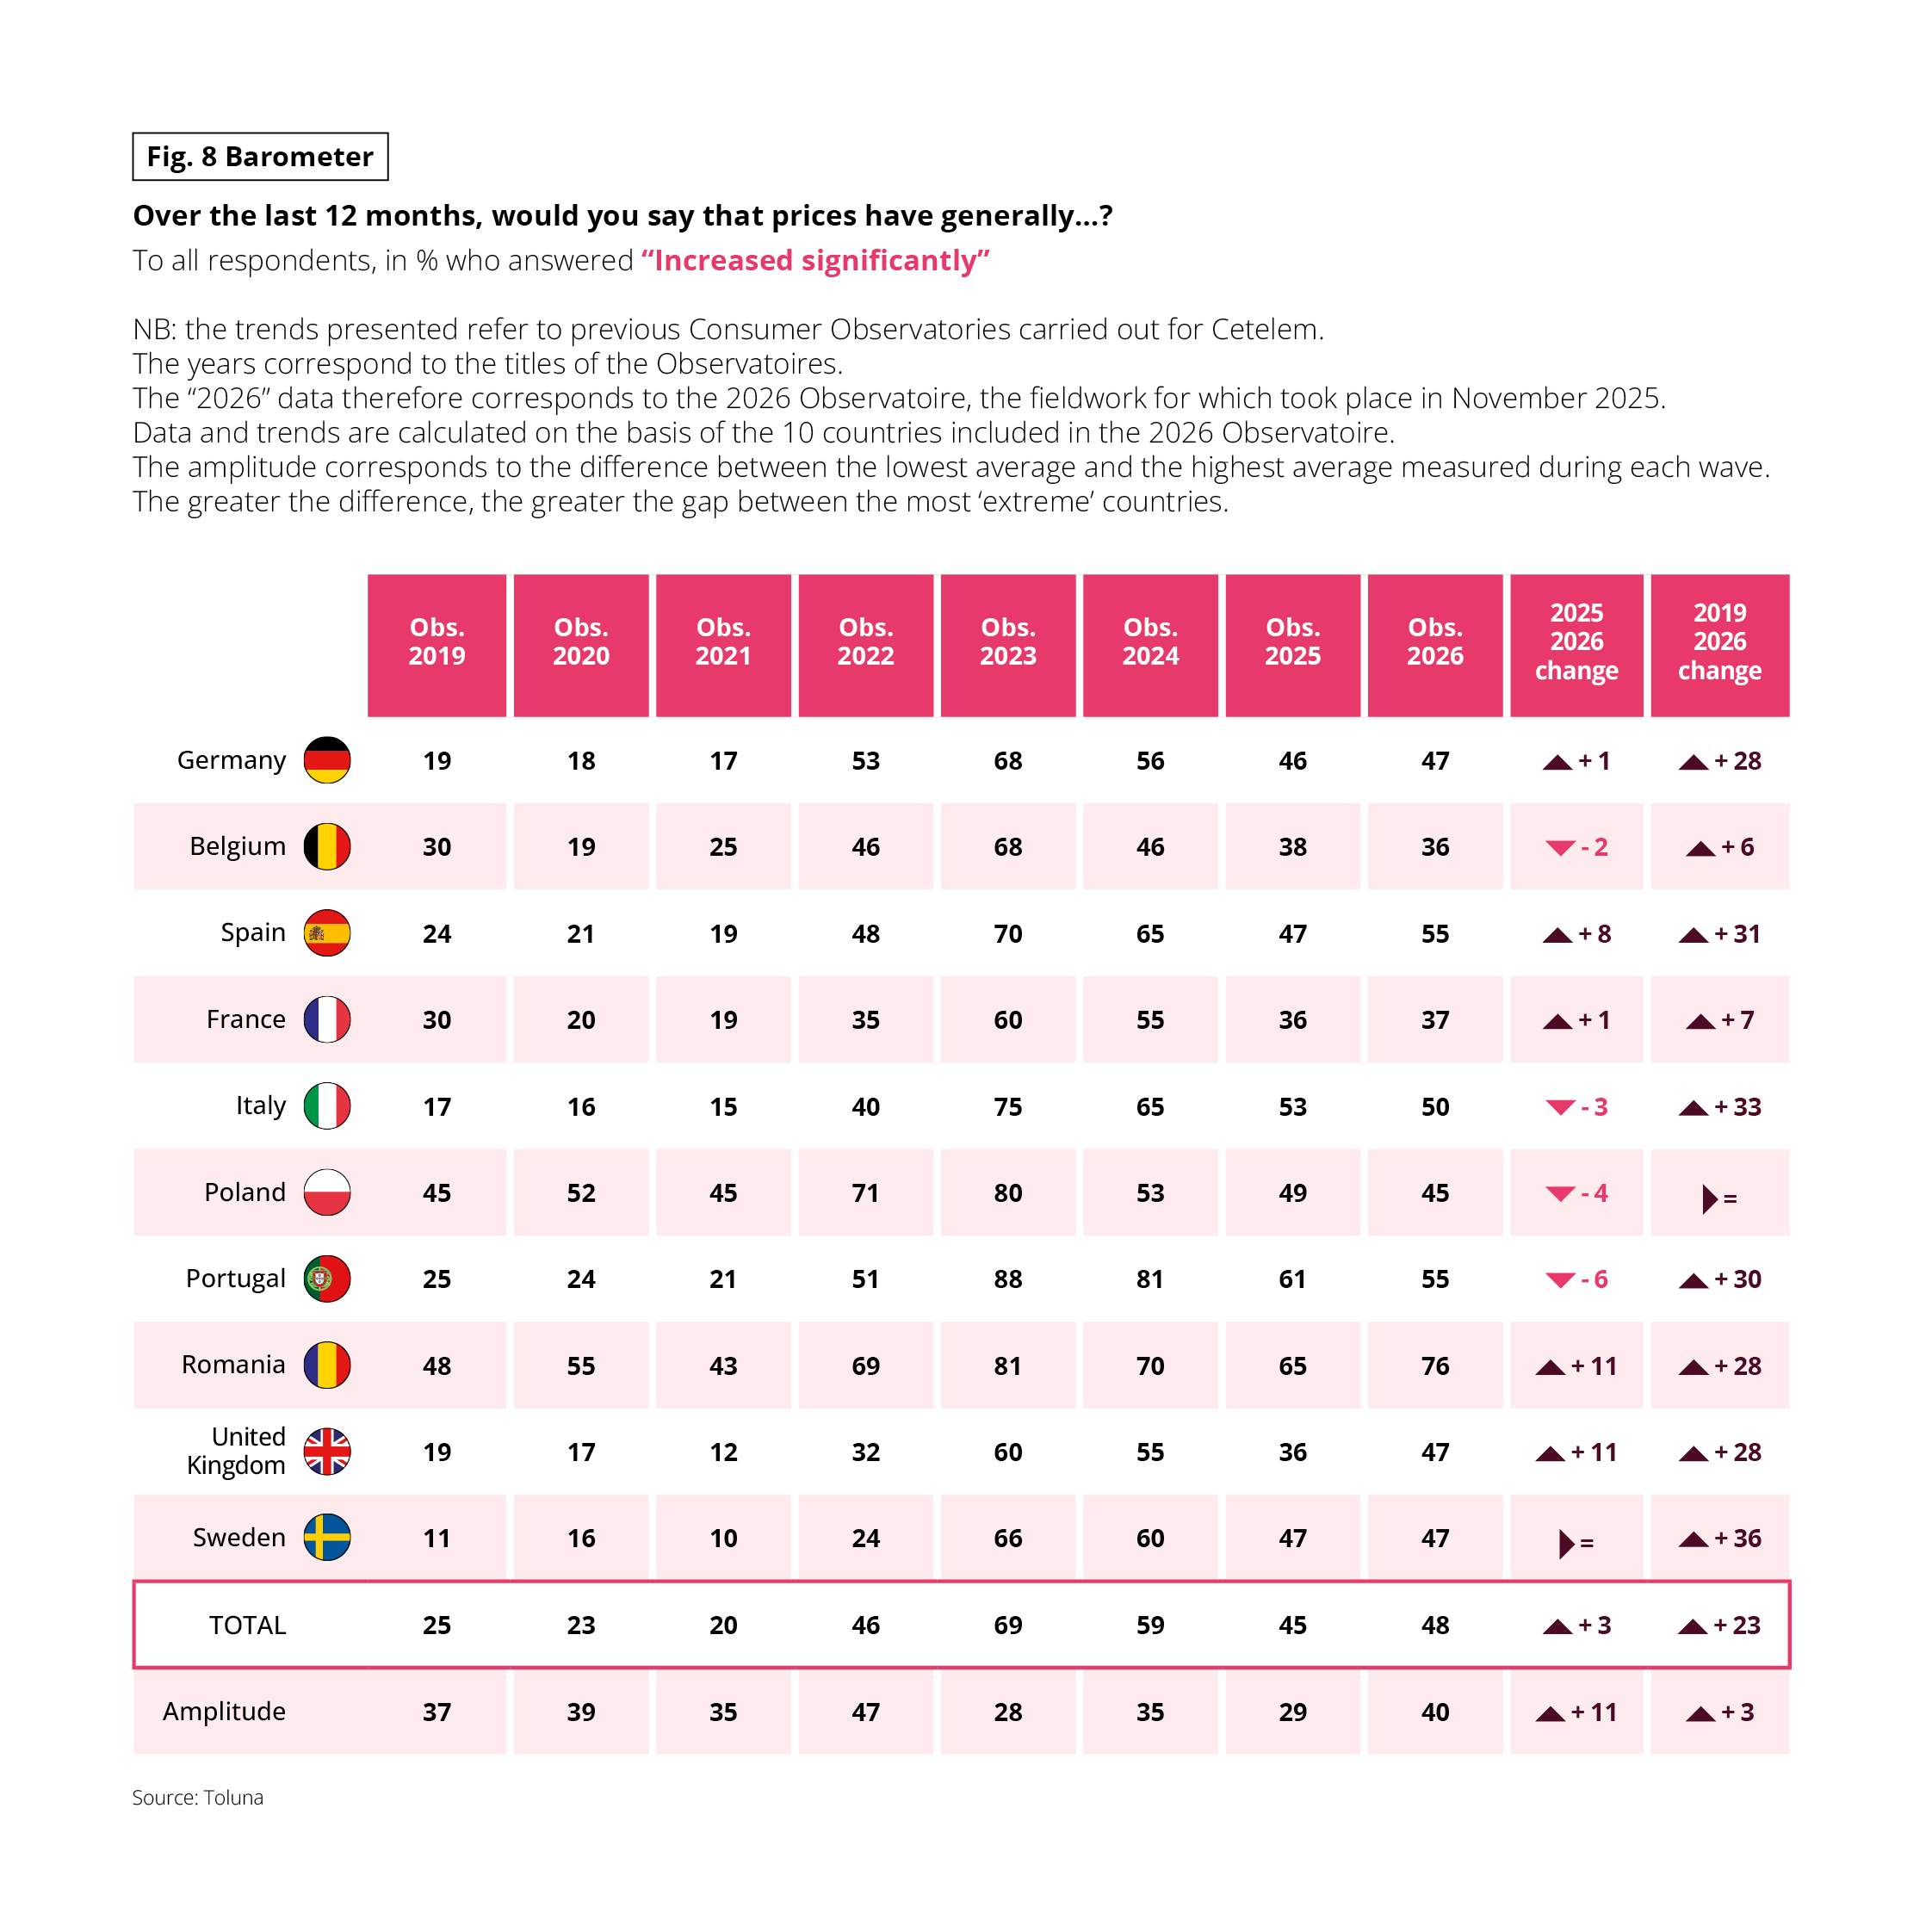 The table traces the evolution, by country, of the proportion of respondents who declare that prices have “clearly increased” over the past 12 months.
Values are expressed as a percentage of “clearly increased” responses.
Years correspond to the waves of the Consumer Observatory.
The “TOTAL” line corresponds to the average of the 10 countries.
“Amplitude” indicates the difference between the lowest and highest national values.
Data (key extracts)
Total: 25% (2019), 23% (2020), 20% (2021), 46% (2022), 69% (2023), 59% (2024), 45% (2025), 48% (2026)
France: 30% (2019), 20% (2020), 19% (2021), 35% (2022), 60% (2023), 55% (2024), 36% (2025), 37% (2026)
Portugal: 25% (2019), 24% (2020), 21% (2021), 51% (2022), 88% (2023), 81% (2024), 61% (2025), 55% (2026)
Main Finding The perception of strong price increases clearly progresses from 2022, with durably high levels until 2026.
Source: Toluna
The table traces the evolution, by country, of the proportion of respondents who declare that prices have “clearly increased” over the past 12 months.
Values are expressed as a percentage of “clearly increased” responses.
Years correspond to the waves of the Consumer Observatory.
The “TOTAL” line corresponds to the average of the 10 countries.
“Amplitude” indicates the difference between the lowest and highest national values.
Data (key extracts)
Total: 25% (2019), 23% (2020), 20% (2021), 46% (2022), 69% (2023), 59% (2024), 45% (2025), 48% (2026)
France: 30% (2019), 20% (2020), 19% (2021), 35% (2022), 60% (2023), 55% (2024), 36% (2025), 37% (2026)
Portugal: 25% (2019), 24% (2020), 21% (2021), 51% (2022), 88% (2023), 81% (2024), 61% (2025), 55% (2026)
Main Finding The perception of strong price increases clearly progresses from 2022, with durably high levels until 2026.
Source: Toluna
Fig 9 – Evolution of annual inflation rate by country
Download this infographic for your presentations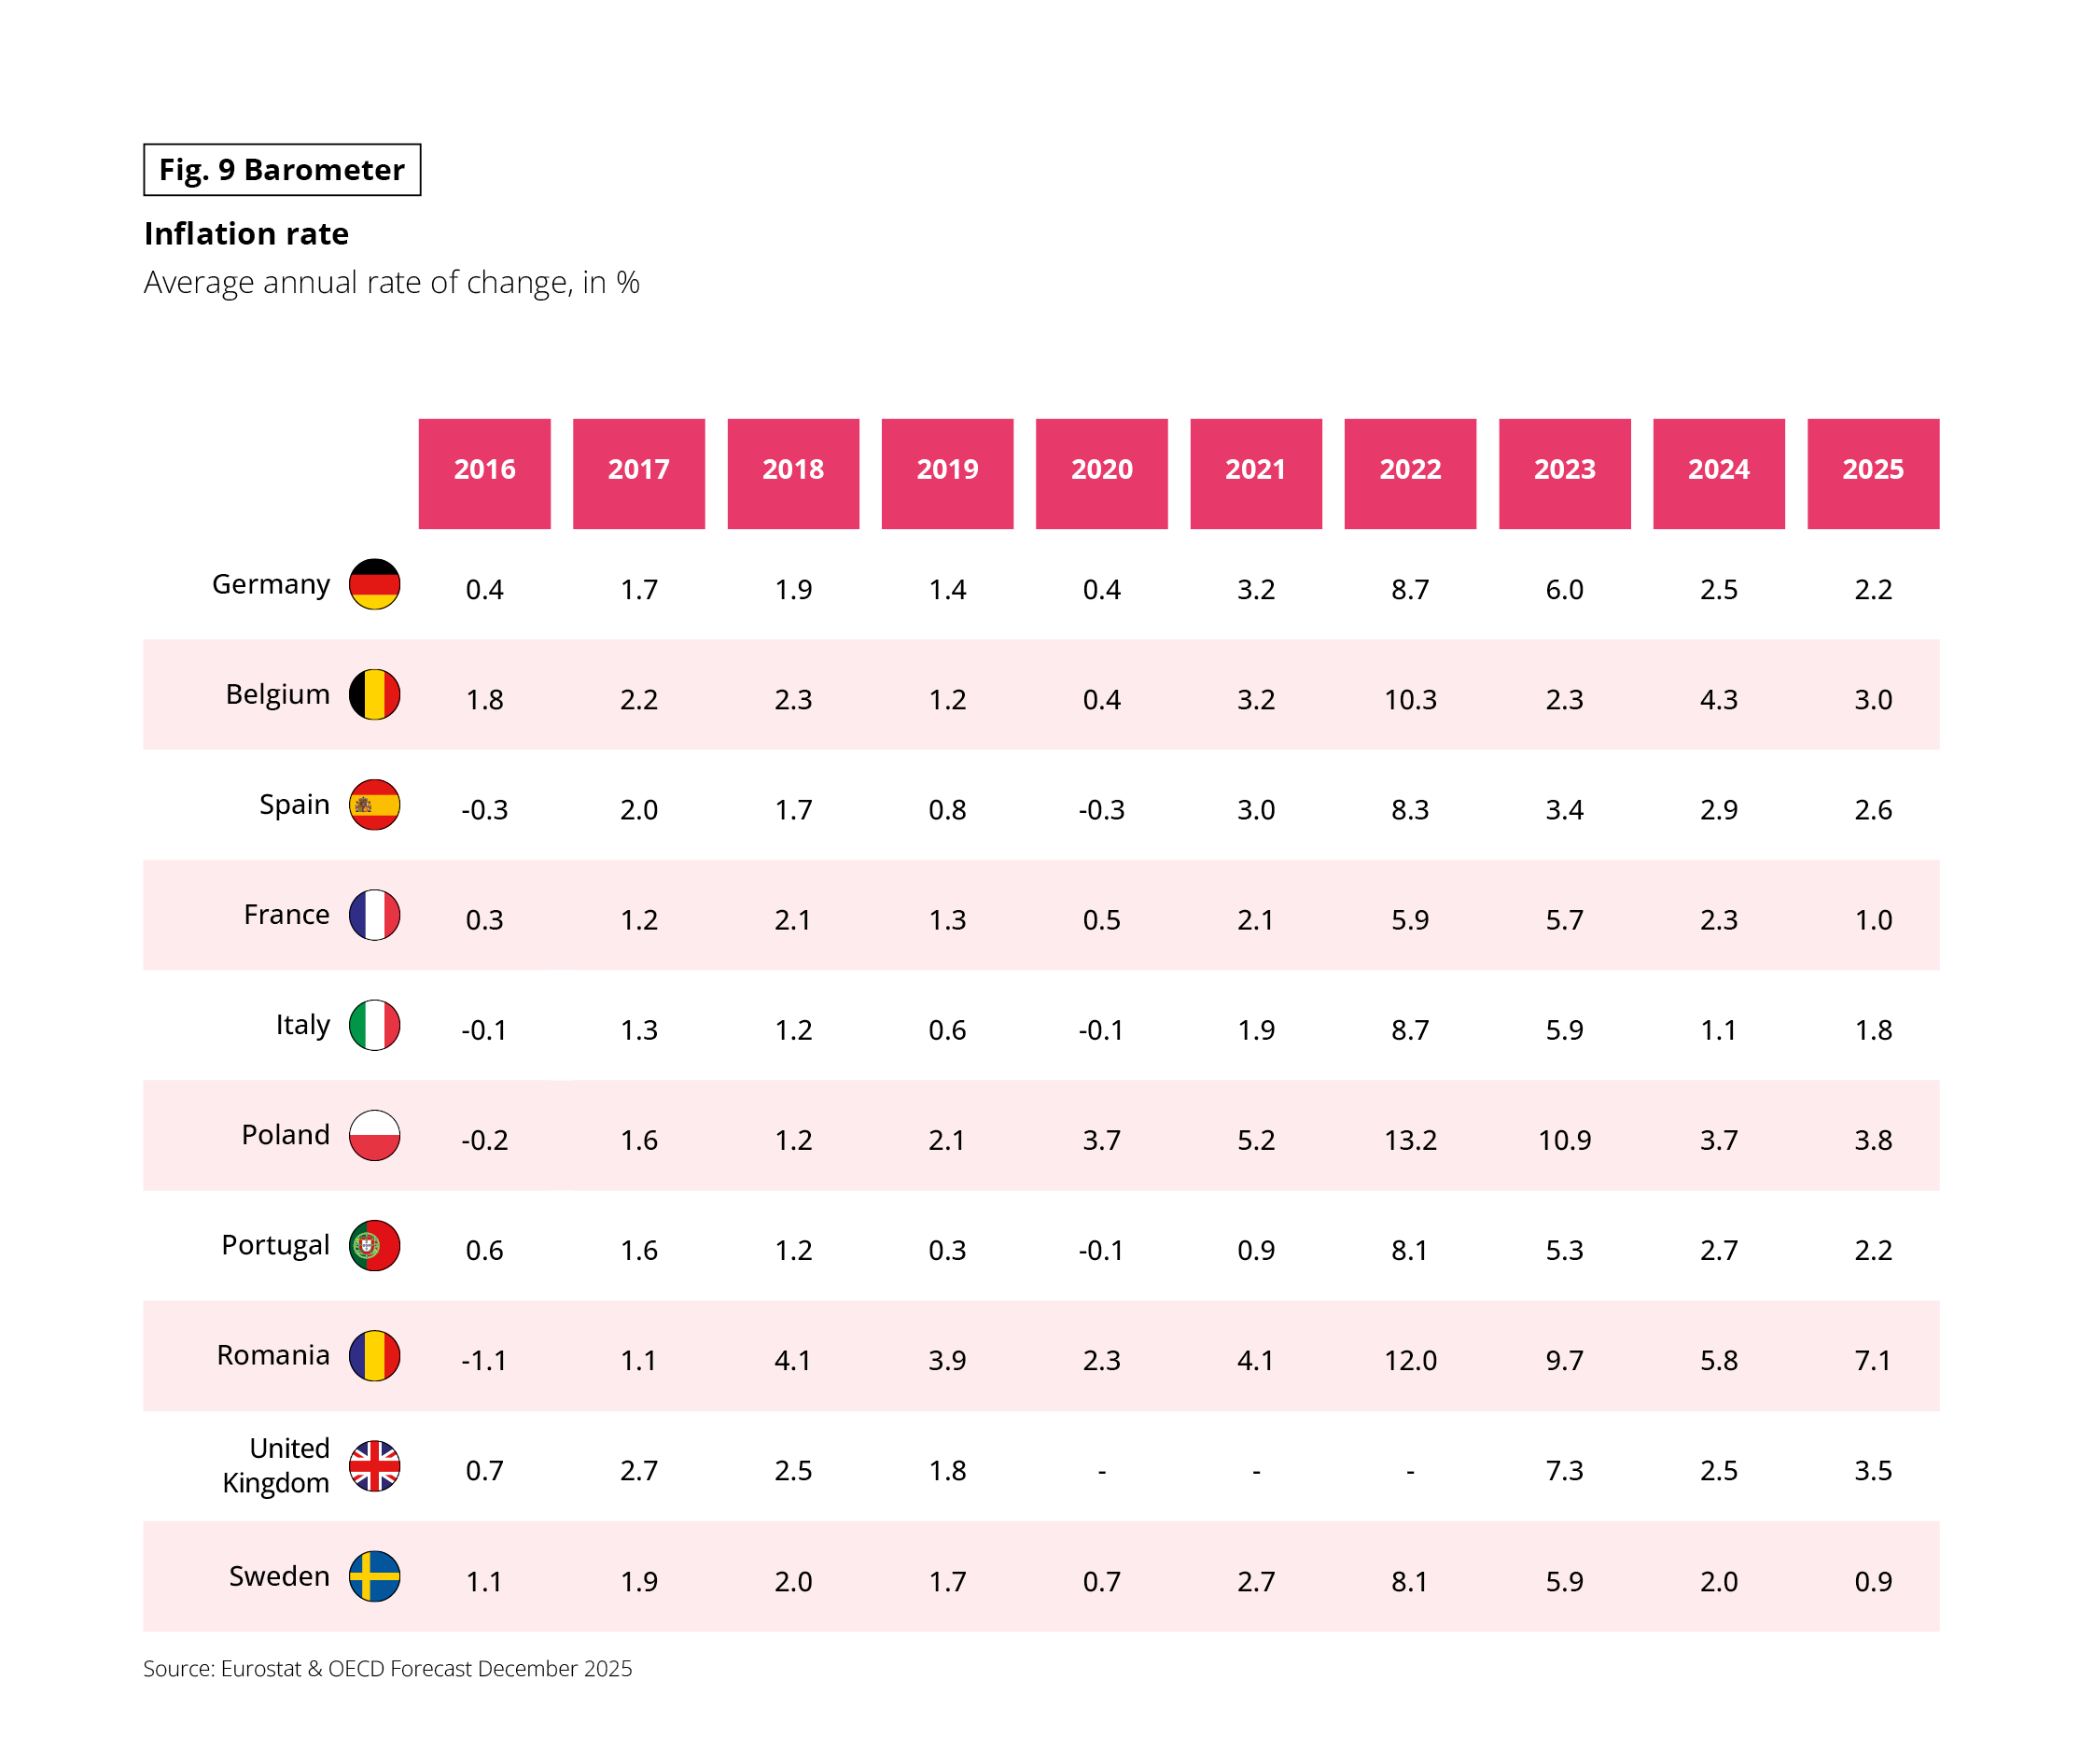 The table presents the average annual inflation rates, expressed as a percentage, for several European countries between 2016 and 2025.
Values correspond to the average annual rate of change in prices, as a percentage.
Cells containing a dash indicate unavailable data.
Data (extracts)
Germany: 0.4% (2016), 1.7% (2017), 1.9% (2018), 1.4% (2019), 0.4% (2020), 3.2% (2021), 8.7% (2022), 6.0% (2023), 2.5% (2024), 2.2% (2025)
France: 0.3%; 1.2%; 2.1%; 1.3%; 0.5%; 2.1%; 5.9%; 5.7%; 2.3%; 1.0%
Poland: -0.2%; 1.6%; 1.2%; 2.1%; 3.7%; 5.2%; 13.2%; 10.9%; 3.7%; 3.8%
Romania: -1.1%; 1.1%; 4.1%; 3.9%; 2.3%; 4.1%; 12.0%; 9.7%; 5.8%; 7.1%
Main Finding Inflation rates reach a marked peak in 2022 in all countries, before decreasing gradually until 2025.
Source: Eurostat and OECD forecasts, December 2025
The table presents the average annual inflation rates, expressed as a percentage, for several European countries between 2016 and 2025.
Values correspond to the average annual rate of change in prices, as a percentage.
Cells containing a dash indicate unavailable data.
Data (extracts)
Germany: 0.4% (2016), 1.7% (2017), 1.9% (2018), 1.4% (2019), 0.4% (2020), 3.2% (2021), 8.7% (2022), 6.0% (2023), 2.5% (2024), 2.2% (2025)
France: 0.3%; 1.2%; 2.1%; 1.3%; 0.5%; 2.1%; 5.9%; 5.7%; 2.3%; 1.0%
Poland: -0.2%; 1.6%; 1.2%; 2.1%; 3.7%; 5.2%; 13.2%; 10.9%; 3.7%; 3.8%
Romania: -1.1%; 1.1%; 4.1%; 3.9%; 2.3%; 4.1%; 12.0%; 9.7%; 5.8%; 7.1%
Main Finding Inflation rates reach a marked peak in 2022 in all countries, before decreasing gradually until 2025.
Source: Eurostat and OECD forecasts, December 2025
Fig 10 – Evolution of economic perceptions since 2019
Download this infographic for your presentations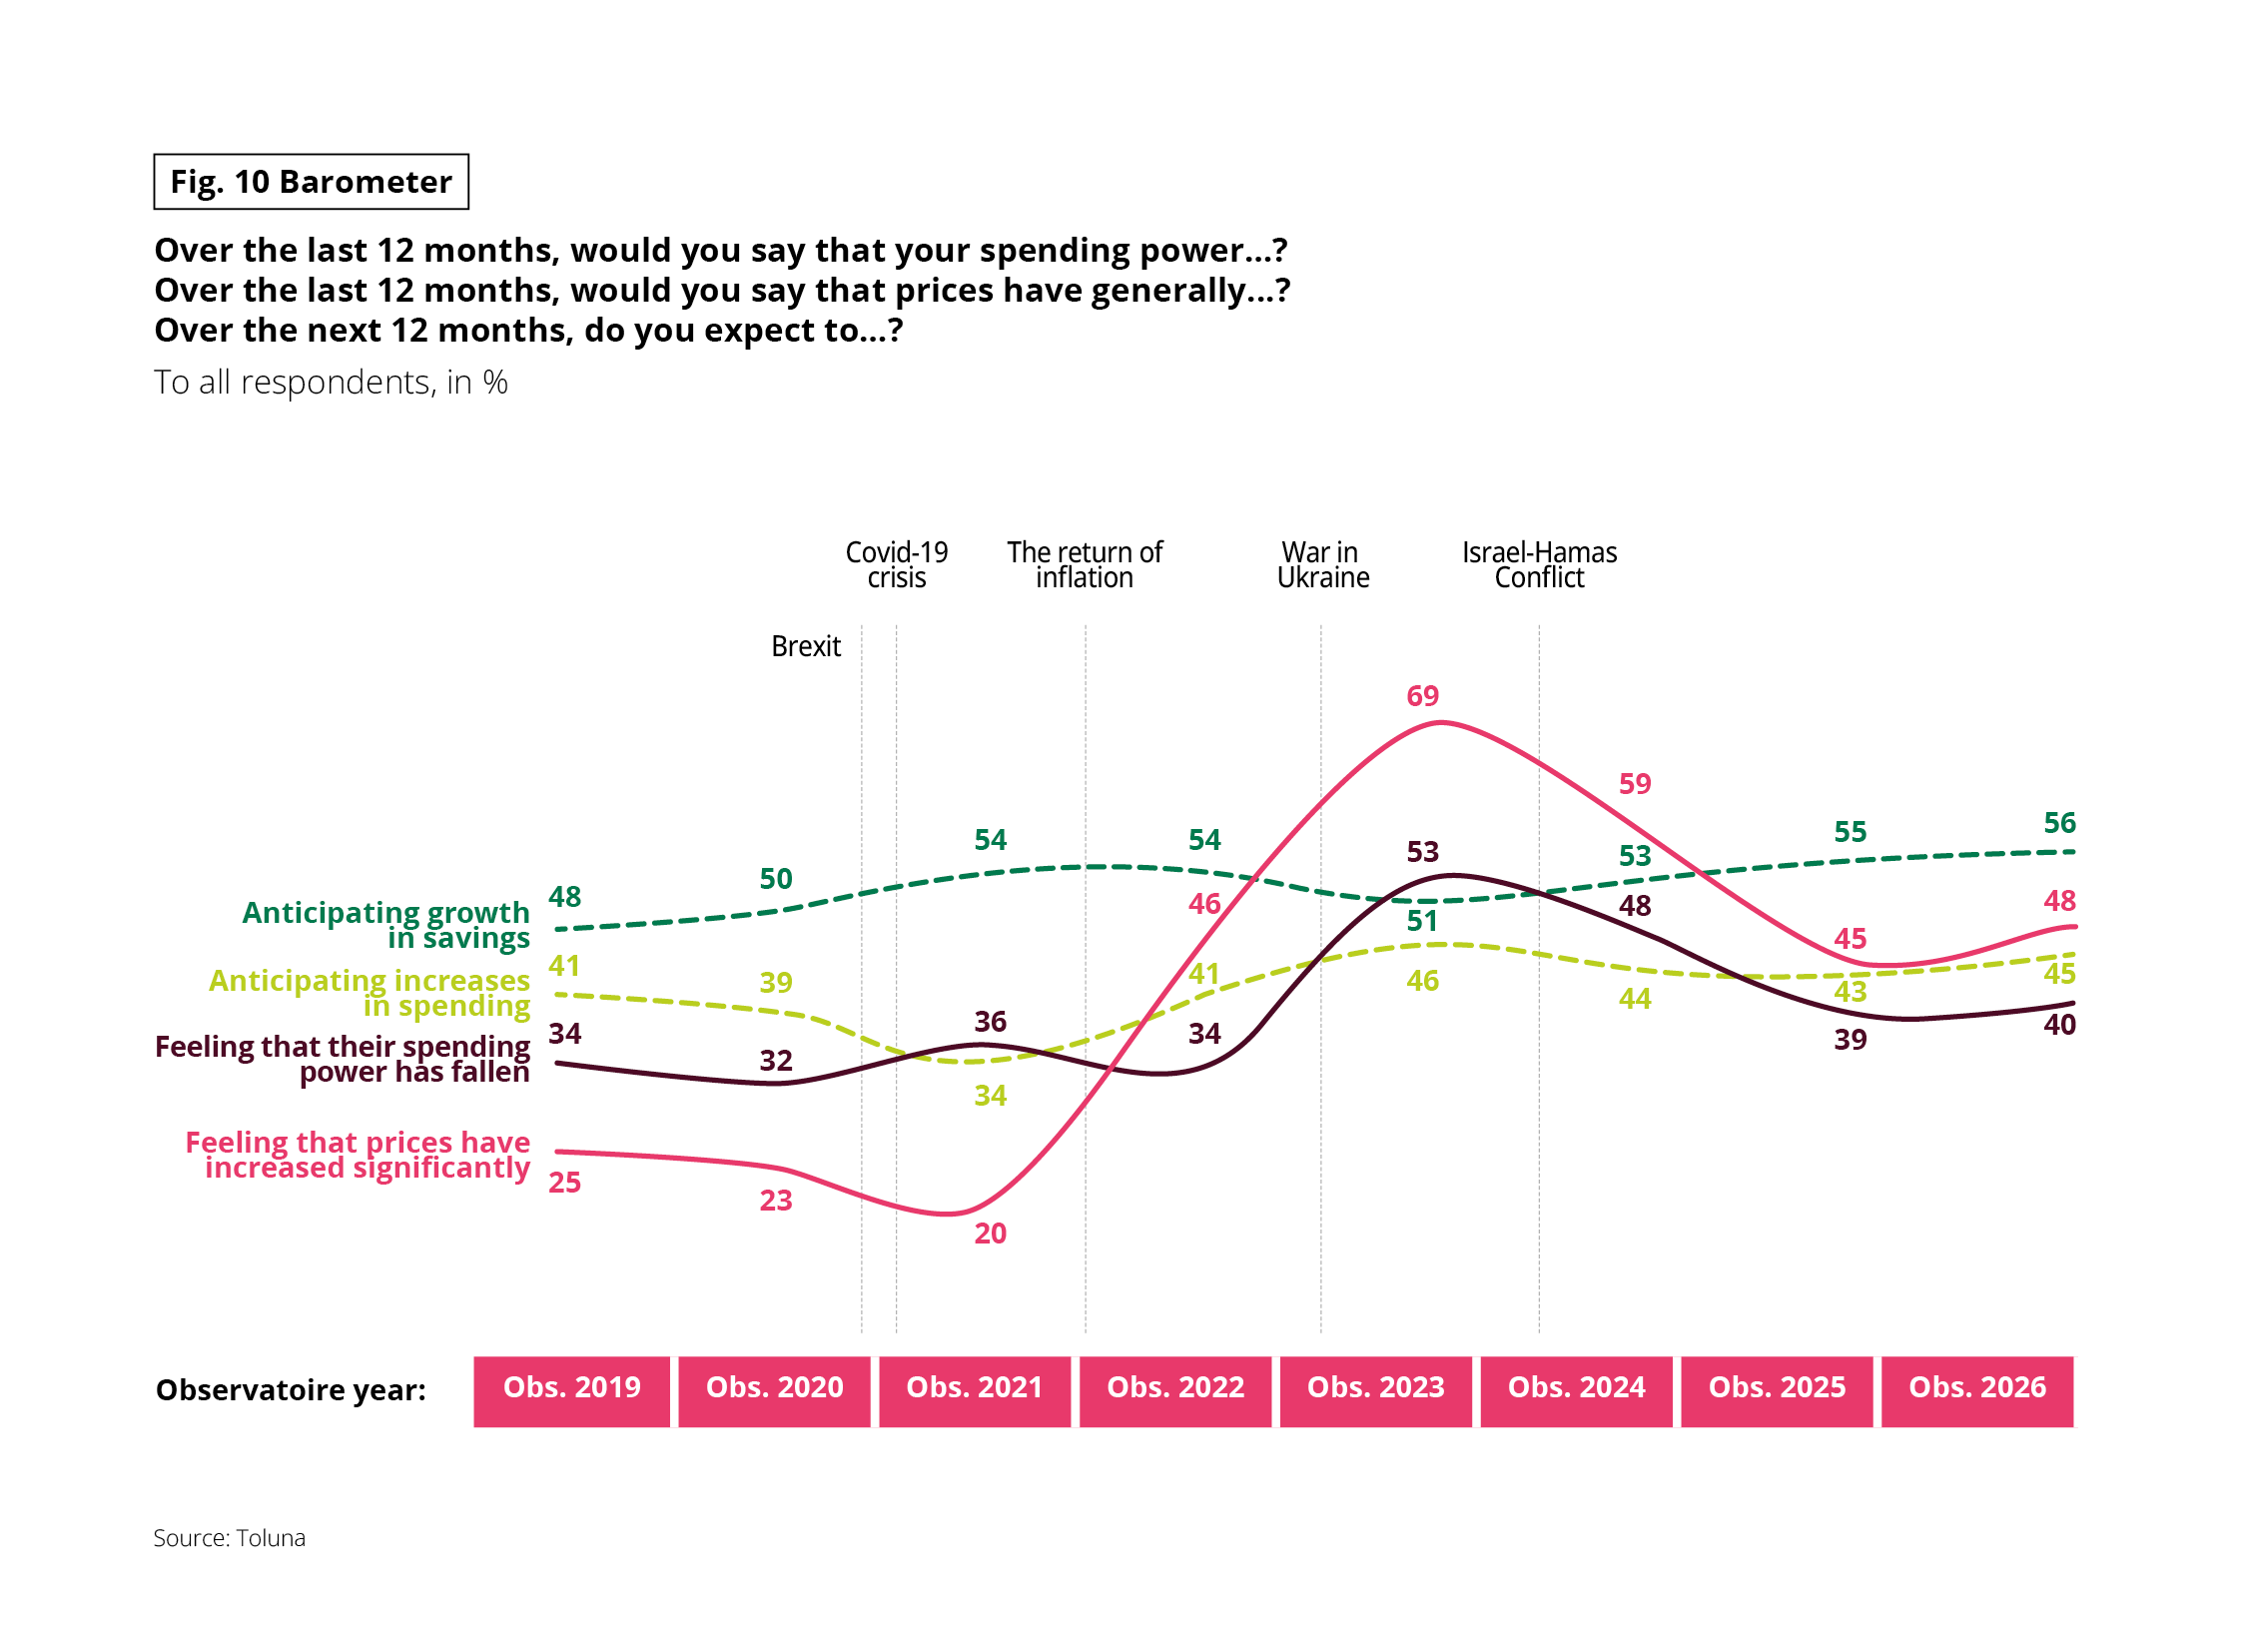 The graph traces the evolution of several economic perceptions expressed as a percentage, between 2019 and 2026.
Data (markers)
Anticipation of increased savings: 48% (2019), 50% (2020), 54% (2021), then stabilization around 50% from 2022
Feeling that prices have clearly increased: 25% (2019), 23% (2020), 20% (2021), strong increase from 2022 with a peak in 2023
Feeling that purchasing power has decreased: 34% (2019), 32% (2020), 36% (2021), progression after 2022
Main Finding Perceptions related to price increases and decreased purchasing power increase significantly from 2022, while savings and expense expectations evolve more moderately.
Source: Toluna
The graph traces the evolution of several economic perceptions expressed as a percentage, between 2019 and 2026.
Data (markers)
Anticipation of increased savings: 48% (2019), 50% (2020), 54% (2021), then stabilization around 50% from 2022
Feeling that prices have clearly increased: 25% (2019), 23% (2020), 20% (2021), strong increase from 2022 with a peak in 2023
Feeling that purchasing power has decreased: 34% (2019), 32% (2020), 36% (2021), progression after 2022
Main Finding Perceptions related to price increases and decreased purchasing power increase significantly from 2022, while savings and expense expectations evolve more moderately.
Source: Toluna
READY TO CONSUME
With spending power holding up and spirits rising slightly, it is hardly surprising to see an increase in buying intentions. 45% of Europeans said they wanted to increase their spending this year, compared with 43% in 2025.
With the exception of Romania, France and Italy, this score is up in all countries.
However, the Romanians are the most inclined to give in to consumerist temptation, with Belgians and Poles also ready to do so. It should be noted that ‘spenders’ are in the majority only in these three countries. Conversely, the Germans and Swedes intended to show restraint, closely followed by the French and Portuguese. Over the long term, the British, Portuguese, Belgians and French stood out as showing an increase in their desire to consume.
Fig 11 – Intention to increase expenses by country
Download this infographic for your presentations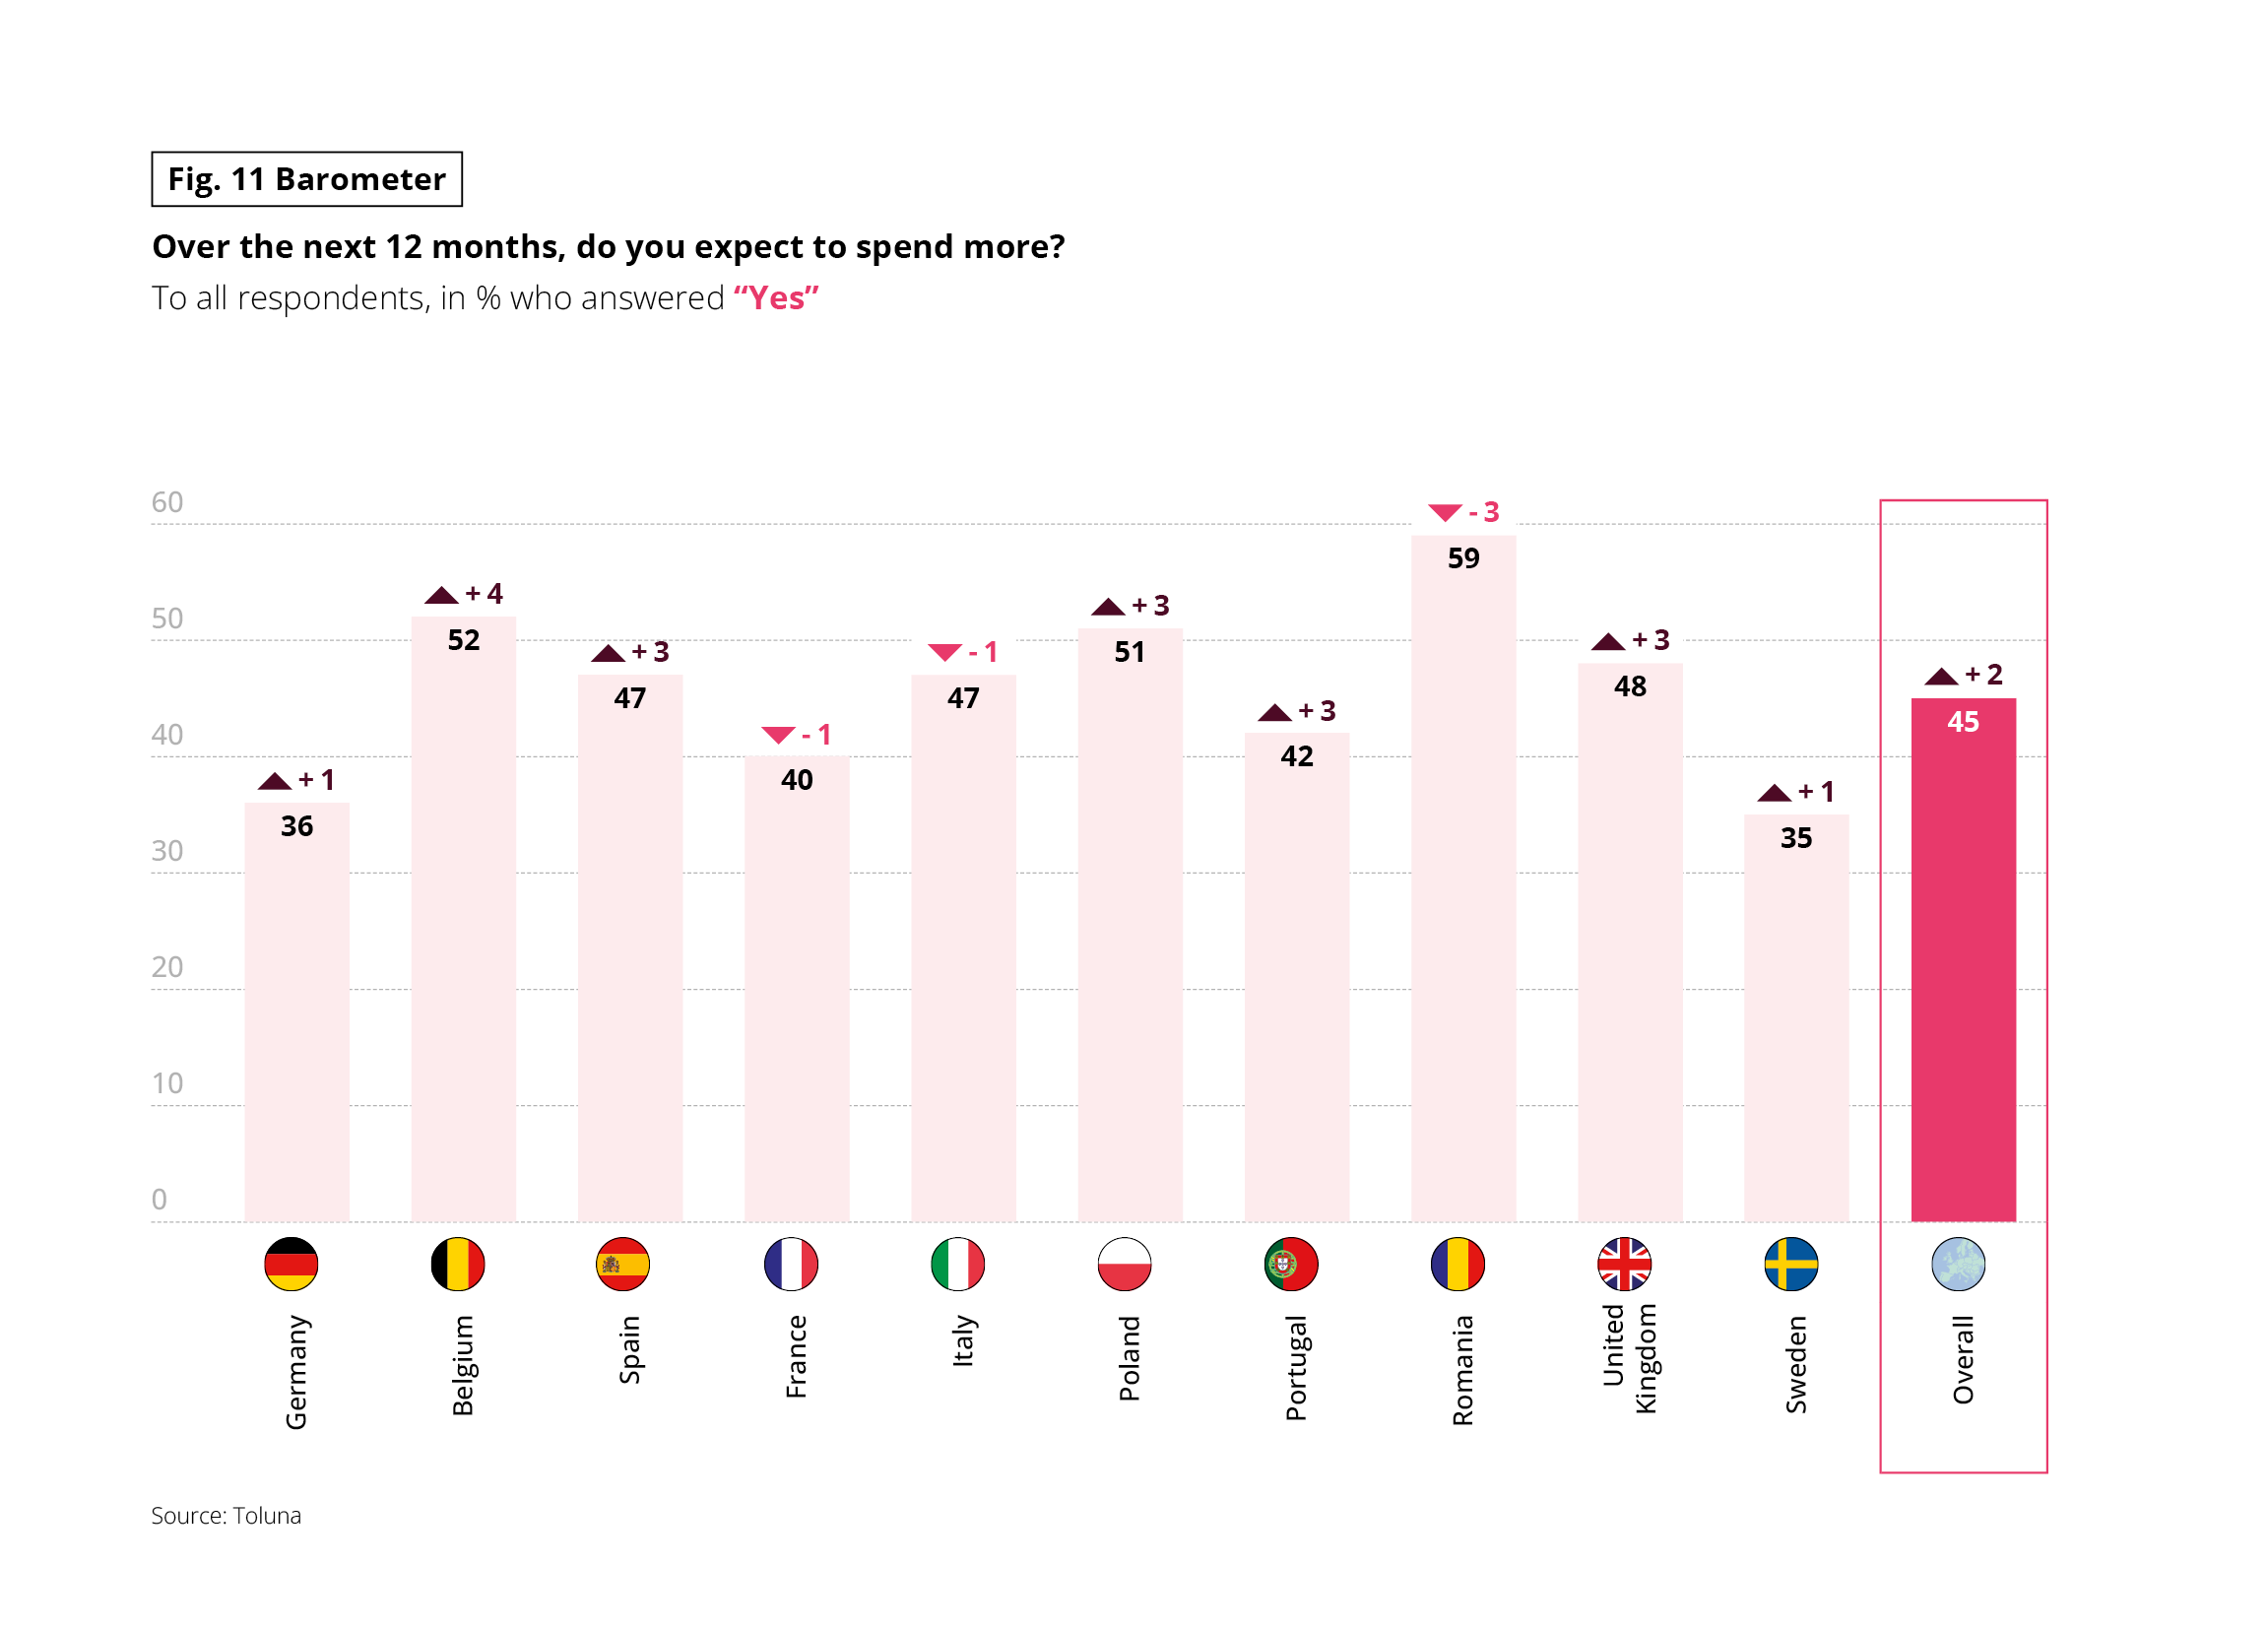 The graph presents the proportion of respondents who declare that they will increase their expenses in the next 12 months
Data
Germany: 36%
Belgium: 52%
Spain: 47%
France: 40%
Italy: 47%
Poland: 51%
Portugal: 42%
Romania: 59%
United Kingdom: 48%
Sweden: 35%
All countries: 45%
Main Finding Almost half of the respondents, on average, declare that they plan to increase their expenses in the coming year.
Source: Toluna
The graph presents the proportion of respondents who declare that they will increase their expenses in the next 12 months
Data
Germany: 36%
Belgium: 52%
Spain: 47%
France: 40%
Italy: 47%
Poland: 51%
Portugal: 42%
Romania: 59%
United Kingdom: 48%
Sweden: 35%
All countries: 45%
Main Finding Almost half of the respondents, on average, declare that they plan to increase their expenses in the coming year.
Source: Toluna
EVER HIGHER SAVINGS
With crisis after crisis having emerged in recent years, the subject of savings has constantly been in the news, as people are saving at levels rarely seen before. Overall, 2025 was no exception to the rule.
The savings rate remained very high, particularly in Germany, France and Sweden. Moreover, there is nothing to suggest that we will see a significant fall in savings levels in 2026.
In fact, the Europeans surveyed for this Observatoire Cetelem showed strong saving intentions: 56% wanted to increase their savings, compared with 55% last year. In all countries, this was the view of the majority, with the exception of Belgium and France, which is, however, one of the most ‘economical’ countries in Europe. This cautious approach to finance was highest, by a significant margin, in a group of five nations made up of Poland, Portugal, Romania, the United Kingdom and Sweden.
Fig 12 – Intention to increase savings by country
Download this infographic for your presentations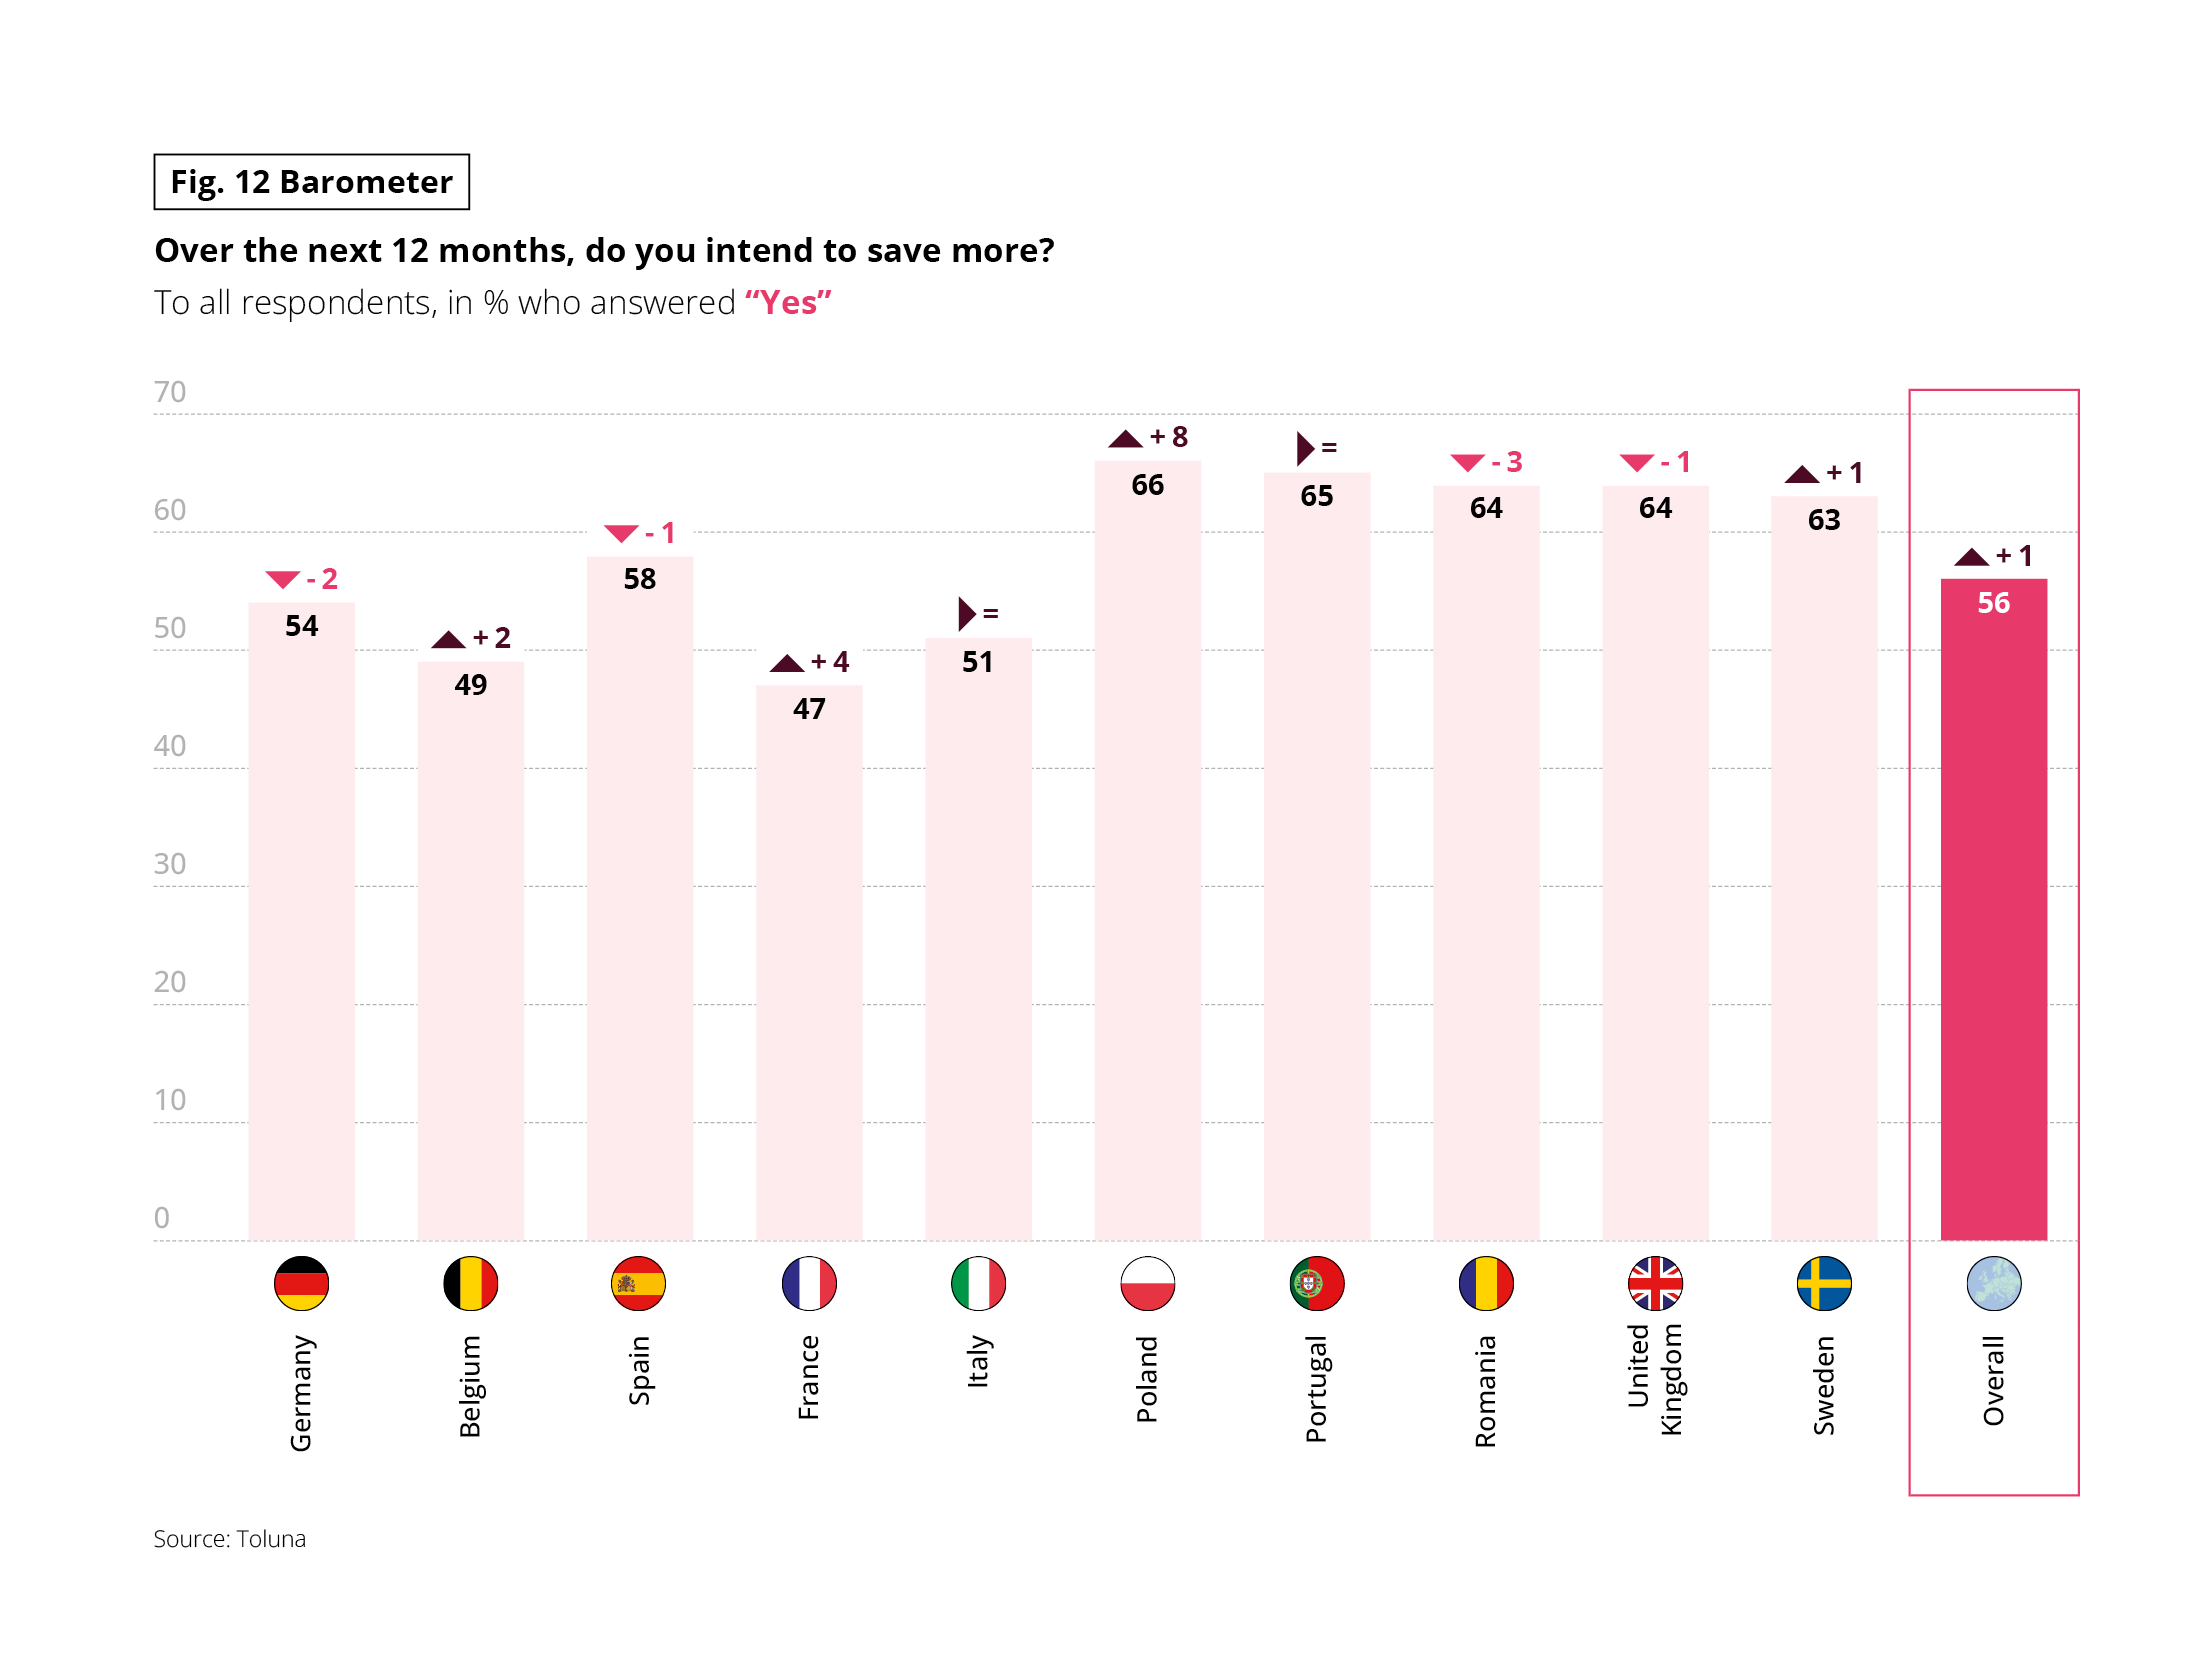 The graph indicates the proportion of respondents who declare that they want to increase their savings in the next 12 months.
Data
Germany: 54%
Belgium: 49%
Spain: 58%
France: 47%
Italy: 51%
Poland: 66%
Portugal: 65%
Romania: 64%
United Kingdom: 64%
Sweden: 63%
All countries: 56%
Main Finding In all observed countries, more than half of the respondents plan to increase their savings in the next 12 months.
Source: Toluna
The graph indicates the proportion of respondents who declare that they want to increase their savings in the next 12 months.
Data
Germany: 54%
Belgium: 49%
Spain: 58%
France: 47%
Italy: 51%
Poland: 66%
Portugal: 65%
Romania: 64%
United Kingdom: 64%
Sweden: 63%
All countries: 56%
Main Finding In all observed countries, more than half of the respondents plan to increase their savings in the next 12 months.
Source: Toluna
Fig 13 – Quarterly savings rate by country
Download this infographic for your presentations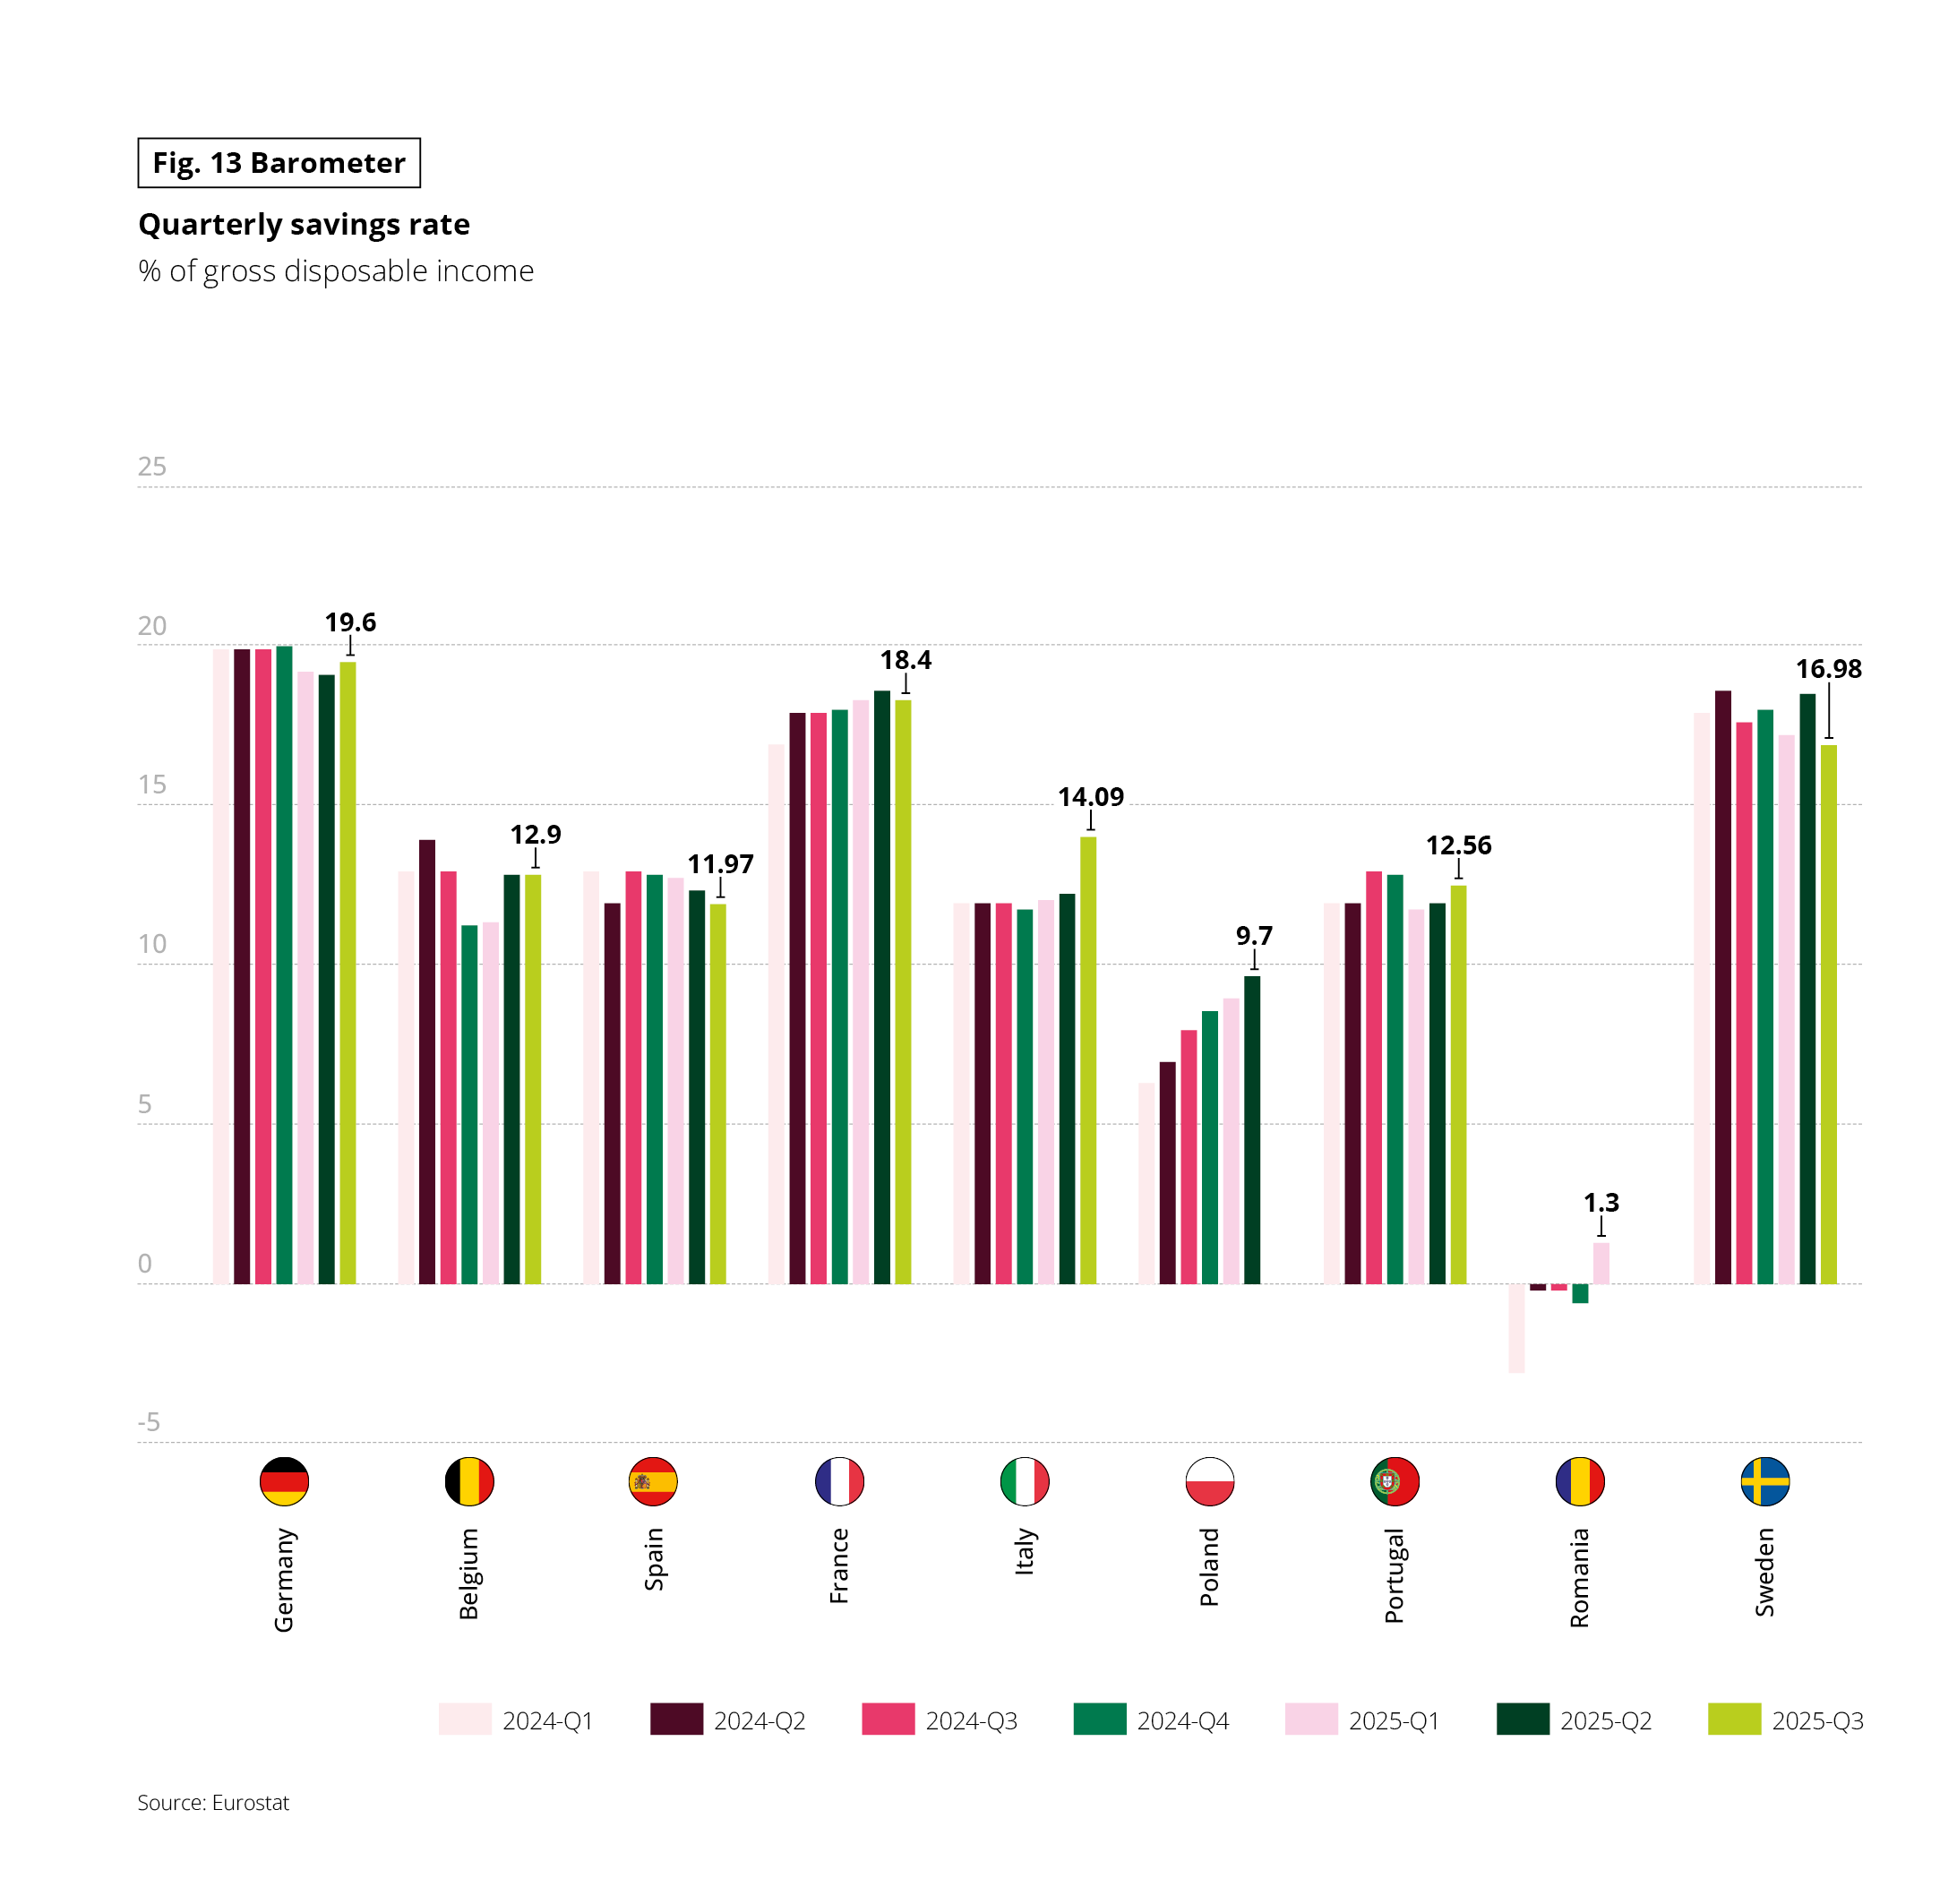 The graph presents the quarterly savings rate, expressed as a percentage of gross disposable income, for several European countries between 2024 and 2025.
Values represent a percentage of gross disposable income.
Data (markers)
Germany: around 19.6% at the highest observed quarter
France: around 18.4%
Italy: around 14.1%
Poland: around 9.7%
Portugal: around 12.6%
Romania: value close to 1.3% in one quarter
Sweden: around 17%
Main Finding Quarterly savings rates vary significantly from country to country, with marked differences between Western Europe and some Eastern European countries.
Source: Eurostat
The graph presents the quarterly savings rate, expressed as a percentage of gross disposable income, for several European countries between 2024 and 2025.
Values represent a percentage of gross disposable income.
Data (markers)
Germany: around 19.6% at the highest observed quarter
France: around 18.4%
Italy: around 14.1%
Poland: around 9.7%
Portugal: around 12.6%
Romania: value close to 1.3% in one quarter
Sweden: around 17%
Main Finding Quarterly savings rates vary significantly from country to country, with marked differences between Western Europe and some Eastern European countries.
Source: Eurostat
A CLOSER LOOK AT THE SENIOR CITIZENS BAROMETER
As was the case 10 years ago, this edition of the Observatoire Cetelem for 2026 is devoted specifically to senior citizens. Let us take a look at the views of the over-60s on the topics covered by the Cetelem Barometer.
- Seniors were more pessimistic about the situation in their country, with a score of 4.5, well below the overall average (5.2) and that given by all other generations.
- The gap is narrower when it comes to personal circumstances, although the score is still lower than that given by Europeans as a whole (5.9 vs. 6.1).
- 45 % des séniors pour juger que leur situation financière est inférieure à celle de la moitié des habitants de leur pays, soit deux fois plus que les 18-49 ans.
- More than 1 in 2 senior citizens reported a fall in spending power, compared with the average of 4 in 10.
- Almost all seniors (94%) agreed that prices had increased in recent months, with 1 in 2 believing they had increased significantly.
- Just over a third of seniors wanted to spend more, a figure well below the average and which significantly differs from the intentions of younger generations.
- Intentions to save were well below the average (36% vs 56%), and below those of other generations.