It’s good to be old


In Western countries, and more specifically in Europe, we are observing, not without real concern, the intersection of two demographic curves: that of the birth rate, which is constantly falling, and that related to deaths, linked to the ageing of the baby-boom generation, which is steadily increasing. The major consequence of this is the predicted decline in the number of people living in Europe. To say that the senior population is the focus of much attention is an understatement. In 2016, the Observatoire Cetelem was already looking closely at the people who make up the silver economy.
Ten years on, who are today’s senior citizens and how are they doing?
THE AGE TO STOP WORKING
Ten years ago, the first Observatoire Cetelem devoted to seniors highlighted the diverse interpretations that this term encapsulates (professional, political, medical, social, etc.). The study devoted to them set the ‘senior’ floor at the age of 50, without, of course, setting any limit to the ceiling. In other words, it covered the generation now known as boomers. For this 2026 edition, we set out to find out what Europeans thought about this age. According to them, people become seniors at 62, on average.
There are relatively significant differences between countries and generations.
There is a 10-point gap between the Italians, for whom it takes a long time to become a senior citizen, and the Romanians, for whom it happens early.
There are 4 points between the 18-34 age group and the 65+ age group (60.3 years old vs 64.7 years old).
In the following pages, we consider seniors to be people aged 60 and over.
Fig 1 – Perceived age of being considered senior by country
Download this infographic for your presentations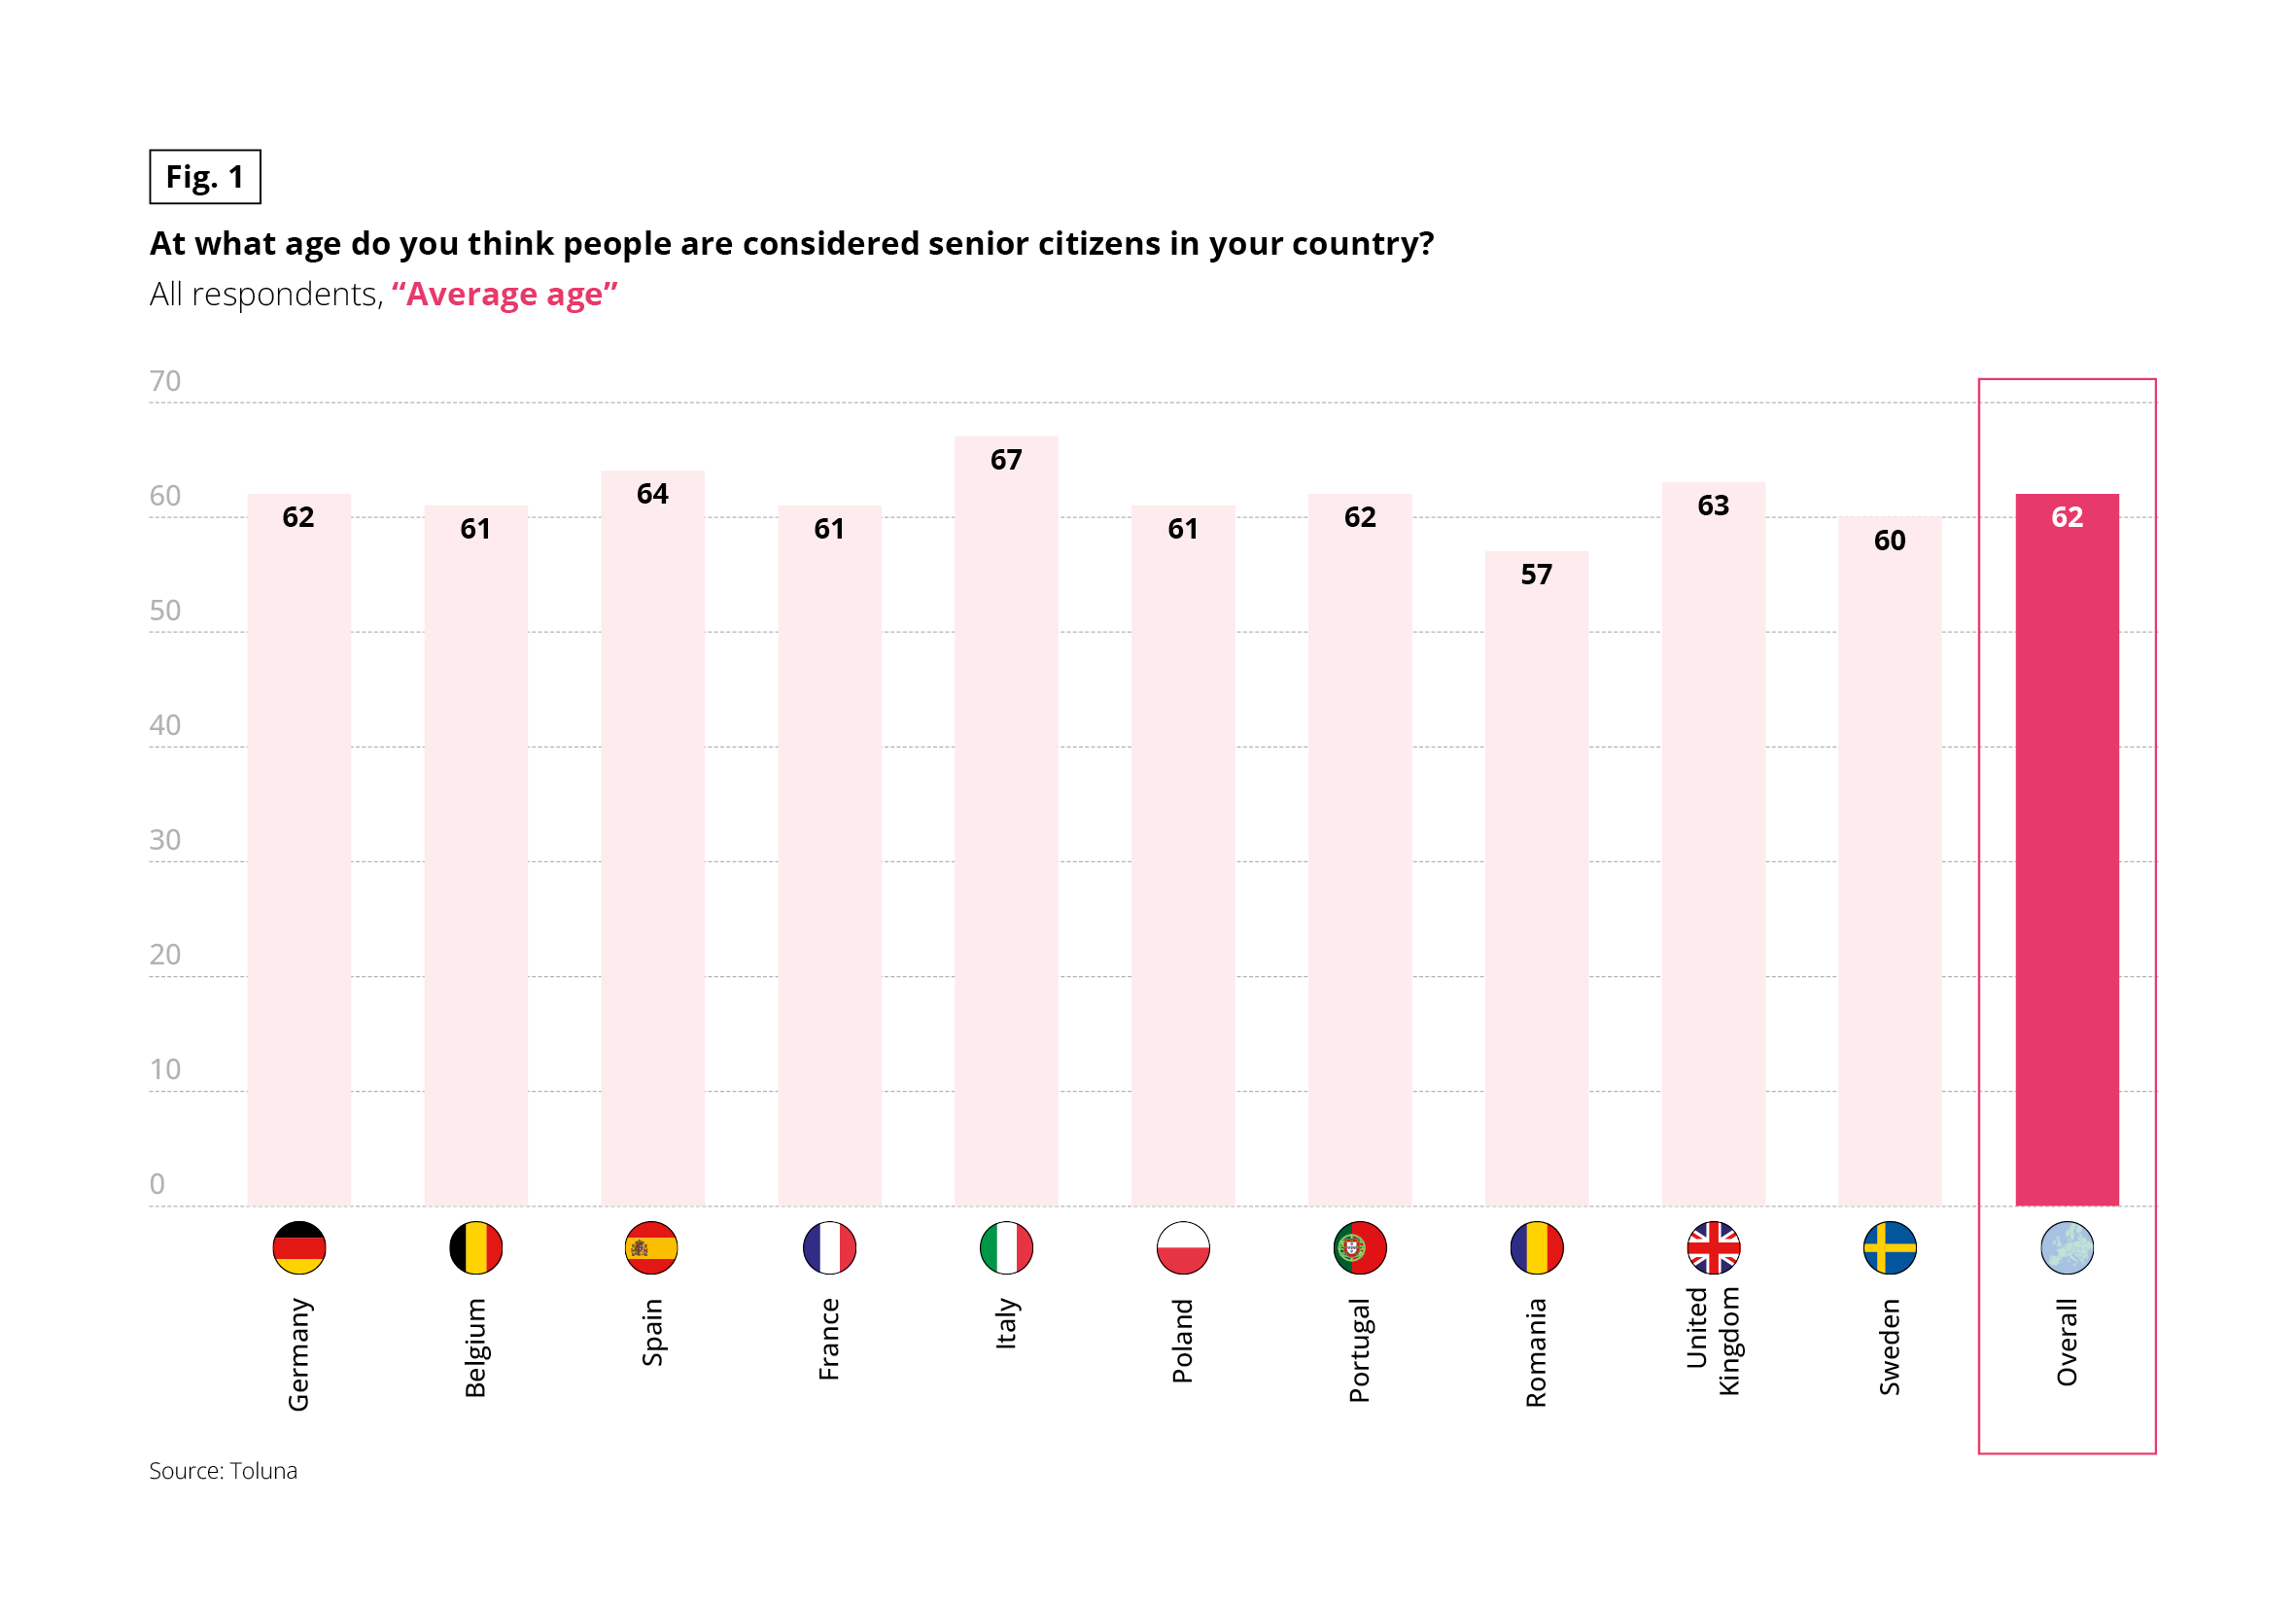 The graph presents the average age at which respondents estimate that a person is considered senior, according to several European countries, as well as a total “all countries”.
Each country is represented by a vertical bar indicating an average age expressed in years. Displayed values:
Germany: 62 years
Belgium: 61 years
Spain: 64 years
France: 61 years
Italy: 67 years
Poland: 61 years
Portugal: 62 years
Romania: 57 years
United Kingdom: 63 years
Sweden: 60 years
All countries: 62 years
The “All countries” bar is visually highlighted. The flags under the bars are decorative and serve only to identify the countries.
The age range for all countries is between 57 and 67 years, with a global average of 62 years. Source: Toluna.
The graph presents the average age at which respondents estimate that a person is considered senior, according to several European countries, as well as a total “all countries”.
Each country is represented by a vertical bar indicating an average age expressed in years. Displayed values:
Germany: 62 years
Belgium: 61 years
Spain: 64 years
France: 61 years
Italy: 67 years
Poland: 61 years
Portugal: 62 years
Romania: 57 years
United Kingdom: 63 years
Sweden: 60 years
All countries: 62 years
The “All countries” bar is visually highlighted. The flags under the bars are decorative and serve only to identify the countries.
The age range for all countries is between 57 and 67 years, with a global average of 62 years. Source: Toluna.
Fig 2 – Proportion of people aged 60 or over in the population
Download this infographic for your presentations The graph compares the proportion of the population aged 60 or over, expressed as a percentage, in several European countries between 2016 and 2024.
Germany: 28.7%
Belgium: 25.8%
Spain: 26.9%
France: 28.2%
Italy: 31.6%
Poland: 26.7%
Portugal: 31.0%
Romania: 24.5%
United Kingdom: 24.3%
Sweden: 26.4%
For all countries, the proportion of people aged 60 or over increases gradually over the observed period. The color codes serve only to distinguish the years and are explained by a legend.
Source: Eurostat.
The graph compares the proportion of the population aged 60 or over, expressed as a percentage, in several European countries between 2016 and 2024.
Germany: 28.7%
Belgium: 25.8%
Spain: 26.9%
France: 28.2%
Italy: 31.6%
Poland: 26.7%
Portugal: 31.0%
Romania: 24.5%
United Kingdom: 24.3%
Sweden: 26.4%
For all countries, the proportion of people aged 60 or over increases gradually over the observed period. The color codes serve only to distinguish the years and are explained by a legend.
Source: Eurostat.
Insight
According to Eurostat, the population of the European Union is expected to peak in 2026 at 453 million inhabitants. This is expected to be followed by a slow demographic decline to 419 million by 2100. Seniors would then represent a third of the population, with a median age of 50.In France, according to projections by the Department of Research, Surveys, Evaluation and Statistics (Drees), the population aged over 60 is thought to be 23 million, 5 million more than in 2021.
Insight
While the Europeans surveyed for this study said that people became senior citizens at 62, the average retirement age in 2024 was around 65.
Fig 3 – Observed, expected, and future retirement ages
Download this infographic for your presentations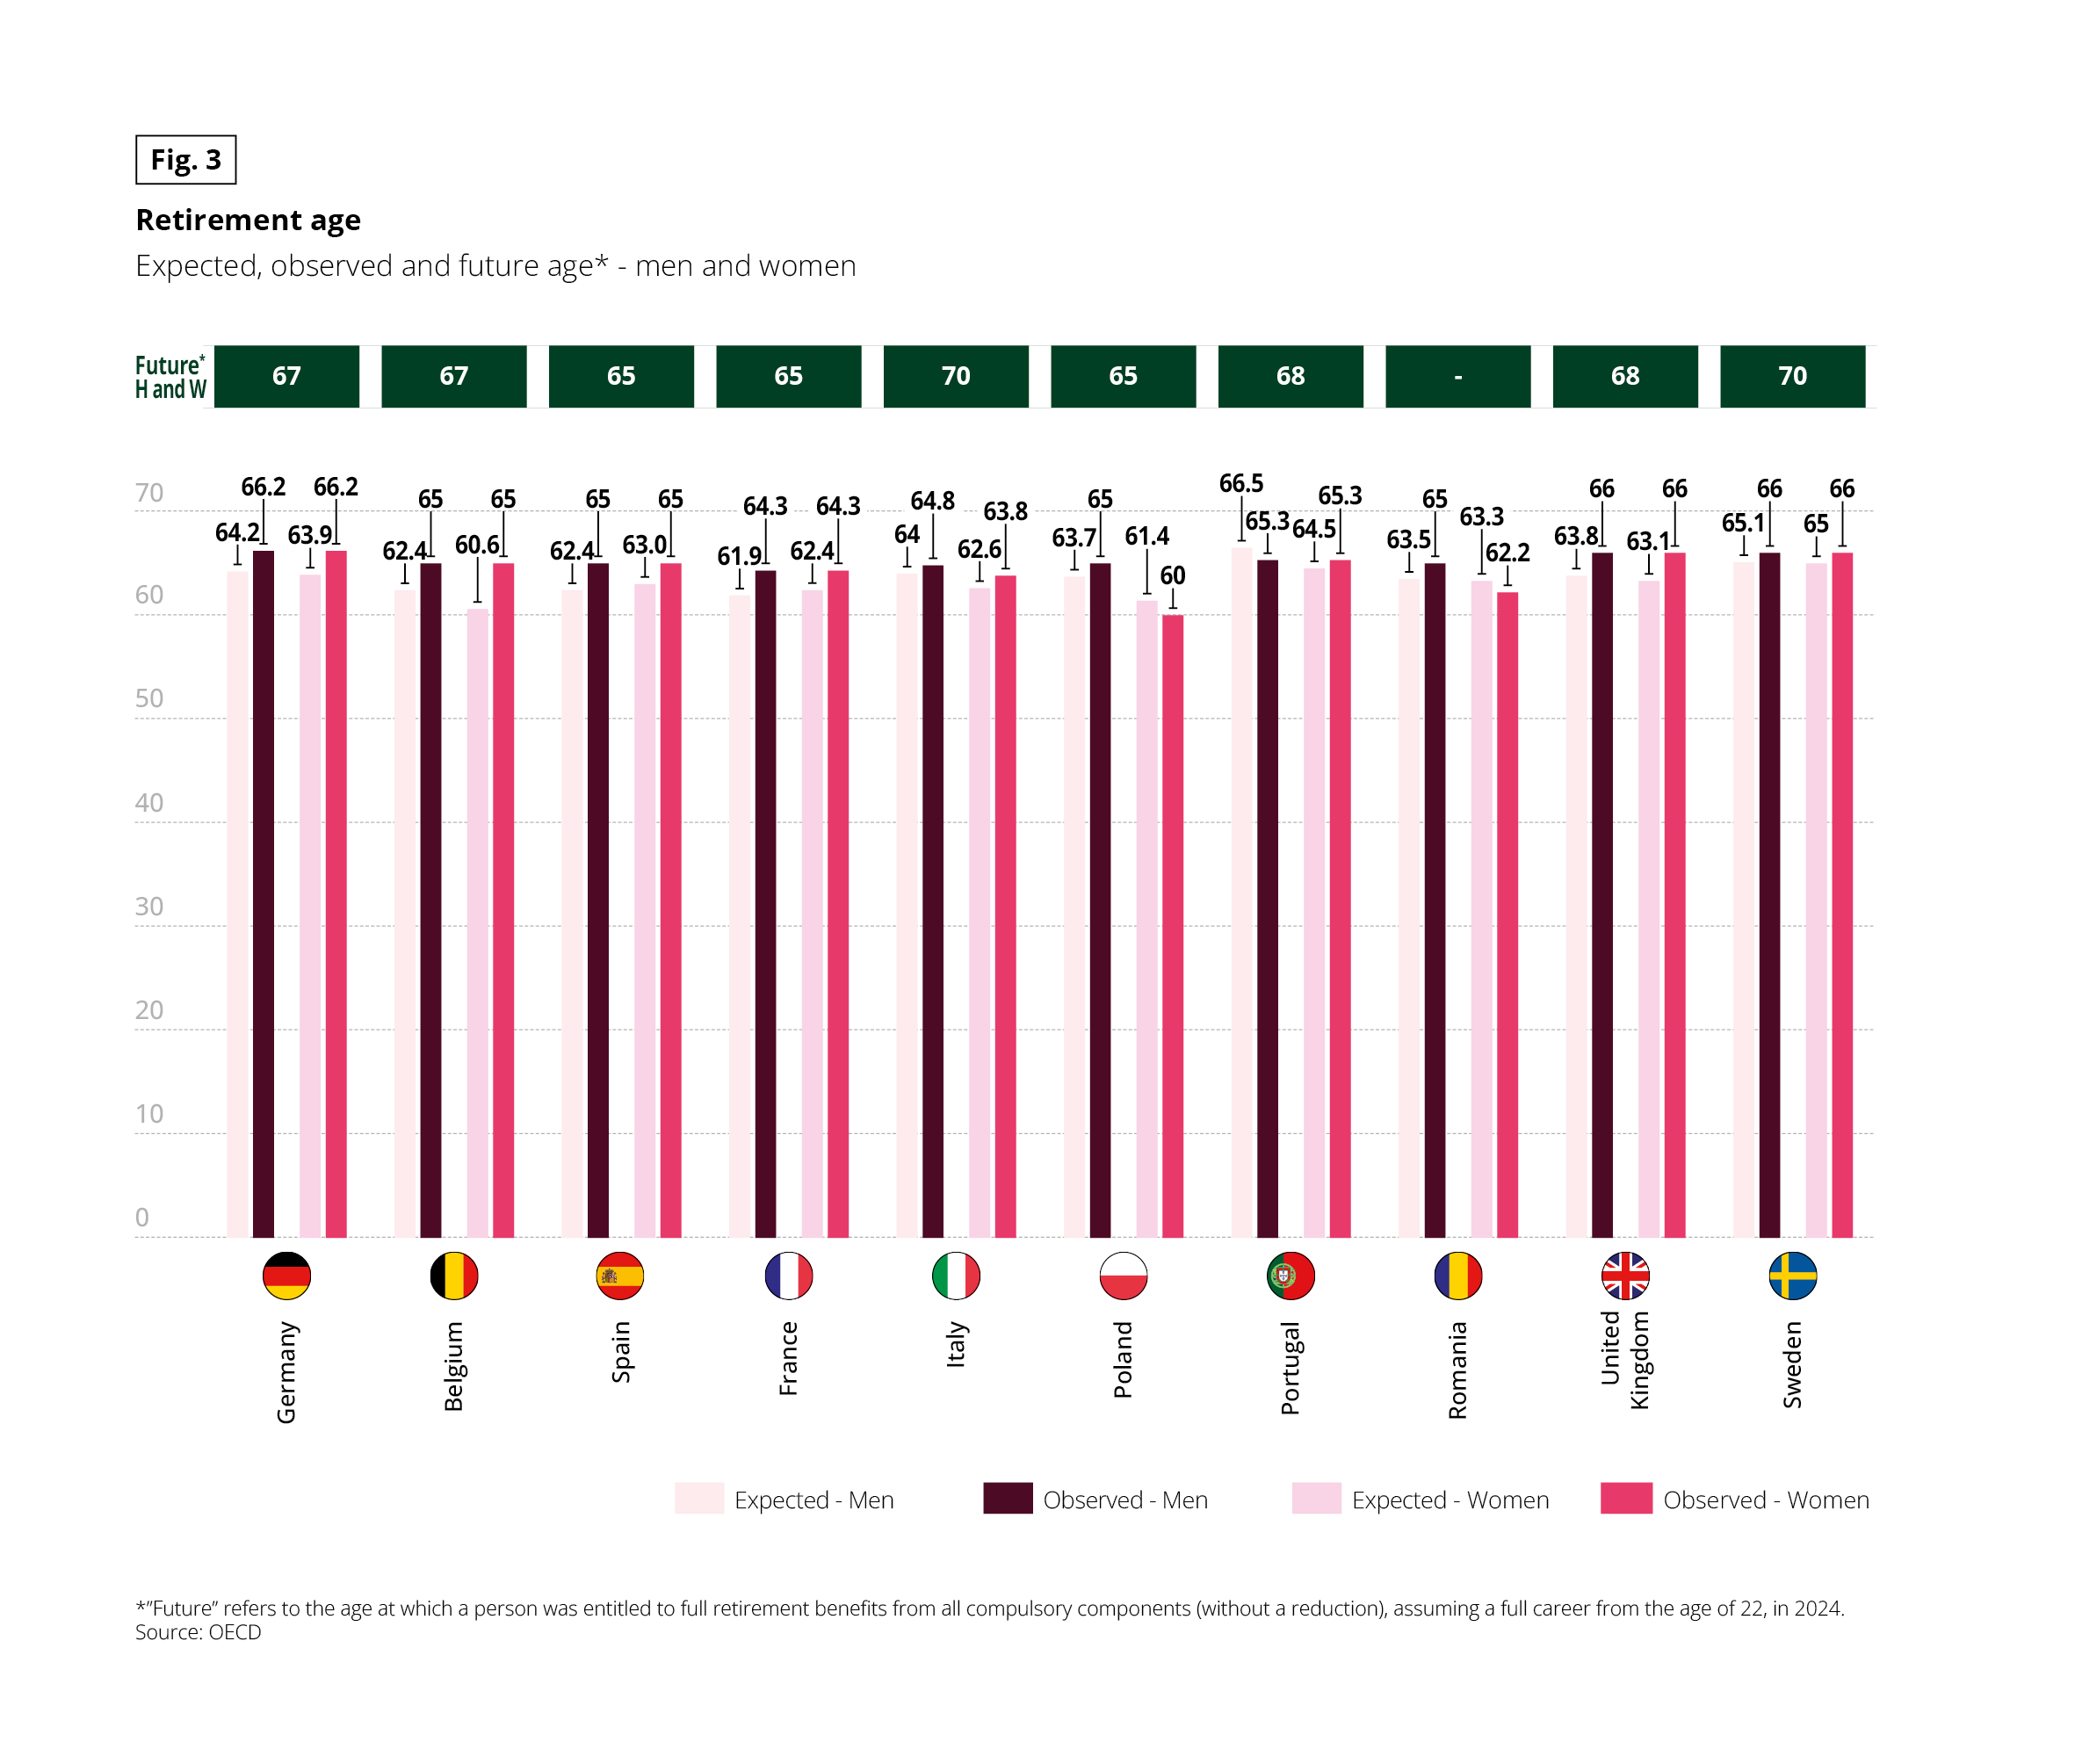 The graph presents, for several European countries, the retirement ages according to three indicators: expected age, observed age, and future expected age, separated by sex.
Expected – Men
Observed – Men
Expected – Women
Observed – Women
The ages are expressed in years. A top line indicates the future expected age common to men and women when available.
Examples of observed values:
Germany: observed men 66.2 years, observed women 63.9 years, future 67 years
France: observed men 64.3 years, observed women 62.4 years, future 65 years
Italy: observed men 64.8 years, observed women 62.6 years, future 70 years
Poland: observed men 63.7 years, observed women 60.0 years, future 65 years
United Kingdom: observed men 66 years, observed women 63.1 years, future 68 years
Sweden: observed men 66 years, observed women 65 years, future 70 years
When the future value is not available, it is indicated by a dash. The flag icons are decorative.
Note: “Future” corresponds to the age at which a person is eligible for a full retirement pension, assuming a complete career starting at 22 years old, in 2024. Source: OECD.
The graph presents, for several European countries, the retirement ages according to three indicators: expected age, observed age, and future expected age, separated by sex.
Expected – Men
Observed – Men
Expected – Women
Observed – Women
The ages are expressed in years. A top line indicates the future expected age common to men and women when available.
Examples of observed values:
Germany: observed men 66.2 years, observed women 63.9 years, future 67 years
France: observed men 64.3 years, observed women 62.4 years, future 65 years
Italy: observed men 64.8 years, observed women 62.6 years, future 70 years
Poland: observed men 63.7 years, observed women 60.0 years, future 65 years
United Kingdom: observed men 66 years, observed women 63.1 years, future 68 years
Sweden: observed men 66 years, observed women 65 years, future 70 years
When the future value is not available, it is indicated by a dash. The flag icons are decorative.
Note: “Future” corresponds to the age at which a person is eligible for a full retirement pension, assuming a complete career starting at 22 years old, in 2024. Source: OECD.
Insight
The pension contribution rate reflects the financial effort made by working people and companies to fund pensions: the proportion of salaries (or income) that is deducted each month to fund the pension system. It applies to gross salary for employees and professional income for the self-employed.
Fig 4 – Comparison of European retirement systems
Download this infographic for your presentations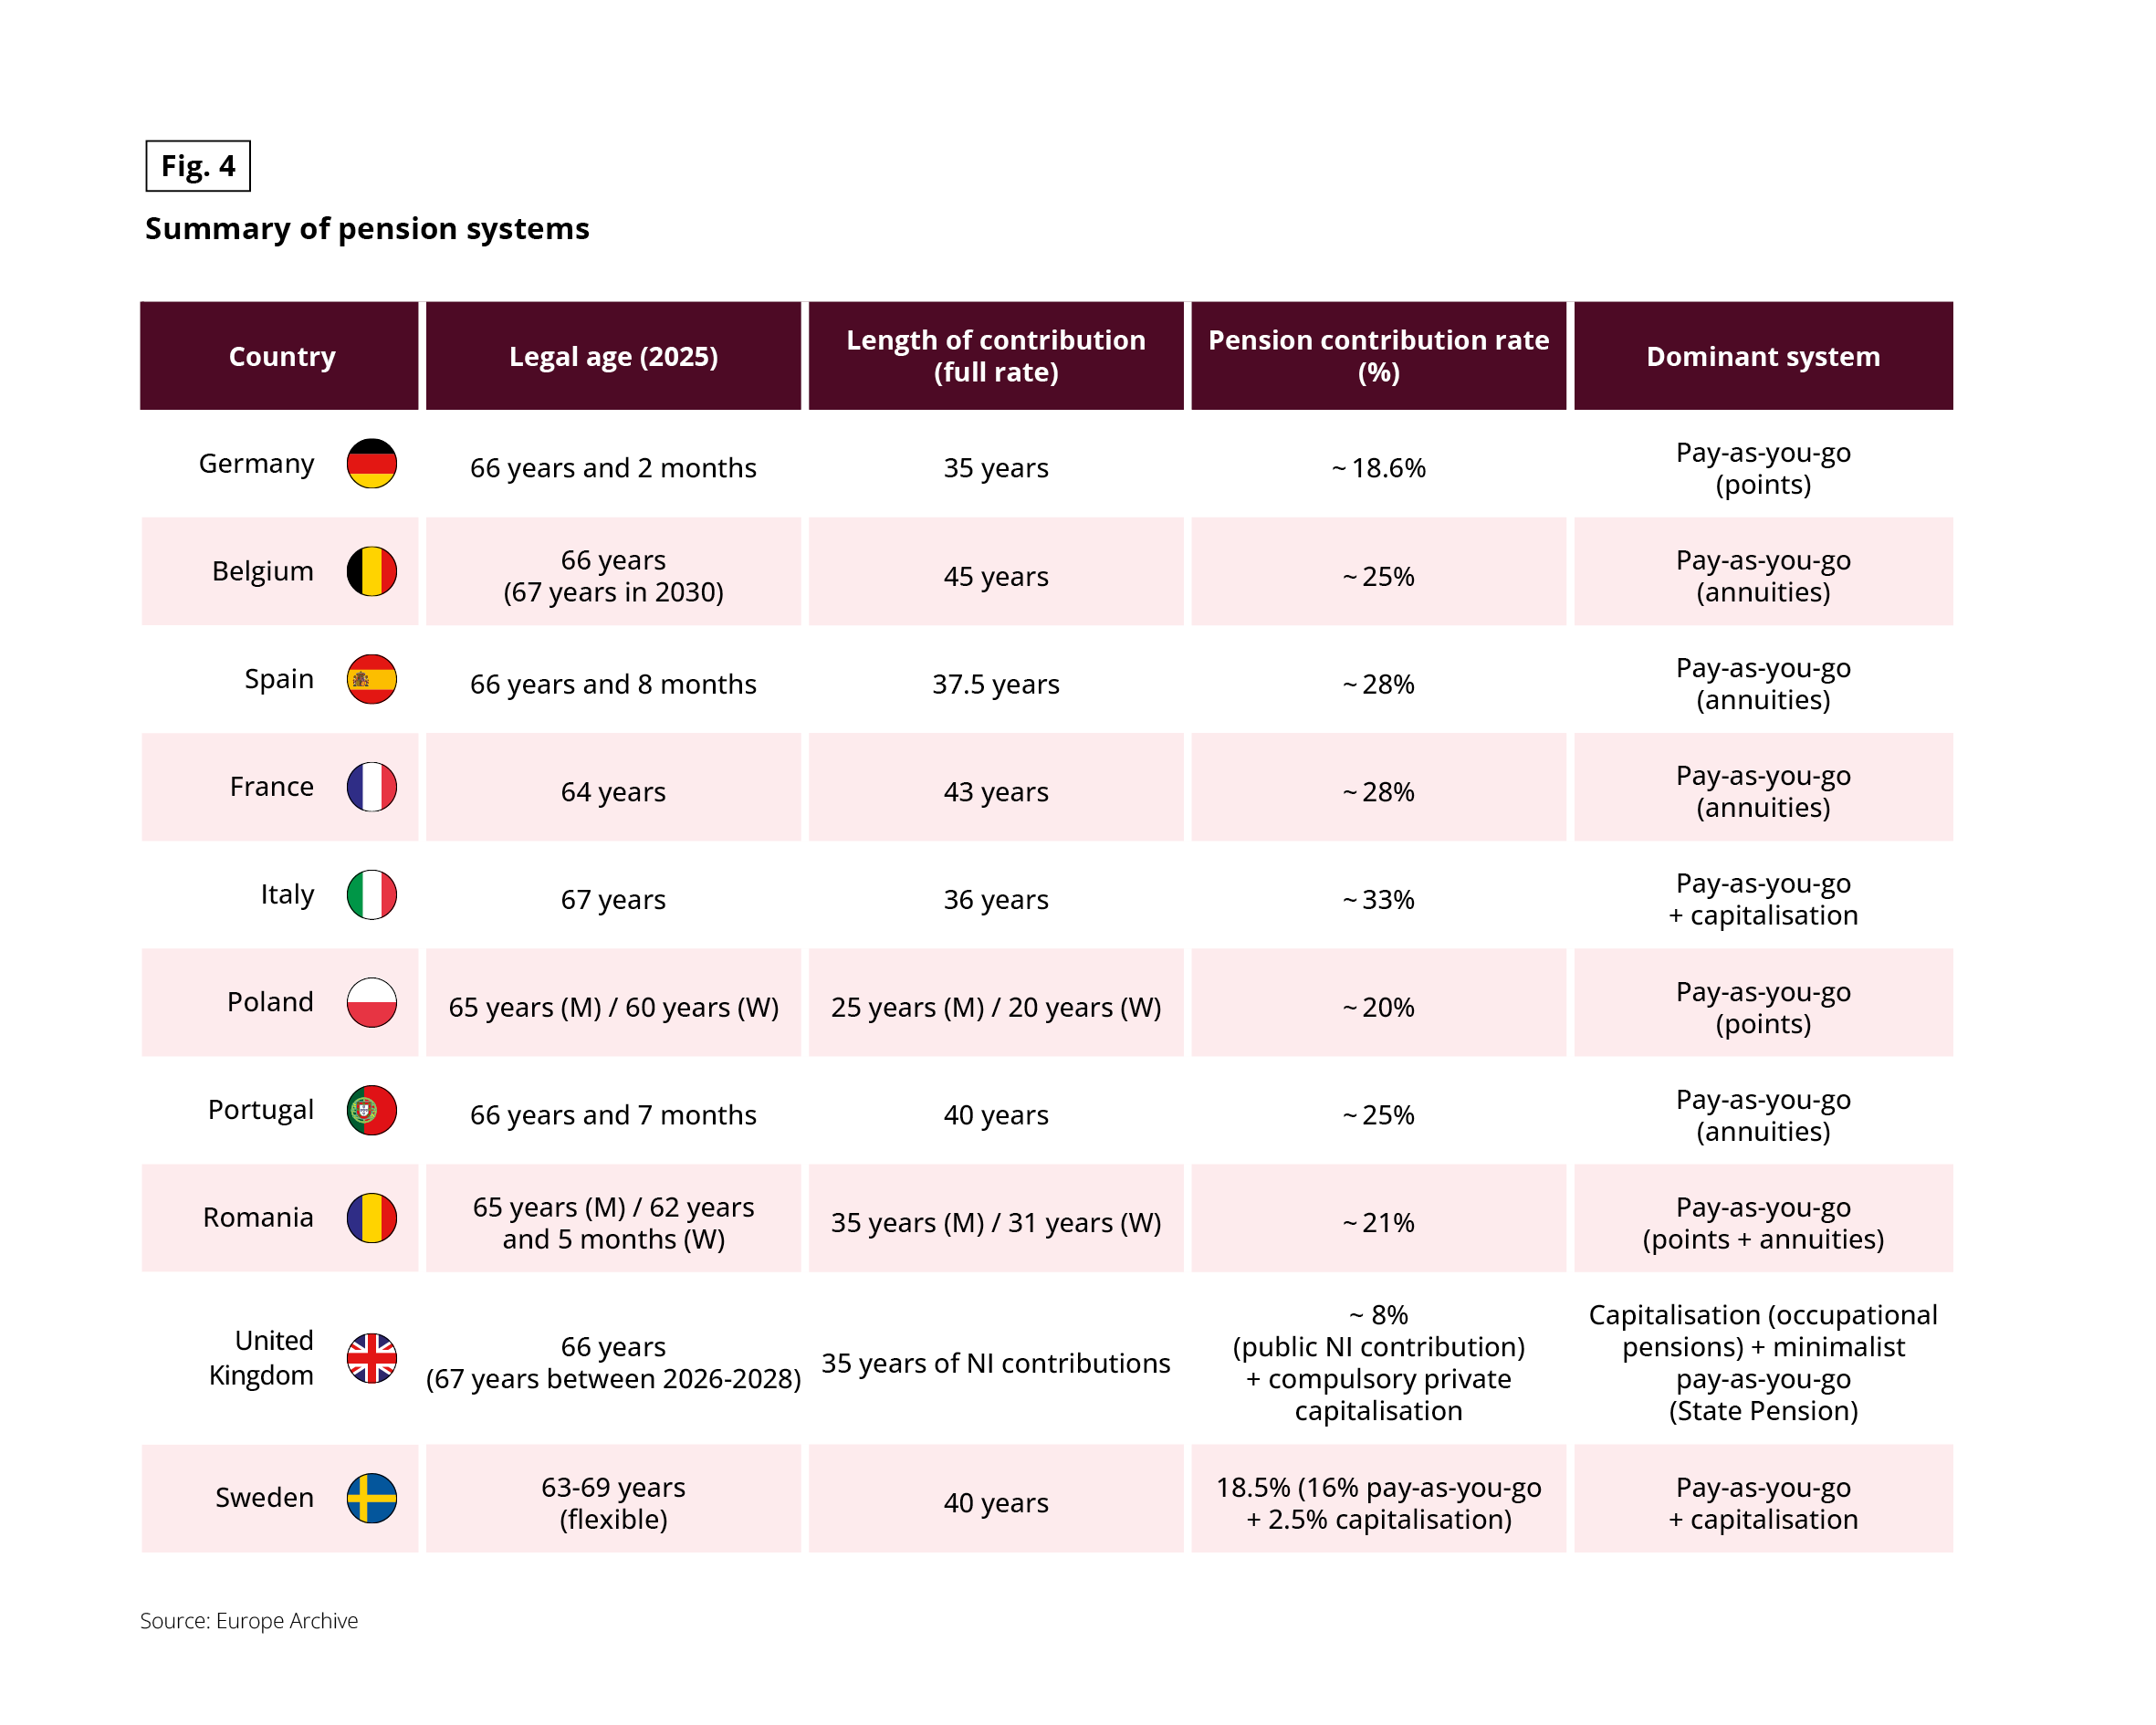 The table presents a comparative summary of the retirement systems in several European countries, with the parameters in effect or announced for 2025.
The legal age corresponds to the age at which retirement benefits are available in 2025, with details when a reform is planned.
The contribution period indicates the number of years required to obtain the full rate.
The contribution rates are expressed as a percentage and indicated approximately when preceded by the symbol “~”.
The mentions (H) and (F) distinguish between men and women when the rules differ.
The dominant systems are classified between pay-as-you-go (annuities or points) and capitalization.
Data
Germany: legal age 66 years and 2 months, 35 years of contribution, ~18.6%, pay-as-you-go by points
Belgium: 66 years (67 years in 2030), 45 years, ~25%, pay-as-you-go by annuities
Spain: 66 years and 8 months, 37.5 years, ~28%, pay-as-you-go by annuities
France: 64 years, 43 years, ~28%, pay-as-you-go by annuities
Italy: 67 years, 36 years, ~33%, pay-as-you-go and capitalization
Poland: 65 years (H) / 60 years (F), 25 years (H) / 20 years (F), ~20%, pay-as-you-go by points
Portugal: 66 years and 7 months, 40 years, ~25%, pay-as-you-go by annuities
Romania: 65 years (H) / 62 years and 5 months (F), 35 years (H) / 31 years (F), ~21%, mixed pay-as-you-go
United Kingdom: 66 years (67 years between 2026 and 2028), 35 years NI, ~8%, dominant capitalization
Sweden: 63 to 69 years (flexible), 40 years, 18.5% including 2.5% in capitalization, mixed system
Main Finding The European retirement systems show significant disparities in terms of legal age, contribution period, and funding structure.
Source: Europe Archive
The table presents a comparative summary of the retirement systems in several European countries, with the parameters in effect or announced for 2025.
The legal age corresponds to the age at which retirement benefits are available in 2025, with details when a reform is planned.
The contribution period indicates the number of years required to obtain the full rate.
The contribution rates are expressed as a percentage and indicated approximately when preceded by the symbol “~”.
The mentions (H) and (F) distinguish between men and women when the rules differ.
The dominant systems are classified between pay-as-you-go (annuities or points) and capitalization.
Data
Germany: legal age 66 years and 2 months, 35 years of contribution, ~18.6%, pay-as-you-go by points
Belgium: 66 years (67 years in 2030), 45 years, ~25%, pay-as-you-go by annuities
Spain: 66 years and 8 months, 37.5 years, ~28%, pay-as-you-go by annuities
France: 64 years, 43 years, ~28%, pay-as-you-go by annuities
Italy: 67 years, 36 years, ~33%, pay-as-you-go and capitalization
Poland: 65 years (H) / 60 years (F), 25 years (H) / 20 years (F), ~20%, pay-as-you-go by points
Portugal: 66 years and 7 months, 40 years, ~25%, pay-as-you-go by annuities
Romania: 65 years (H) / 62 years and 5 months (F), 35 years (H) / 31 years (F), ~21%, mixed pay-as-you-go
United Kingdom: 66 years (67 years between 2026 and 2028), 35 years NI, ~8%, dominant capitalization
Sweden: 63 to 69 years (flexible), 40 years, 18.5% including 2.5% in capitalization, mixed system
Main Finding The European retirement systems show significant disparities in terms of legal age, contribution period, and funding structure.
Source: Europe Archive
EUROPE’S POPULATION IS AGEING AT AN ACCELERATING RATE
Fig 5 – Evolution of births and deaths in Europe
Download this infographic for your presentations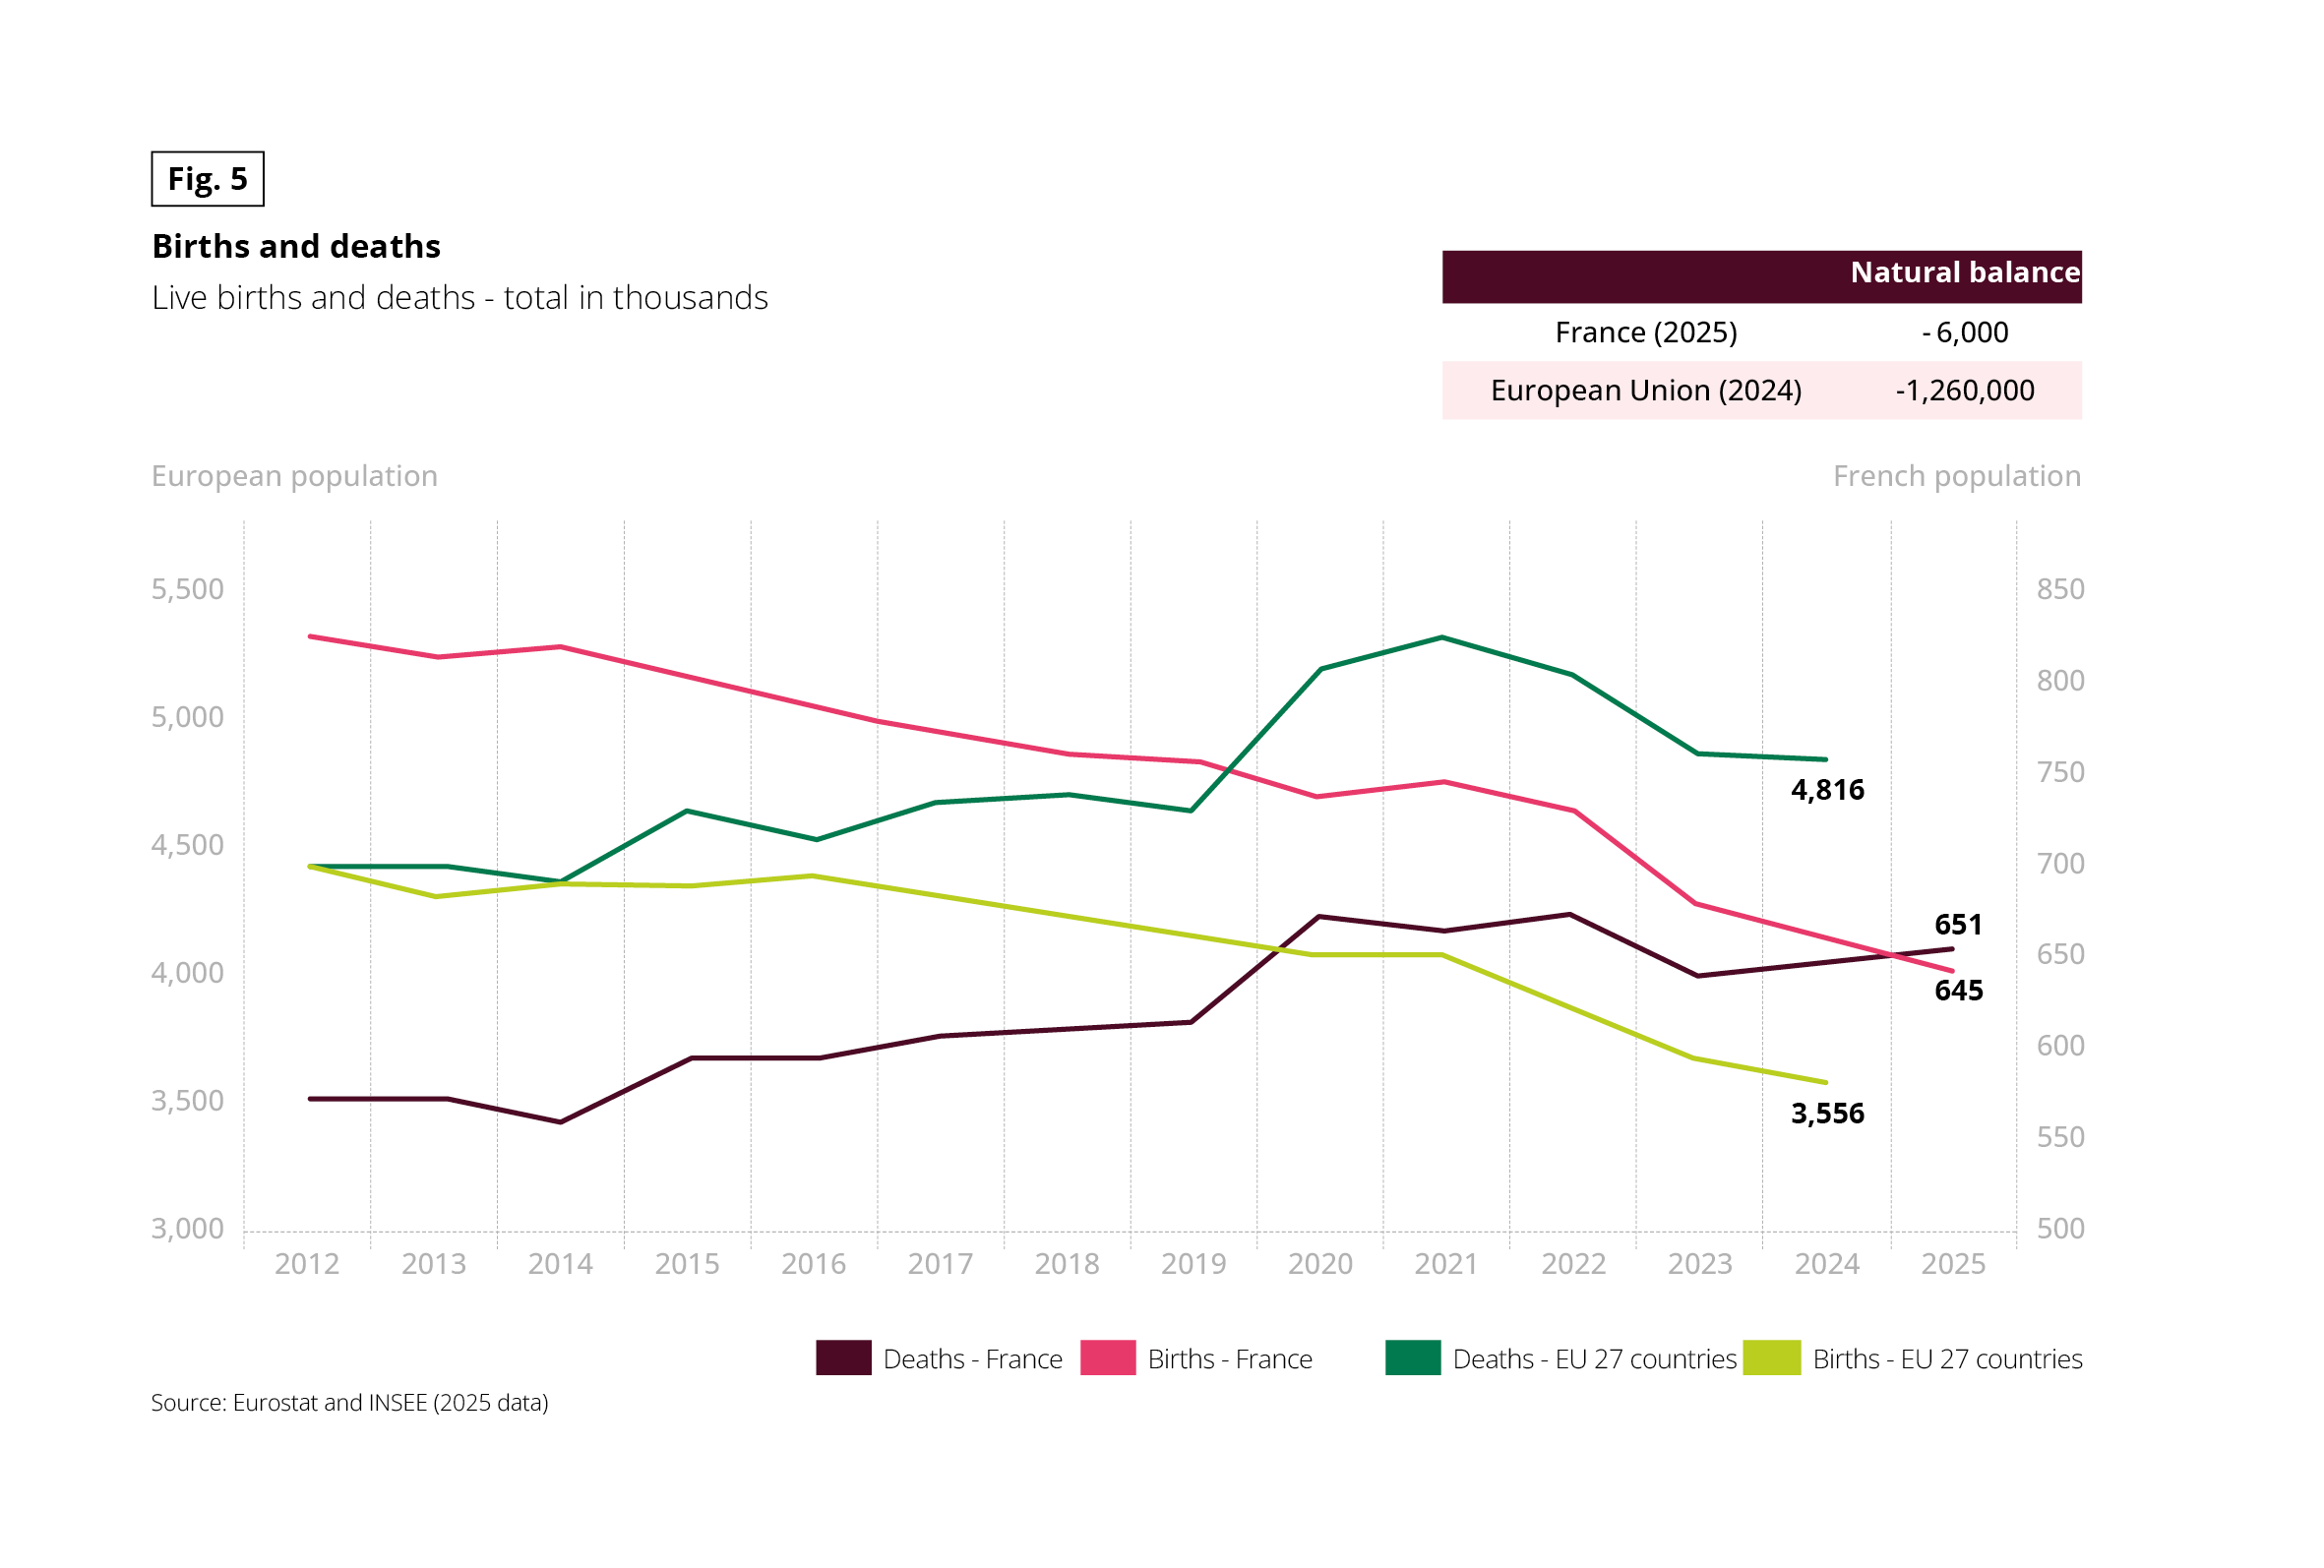 The graph shows the annual evolution of the number of live births and deaths, expressed in thousands, for France and the European Union with 27 countries.
Key Visual Elements Graph with two distinct vertical scales: European population on the left, French population on the right. The colors distinguish between births and deaths by geographic area.
Legend (visual reading elements)
Pink curve: births in France
Burgundy curve: deaths in France
Green curve: deaths in the EU 27
Yellow-green curve: births in the EU 27
The values are expressed in thousands
The natural balance corresponds to the difference between births and deaths
Data (final markers)
France (2025): 651,000 births, 645,000 deaths, natural balance -6,000
European Union (2024): natural balance -1,260,000
EU 27: around 4,816,000 deaths and around 3,556,000 births at the end of the period
Main Finding The decline in births combined with a high level of deaths leads to a negative natural balance in France and the European Union.
Source: Eurostat and Insee, 2025 data
The graph shows the annual evolution of the number of live births and deaths, expressed in thousands, for France and the European Union with 27 countries.
Key Visual Elements Graph with two distinct vertical scales: European population on the left, French population on the right. The colors distinguish between births and deaths by geographic area.
Legend (visual reading elements)
Pink curve: births in France
Burgundy curve: deaths in France
Green curve: deaths in the EU 27
Yellow-green curve: births in the EU 27
The values are expressed in thousands
The natural balance corresponds to the difference between births and deaths
Data (final markers)
France (2025): 651,000 births, 645,000 deaths, natural balance -6,000
European Union (2024): natural balance -1,260,000
EU 27: around 4,816,000 deaths and around 3,556,000 births at the end of the period
Main Finding The decline in births combined with a high level of deaths leads to a negative natural balance in France and the European Union.
Source: Eurostat and Insee, 2025 data
For over 10 years, the curves for births and deaths have been moving in opposite directions, increasingly confirming the fact that the European population is aging. Even in France, a country where the birth rate stayed resilient for a long time, the balance is now negative, with a spectacular fall in births.
AN ASSET WE ARE LUCKY TO COUNT ON
While seniors are taking on an increasingly significant numerical weight in society, this phenomenon is seen as a major asset. For 7 out of 10 Europeans surveyed, they represented an asset for a country.
The British, Germans and Spanish were the most ardent defenders of their positive influence, while in Eastern Europe, this view barely secured half the votes.
There is a certain gap between generations. Only 58% of under-30s saw seniors as an asset, compared with 71% of over-60s.
Fig 6 – Perception of seniors as a societal asset
Download this infographic for your presentations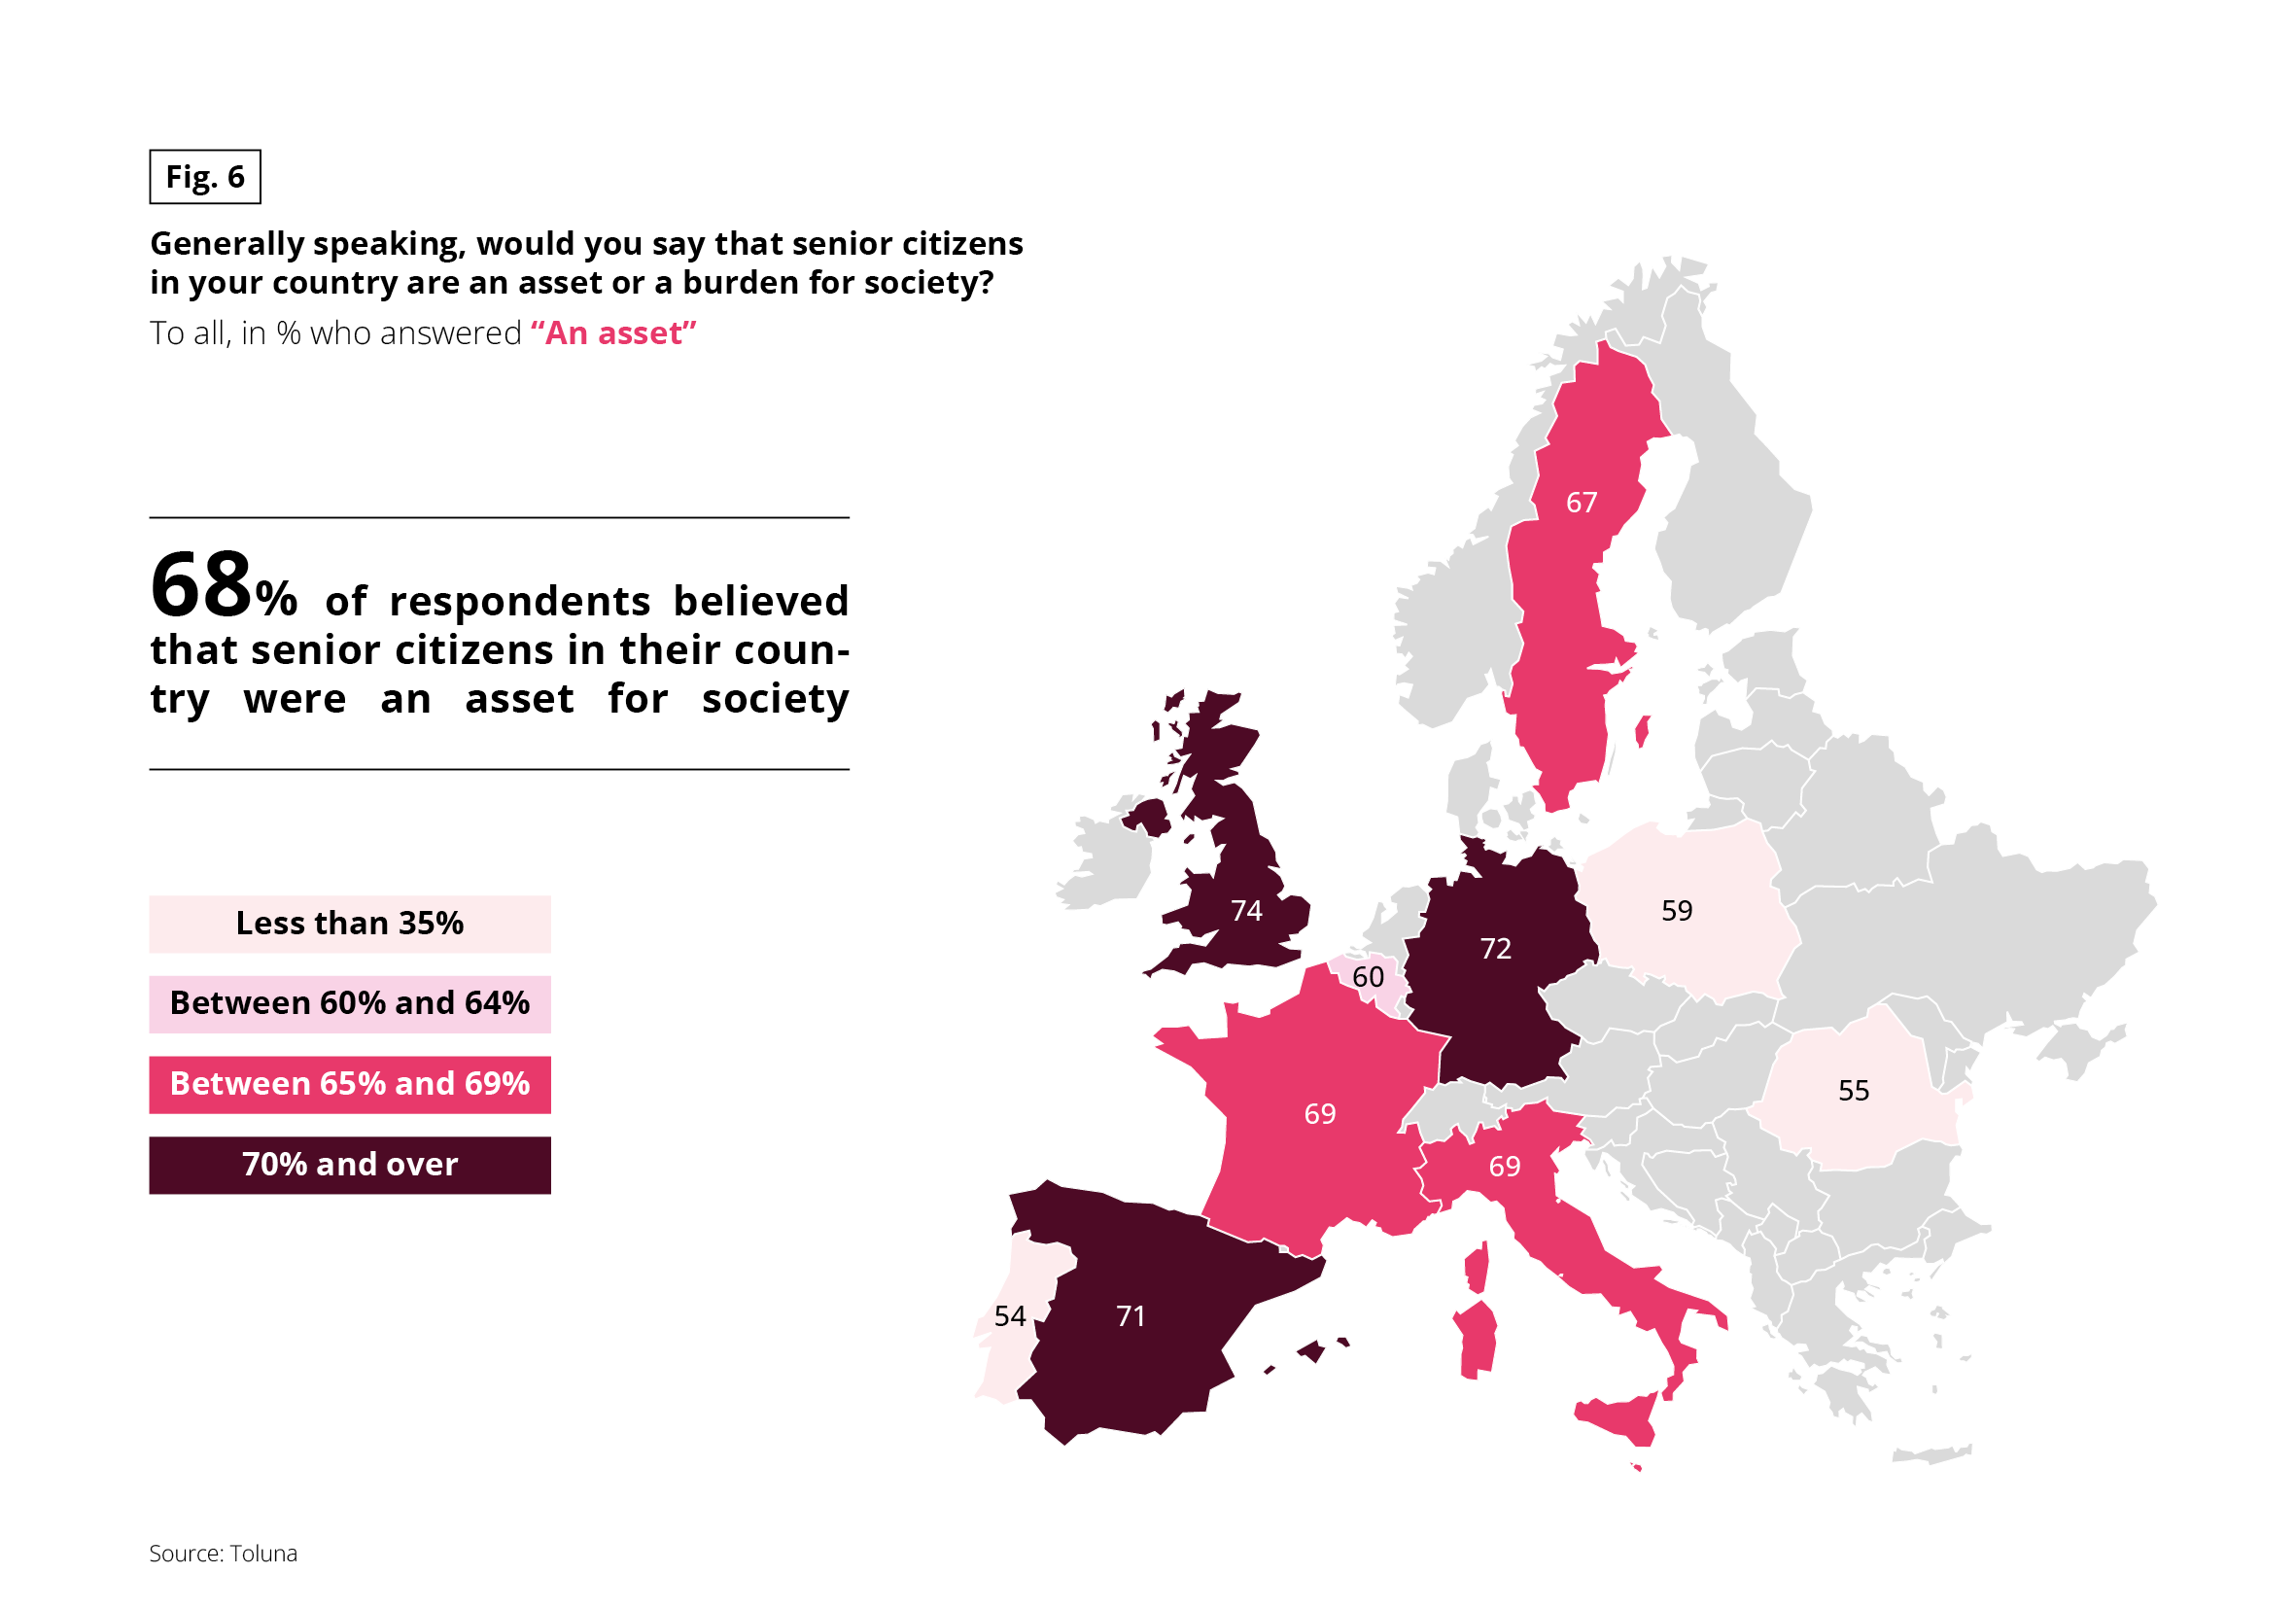 The visual presents, by country, the proportion of respondents considering that seniors are rather an opportunity for society.
Data
Global average: 68%
Germany: 72%
France: 69%
Spain: 71%
Italy: 69%
United Kingdom: 74%
Sweden: 67%
Poland: 59%
Portugal: 54%
Main Finding In the majority of the countries studied, a large part of the population perceives seniors as a positive contribution to society.
Source: Toluna
The visual presents, by country, the proportion of respondents considering that seniors are rather an opportunity for society.
Data
Global average: 68%
Germany: 72%
France: 69%
Spain: 71%
Italy: 69%
United Kingdom: 74%
Sweden: 67%
Poland: 59%
Portugal: 54%
Main Finding In the majority of the countries studied, a large part of the population perceives seniors as a positive contribution to society.
Source: Toluna
Insight
The European Commission has created a “demography toolbox” to define a global approach to demographic change. It is based on four pillars:
- Supporting parents by making it easier to reconcile family life and paid work, with guaranteed access to quality childcare services and a good work-life balance.
- Supporting younger generations, giving them the means to prosper and develop their skills, while facilitating their access to the labour market and affordable housing.
- Empowering older generations and safeguarding their prosperity through appropriate reforms and policies that focus on the labour market and the workplace.
- Addressing labour shortages, where necessary, through controlled legal migration, while also harnessing EU talent.
A MAJOR NATIONAL CHALLENGE
The good fortune of being able to rely on seniors is widely recognised by Europeans. The issue of ageing is even more so. 85% of Europeans expressly stated its importance, considering it to be important or even very important.
In Portugal, a clear majority (62%) considered it to be very important, with the same observed in Italy (48%), where this issue was also strongly emphasised.
These are two countries in the study where the median age of the population is highest.All generations agreed on the subject’s sensitive nature. 90% of over-60s considered the issue of ageing to be important or very important, compared with 78% of under-30s.
Fig 7 – Perception of aging as a major challenge
Download this infographic for your presentations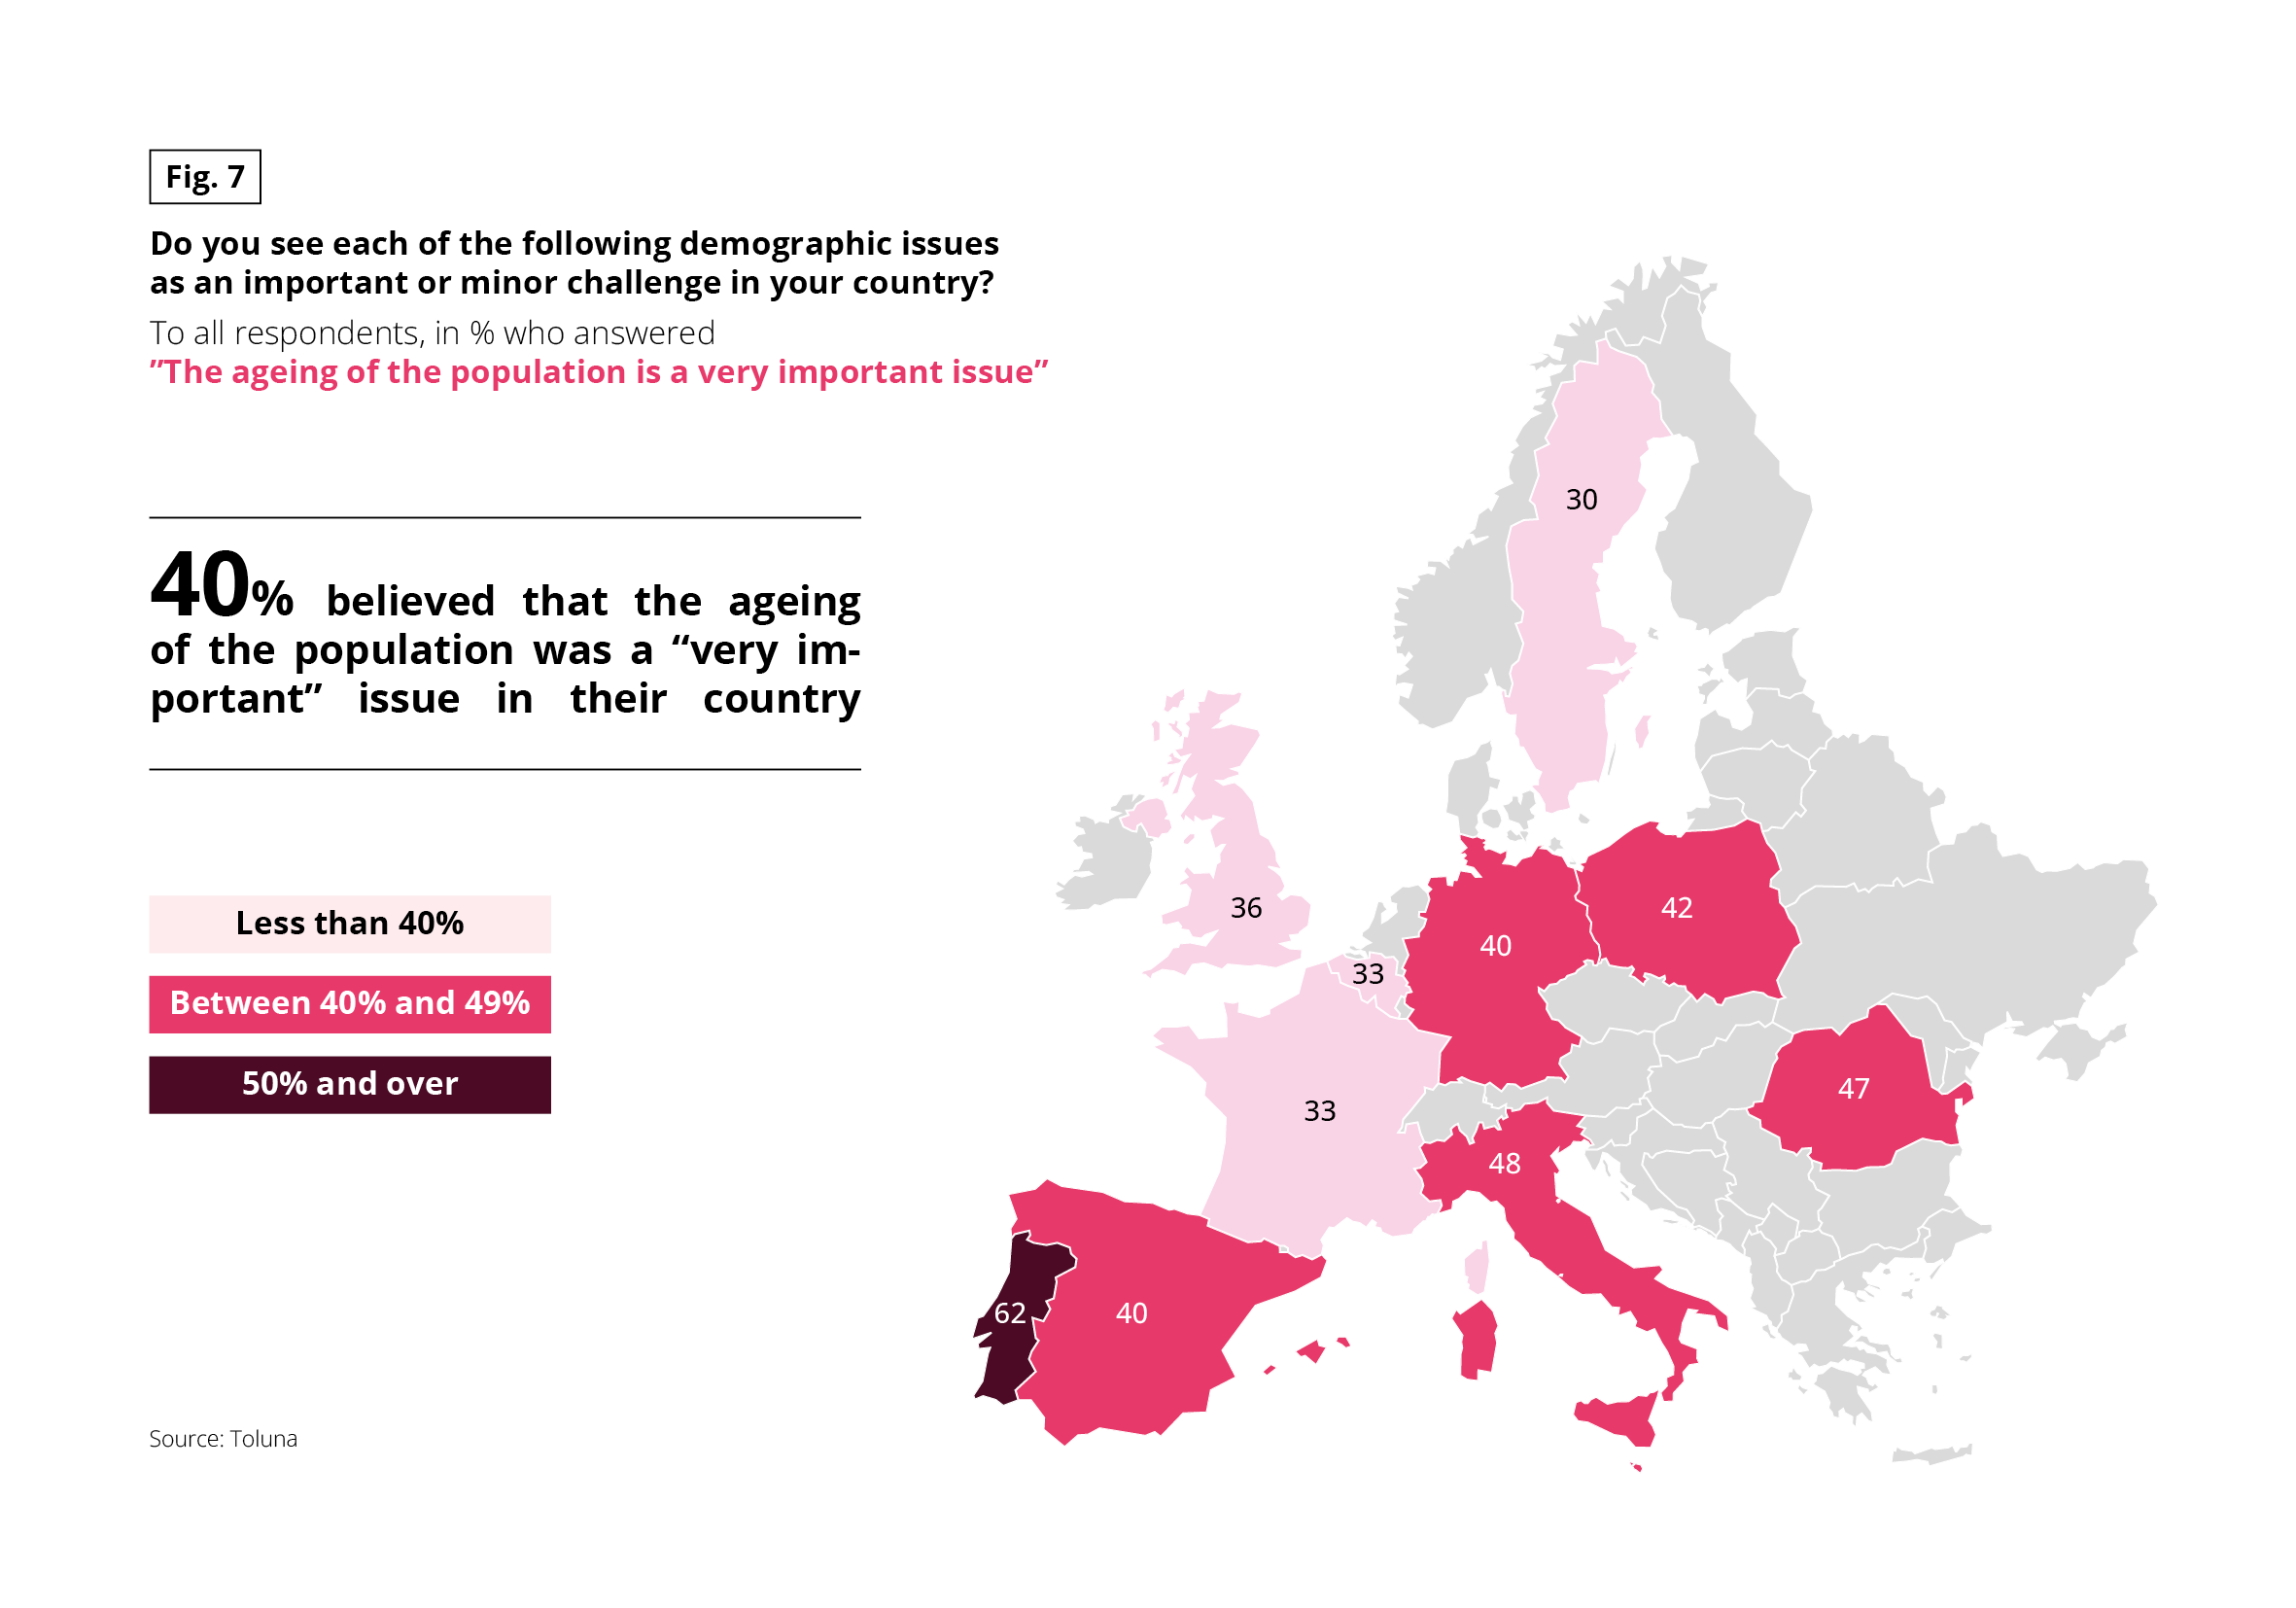 The visual shows the proportion of respondents considering that population aging is a very important issue in their country.
Data
Global average: 40%
Germany: 40%
France: 33%
Spain: 40%
Italy: 48%
Portugal: 62%
Poland: 42%
United Kingdom: 36%
Sweden: 30%
Main Finding The perception of aging as a major challenge varies significantly from country to country, with higher levels in Southern Europe.
Source: Toluna
The visual shows the proportion of respondents considering that population aging is a very important issue in their country.
Data
Global average: 40%
Germany: 40%
France: 33%
Spain: 40%
Italy: 48%
Portugal: 62%
Poland: 42%
United Kingdom: 36%
Sweden: 30%
Main Finding The perception of aging as a major challenge varies significantly from country to country, with higher levels in Southern Europe.
Source: Toluna
AGEING CAUSES CONCERN
The impact of ageing on a country’s future is becoming multifaceted. The most negative effects relate to the healthcare system (66%), which received the majority of votes in all
countries (see next section).
The Italians, Portuguese, Germans and Romanians were the most pessimistic, while the British and Swedes once again agreed, displaying more measured concerns.
There is also a clear generational divide. While 8 out of 10 senior citizens were concerned about the negative impact of ageing on the healthcare system, only 52% of the under-30s shared their concerns.
The issues of economic growth, the country’s competitiveness and employment come next in the ranking, with seniors once again more concerned than younger generations.
Fig 8 – Perception of the impacts of demographic aging
Download this infographic for your presentations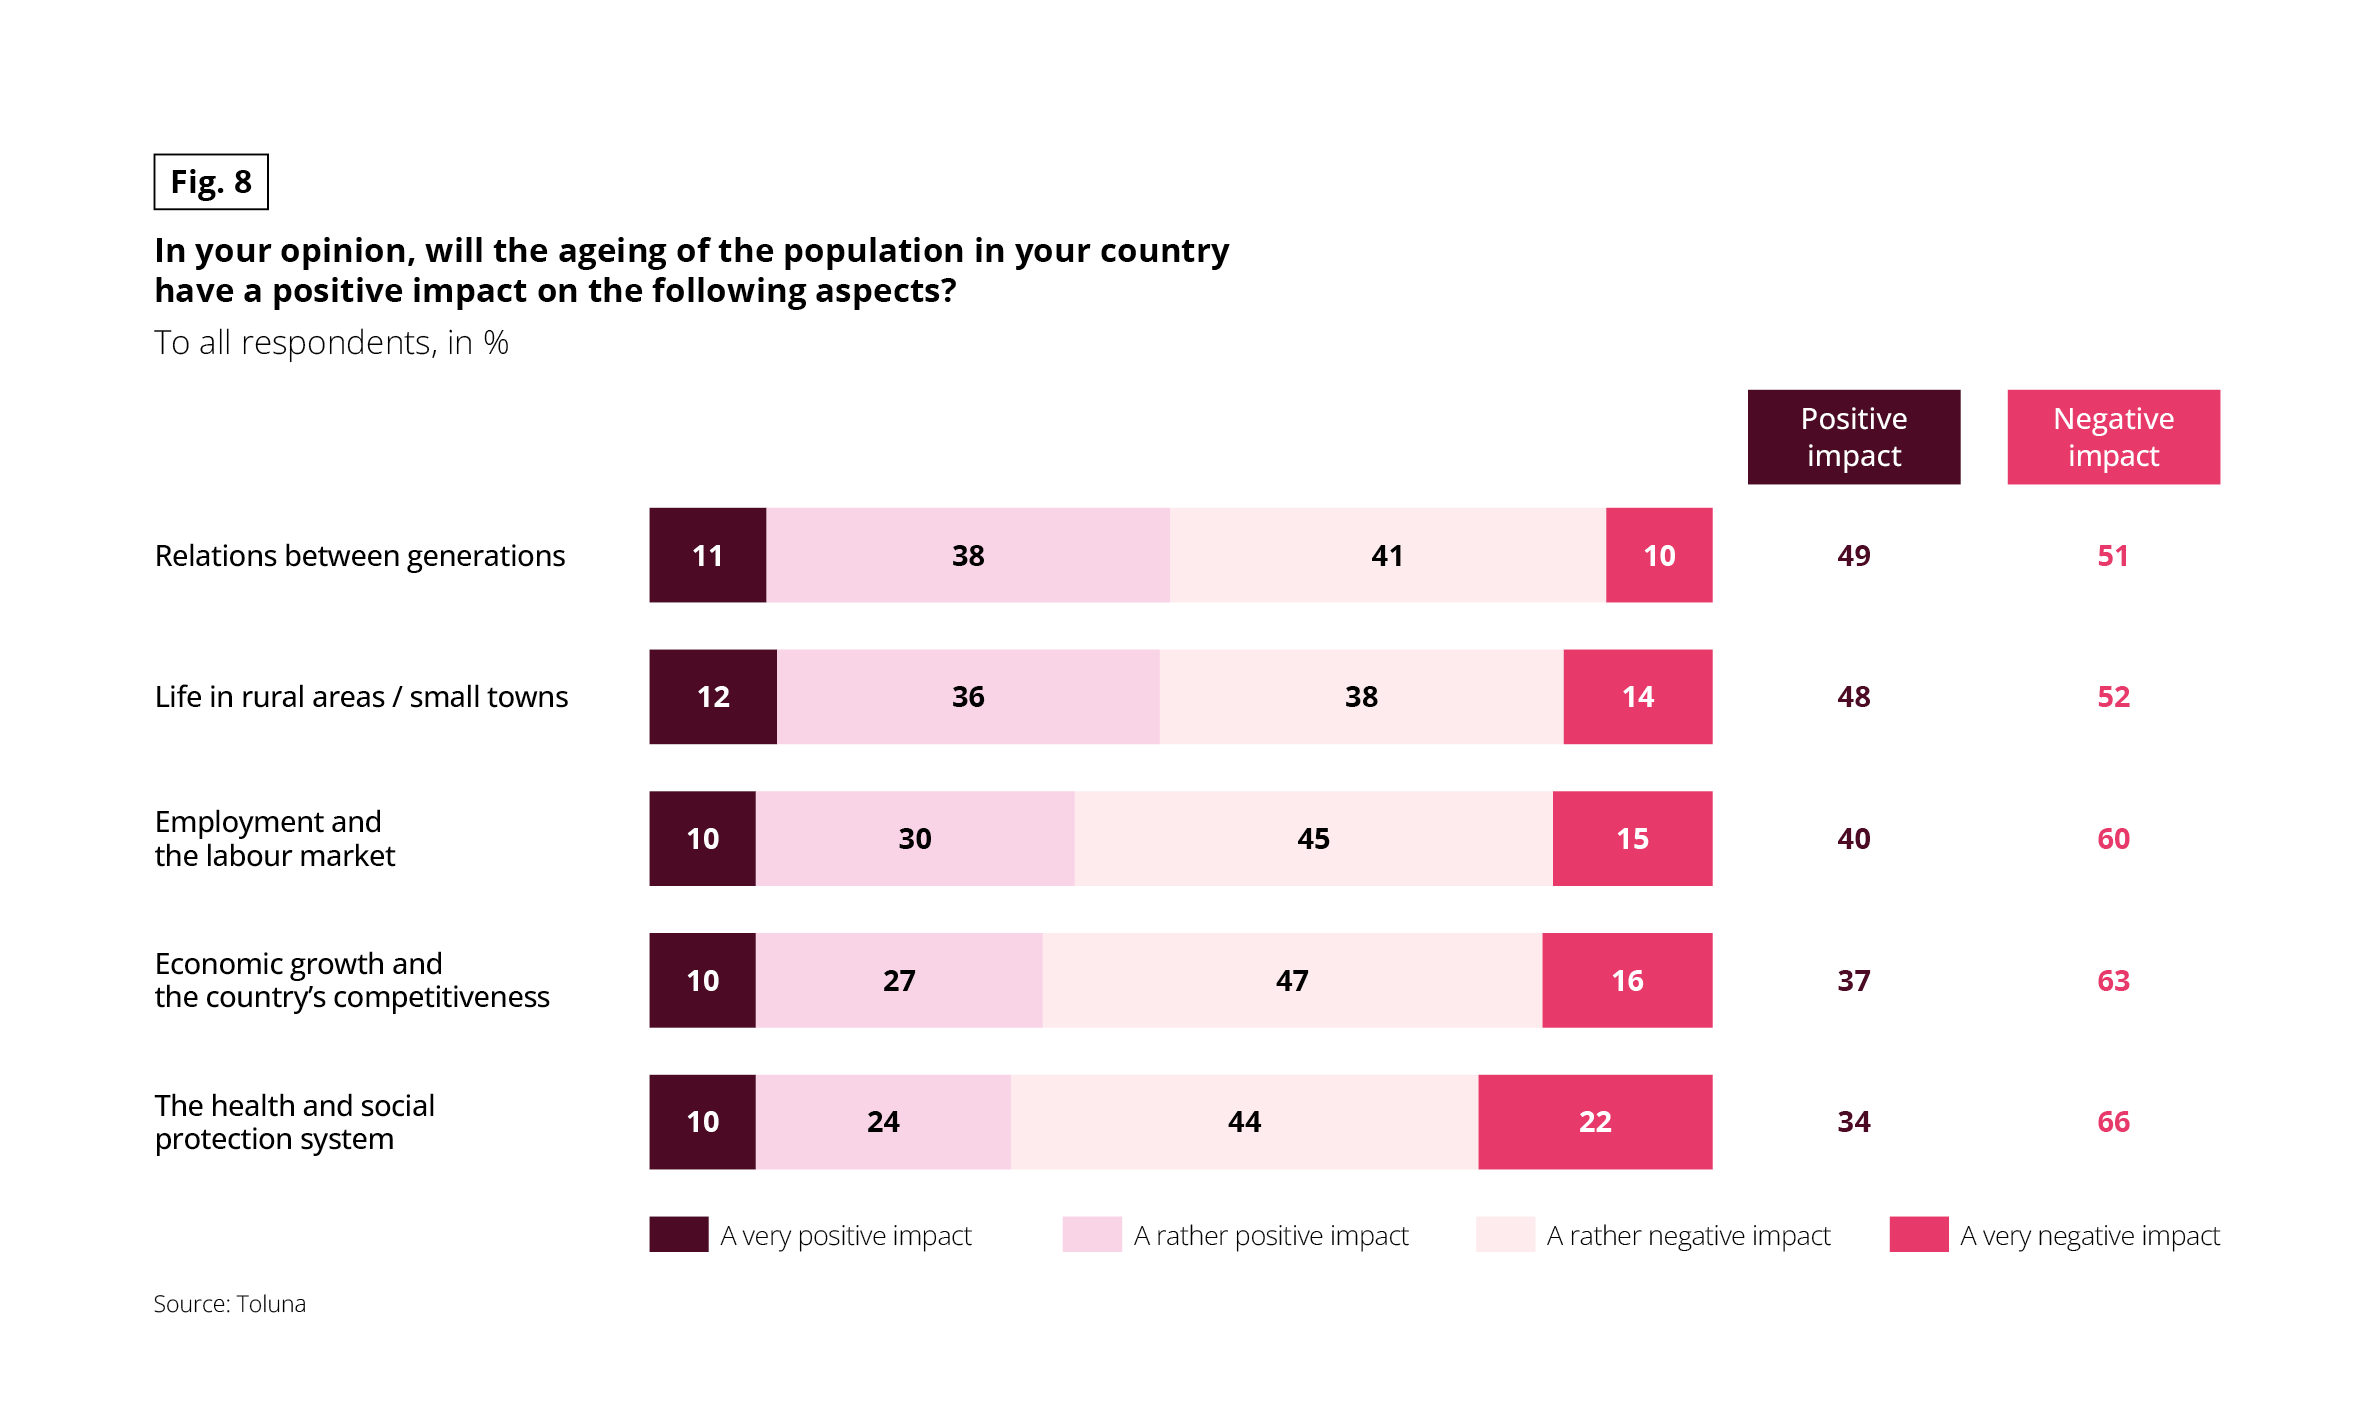 The graph presents the perception of the impact of population aging on different aspects of society, expressed as a percentage of responses.
Burgundy color: very positive impact
Light pink: rather positive impact
Very pale pink: rather negative impact
Dark pink: very negative impact
The “positive impact” corresponds to the sum of very and rather positive responses
The “negative impact” corresponds to the sum of rather and very negative responses
Data
Intergenerational relationships: 49% positive impact, 51% negative impact
Life in rural or small towns: 48% positive, 52% negative
Employment and labor market: 40% positive, 60% negative
Economic growth and competitiveness: 37% positive, 63% negative
Healthcare and social protection system: 34% positive, 66% negative
Main Finding Respondents perceive mostly negative impacts of aging on the economy, employment, and healthcare system, while intergenerational relationships appear more balanced.
Source: Toluna
The graph presents the perception of the impact of population aging on different aspects of society, expressed as a percentage of responses.
Burgundy color: very positive impact
Light pink: rather positive impact
Very pale pink: rather negative impact
Dark pink: very negative impact
The “positive impact” corresponds to the sum of very and rather positive responses
The “negative impact” corresponds to the sum of rather and very negative responses
Data
Intergenerational relationships: 49% positive impact, 51% negative impact
Life in rural or small towns: 48% positive, 52% negative
Employment and labor market: 40% positive, 60% negative
Economic growth and competitiveness: 37% positive, 63% negative
Healthcare and social protection system: 34% positive, 66% negative
Main Finding Respondents perceive mostly negative impacts of aging on the economy, employment, and healthcare system, while intergenerational relationships appear more balanced.
Source: Toluna
Fig 9 – Median age of the population by country
Download this infographic for your presentations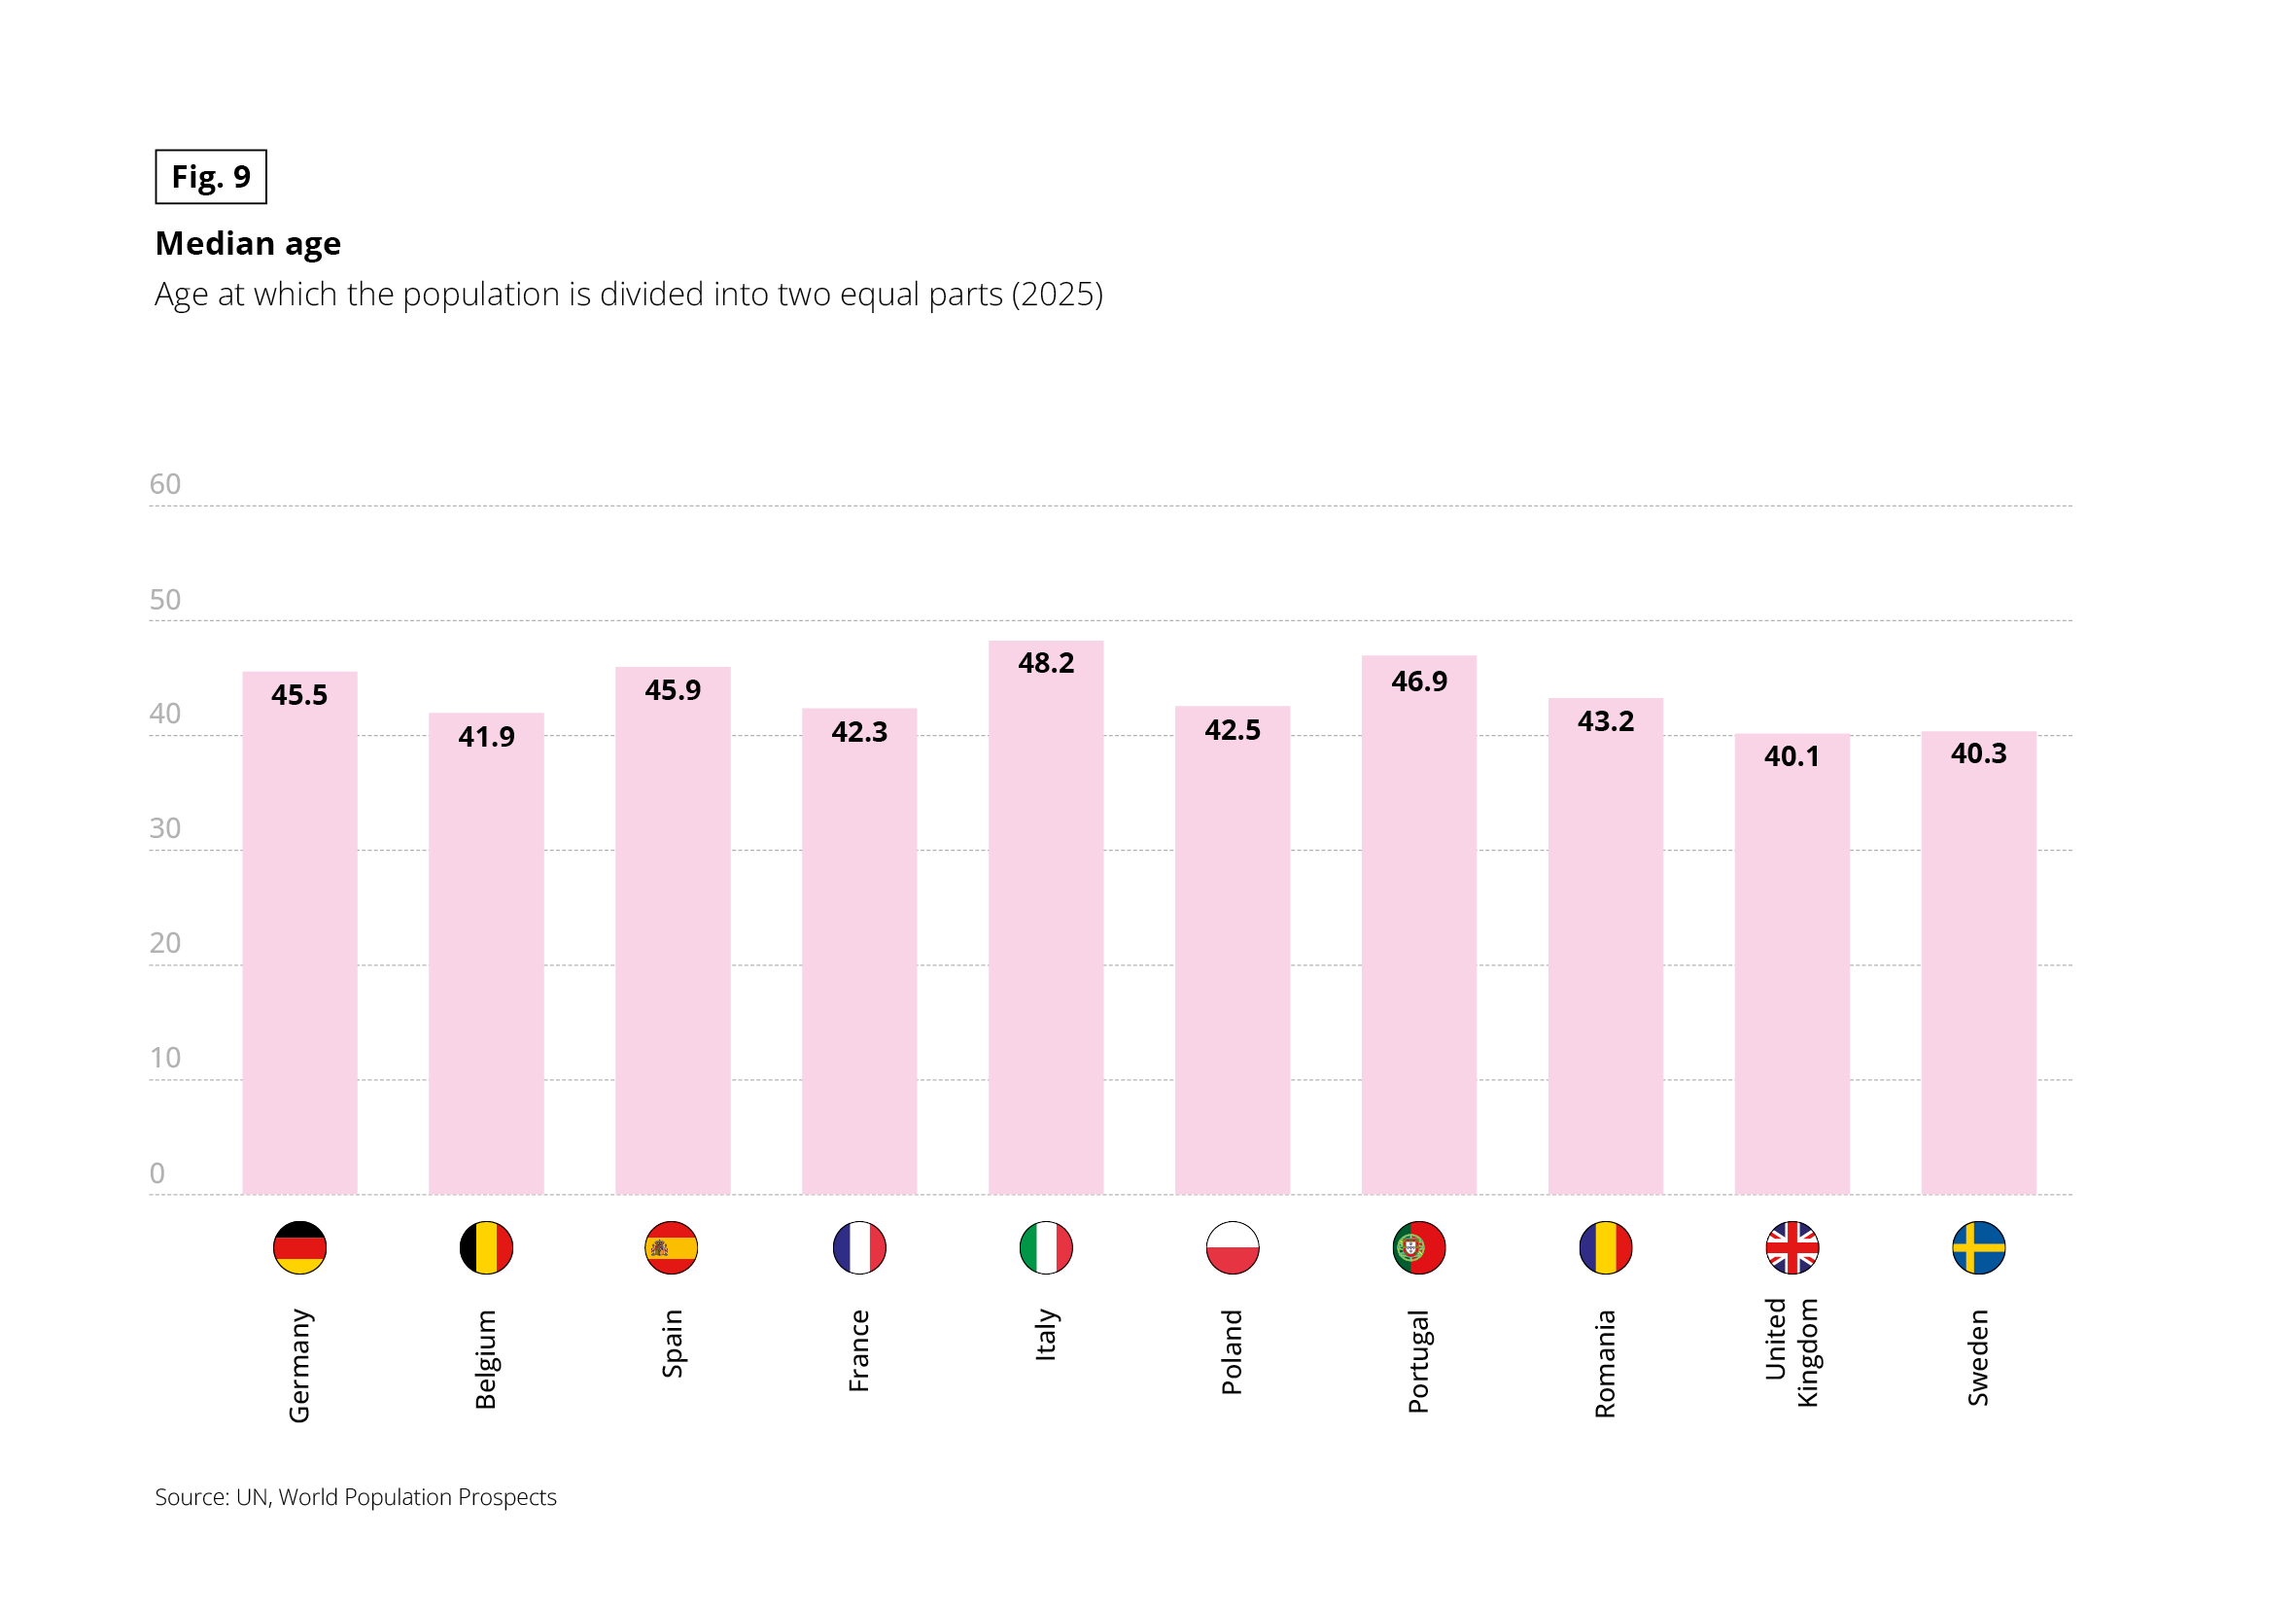 The graph indicates the median age, defined as the age at which the population is divided into two equal parts.
Data
Germany: 45.5 years
Belgium: 41.9 years
Spain: 45.9 years
France: 42.3 years
Italy: 48.2 years
Poland: 42.5 years
Portugal: 46.9 years
Romania: 43.2 years
United Kingdom: 40.1 years
Sweden: 40.3 years
Main Finding Italy and Portugal have the highest median ages, while the United Kingdom and Sweden are among the youngest populations in the panel.
Source: UN, World Population Prospects
The graph indicates the median age, defined as the age at which the population is divided into two equal parts.
Data
Germany: 45.5 years
Belgium: 41.9 years
Spain: 45.9 years
France: 42.3 years
Italy: 48.2 years
Poland: 42.5 years
Portugal: 46.9 years
Romania: 43.2 years
United Kingdom: 40.1 years
Sweden: 40.3 years
Main Finding Italy and Portugal have the highest median ages, while the United Kingdom and Sweden are among the youngest populations in the panel.
Source: UN, World Population Prospects