
The European label: widely recognised and favoured


 3 min
reading time
3 min
reading time
EUROPEAN BRANDS LEAD THE PACK…
In this cross-border overview, the Observatoire Cetelem sought to determine whether any of the main global manufacturing hubs held a clear advantage in consumer preference. The first striking takeaway is that “don’t knows” form the single largest block. Nearly 1 in 4 respondents is entirely indifferent to where their vehicle originates. The second finding is that European and Japanese origins run neck and neck in consumer purchase intent. By contrast, the very low score recorded by South Korean brands fails to reflect the generally positive sentiment expressed towards them elsewhere. Once again, domestic preference is championed far more aggressively in Japan than anywhere else (83%), as well as among younger demographics when viewed through a generational lens.
Fig. 24 – Brand nationality preference when purchasing a car (% of respondents)
Download this infographic for your presentations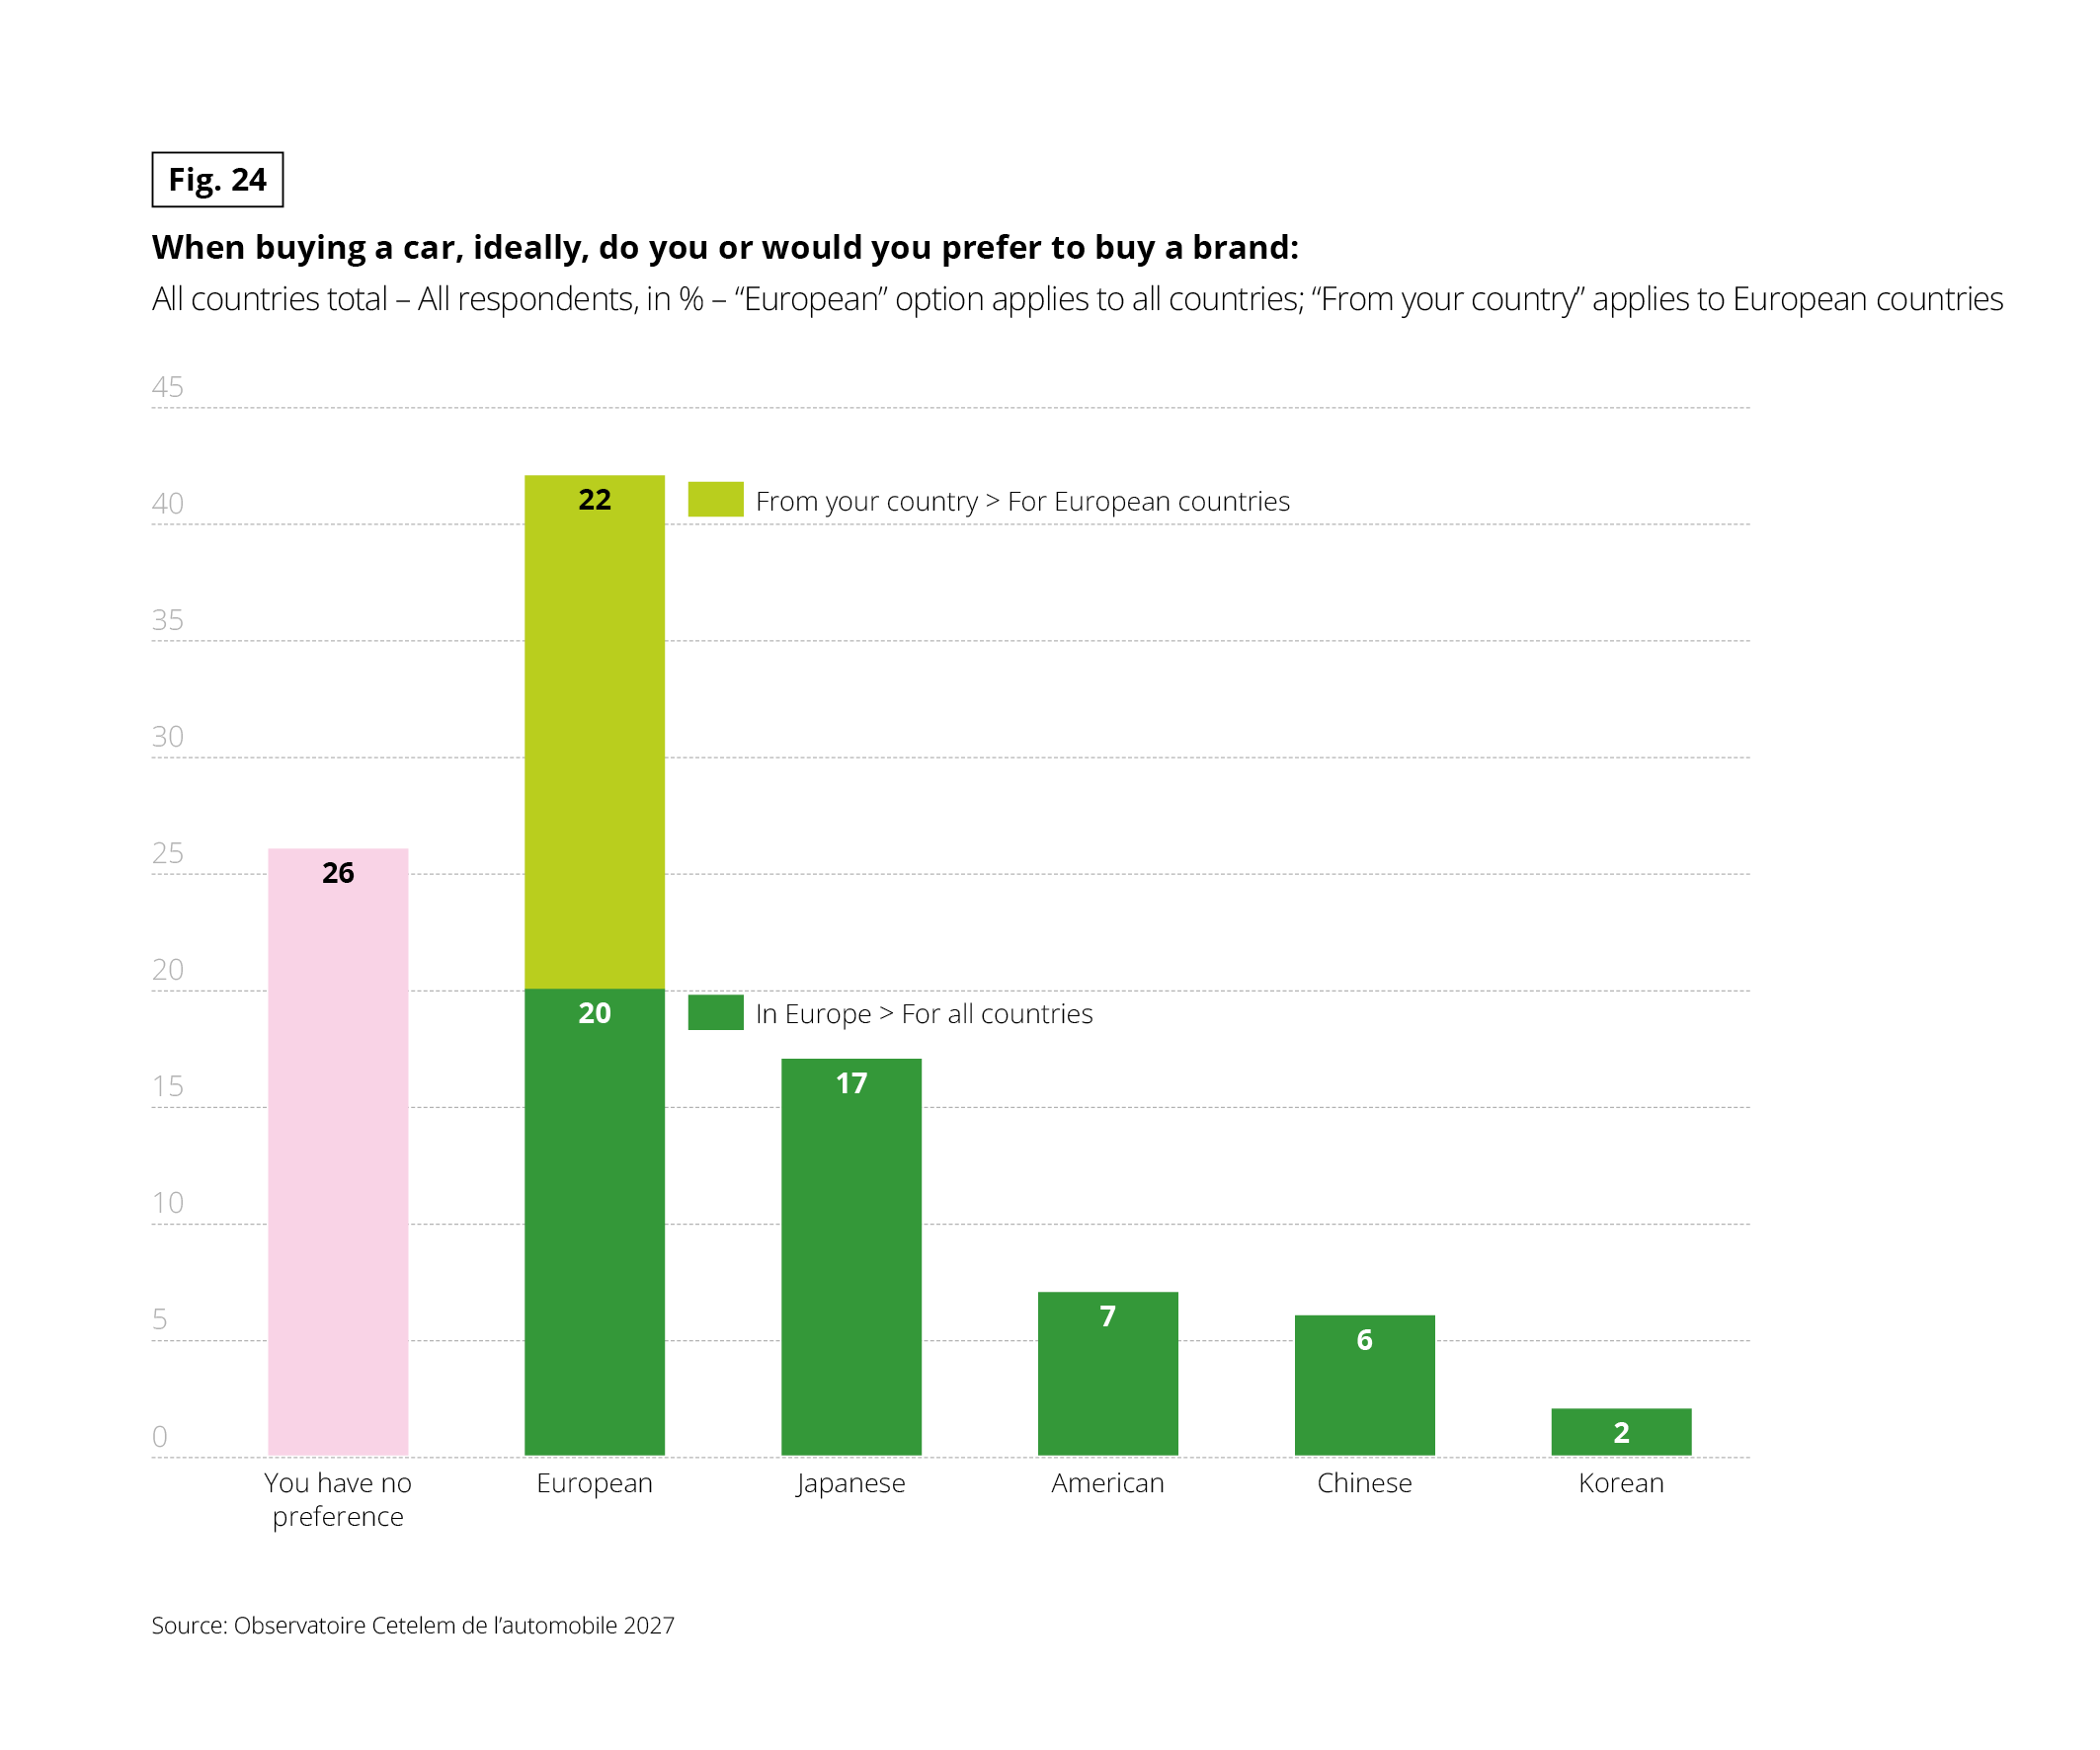 Vertical bar chart. Question: “When buying a car, ideally, do you or would you prefer to buy a brand:” Base: all countries total, all respondents, in %. The “European” option applies to all countries. The “From your country” option applies to European countries only. Source: Observatoire Cetelem de l’automobile 2027.
Results:
• No preference: 26%
• European: 42% in total, made up of 20% who prefer a brand from Europe (answer given in all countries) and 22% who prefer a brand from their own country (answer given in European countries)
• Japanese: 17%
• American: 7%
• Chinese: 6%
• Korean: 2%
European brands are the most preferred. One respondent in four has no preference.
Vertical bar chart. Question: “When buying a car, ideally, do you or would you prefer to buy a brand:” Base: all countries total, all respondents, in %. The “European” option applies to all countries. The “From your country” option applies to European countries only. Source: Observatoire Cetelem de l’automobile 2027.
Results:
• No preference: 26%
• European: 42% in total, made up of 20% who prefer a brand from Europe (answer given in all countries) and 22% who prefer a brand from their own country (answer given in European countries)
• Japanese: 17%
• American: 7%
• Chinese: 6%
• Korean: 2%
European brands are the most preferred. One respondent in four has no preference.
… AND A HEAD START ACROSS MULTIPLE CRITERIA
When examining what drives these opinions, strong brand image emerges as the primary factor across most regions. On this score, Chinese brands are held in slightly lower esteem than their competitors, likely due to limited consumer familiarity, lingering hesitation and perhaps concerns regarding their impact on traditional automotive markets. In the case of European brands, this stellar image is matched by equally persuasive aesthetic and emotional appeal, as if their long-standing heritage has left an indelible, positive mark on drivers’ minds. Consequently, European brands capture the highest marks for prestige, quality, design, performance and reliability. They are outstripped only by Japanese brands for innovation and value for money, and by Chinese brands for electric vehicles (see Part 4).
Fig. 25 – Opinion of European, Japanese, American, Korean and Chinese car brands (% of positive opinion)
Download this infographic for your presentations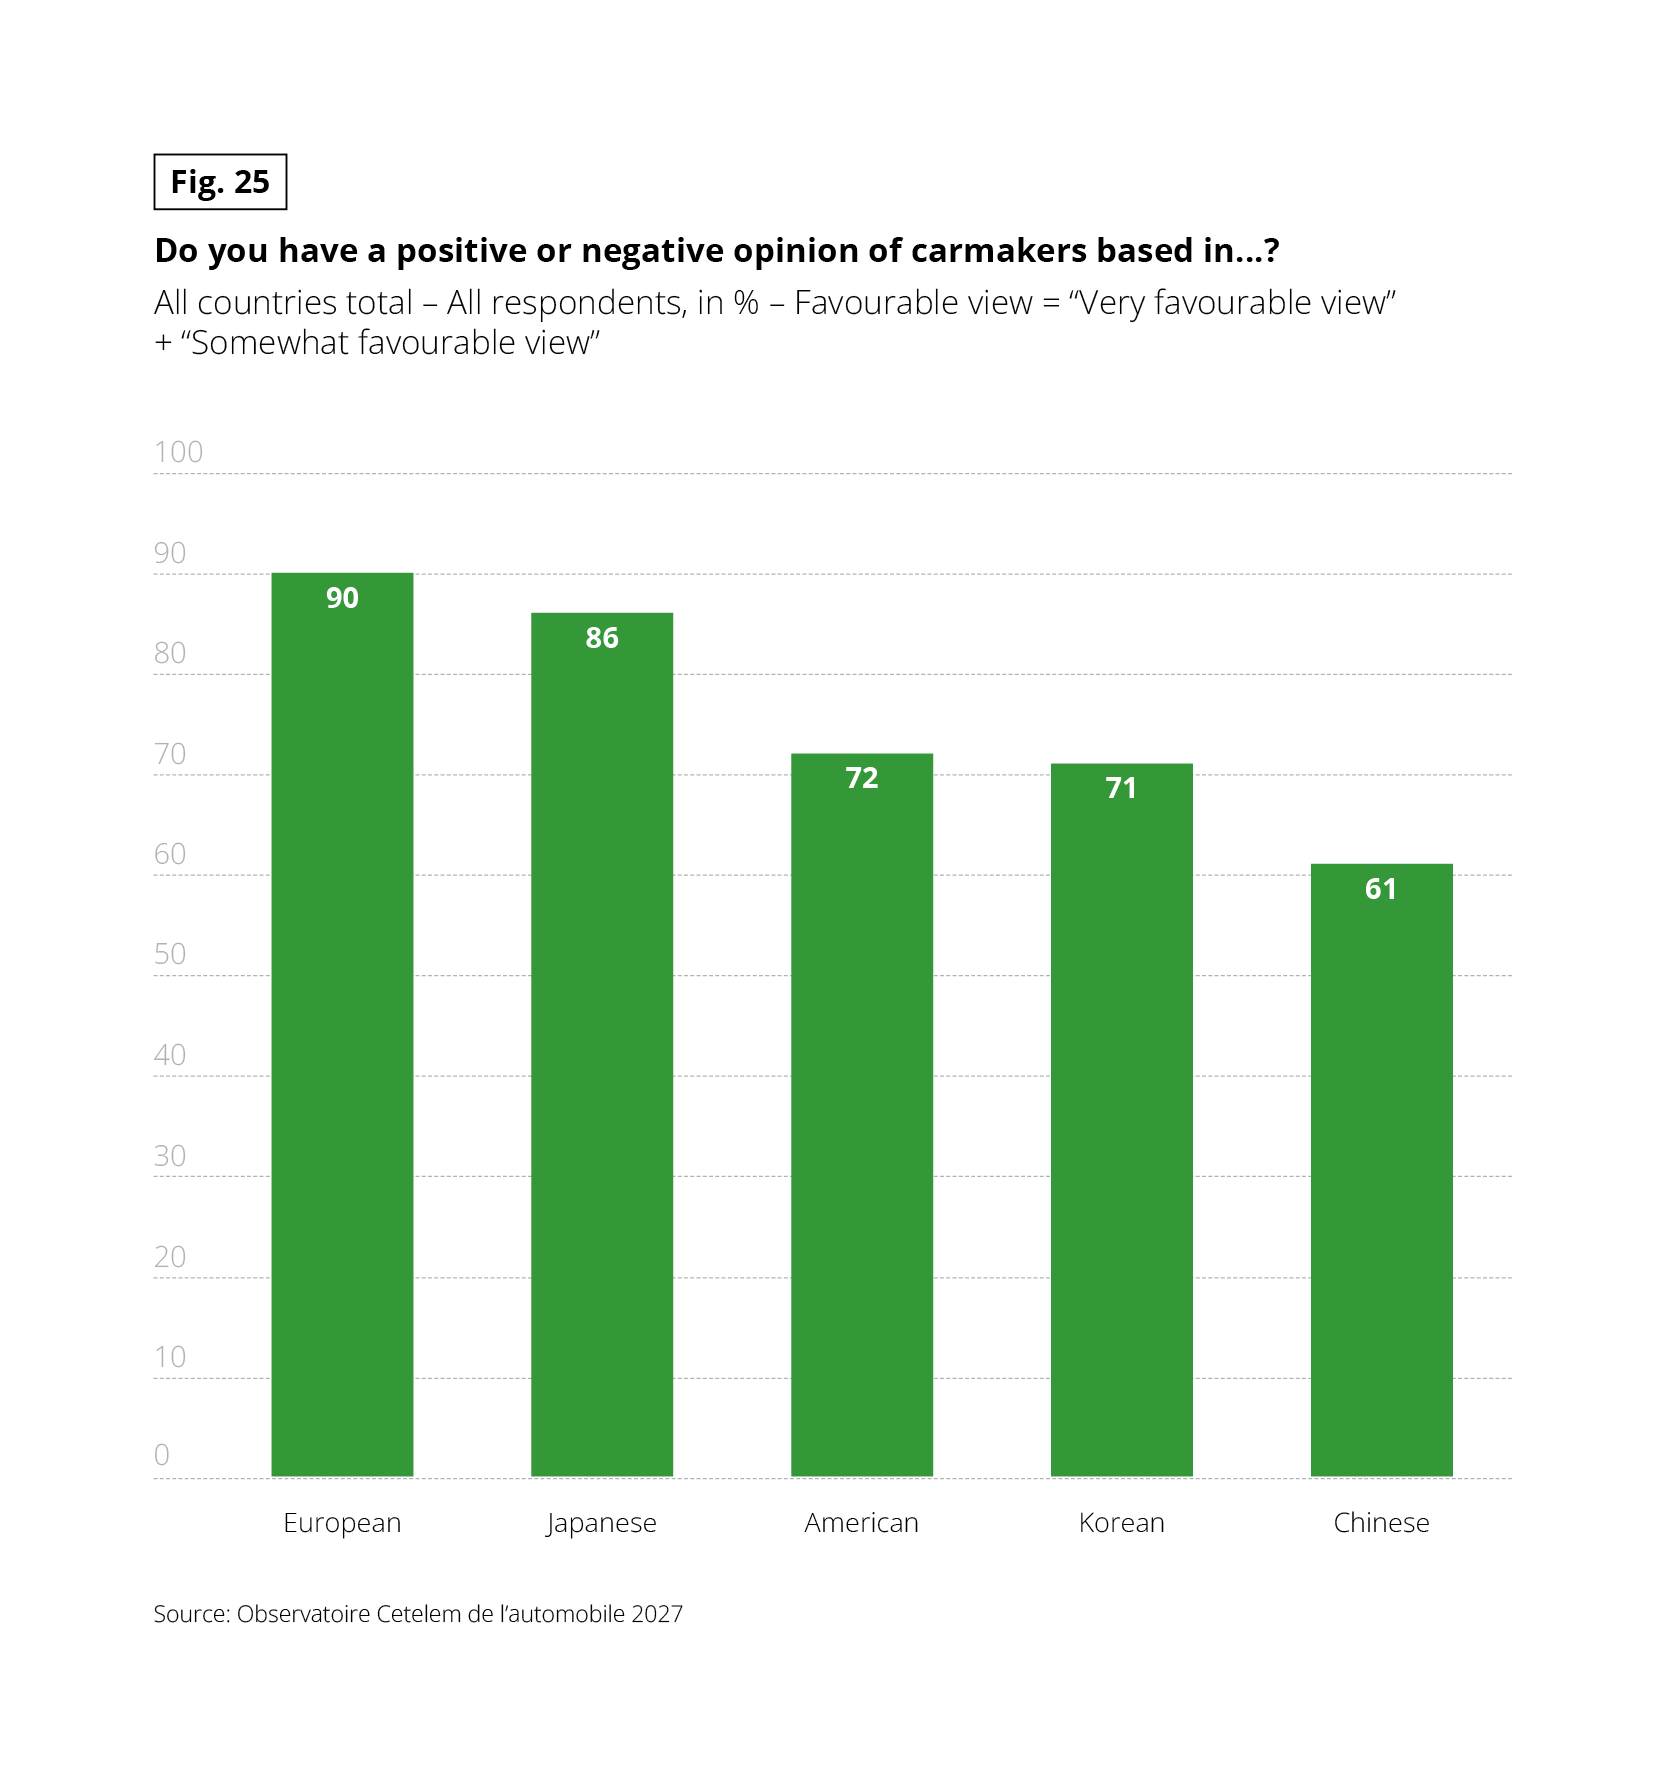 Vertical bar chart. Question: “Do you have a positive or negative opinion of carmakers based in…?” Base: all countries total, all respondents, in %. “Favourable view” groups “Very favourable view” and “Somewhat favourable view”. Source: Observatoire Cetelem de l’automobile 2027.
Results, from highest to lowest: European carmakers 90%, Japanese 86%, American 72%, Korean 71%, Chinese 61%. European carmakers are viewed most favourably and Chinese carmakers least favourably, a 29-point gap. No region falls below 60%.
Vertical bar chart. Question: “Do you have a positive or negative opinion of carmakers based in…?” Base: all countries total, all respondents, in %. “Favourable view” groups “Very favourable view” and “Somewhat favourable view”. Source: Observatoire Cetelem de l’automobile 2027.
Results, from highest to lowest: European carmakers 90%, Japanese 86%, American 72%, Korean 71%, Chinese 61%. European carmakers are viewed most favourably and Chinese carmakers least favourably, a 29-point gap. No region falls below 60%.
LASTING PREFERENCE FOR UNFAMILIAR EUROPEAN BRANDS
When it comes to European brands, origin acts as a driver of trust to a far greater extent than in any other region. Even on unfamiliar ground, motorists show a greater willingness to place their trust in them. In fact, 6 in 10 would consider doing so, compared with just 5 in 10 who would be willing to try an unfamiliar Asian or American model. Chinese consumers demonstrate their inquisitive mindset by showing a readiness to buy an unfamiliar brand regard- less of its country or region of origin. By contrast, Japanese consumers remain resolutely insular. A sharp generational divide splits opinion: younger drivers score well above the global average in their willingness to venture into the unknown, in stark contrast to their older counterparts.
Fig. 26 – Opening to the purchase of a recent or little-known car brand, according to its area of origin (% of “yes”)
Download this infographic for your presentations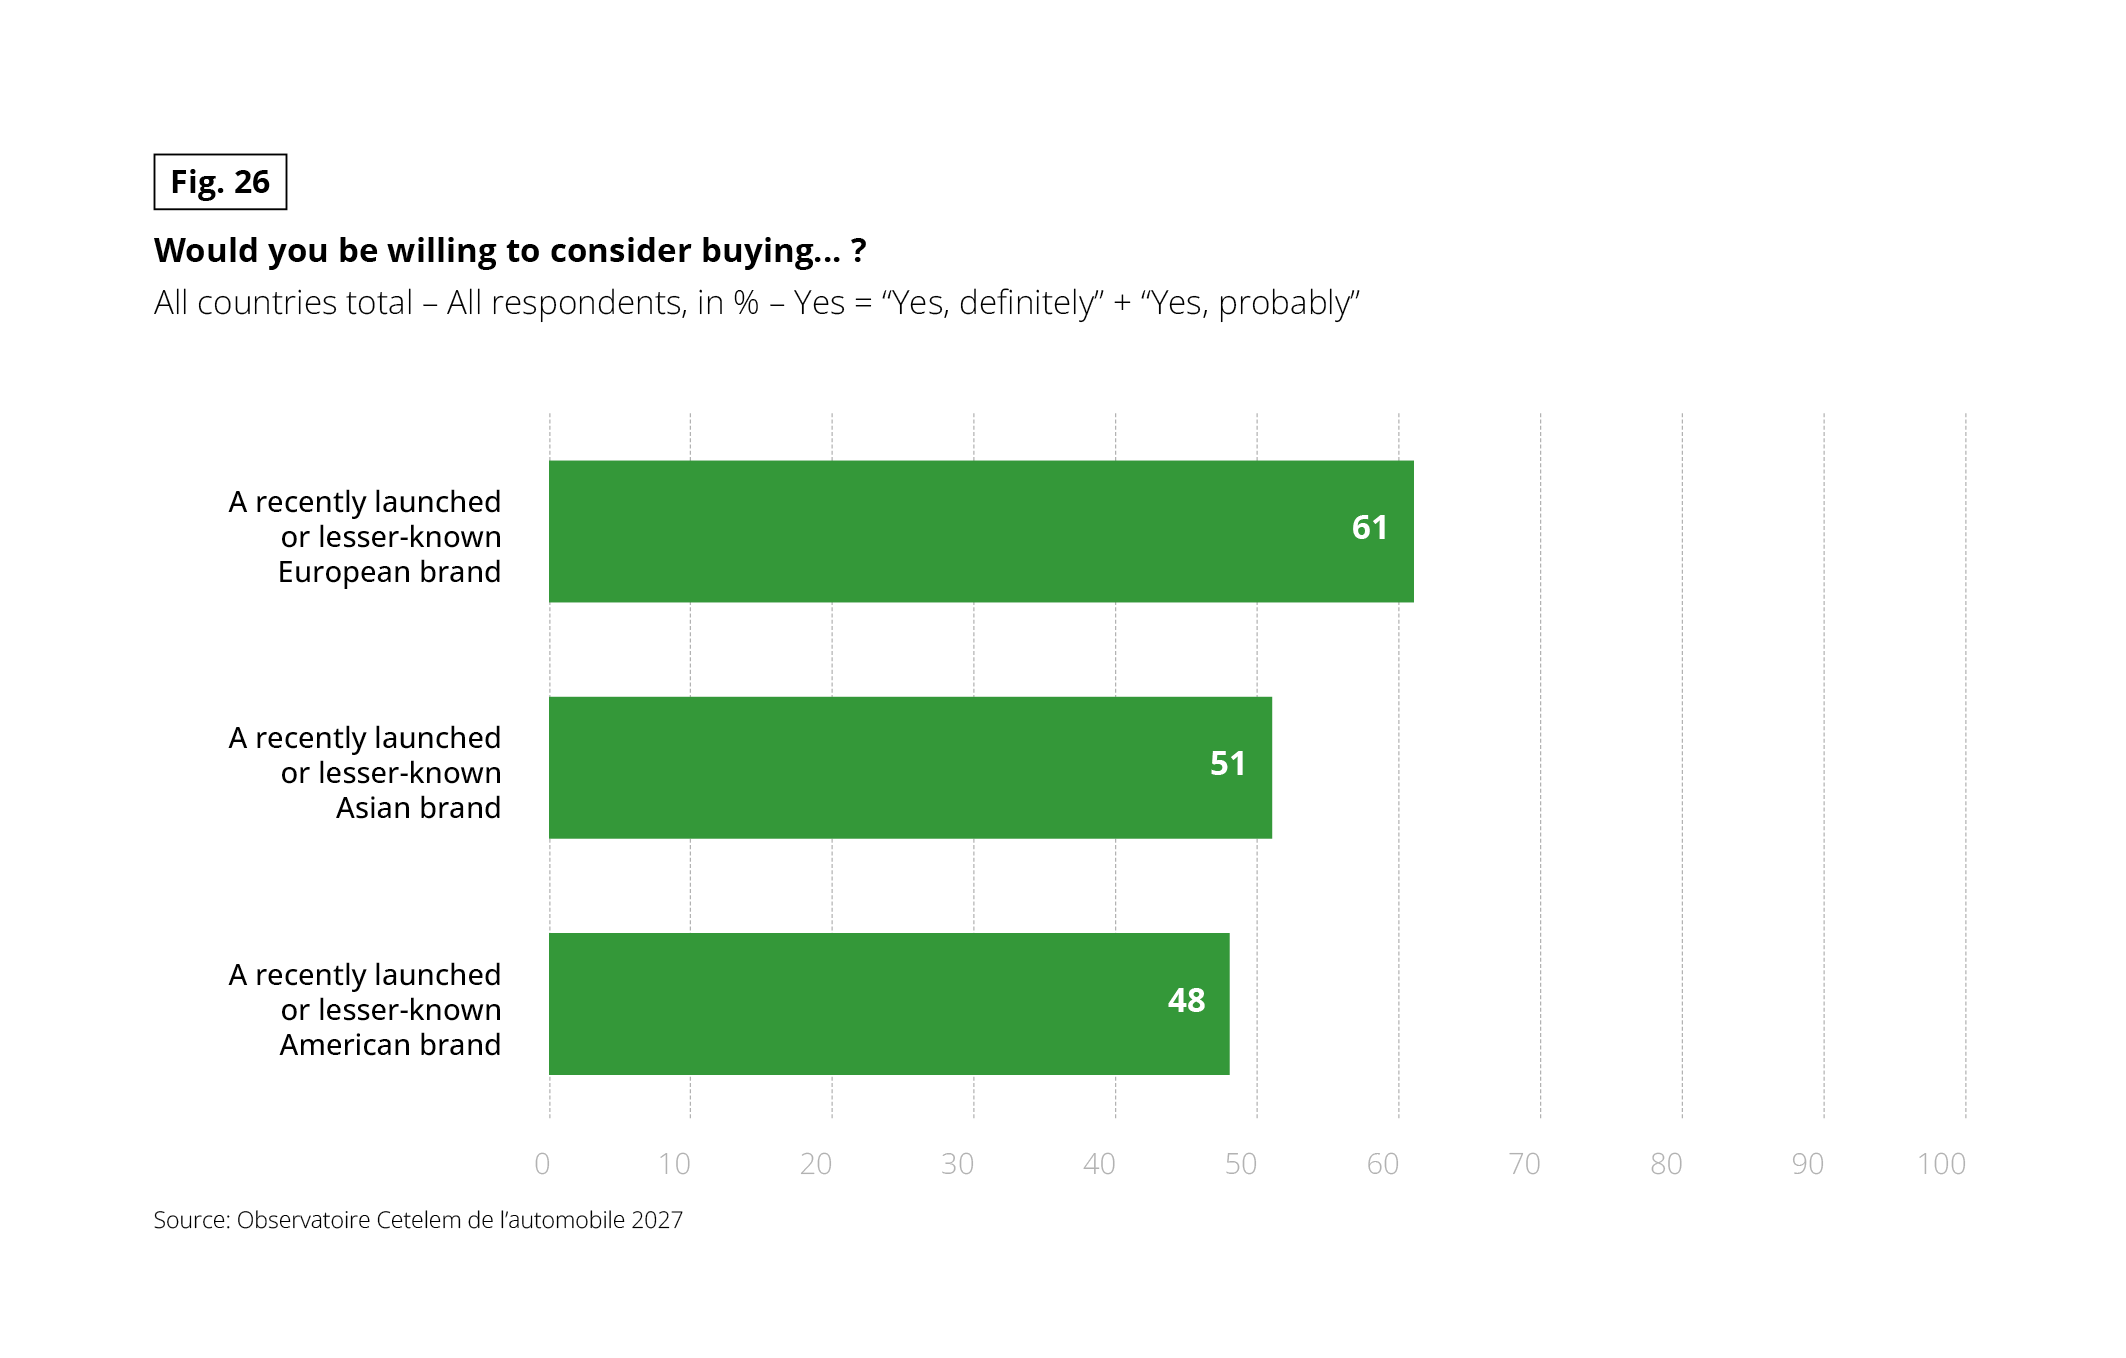 Horizontal bar chart. Question: “Would you be willing to consider buying…?” Base: all countries total, all respondents, in %. “Yes” groups “Yes, definitely” and “Yes, probably”. Source: Observatoire Cetelem de l’automobile 2027.
Results:
• A recently launched or lesser-known European brand: 61%
• A recently launched or lesser-known Asian brand: 51%
• A recently launched or lesser-known American brand: 48%
Respondents are most open to new or lesser-known European brands, and about half would consider an Asian or American one.
Horizontal bar chart. Question: “Would you be willing to consider buying…?” Base: all countries total, all respondents, in %. “Yes” groups “Yes, definitely” and “Yes, probably”. Source: Observatoire Cetelem de l’automobile 2027.
Results:
• A recently launched or lesser-known European brand: 61%
• A recently launched or lesser-known Asian brand: 51%
• A recently launched or lesser-known American brand: 48%
Respondents are most open to new or lesser-known European brands, and about half would consider an Asian or American one.
KEY FIGURES
- Only 15% of drivers believe a brand is defined by the nationality of its parent company
- 1 in 5 respondents on average would prefer to buy a domestic brand, rising to 1 in 2 French drivers
- Only 3 in 10 drivers have decided against buying a foreign brand they liked in order to choose a local vehicle instead
- 9 in 10 young drivers would accept a price premium to buy a car from their own country or region
- 1 in 5 drivers chooses a domestic car simply because they like it: the top reason cited
- Only 1 in 4 respondents is indifferent to the region where their car originates
- 6 in 10 drivers would consider buying a lesser-known or unfamiliar European brand