
Stalled markets, price-driven housing choices


 4 min
reading time
Caught between tight budgets and homes that, while secure, are increasingly exposed to climate risks, how are Europeans planning for the future?
On the supply side, the housing market has ground to a halt. Rising interest rates have dragged down new construction, particularly in France, Germany, Belgium and Italy. Only Spain, Poland and especially Portugal, where output nearly tripled between 2012 and 2025, have sustained growth in housebuilding.
Even so, this growth starts from depressed baselines inherited from the post-2012 slump. On the demand side, Eurostat data shows that intentions to make major purchases remain negative almost everywhere. This indicator hits its lowest point in Germany, whereas Poland stands alone as clearly positive.(1)
These trade-offs play out against a backdrop of widespread caution. Intersecting housing output with price movements reveals the underlying nature of demand. Where construction is slowing (France, Germany, Belgium, Italy), flat or rising prices simply signal supply constraints: fewer properties, higher tension.
However, Spain, Poland and Portugal remove any ambiguity. In all three, new supply is accelerating, yet prices continue to climb at the same pace as elsewhere. Even as homebuilding picks up, prices keep rising.
The explanation is straightforward: demand is growing even faster, absorbing and outstripping the new supply.
Because similar price inflation occurs both in core markets and in peripheral markets, where it is expanding , this cannot be a supply-driven phenomenon. The common denominator across both groups is demand.
Depressed buying intentions do not contradict this diagnosis; they refine it. It is not the desire for housing that is weakening, but the ability to act, squeezed by the cost of borrowing.
Far from being extinguished, demand is merely deferred and rationed by affordability, maintaining upward pressure on prices against a supply that remains structurally scarce.
(1) Index of major purchases planned over the next 12 months: https://ec.europa.eu/eurostat/databrowser/view/isoc_eco_ic/default/table?lang=EN
Fig. 31 – Residential construction output, 2012–2025
Download this infographic for your presentations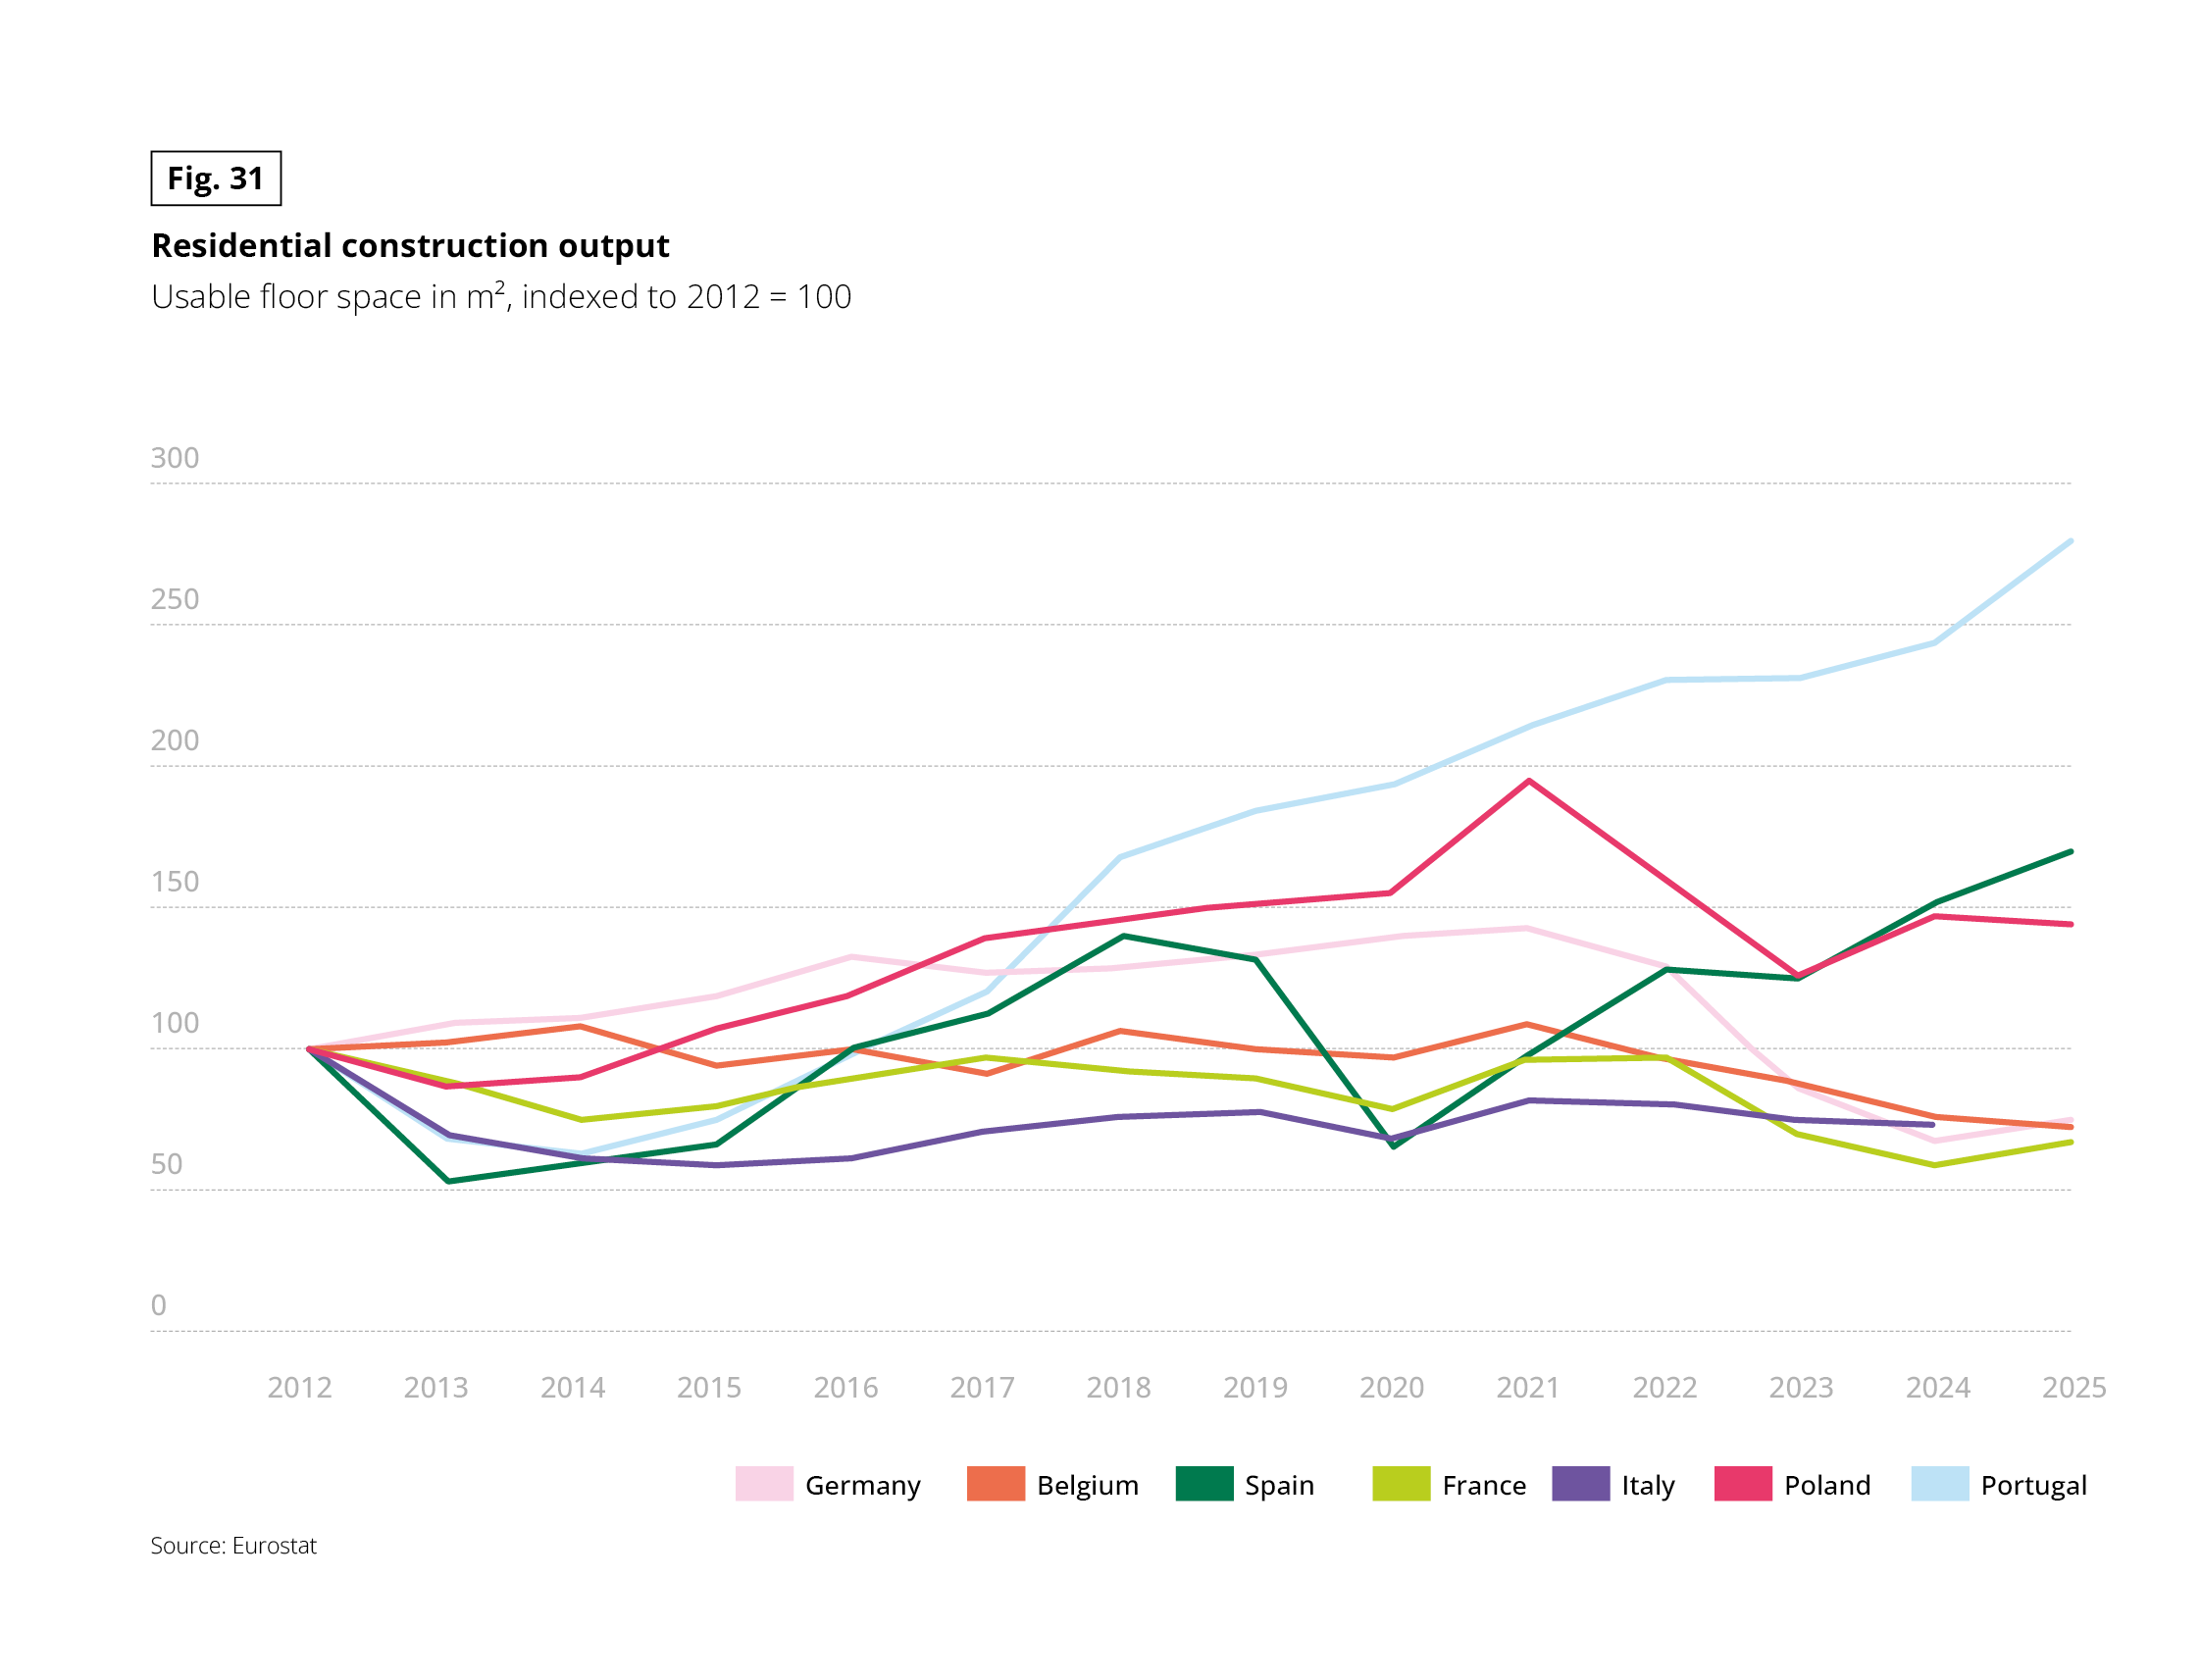 Line chart with seven series: Germany, Belgium, Spain, France, Italy, Poland and Portugal. Measure: usable floor space in m², indexed to 2012 = 100. Years 2012 to 2025. The Italy series stops in 2024. Source: Eurostat.
Approximate values read from the chart, in the form 2012 / peak / latest year:
• Portugal: 100 / 280 in 2025 / 280, rising almost every year
• Poland: 100 / 195 in 2021 / 145
• Spain: 100 / 170 in 2025 / 170, with a low of about 52 in 2013 and about 65 in 2020
• Germany: 100 / 142 in 2021 / 75
• Belgium: 100 / 108 in 2014 and 2021 / 72
• France: 100 / 97 in 2017 and 2022 / 67
• Italy: 100 / 82 in 2021 / 73 (2024)
Portugal and Spain end far above their 2012 level. Germany, Belgium, France and Italy end well below it.
Fig. 32 – House price index, 2012–2025
Download this infographic for your presentations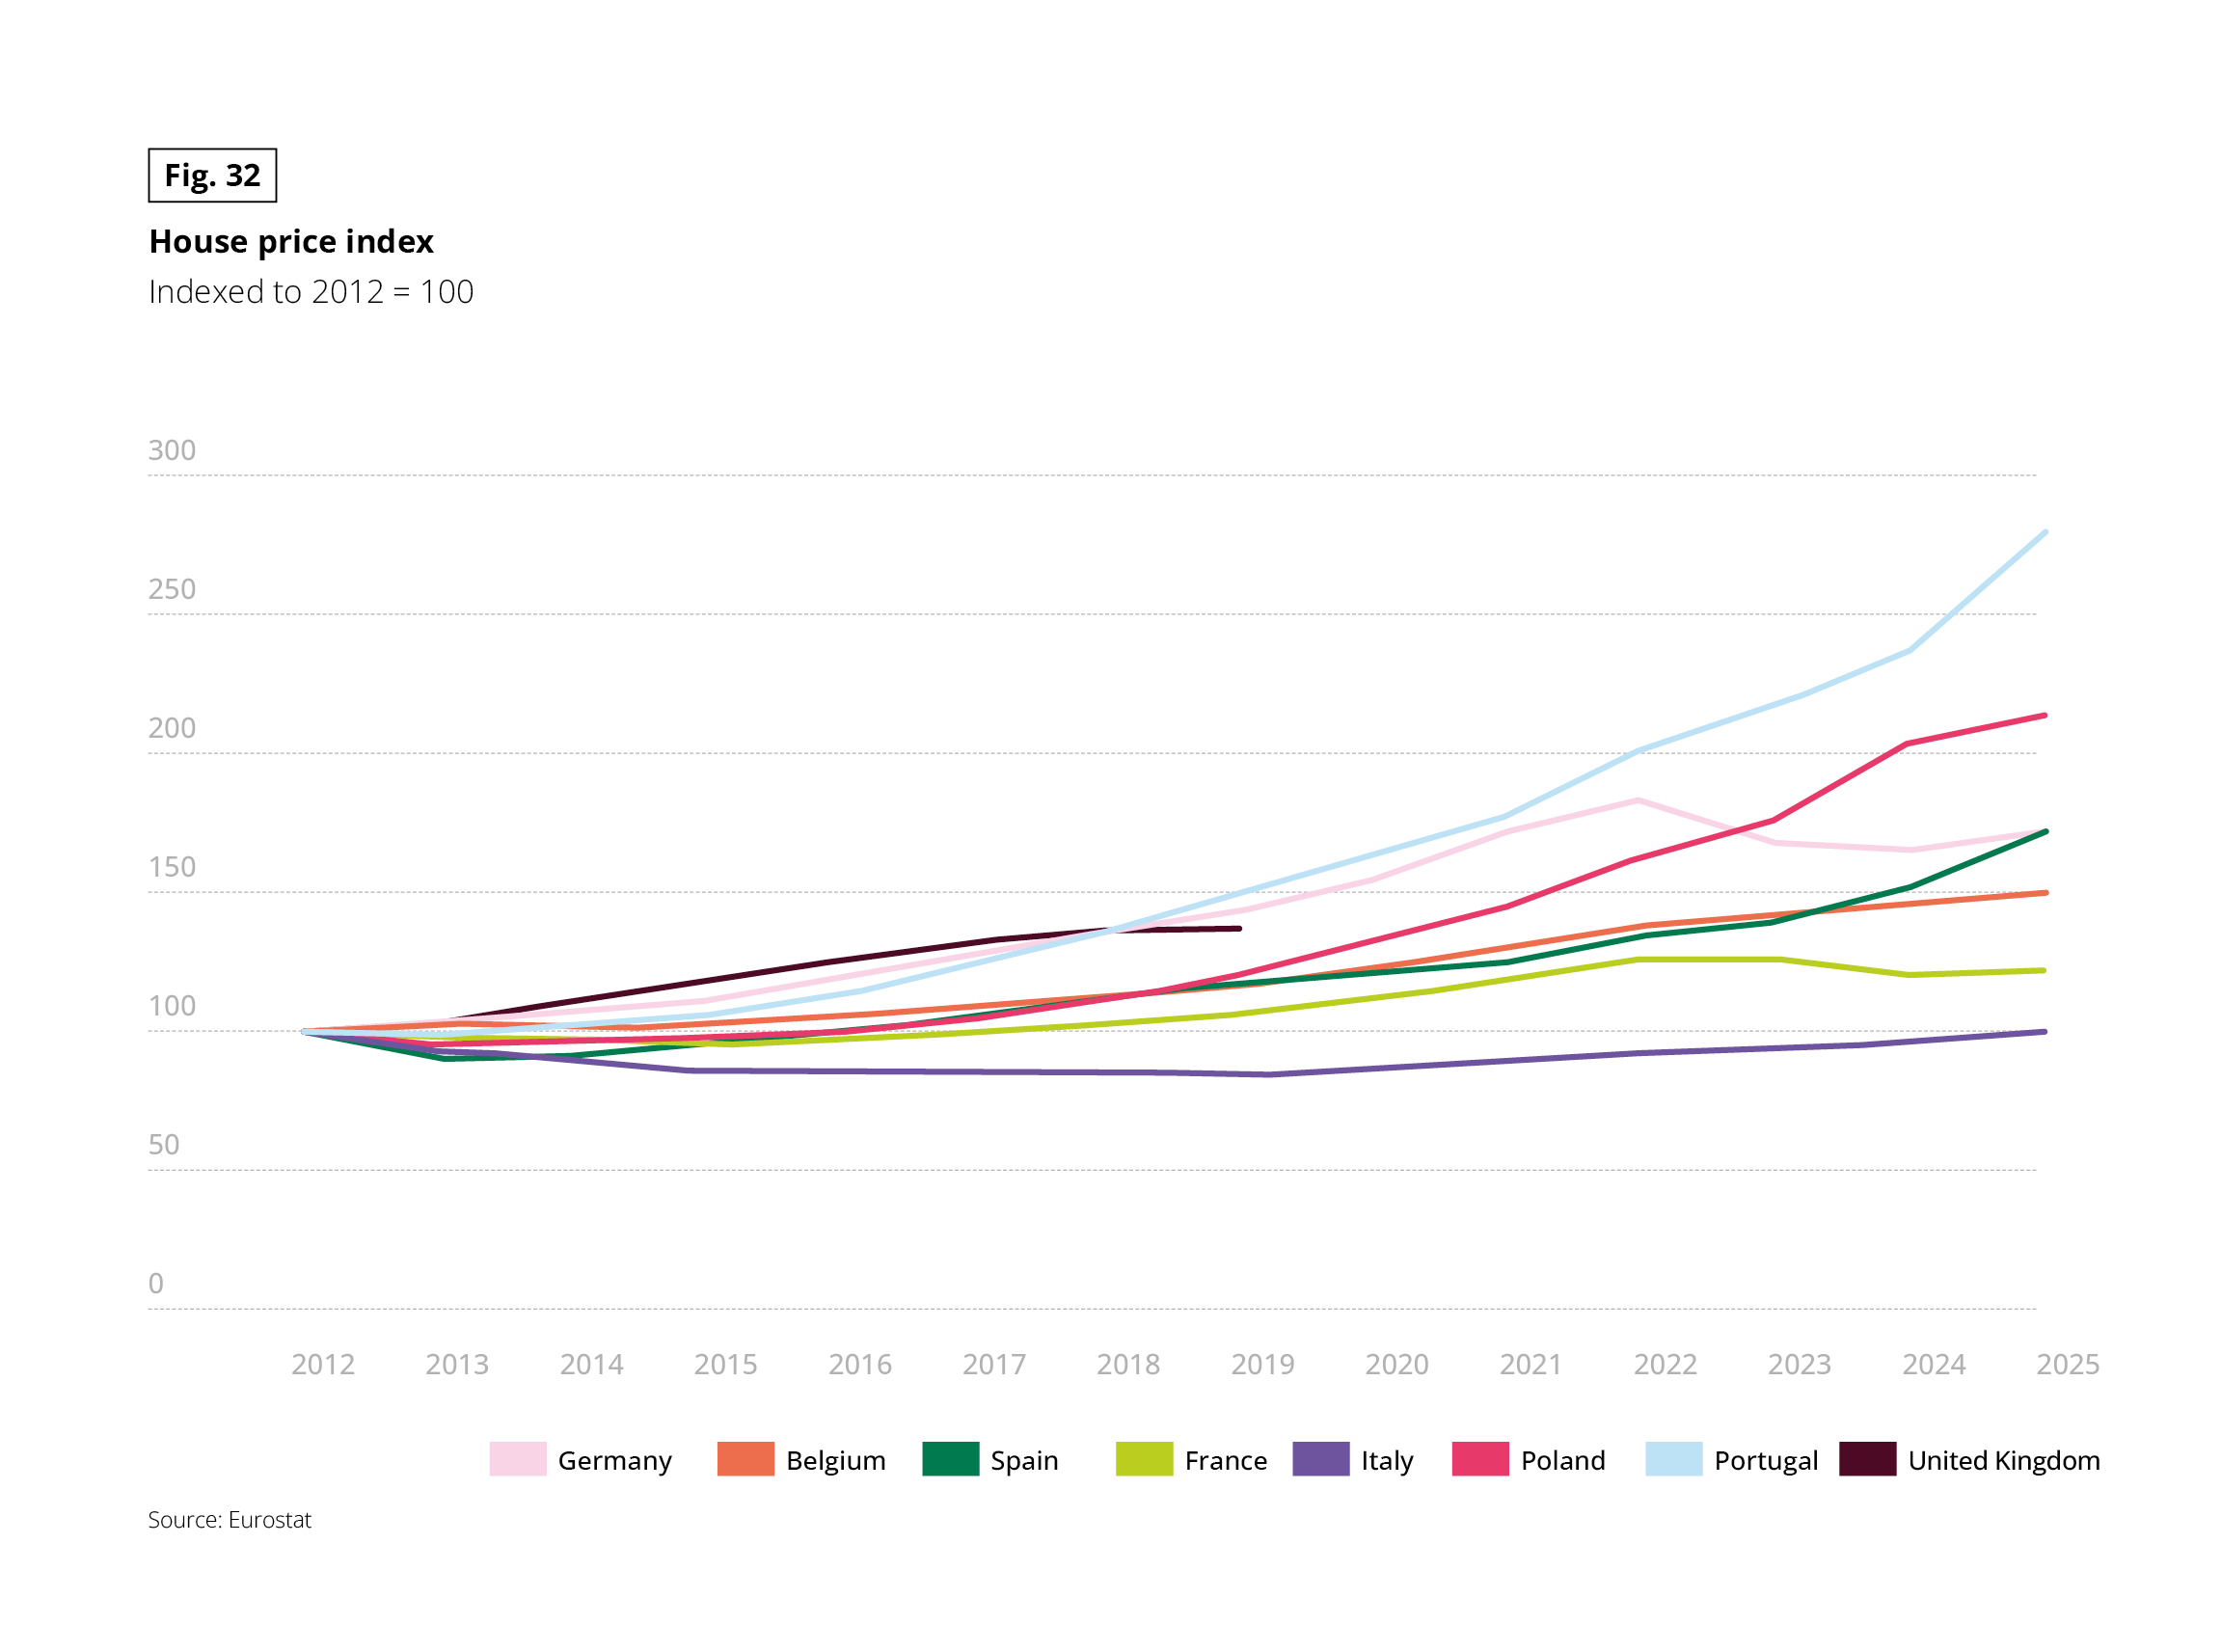 Line chart with eight series: Germany, Belgium, Spain, France, Italy, Poland, Portugal and United Kingdom. Unit: index, 2012 = 100. Years 2012 to 2025. The United Kingdom series stops in 2019. Source: Eurostat.
Approximate values read from the chart, in the form latest year (peak if different):
• Portugal: 280
• Poland: 213
• Germany: 172 (peak of about 183 in 2022, then a dip to about 166 in 2024)
• Spain: 172
• Belgium: 150
• France: 121 (peak of about 126 in 2022–2023)
• Italy: 100 (low of about 84 in 2019)
• United Kingdom: about 137 in 2019, last data point
Portugal rises most. Italy stagnates and ends where it started. Germany and France stall after 2022, while Spain, Poland and Portugal keep rising.
VALUE FOR MONEY STAYS PARAMOUNT IN HOUSING DECISIONS, BUT DELIVERS EVER LESS SATISFACTION
When selecting a home, price reigns supreme: 9 in 10 Europeans consider it important, and it ranks as their single most critical criterion, with 60% attaching “great importance” to it.
Next come security and a baseline of practical factors: property condition, energy bills and floor area.
This dominance of price is not driven by frugality. Rather, it reflects a climate in which every euro allocated to rent or mortgage payments weighs heavier, as income growth fails to keep pace, particularly across 2025 and 2026.
Fig. 33 – Importance of criteria when choosing a home
Download this infographic for your presentations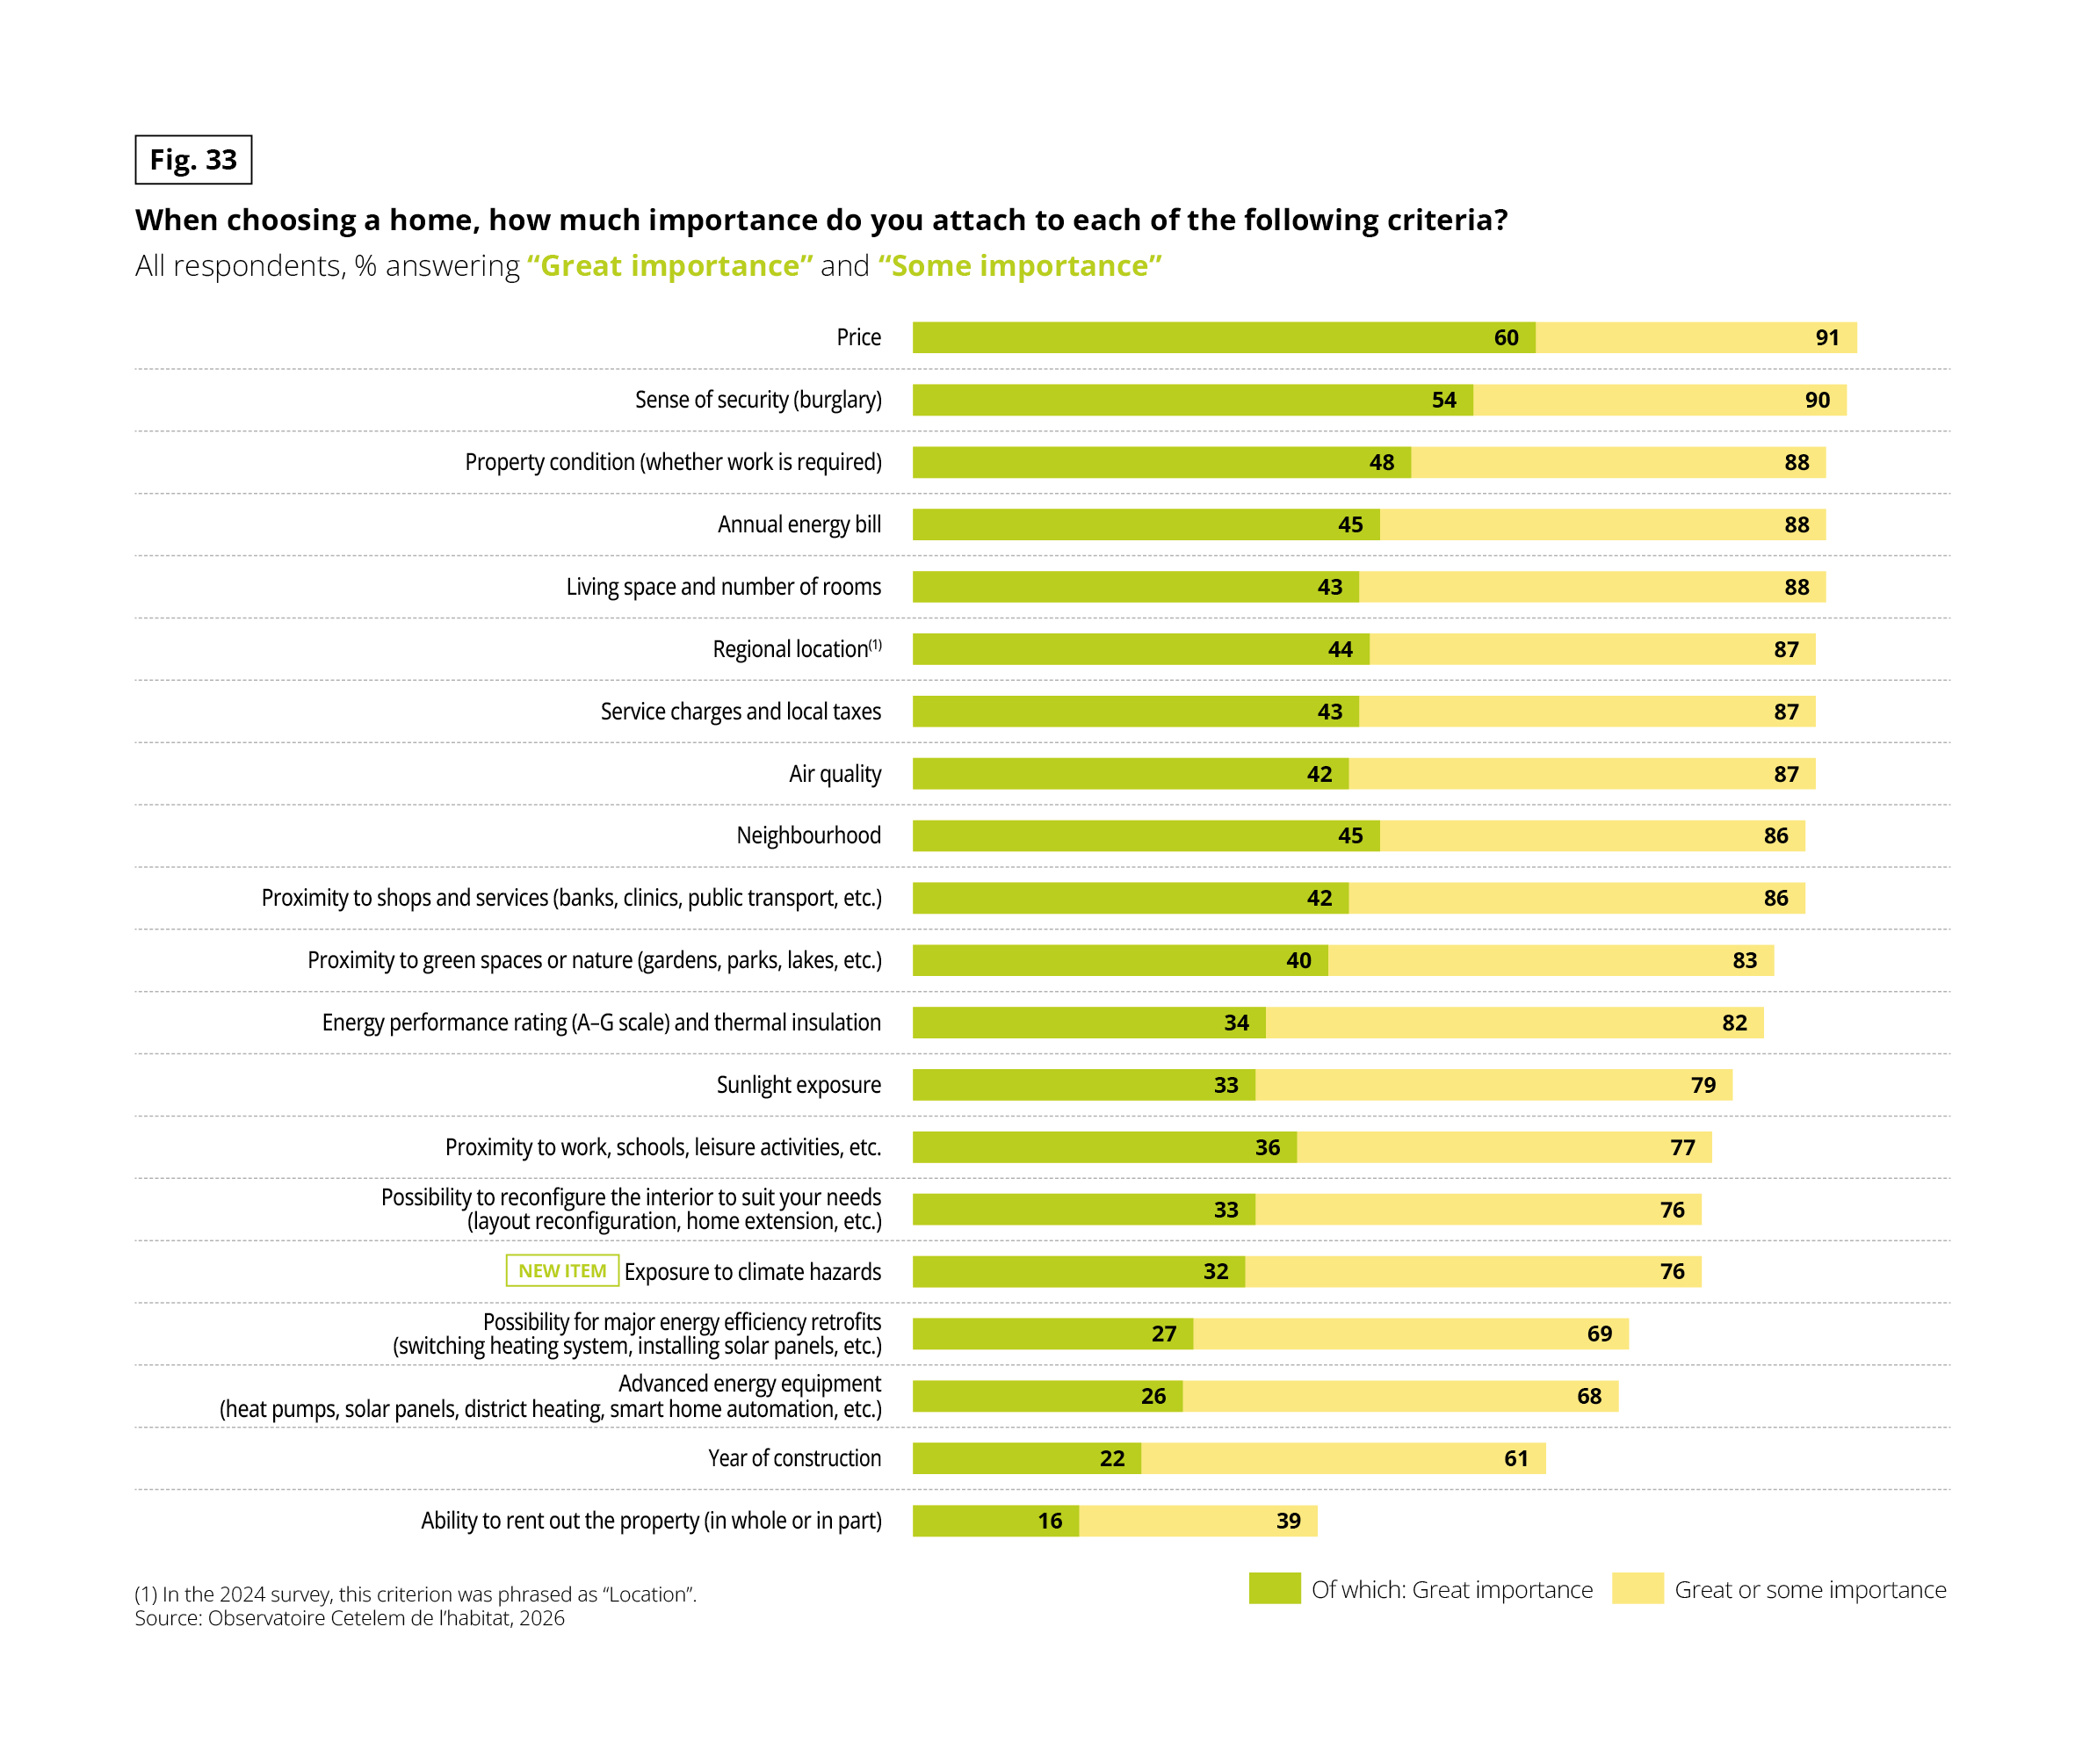 Horizontal bar chart. Question: “When choosing a home, how much importance do you attach to each of the following criteria?” Base: all respondents, in % answering “Great importance” and “Some importance”. Two figures per item: share “of which great importance”, then total great or some importance. Source: Observatoire Cetelem de l’habitat, 2026.
Data in the form great importance / great or some importance:
• Price: 60 / 91
• Sense of security (burglary): 54 / 90
• Property condition (whether work is required): 48 / 88
• Annual energy bill: 45 / 88
• Living space and number of rooms: 43 / 88
• Regional location: 44 / 87
• Service charges and local taxes: 43 / 87
• Air quality: 42 / 87
• Neighbourhood: 45 / 86
• Proximity to shops and services: 42 / 86
• Proximity to green spaces or nature: 40 / 83
• Energy performance rating (A–G scale) and thermal insulation: 34 / 82
• Sunlight exposure: 33 / 79
• Proximity to work, schools, leisure activities, etc.: 36 / 77
• Possibility to reconfigure the interior to suit your needs: 33 / 76
• Exposure to climate hazards (new item): 32 / 76
• Possibility for major energy efficiency retrofits: 27 / 69
• Advanced energy equipment: 26 / 68
• Year of construction: 22 / 61
• Ability to rent out the property (in whole or in part): 16 / 39
Note: in the 2024 survey, “Regional location” was phrased as “Location”.
Price and security are the two most important criteria. Year of construction and the ability to rent out the property matter least.
Comparing importance with satisfaction highlights the core gap: what matters most satisfies least. Price exhibits the sharpest divergence between expectations and reality, outpacing energy bills, feeling of security, service charges and property condition.
Conversely, living environment and location form a comfort zone where satisfaction meets or exceeds expectations. Although the gap between what Europeans expect and what they currently have, most acute in pricing and energy, has narrowed since 2024 as price pressures abated, it remains the primary challenge ahead.
Fig. 34 – Importance of housing criteria compared with satisfaction
Download this infographic for your presentations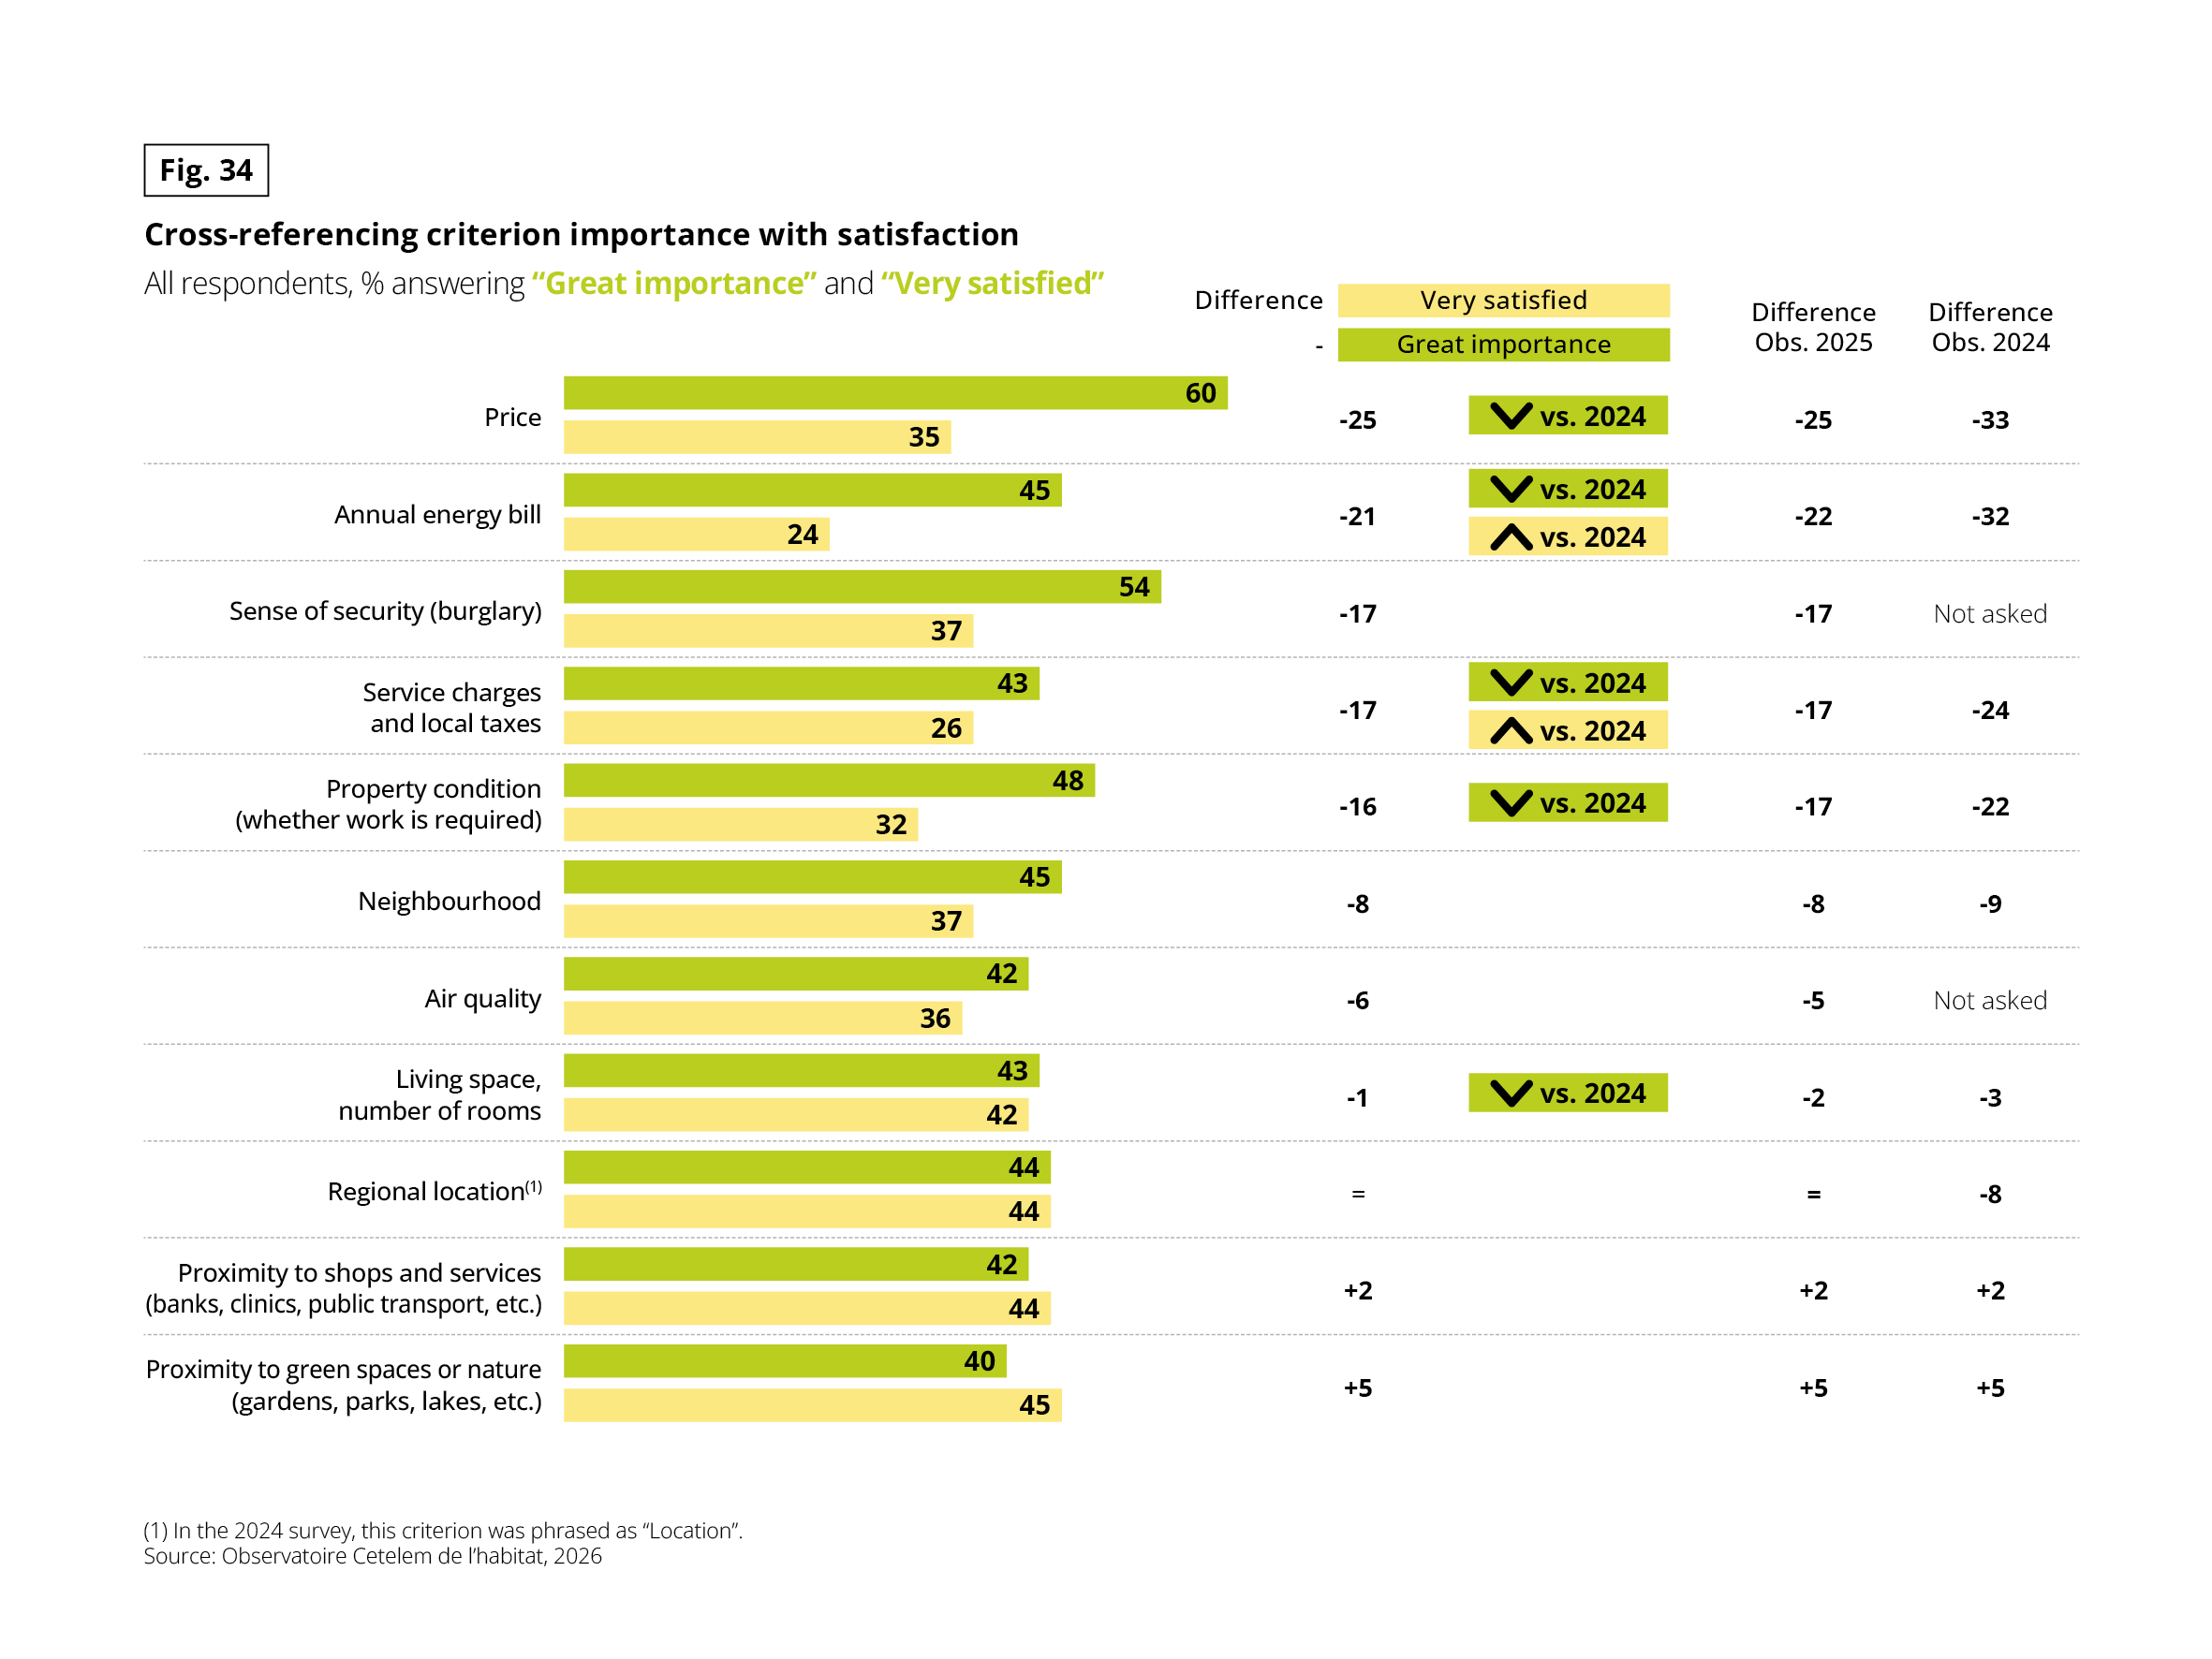 Paired horizontal bars with a table of differences. Base: all respondents, in % answering “Great importance” and “Very satisfied”. The “Difference” column is satisfaction minus importance, in points. Two further columns give the difference in the 2025 and 2024 surveys. The 2026 column also shows a direction arrow against 2024 for some items. Source: Observatoire Cetelem de l’habitat, 2026.
Data in the form great importance / very satisfied, difference (2025 difference / 2024 difference):
• Price: 60 / 35, −25 (−25 / −33), gap narrowing versus 2024
• Annual energy bill: 45 / 24, −21 (−22 / −32), importance down, satisfaction up versus 2024
• Sense of security (burglary): 54 / 37, −17 (−17 / not asked)
• Service charges and local taxes: 43 / 26, −17 (−17 / −24), importance down, satisfaction up versus 2024
• Property condition (whether work is required): 48 / 32, −16 (−17 / −22), gap narrowing versus 2024
• Neighbourhood: 45 / 37, −8 (−8 / −9)
• Air quality: 42 / 36, −6 (−5 / not asked)
• Living space, number of rooms: 43 / 42, −1 (−2 / −3), gap narrowing versus 2024
• Regional location: 44 / 44, equal (equal / −8)
• Proximity to shops and services: 42 / 44, +2 (+2 / +2)
• Proximity to green spaces or nature: 40 / 45, +5 (+5 / +5)
Note: in the 2024 survey, “Regional location” was phrased as “Location”.
The largest unmet expectations concern price, energy bill, security and service charges. For proximity to shops and to green spaces, satisfaction exceeds importance.
Choice is constrained: facing a frozen market, persistent high prices, and tight budgets, Europeans prioritise price even as it frustrates them most. Yet across this balance of deep attachment and hard compromises, housing keeps its safe-haven appeal.
KEY FIGURES
- 86% of Europeans are attached to their home (of whom half are “very attached”)
- 90% say they are satisfied with their home, a figure that has held stable since 2024
- 82% report an increase in their energy bills over the past 12 months
- 87% feel safe in their home against the risk of break-ins
- 34% consider their home uncomfortable during at least one season
- 51% believe their home is exposed to at least two climate risks
- 91% rank price among their home selection criteria (making it the top priority)