A positive attitude to motoring

THE JOY OF DRIVING
The practical aspects of cars in no way detract from the pleasure of driving them. Quite the opposite, in fact. 7 out of 10 young people confirm this point, while just 2 out of 10 view driving as a chore (Fig. 8). And this enjoyment has stood the test of time, since 8 out of 10 young people surveyed in 2011 had declared their fondness for driving. The Chinese and Turks are the most enthusiastic, in contrast to the Japanese, whose enjoyment is less apparent. Men, inhabitants of big cities, couples with children and EV drivers all seem to share this passion for motoring.
CARS ARE SEEING THEIR IMAGE IMPROVE
As we have just ascertained, cars are a source of pleasure, but they also enjoy a positive image overall. One of the most surprising findings of this survey is that, despite the received wisdom regarding cars and young people, 1 in 2 under-30s believe that the image they have of cars has improved over the last five years. Only 14% report that it has worsened. This is in stark contrast to the views expressed by seniors, more than half of whom have not changed their opinion (Fig. 9). Another finding that may seem surprising is that this image boost is more apparent in cities than in rural areas, no doubt due to the growing presence of electric and hybrid vehicles, not to mention traffic restrictions. Looking at the geographical breakdown, the Chinese and Turks once again express the most enthusiasm, while the French are among the most reserved on this point.
Fig 8 – Perception of driving by age
Download this infographic for your presentations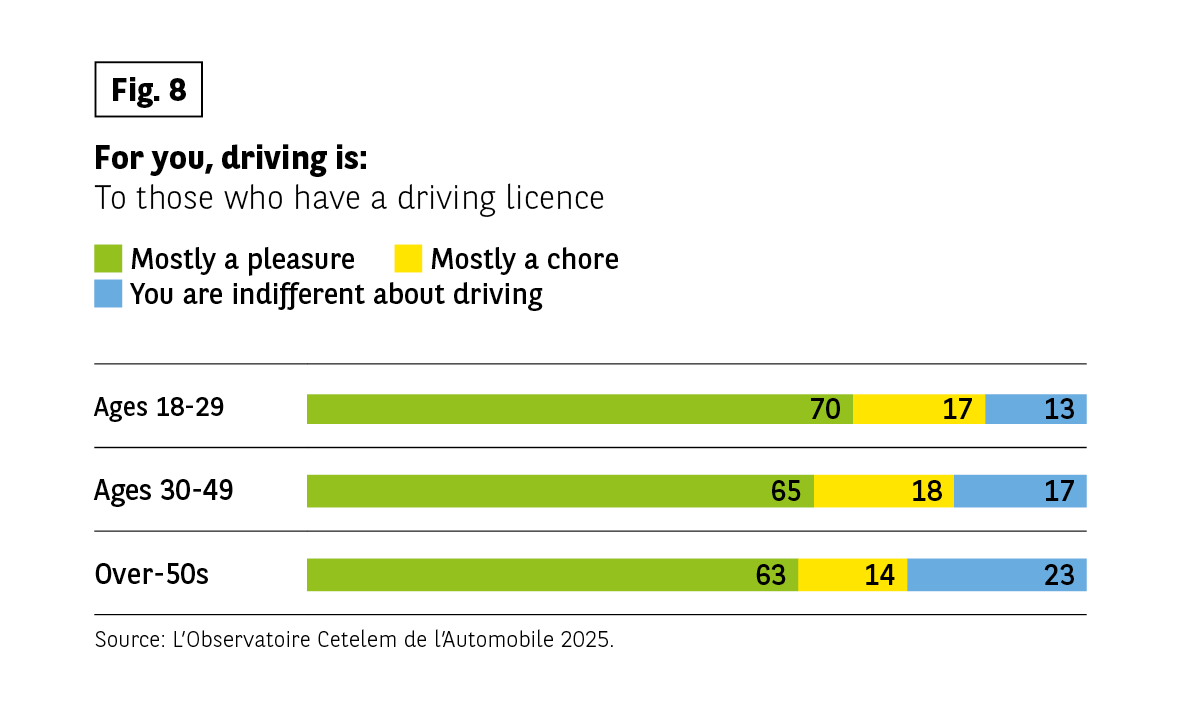 The infographic presents the responses to the question “For you, driving is…”, asked to people who have a driver’s license. Three options are proposed: “most of the time a pleasure”, “most of the time a chore”, and “it leaves me indifferent”. The results are compared for three age groups: 18-29 years old, 30-49 years old, and 50 years old and over.
The data indicated are:
18-29 years old: pleasure 70%, chore 17%, indifferent 13%
30-49 years old: pleasure 65%, chore 18%, indifferent 17%
50 years old and over: pleasure 63%, chore 14%, indifferent 23%
Overall, driving is mostly experienced as a pleasure in all age groups, with a slight decrease among older respondents. The perception of a chore remains minority, while indifference tends to increase progressively with age.
Source: Cetelem Automobile Observatory 2025
The infographic presents the responses to the question “For you, driving is…”, asked to people who have a driver’s license. Three options are proposed: “most of the time a pleasure”, “most of the time a chore”, and “it leaves me indifferent”. The results are compared for three age groups: 18-29 years old, 30-49 years old, and 50 years old and over.
The data indicated are:
18-29 years old: pleasure 70%, chore 17%, indifferent 13%
30-49 years old: pleasure 65%, chore 18%, indifferent 17%
50 years old and over: pleasure 63%, chore 14%, indifferent 23%
Overall, driving is mostly experienced as a pleasure in all age groups, with a slight decrease among older respondents. The perception of a chore remains minority, while indifference tends to increase progressively with age.
Source: Cetelem Automobile Observatory 2025
Fig 9 – Evolution of the image of the car by age
Download this infographic for your presentations The infographic presents the responses to the question “Over the past 5 years, would you say that the image you have of the car…?”. Four options are proposed: “has deteriorated”, “has improved”, “has not changed”, and “I don’t know”. The results are compared for three age groups: 18-29 years old, 30-49 years old, and 50 years old and over.
The data indicated are:
18-29 years old: deteriorated 14%, improved 46%, not changed 34%, don’t know 6%
30-49 years old: deteriorated 13%, improved 35%, not changed 46%, don’t know 6%
50 years old and over: deteriorated 12%, improved 24%, not changed 59%, don’t know 5%
Overall, the image of the car appears rather stable, especially among 50 years old and over, who mostly declare that it has not changed. Younger people are more likely to estimate that it has improved. The proportions of responses indicating a deterioration remain relatively low in all age groups.
Source: Cetelem Automobile Observatory
The infographic presents the responses to the question “Over the past 5 years, would you say that the image you have of the car…?”. Four options are proposed: “has deteriorated”, “has improved”, “has not changed”, and “I don’t know”. The results are compared for three age groups: 18-29 years old, 30-49 years old, and 50 years old and over.
The data indicated are:
18-29 years old: deteriorated 14%, improved 46%, not changed 34%, don’t know 6%
30-49 years old: deteriorated 13%, improved 35%, not changed 46%, don’t know 6%
50 years old and over: deteriorated 12%, improved 24%, not changed 59%, don’t know 5%
Overall, the image of the car appears rather stable, especially among 50 years old and over, who mostly declare that it has not changed. Younger people are more likely to estimate that it has improved. The proportions of responses indicating a deterioration remain relatively low in all age groups.
Source: Cetelem Automobile Observatory
LIFE WITHOUT A CAR IS UNIMAGINABLE
So how about living without a car? Most young people struggle to see how they could. 6 in 10 don’t see it as a possibility. However, it should be noted that this proportion has fallen significantly since 2011. It is also slightly lower than the figure for seniors (Fig. 10).
The French and Americans are the most resistant to the idea. Paradoxically, the Chinese and Turks, but also the Poles, are somewhat less reticent.
Not surprisingly, the prospect of a car-free life is more appealing to urban dwellers than to those based in rural areas.
Fig 10 – Projection of life without a car by age
Download this infographic for your presentations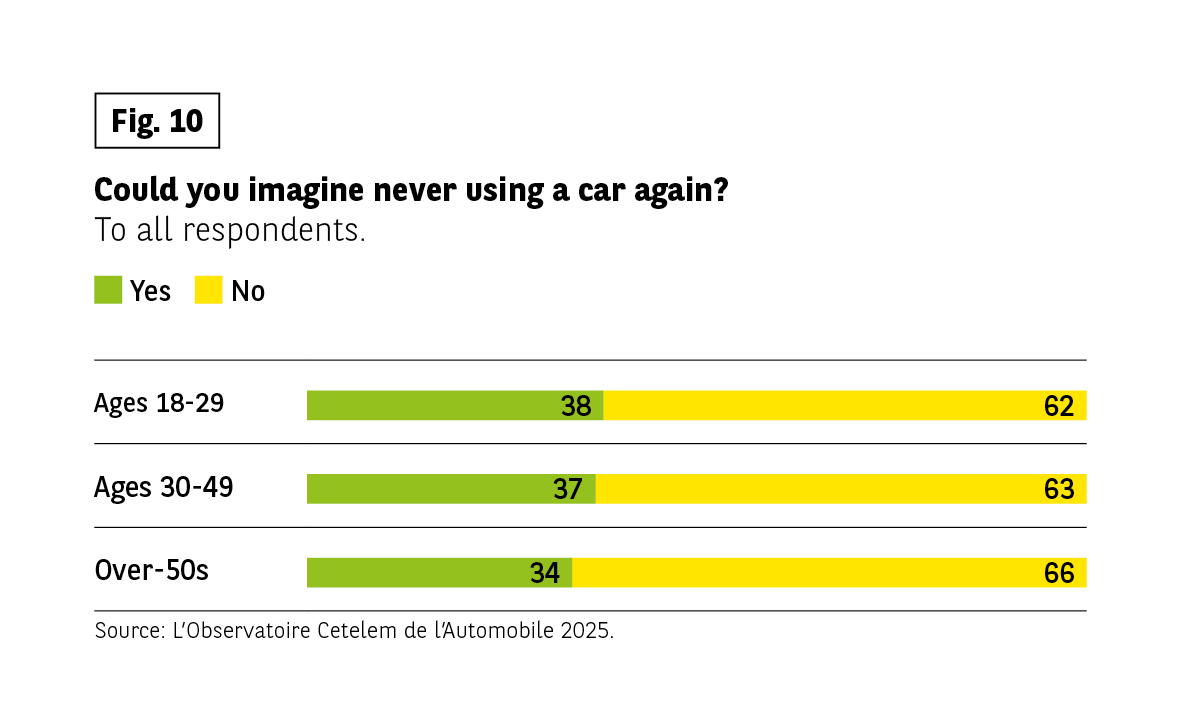 The infographic presents the responses to the question “Could you imagine living your entire life without a car?”, asked to the entire sample. Two options are possible: “yes” and “no”. The results are compared for three age groups: 18-29 years old, 30-49 years old, and 50 years old and over.
The data displayed are:
18-29 years old: yes 38%, no 62%
30-49 years old: yes 37%, no 63%
50 years old and over: yes 34%, no 66%
Overall, a majority of respondents, regardless of age, declare that they cannot imagine living their entire life without a car. The proportions in favor of this idea decrease slightly with age.
Source: Cetelem Automobile Observatory 2025
The infographic presents the responses to the question “Could you imagine living your entire life without a car?”, asked to the entire sample. Two options are possible: “yes” and “no”. The results are compared for three age groups: 18-29 years old, 30-49 years old, and 50 years old and over.
The data displayed are:
18-29 years old: yes 38%, no 62%
30-49 years old: yes 37%, no 63%
50 years old and over: yes 34%, no 66%
Overall, a majority of respondents, regardless of age, declare that they cannot imagine living their entire life without a car. The proportions in favor of this idea decrease slightly with age.
Source: Cetelem Automobile Observatory 2025