Mobility has got young people mobilised

DIVERSIFIED MOBILITY
But cars are not the be-all and end-all. Young people are well aware that there is more than one way to travel.
Cycling tops the list, having been embraced by 7 out of 10 young people (Fig. 11). Its popularity in no way depends on where people live, with inhabitants of towns and cities of all sizes taking it up with equal enthusiasm. Having children provides an even greater incentive to cycle. The increasing use of electric bicycles to take children to school, especially in urban areas, is undoubtedly a factor.
If we look at the different countries, the Netherlands, where the bicycle is king, and, more surprisingly, Poland are the two most cycling-friendly nations. Its detractors include Portugal, the United States and the United Kingdom. Could it be something to do with the climate?
Ride sharing comes second in the ranking of alternative forms of transport, being cited by over 50% of young people, double the proportion of seniors. If we compare this to the figures reported in 2011, this is a particularly striking result, given that only 30% of young people said they had taken up cycling at the time. The Japanese and Italians are by far the least likely to get on a bike. The Chinese and Turks are once again among the most committed in this area.
It’s worth highlighting that car and bicycle hire receive very similar scores, with around 1 in 3 young people choosing to use these services.
Fig 11 – Alternative mobility practices by age
Download this infographic for your presentations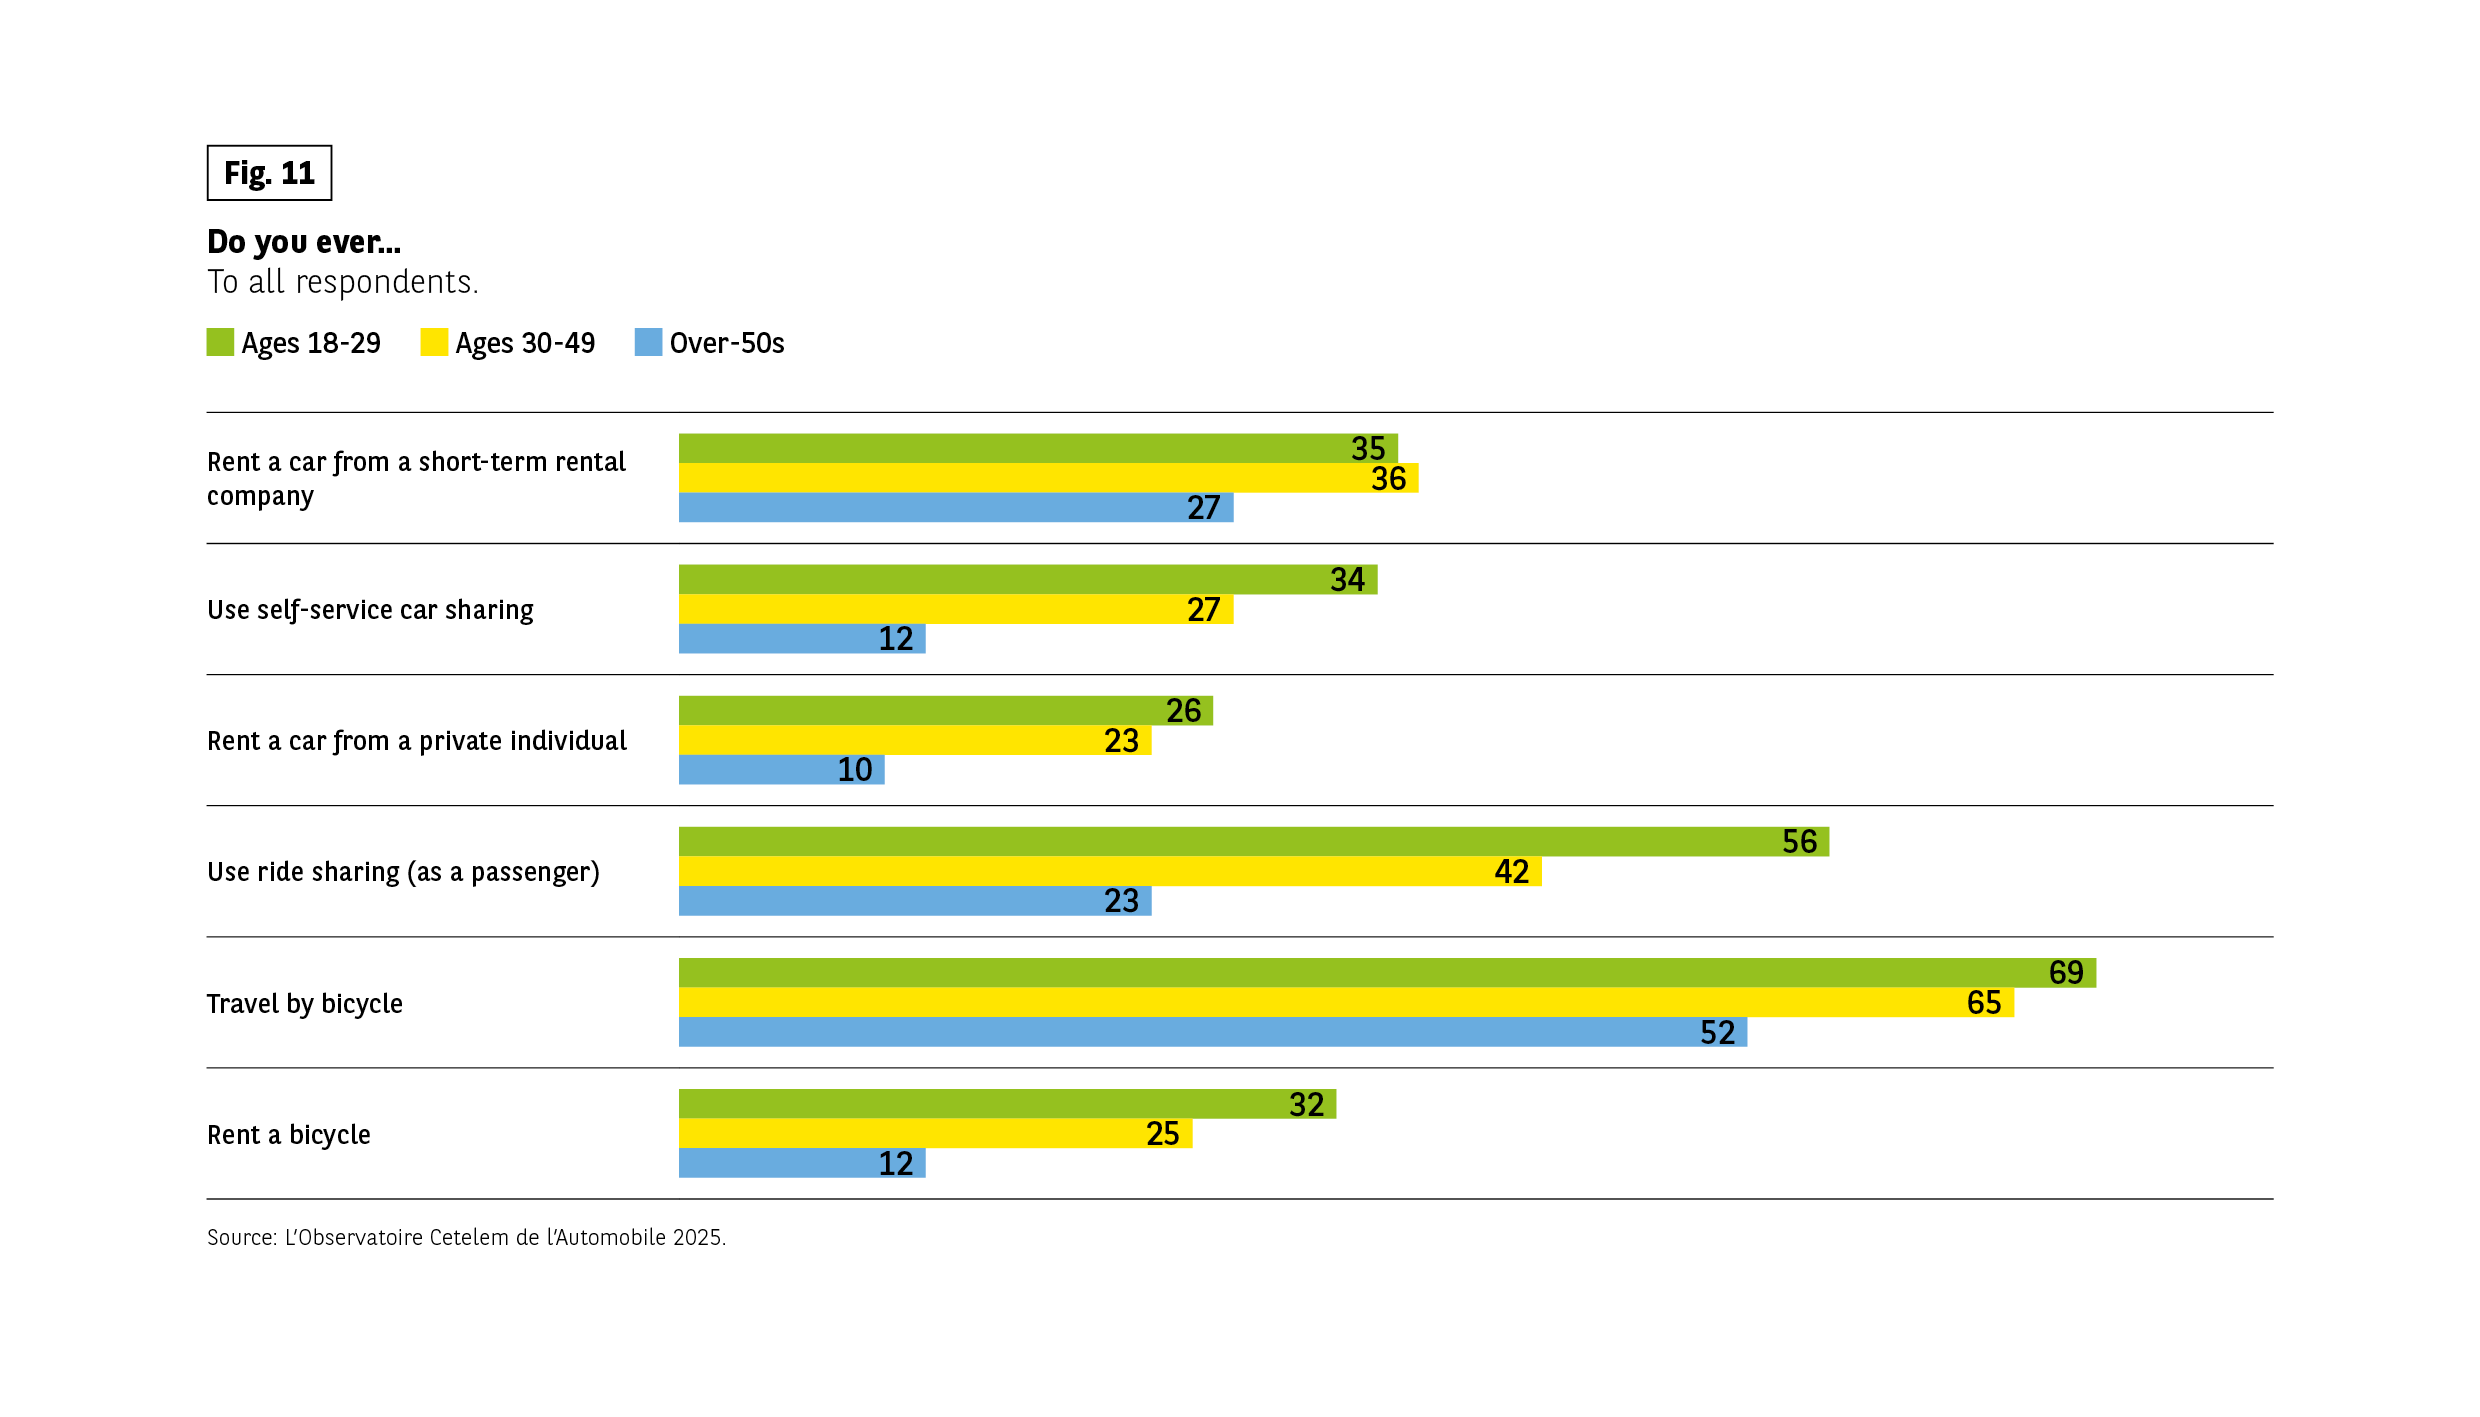 The infographic presents the responses to the question “Do you…?”, asked to the entire sample. The practices concerned are: renting a car from a short-term rental company, using a car-sharing service, renting a car from a private individual, carpooling as a passenger, traveling by bike, and renting a bike. The results are compared for three age groups: 18-29 years old, 30-49 years old, and 50 years old and over.
The data displayed are:
Renting a car from a short-term rental company: aged 18–29 35%, aged 30-49 36%, aged over 50 27%
Using a car-sharing service: aged 18–29 34%, aged 30-49 27%, aged over 50 12%
Renting a car from a private individual: aged 18–29 26%, aged 30-49 23%, aged over 50 10%
Use ride sharing (as a passenger): aged 18–29 56%, aged 30-49 42%, aged over 50 23%
Traveling by bike: aged 18–29 69%, aged 30-49 65%, aged over 50 52%
Renting a bike: aged 18–29 32%, aged 30-49 25%, aged over 50 12%
The responses show that certain practices, such as carpooling or traveling by bike, are particularly common among younger people, while others, such as car-sharing or renting from a private individual, decrease significantly with age. In contrast, short-term rental remains relatively stable across generations.
Source: Cetelem Automobile Observatory 2025
The infographic presents the responses to the question “Do you…?”, asked to the entire sample. The practices concerned are: renting a car from a short-term rental company, using a car-sharing service, renting a car from a private individual, carpooling as a passenger, traveling by bike, and renting a bike. The results are compared for three age groups: 18-29 years old, 30-49 years old, and 50 years old and over.
The data displayed are:
Renting a car from a short-term rental company: aged 18–29 35%, aged 30-49 36%, aged over 50 27%
Using a car-sharing service: aged 18–29 34%, aged 30-49 27%, aged over 50 12%
Renting a car from a private individual: aged 18–29 26%, aged 30-49 23%, aged over 50 10%
Use ride sharing (as a passenger): aged 18–29 56%, aged 30-49 42%, aged over 50 23%
Traveling by bike: aged 18–29 69%, aged 30-49 65%, aged over 50 52%
Renting a bike: aged 18–29 32%, aged 30-49 25%, aged over 50 12%
The responses show that certain practices, such as carpooling or traveling by bike, are particularly common among younger people, while others, such as car-sharing or renting from a private individual, decrease significantly with age. In contrast, short-term rental remains relatively stable across generations.
Source: Cetelem Automobile Observatory 2025
EVEN THOSE WITHOUT A VEHICLE SOMETIMES TRAVEL BY CAR
However, not owning a vehicle doesn’t mean giving up on cars entirely. Once more, young people without their own wheels are taking advantage of ride sharing. This is the only item, along with car sharing, where the difference between this generation and seniors is so pronounced (Fig. 12).
Rental, a more traditional solution, and subscription services are the two most popular options for around 1 in 2 young people and seniors.
Fig 12 – Alternative solutions to the car considered by age
Download this infographic for your presentations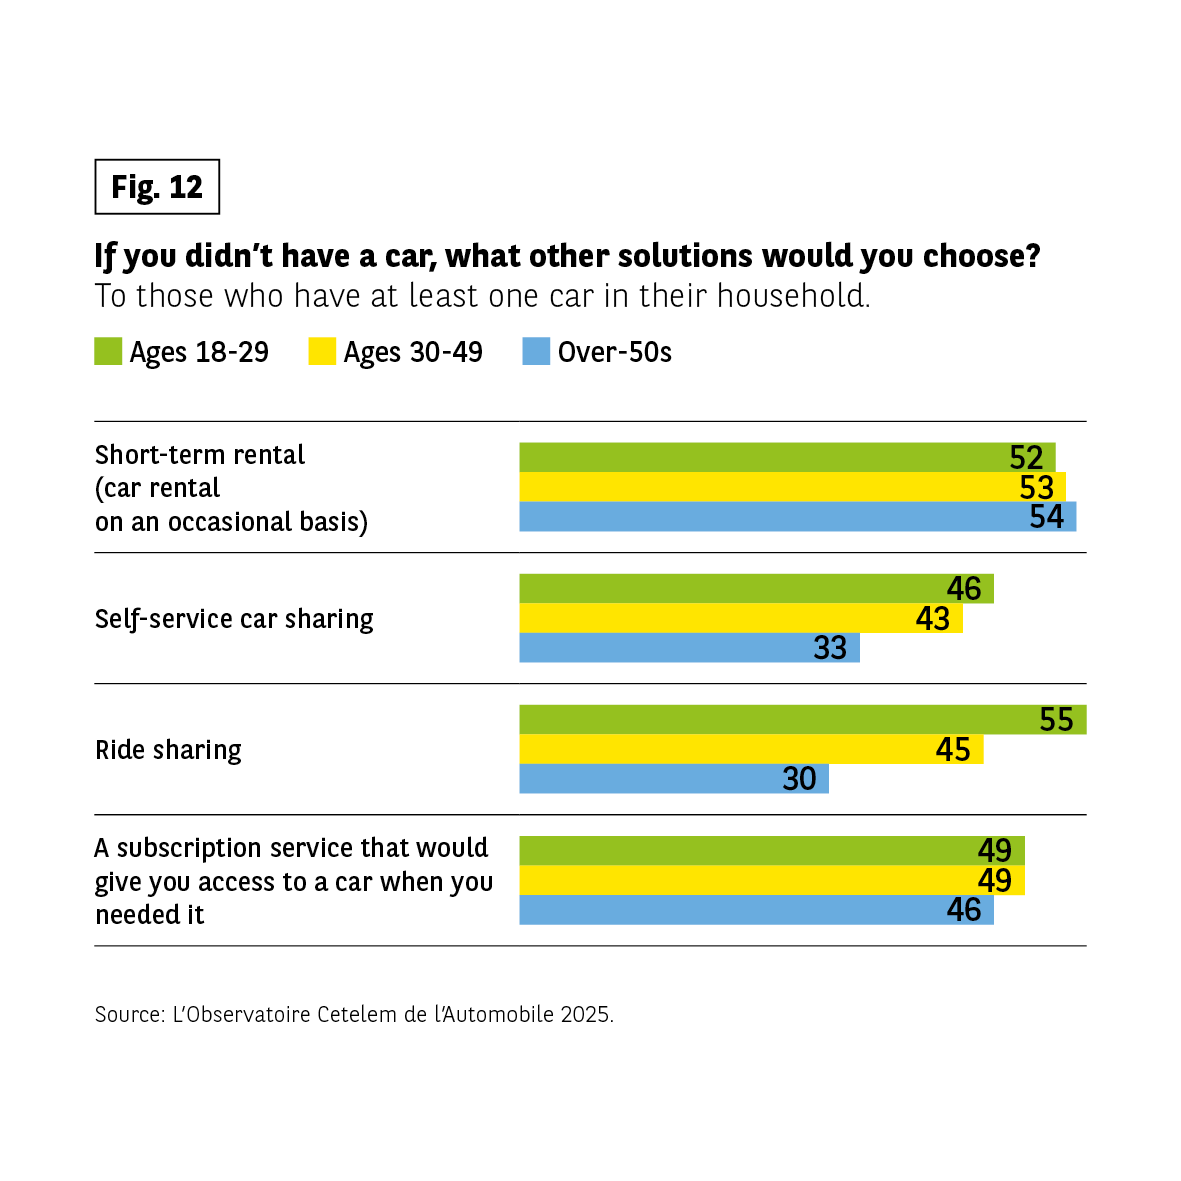 The infographic presents the responses to the question “If you didn’t have a car, what other solutions would you choose?”, asked to people who have at least one car in their household. Four solutions are proposed: short-term rental, car-sharing, carpooling, and a subscription contract allowing access to a car on demand. The results are compared for three age groups: 18-29 years old, 30-49 years old, and 50 years old and over.
The data displayed are:
Short-term rental: 18-29 years old 52%, 30-49 years old 53%, 50 years old and over 54%
Car-sharing (car in free service): 18-29 years old 46%, 30-49 years old 43%, 50 years old and over 33%
Carpooling: 18-29 years old 55%, 30-49 years old 45%, 50 years old and over 30%
Subscription contract giving access to a car on demand: 18-29 years old 49%, 30-49 years old 49%, 50 years old and over 46%
The results show that short-term rental is the most cited option in all age groups. Car-sharing and carpooling are more considered by younger people, while the gaps between age groups remain more moderate for subscription.
Source: Cetelem Automobile Observatory 2025
The infographic presents the responses to the question “If you didn’t have a car, what other solutions would you choose?”, asked to people who have at least one car in their household. Four solutions are proposed: short-term rental, car-sharing, carpooling, and a subscription contract allowing access to a car on demand. The results are compared for three age groups: 18-29 years old, 30-49 years old, and 50 years old and over.
The data displayed are:
Short-term rental: 18-29 years old 52%, 30-49 years old 53%, 50 years old and over 54%
Car-sharing (car in free service): 18-29 years old 46%, 30-49 years old 43%, 50 years old and over 33%
Carpooling: 18-29 years old 55%, 30-49 years old 45%, 50 years old and over 30%
Subscription contract giving access to a car on demand: 18-29 years old 49%, 30-49 years old 49%, 50 years old and over 46%
The results show that short-term rental is the most cited option in all age groups. Car-sharing and carpooling are more considered by younger people, while the gaps between age groups remain more moderate for subscription.
Source: Cetelem Automobile Observatory 2025
WALKING LAGS SLIGHTLY BEHIND AMONG THE YOUNG
When not driving, young people choose public transport for their daily travel requirements, especially if they live in a city. For their part, seniors prefer to walk, possibly because they are keen to stay in shape, although young people are not averse to this healthy choice either (Fig. 13).
Fig 13 – Daily transportation modes other than car
Download this infographic for your presentations The infographic presents the responses to the question: “Apart from your car, what other means of transportation do you mainly use for your daily trips?”, asked to people who have at least one car in their household. Two answers could be given. The options proposed are public transportation, two-wheeled motorized vehicles, mechanical bicycles, electric-assisted bicycles, personal mobility devices (scooters, unicycles…), walking, and “none”. The results are compared for three age groups: 18-29 years old (responses in green), 30-49 years old (responses in yellow), and 50 years old and over (responses in blue).
The data indicated are:
Public transportation: 18-29 years old 52%, 30-49 years old 39%, 50 years old and over 38%
Two-wheeled motorized vehicles: 18-29 years old 8%, 30-49 years old 8%, 50 years old and over 5%.
Mechanical bicycle (without electric assistance): 18-29 years old 20%, 30-49 years old 22%, 50 years old and over 19%
Electric-assisted bicycle: 18-29 years old 13%, 30-49 years old 14%, 50 years old and over 10%
Personal mobility devices (scooters, unicycles…): 18-29 years old 7%, 30-49 years old 4%, 50 years old and over 1%
Walking: 18-29 years old 57%, 30-49 years old 57%, 50 years old and over 64%
No other mode: 18-29 years old 6%, 30-49 years old 9%, 50 years old and over 13%
The responses show that public transportation and walking are the most common alternatives, with a particularly high practice of walking among the oldest. The use of mechanical or electric bicycles remains relatively stable according to age, while personal mobility devices are more present among the youngest.
Source: Cetelem Automobile Observatory 2025
The infographic presents the responses to the question: “Apart from your car, what other means of transportation do you mainly use for your daily trips?”, asked to people who have at least one car in their household. Two answers could be given. The options proposed are public transportation, two-wheeled motorized vehicles, mechanical bicycles, electric-assisted bicycles, personal mobility devices (scooters, unicycles…), walking, and “none”. The results are compared for three age groups: 18-29 years old (responses in green), 30-49 years old (responses in yellow), and 50 years old and over (responses in blue).
The data indicated are:
Public transportation: 18-29 years old 52%, 30-49 years old 39%, 50 years old and over 38%
Two-wheeled motorized vehicles: 18-29 years old 8%, 30-49 years old 8%, 50 years old and over 5%.
Mechanical bicycle (without electric assistance): 18-29 years old 20%, 30-49 years old 22%, 50 years old and over 19%
Electric-assisted bicycle: 18-29 years old 13%, 30-49 years old 14%, 50 years old and over 10%
Personal mobility devices (scooters, unicycles…): 18-29 years old 7%, 30-49 years old 4%, 50 years old and over 1%
Walking: 18-29 years old 57%, 30-49 years old 57%, 50 years old and over 64%
No other mode: 18-29 years old 6%, 30-49 years old 9%, 50 years old and over 13%
The responses show that public transportation and walking are the most common alternatives, with a particularly high practice of walking among the oldest. The use of mechanical or electric bicycles remains relatively stable according to age, while personal mobility devices are more present among the youngest.
Source: Cetelem Automobile Observatory 2025
KEY DATA
- 85% of young people pass their driving test before the age of 25
- 1 in 2 buy their car second-hand
- 7 out of 10 enjoy driving
- 1 in 2 feel that cars have enjoyed an image boost over the last 5 years
- 4% of young people who don’t have a car believe that they cause too much pollution