But the financial burden remains high

THE USED OPTION IS THE MOST COMMON
Overall, young people seem to be split between buying their first car new or used, whereas in 2011 they were more likely to go for the second-hand option (63% vs. 51% this year). Seniors, on the other hand, are more inclined to buy a new car (59%) (Fig. 4). However, stark differences can be observed between the countries. In China, 9 out of 10 young people opt for new vehicles. The figure for Japan is 8 out of 10. The Italians and Spanish complete the top four. The bias towards new cars in the Asian and Mediterranean markets is a long-established trend. This edition of L’Observatoire Cetelem confirms that young people are not immune to it. It is also worth noting that the second-hand market in China is very underdeveloped. One must go to Poland, Portugal and France to find the biggest fans of used cars. With its highly-developed secondhand market, the situation in France is very different to that in China.
Fig 4 – Acquisition of new or used car by young people, by country
Download this infographic for your presentations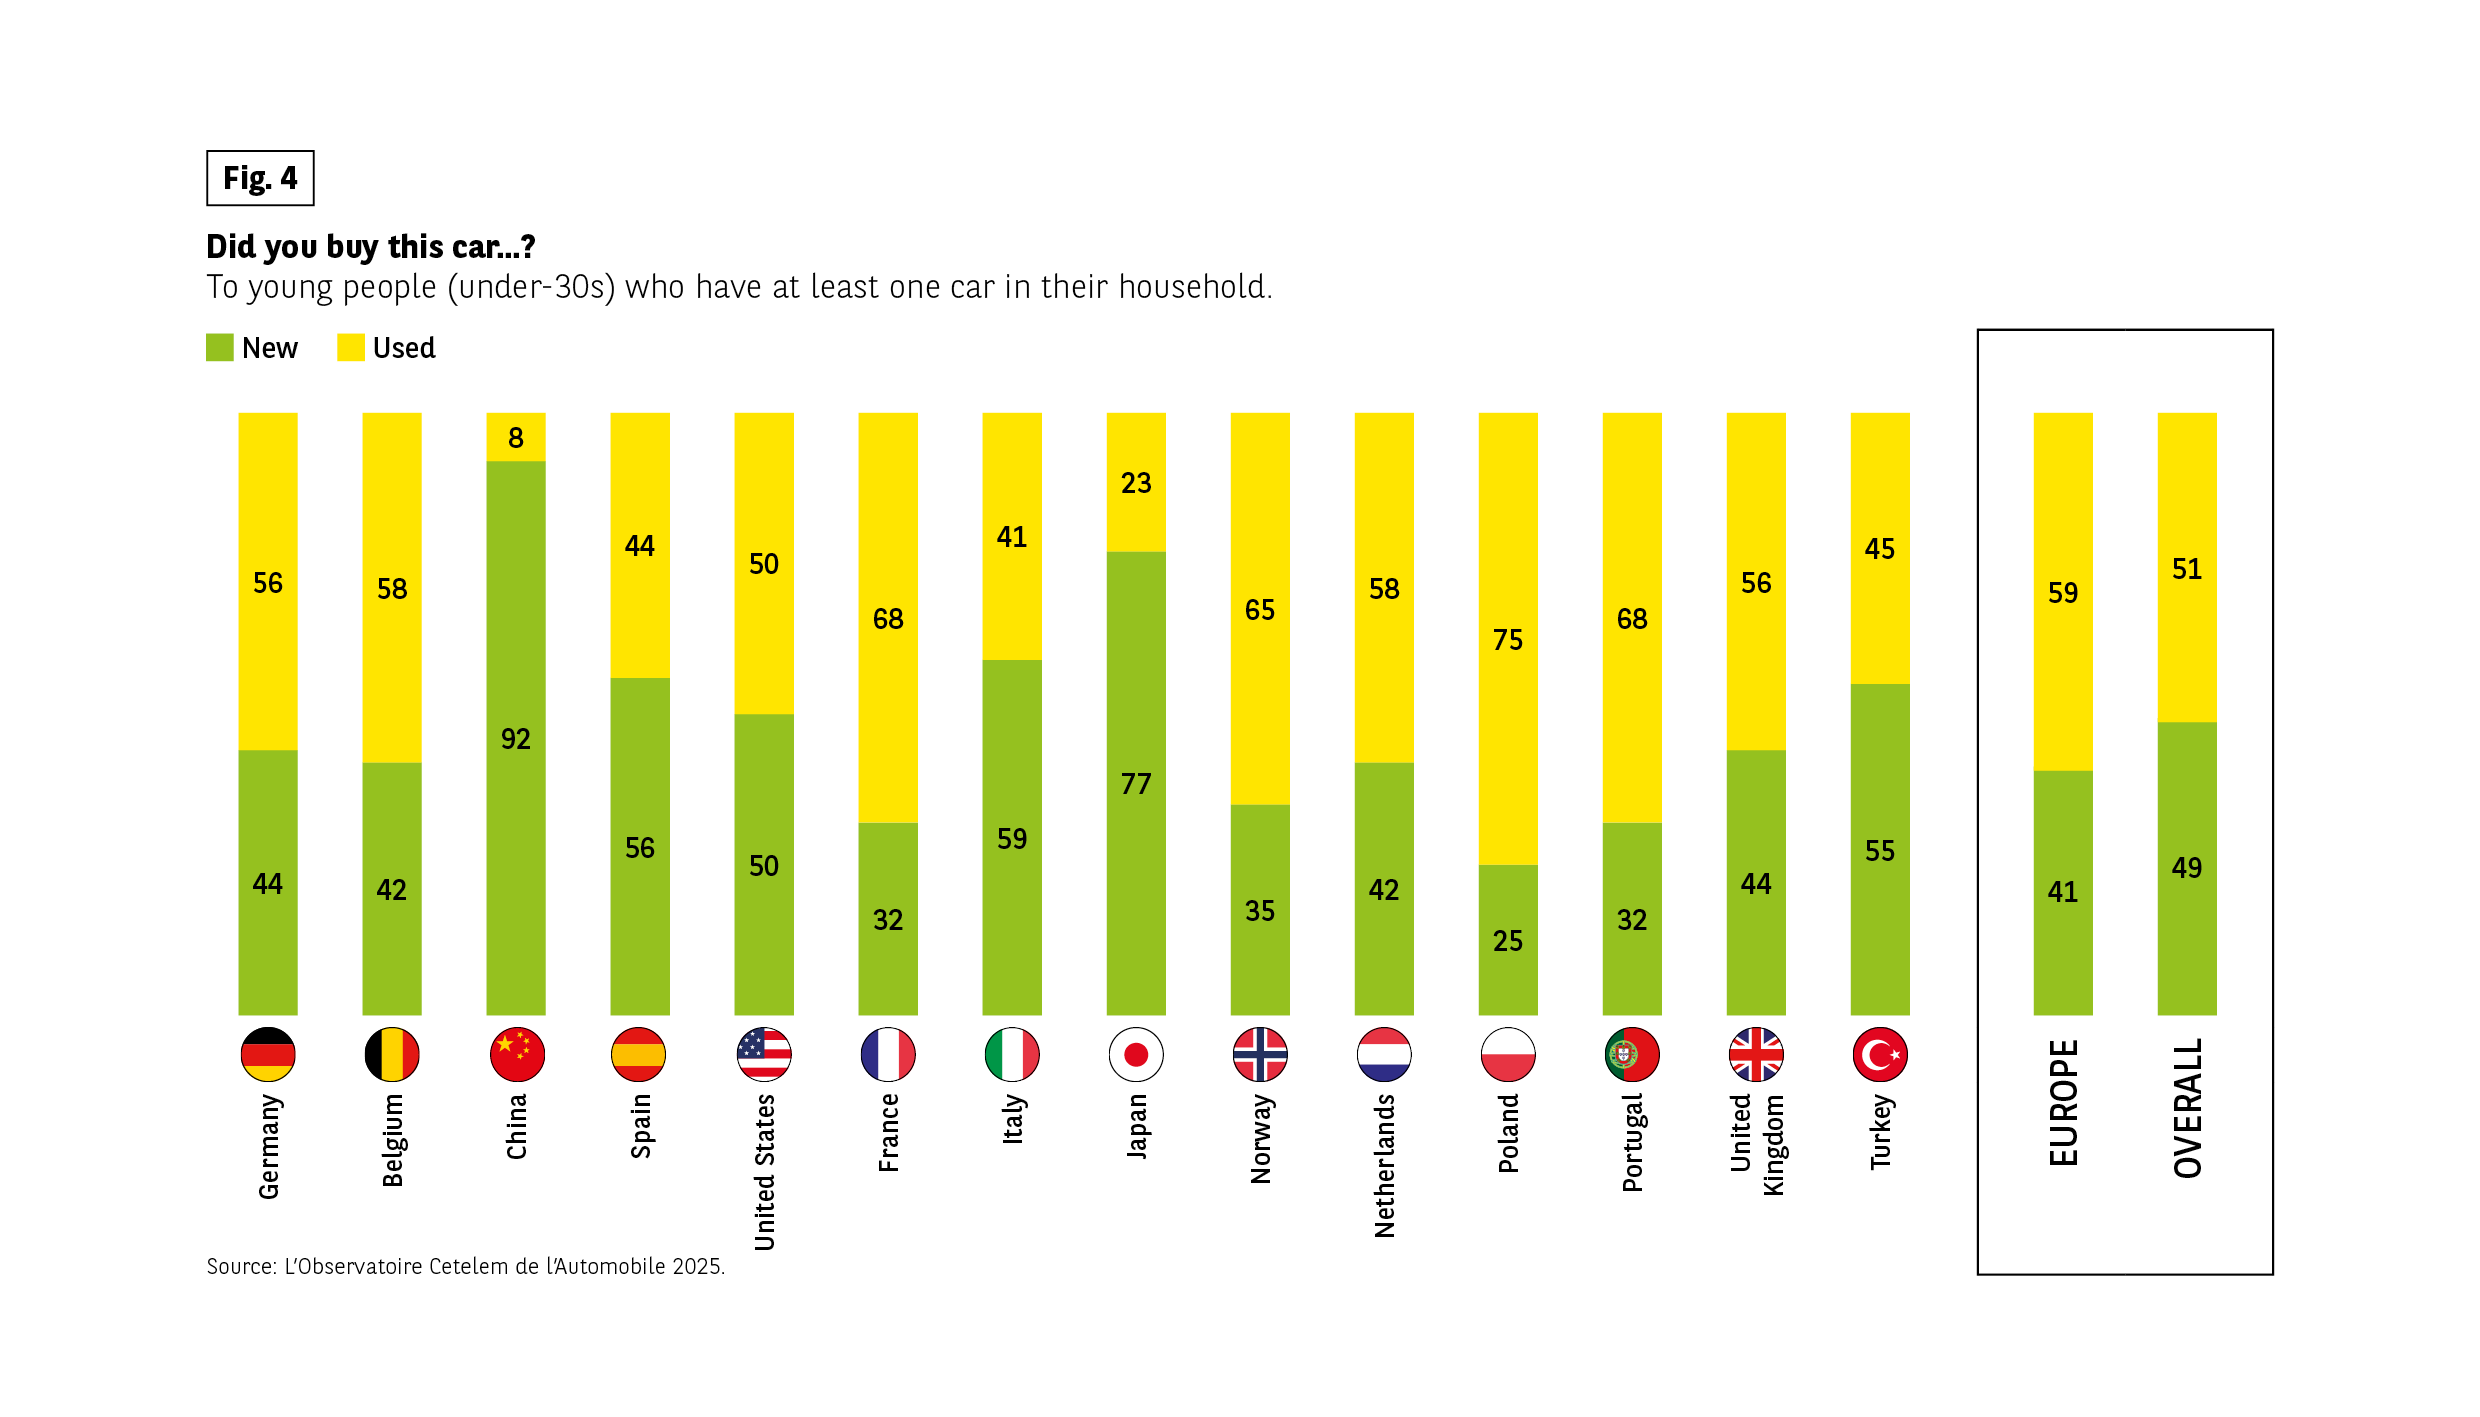 Bar chart showing the distribution between new and used cars among young people under 30 years old who have at least one car in their household. The shares of new cars are in yellow, and those of used cars are in green.
Data by country (new/used in %):
Germany: 56% new, 44% used
Belgium: 58%, 42%
China: 8%, 92% Spain: 44%, 56%
United States: 50%, 50%
France: 68%, 32%
Italy: 41%, 59%
Japan: 23%, 77%
Norway: 65%, 35%
Netherlands: 58%, 42%
Poland: 75%, 25%
Portugal: 68%, 32%
United Kingdom: 56%, 44%
Turkey: 45%, 55%
Europe (aggregated): 59%, 41%
Overall (world): 51%, 49%
General trend: most European countries have a majority of new cars among young people, while China stands out with a very high proportion of used vehicles (92%). Japan and Turkey also have a significant share of used cars.
Source: Cetelem Automobile Observatory 2025
Bar chart showing the distribution between new and used cars among young people under 30 years old who have at least one car in their household. The shares of new cars are in yellow, and those of used cars are in green.
Data by country (new/used in %):
Germany: 56% new, 44% used
Belgium: 58%, 42%
China: 8%, 92% Spain: 44%, 56%
United States: 50%, 50%
France: 68%, 32%
Italy: 41%, 59%
Japan: 23%, 77%
Norway: 65%, 35%
Netherlands: 58%, 42%
Poland: 75%, 25%
Portugal: 68%, 32%
United Kingdom: 56%, 44%
Turkey: 45%, 55%
Europe (aggregated): 59%, 41%
Overall (world): 51%, 49%
General trend: most European countries have a majority of new cars among young people, while China stands out with a very high proportion of used vehicles (92%). Japan and Turkey also have a significant share of used cars.
Source: Cetelem Automobile Observatory 2025
Fig 5 – Annual gross income of young people under 30 years old
Download this infographic for your presentations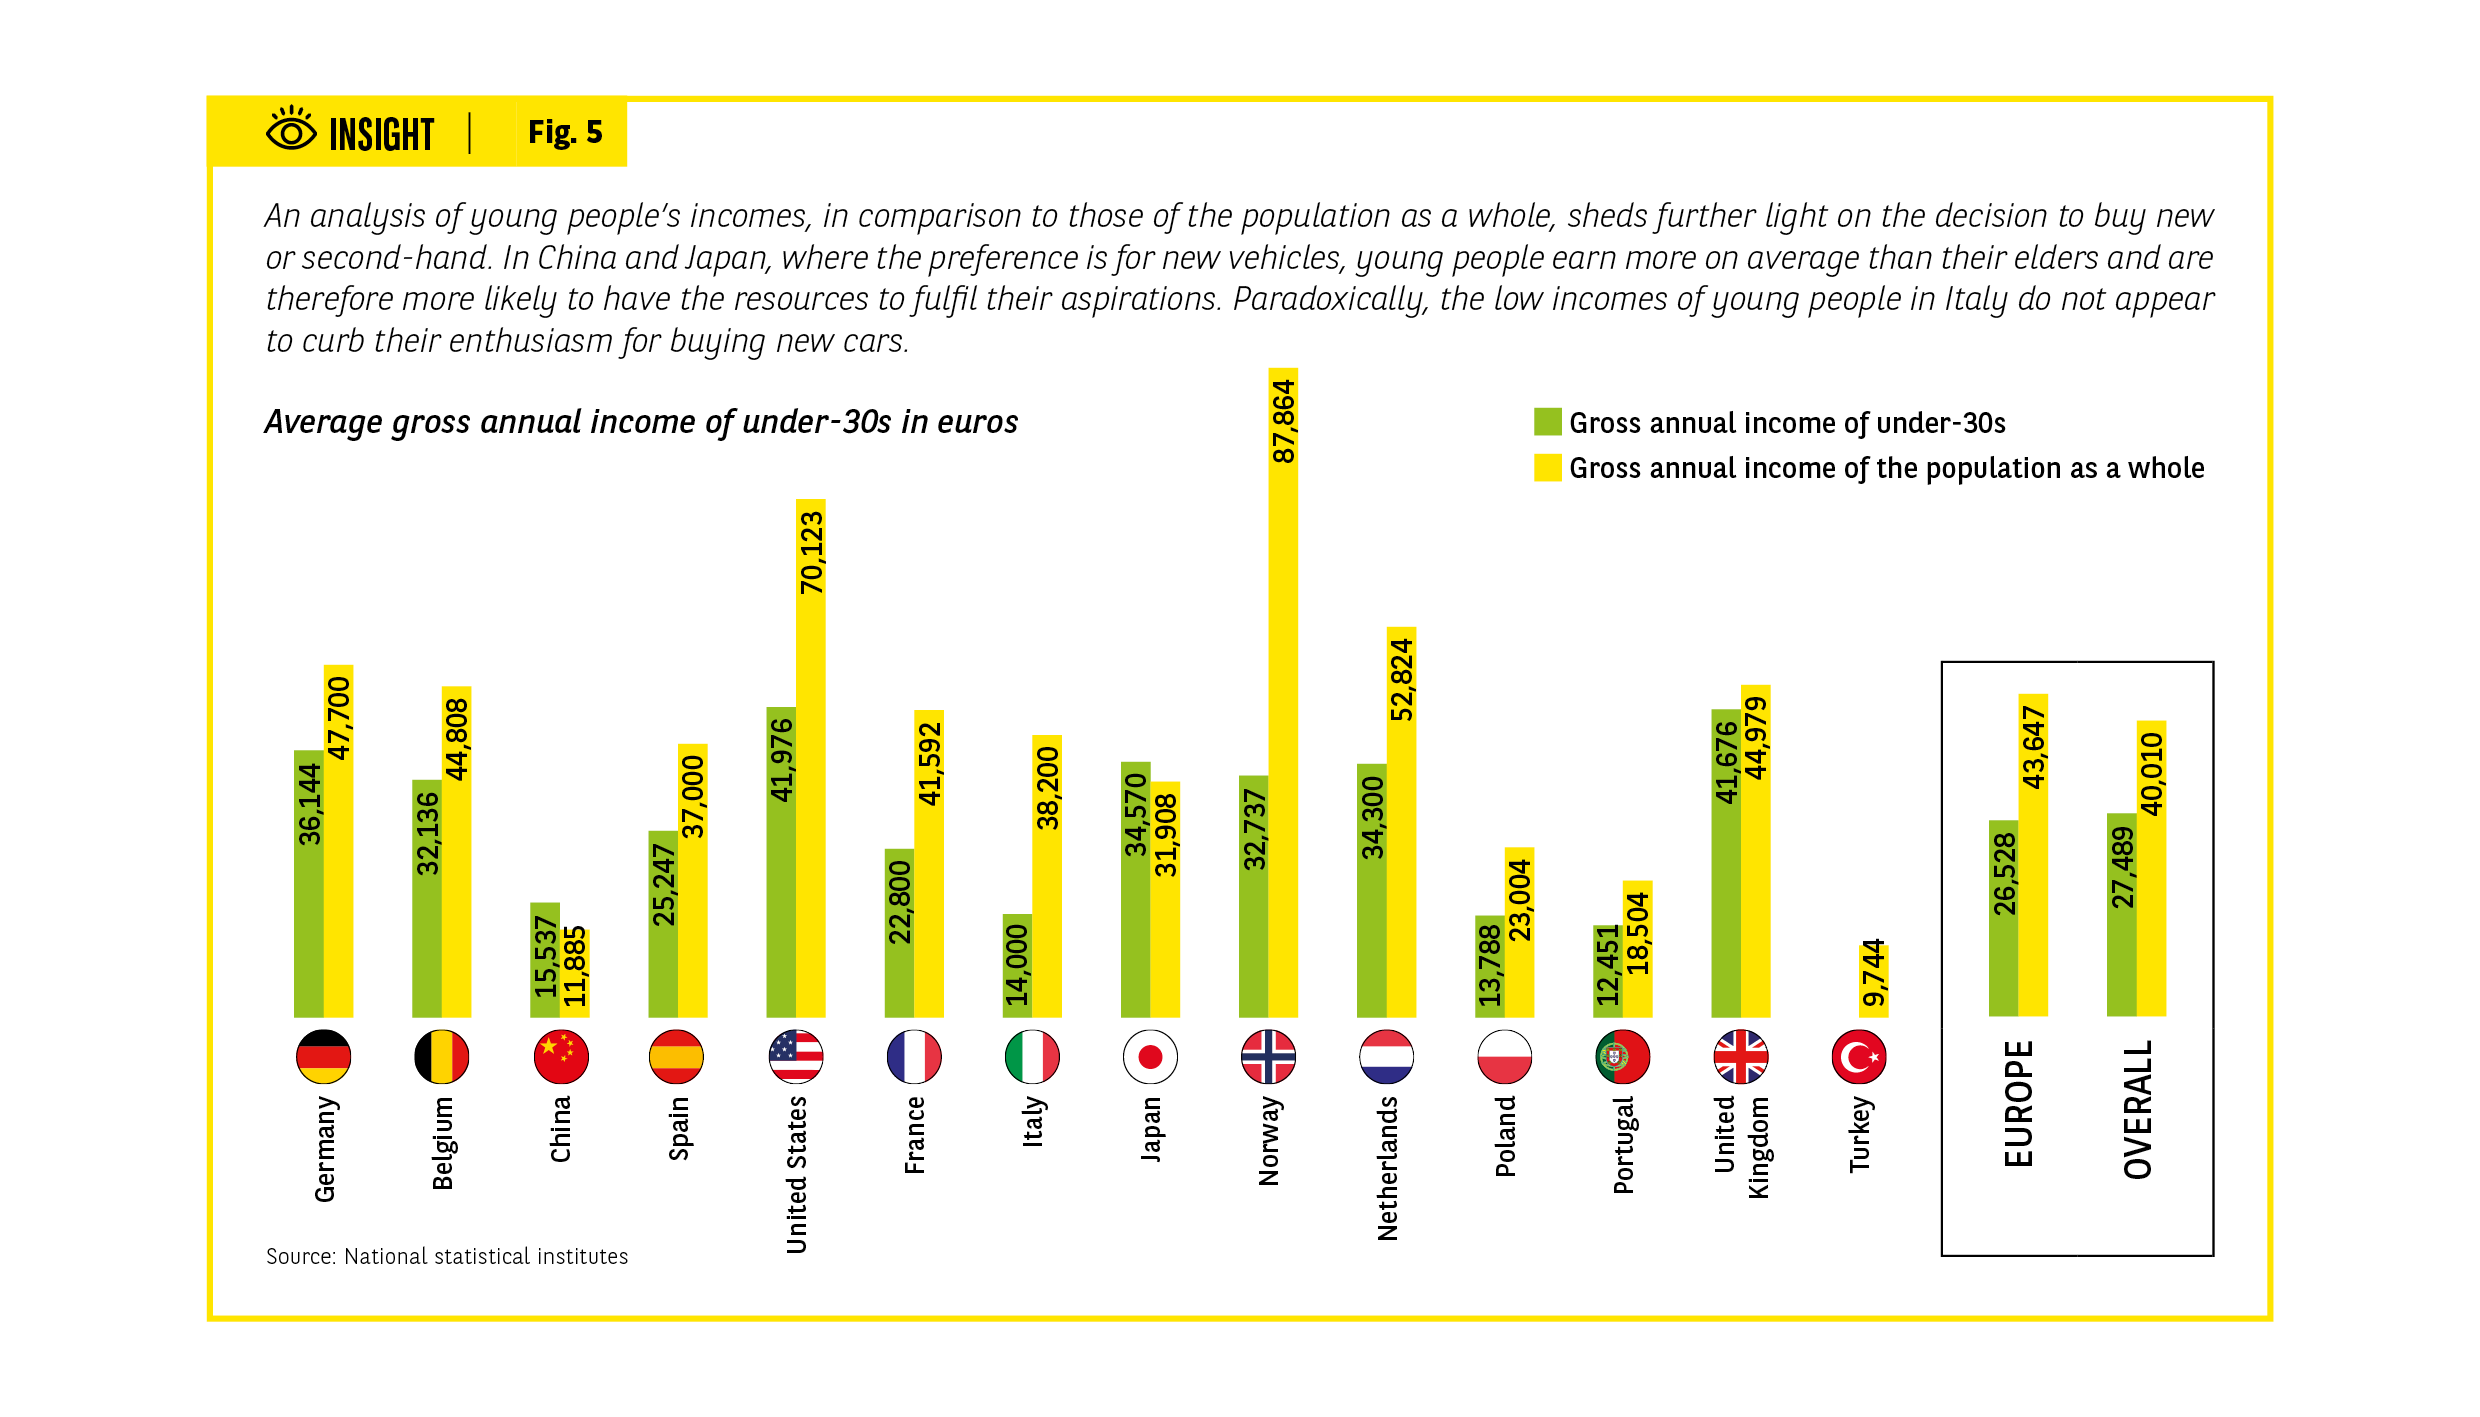 Infographic showing the average annual gross income of young people under 30 years old (green bars) and that of the overall population (yellow bars) in different countries. The data indicated are: Germany: €36,144 for young people and €47,700 for the overall population Belgium: €32,136 and €44,808 China: €15,537 and €11,885 Spain: €25,247 and €37,000 United States: €41,976 and €70,123 France: €22,800 and €41,592 Italy: €14,000 and €38,200 Japan: €34,570 and €31,908 Norway: €32,737 and €87,864 Netherlands: €34,300 and €52,824 Poland: €13,788 and €30,004 Portugal: €12,451 and €18,504 United Kingdom: €41,676 and €44,979 Turkey: €9,744 and no value displayed for the overall population
On the right, two averages are also indicated: Europe with €26,528 for young people and €43,647 for the total population; and Overall with €27,489 for young people and €40,010 for the overall population.
The text box at the top explains that these comparisons highlight the differences in purchasing power for a new or used vehicle according to the country.
Source: National statistical institutes
Infographic showing the average annual gross income of young people under 30 years old (green bars) and that of the overall population (yellow bars) in different countries. The data indicated are: Germany: €36,144 for young people and €47,700 for the overall population Belgium: €32,136 and €44,808 China: €15,537 and €11,885 Spain: €25,247 and €37,000 United States: €41,976 and €70,123 France: €22,800 and €41,592 Italy: €14,000 and €38,200 Japan: €34,570 and €31,908 Norway: €32,737 and €87,864 Netherlands: €34,300 and €52,824 Poland: €13,788 and €30,004 Portugal: €12,451 and €18,504 United Kingdom: €41,676 and €44,979 Turkey: €9,744 and no value displayed for the overall population
On the right, two averages are also indicated: Europe with €26,528 for young people and €43,647 for the total population; and Overall with €27,489 for young people and €40,010 for the overall population.
The text box at the top explains that these comparisons highlight the differences in purchasing power for a new or used vehicle according to the country.
Source: National statistical institutes
Fig 6 – Average purchase price of a vehicle by young people under 30 years old
Download this infographic for your presentations The infographic compares the average purchase price of a vehicle by young people under 30 years old who have at least one car in their household, with significant disparities between countries.
The average amounts indicated for each country are:
Germany: €16,659
Belgium: €14,499
China: €21,518
Spain: €15,625
United States: €19,360
France: €12,290
Italy: €14,952
Japan: €13,459
Norway: €18,552
Netherlands: €14,622
Poland: €3,381
Portugal: €14,271
United Kingdom: €14,999
Turkey: €14,143
The infographic also provides intermediate averages:
European average: €13,985
Overall average of the countries studied: €14,881
The visual highlights significant variations: China and Norway have the highest amounts, while Poland has by far the lowest amount. This dispersion illustrates the impact of national average incomes and purchasing practices (new or used) on the price of the vehicle acquired by young people.
The infographic compares the average purchase price of a vehicle by young people under 30 years old who have at least one car in their household, with significant disparities between countries.
The average amounts indicated for each country are:
Germany: €16,659
Belgium: €14,499
China: €21,518
Spain: €15,625
United States: €19,360
France: €12,290
Italy: €14,952
Japan: €13,459
Norway: €18,552
Netherlands: €14,622
Poland: €3,381
Portugal: €14,271
United Kingdom: €14,999
Turkey: €14,143
The infographic also provides intermediate averages:
European average: €13,985
Overall average of the countries studied: €14,881
The visual highlights significant variations: China and Norway have the highest amounts, while Poland has by far the lowest amount. This dispersion illustrates the impact of national average incomes and purchasing practices (new or used) on the price of the vehicle acquired by young people.
PRICE: THE MAIN OBSTACLE TO A PURCHASE
Financial constraints are the main hurdle for young people who have a driving licence, but have not yet acquired a vehicle. 6 out of 10 think cars cost too much, a significantly higher score than for seniors. This is a constraint that the Americans, Turks and Portuguese feel particularly keenly, while it is seen as less of a problem in Japan. The second most frequently mentioned factor is not having use for a car, with seniors most likely to make this point (4 out of 10 state that they can live without a vehicle). A much smaller proportion of young people with a licence but no car say that they don’t need a vehicle. Only just over a quarter make this argument (Fig. 7).
PURCHASING INTENTIONS ARE FAR FROM ELECTRIC
Young people’s short-term purchase intentions still reveal a preference for second-hand cars in a good half of cases. When it comes to choosing an energy source, EVs occupy the number two spot, behind petrol, but ahead of diesel, which remains the top choice in the 30-49 age group. The fact that the electric vehicle market is still relatively small partly explains this result.
And once again, price is not the main barrier preventing drivers from going electric. Young people are the first to mention the potential difficulties involved in charging an EV (32% vs. 31%). This is seen as a factor that could hinder their freedom to travel, which they consider precious and is a topic we will return to later. Vehicle range comes third in the list of constraints.
Seniors place more emphasis on price (50%), without neglecting the other two factors.
Fig 7 – Reasons for not having a car by age
Download this infographic for your presentations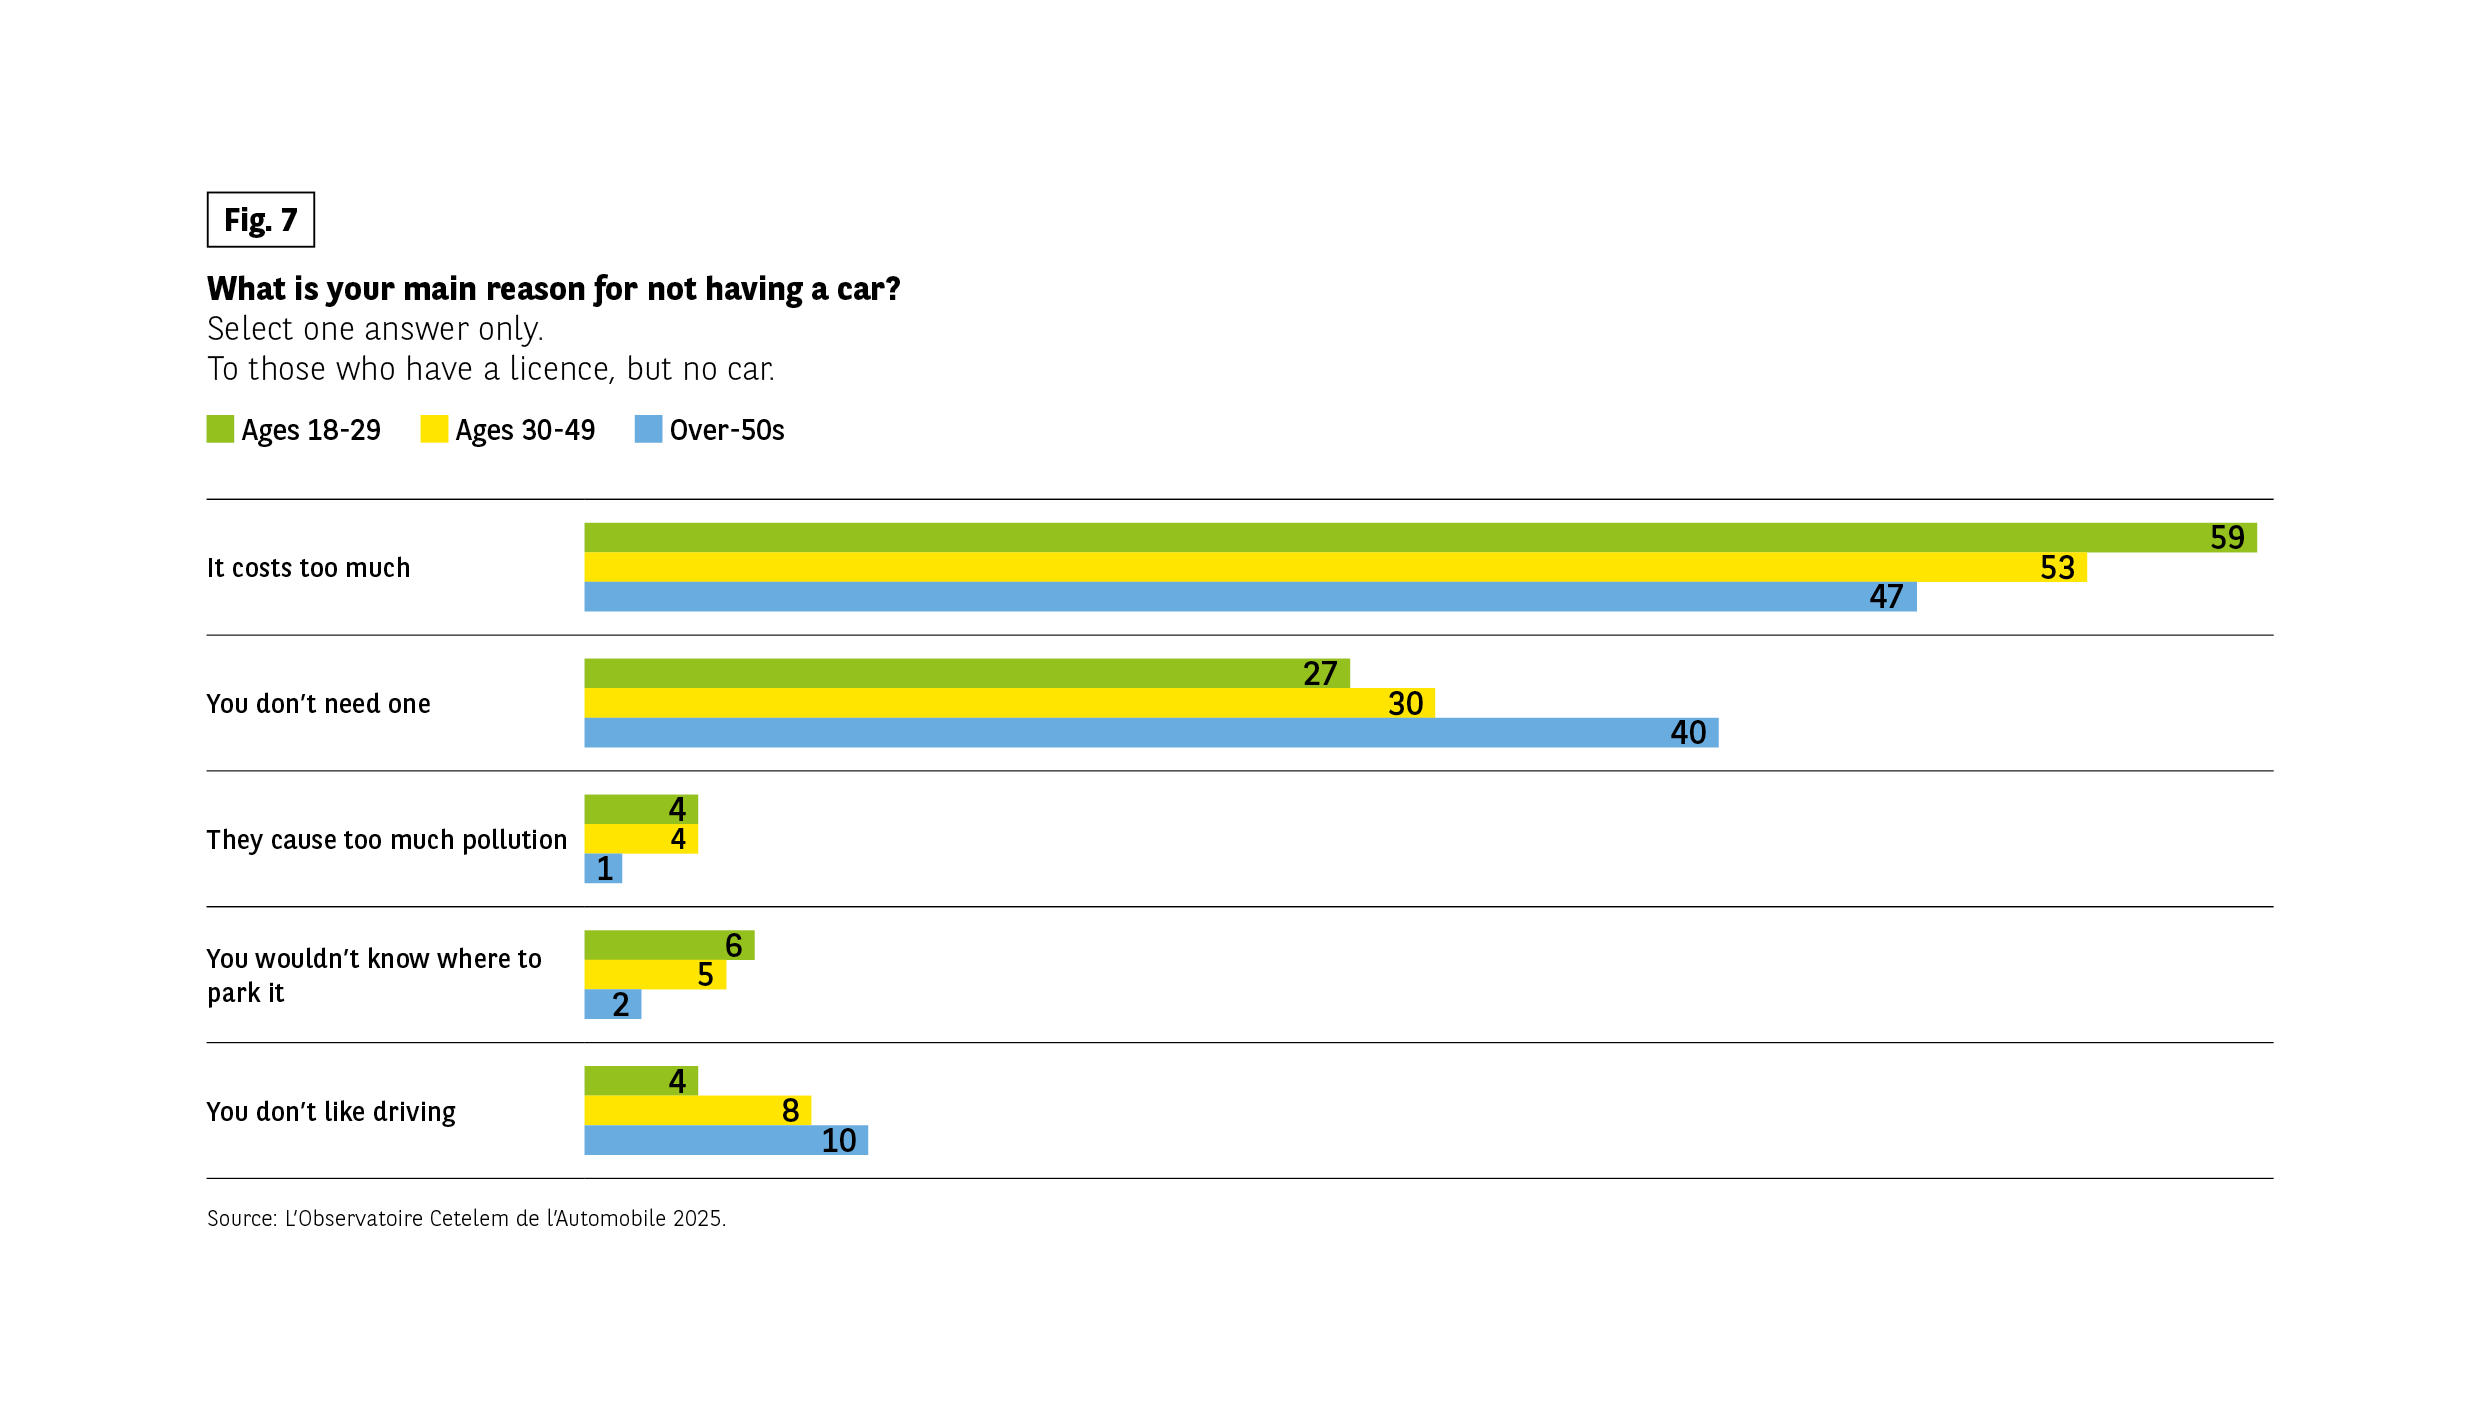 The infographic presents the responses to the question “What is the main reason you don’t have a car?”, asked to people who have a driver’s license but do not own a car; only one answer was possible. Three age groups are compared: 18-29 years old (response in green), 30-49 years old (response in yellow), and 50 years old and over (response in blue). The visual displays five possible reasons and, for each, the proportion of respondents by age.
The data indicated are:
It’s too expensive: 18-29 years old 59%, 30-49 years old 53%, 50 years old and over 47%
You don’t need one: 18-29 years old 27%, 30-49 years old 30%, 50 years old and over 40%
It’s a polluting means of transportation: 18-29 years old 4%, 30-49 years old 4%, 50 years old and over 1%
You don’t know where to park it: 18-29 years old 6%, 30-49 years old 5%, 50 years old and over 2%
You don’t like driving: 18-29 years old 4%, 30-49 years old 8%, 50 years old and over 10%
Overall, the cost appears as the dominant reason in the three age categories, although it is higher among young people. The absence of need increases with age, while reasons related to pollution, parking, or dislike of driving remain minority.
Source: Cetelem Automobile Observatory 2025
The infographic presents the responses to the question “What is the main reason you don’t have a car?”, asked to people who have a driver’s license but do not own a car; only one answer was possible. Three age groups are compared: 18-29 years old (response in green), 30-49 years old (response in yellow), and 50 years old and over (response in blue). The visual displays five possible reasons and, for each, the proportion of respondents by age.
The data indicated are:
It’s too expensive: 18-29 years old 59%, 30-49 years old 53%, 50 years old and over 47%
You don’t need one: 18-29 years old 27%, 30-49 years old 30%, 50 years old and over 40%
It’s a polluting means of transportation: 18-29 years old 4%, 30-49 years old 4%, 50 years old and over 1%
You don’t know where to park it: 18-29 years old 6%, 30-49 years old 5%, 50 years old and over 2%
You don’t like driving: 18-29 years old 4%, 30-49 years old 8%, 50 years old and over 10%
Overall, the cost appears as the dominant reason in the three age categories, although it is higher among young people. The absence of need increases with age, while reasons related to pollution, parking, or dislike of driving remain minority.
Source: Cetelem Automobile Observatory 2025