
A deceptive market


 5 min
reading time
5 min
reading time
Since the beginning of the 20th century, the automobile has established itself as one of the most powerful defining features of modern society. Beyond shaping the way we travel, work and consume—indeed, our whole way of life—it has transformed physical landscapes and reshaped the economies of many nations. However, the crisis that the sector has faced in Europe for several years is causing a profound shake-up. China, and Asia more broadly, now dominates the sector in terms of both sales and production. European countries appear to be bearing the brunt of this shift, unable—or perhaps unwilling—to strike back. For their part, motorists are coming to view the industry’s economic importance in a broader context, just as they no longer consider a vehicle’s country of manufacture to be a decisive purchasing factor.
A MISLEADING REBOUND
In recent years, the tectonic plates of the car registration landscape have shifted dramatically. As a consequence of the health crisis, sales of new passenger cars plummeted, falling from 64.8 million units in 2019 to 57.4 million in 2020 (Source: OICA). The market dipped across all countries, except in China where growth proved exponential within a first-time buyers’ market and backed by public policy support. In the years that followed, the global catch-up was more or less linear, culminating in 2025 with an automotive market in good health, showing strong resilience with 71 million units sold. However, this misleading picture masks significant disparities.
IS THE CHINESE MARKET REACHING ITS LIMITS?
Across the 13 markets (Germany, Belgium, China, Spain, United States, France, Italy, Japan, Netherlands, Poland, Portugal, United Kingdom, Turkey) studied by this Observatoire Cetelem, sales volumes reached 69.7 million new light vehicles (NLVs = passenger cars + light commercial vehicles) in 2025, 8.6% above the 2019 level (64.2 million). Yet this growth was driven almost entirely by China, which accounted for 34.4 million units (+33.3% vs 2019) and single-handedly represented nearly half of the total volumes across the 13 countries. Furthermore, China’s domestic engine is stalling. In the first half of 2026, sales of new light vehicles fell by 5.3%. For new passenger cars (NPCs) alone, the China Passenger Car Association (CPCA) lowered its annual forecast to approximately -14%, following a 20.2% drop in the first half of 2026. This slowdown points to saturation in the domestic market, which can no longer sustain the growth of the sector on its own. Against this backdrop, foreign brands, German manufacturers in particular, are losing ground. Meanwhile, Chinese carmakers are seeking new outlets to offset weakening domestic demand by boosting exports, particularly of electric vehicles. With the US market looking completely and permanently closed to them, they are turning firmly toward a Europe that offers less protection for its home market, despite the Industrial Accelerator Act currently under review in the European Parliament, as well as toward South America and South-West Asia.
IRA VS IAA
An eye for an eye
The Inflation Reduction Act (IRA) is protectionist US legislation passed in August 2022. Under the act, the federal government handed out around $390 billion in subsidies and tax credits over 10 years to businesses and individuals investing in clean energy (solar, wind) or buying an electric vehicle, provided a significant share of production (batteries, assembly, minerals) took place in the US. Since the One Big Beautiful Bill Act was signed into law by Trump on 4 July 2025, most of these incentives have been scrapped (with the EV tax credit ending on 30 September 2025), diminishing its pull factor. The Industrial Accelerator Act (IAA), proposed on 4 March 2026, seeks to apply a similar logic in Europe by favouring “Made in EU” production. It is currently under consideration by the European Parliament and has not yet been adopted.
SOLID US DEMAND, BUT FOR HOW LONG?
One need look no further than Europe to find the weak link in the recovery. The nine European countries covered in this Observatoire Cetelem study show a 17% drop in NLV sales between 2019 and 2025. The decline is slightly tempered when Turkey is included (-11% vs 2019). What is more, this average masks significant variations between markets regaining volume and those suffering severe drops. Germany, France, and Italy—continental Europe’s primary markets—remain stuck well below their 2019 levels.
The United Kingdom, the fourth major market, likewise remains below its pre-Covid figures; however, it appears to be turning the corner, recording volume growth in 2025 as well as in the first half of 2026. In the South, Spain stands at -9% but remains on a recovery trajectory (+12% in 2025 and +6% in the first half of 2026), while Portugal has successfully closed the gap with 2019. Poland is the only genuinely dynamic market in the European sample, standing 8% above its pre-Covid level, though its vehicle ownership rate remains lower than that of Western Europe.
Fig. 1 – Annual sales of passenger vehicles between 2019 and 2025
Download this infographic for your presentations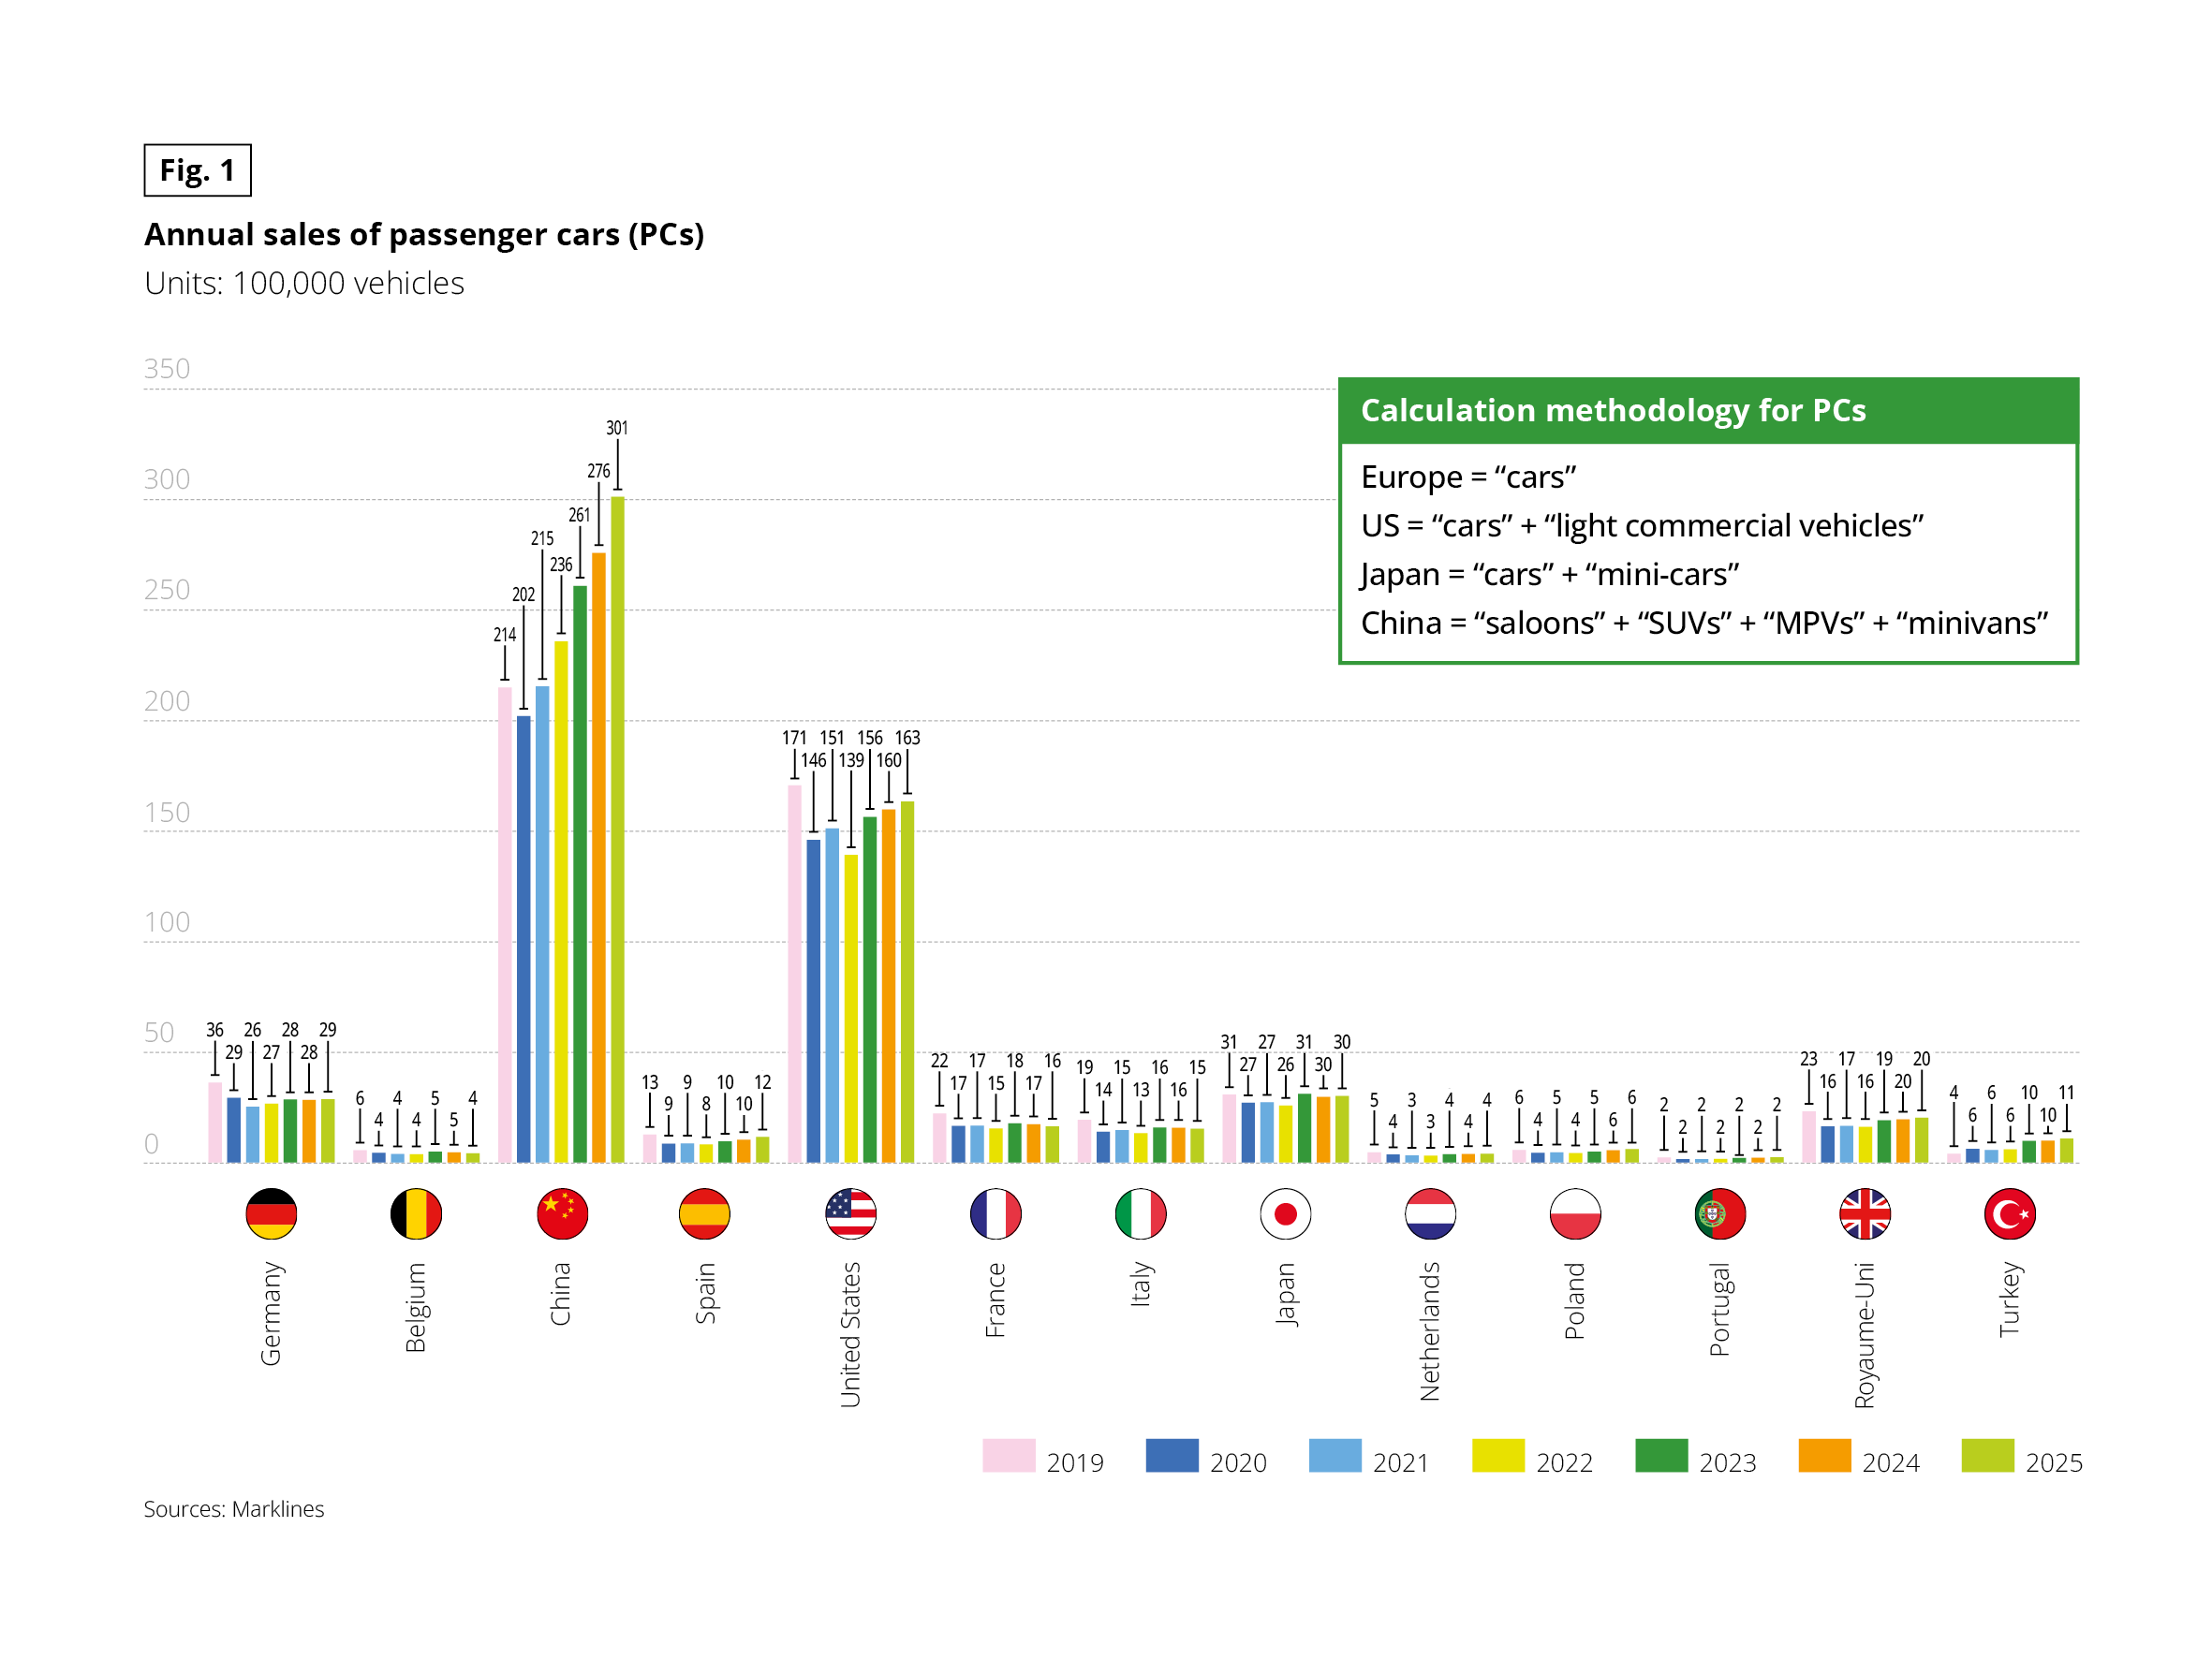 Grouped bar chart showing annual passenger car sales in 13 countries from 2019 to 2025. Unit: 100,000 vehicles (so 36 means 3.6 million). Source: Marklines. A text box explains the calculation methodology for PCs:
• Europe: “cars”.
• US: “cars” + “light commercial vehicles”.
• Japan: “cars” + “mini-cars”.
• China: “saloons” + “SUVs” + “MPVs” + “minivans”.
Values for 2019, 2020, 2021, 2022, 2023, 2024 then 2025:
• Germany: 36, 29, 26, 27, 28, 28, 29
• Belgium: 6, 4, 4, 4, 5, 5, 4
• China: 214, 202, 215, 236, 261, 276, 301
• Spain: 13, 9, 9, 8, 10, 10, 12
• United States: 171, 146, 151, 139, 156, 160, 163
• France: 22, 17, 17, 15, 18, 17, 16
• Italy: 19, 14, 15, 13, 16, 16, 15
• Japan: 31, 27, 27, 26, 31, 30, 30
• Netherlands: 5, 4, 3, 3, 4, 4, 4
• Poland: 6, 4, 5, 4, 5, 6, 6
• Portugal: 2 in every year
• United Kingdom: 23, 16, 17, 16, 19, 20, 20
• Turkey: 4, 6, 6, 6, 10, 10, 11
Key takeaways: China and the United States are far ahead of all other markets. Chinese sales rise from 214 to 301, while US sales fall from 171 to 163. Most European markets are below their 2019 level in 2025 (Germany, France, Italy, Belgium). Turkey grows from 4 to 11.
Grouped bar chart showing annual passenger car sales in 13 countries from 2019 to 2025. Unit: 100,000 vehicles (so 36 means 3.6 million). Source: Marklines. A text box explains the calculation methodology for PCs:
• Europe: “cars”.
• US: “cars” + “light commercial vehicles”.
• Japan: “cars” + “mini-cars”.
• China: “saloons” + “SUVs” + “MPVs” + “minivans”.
Values for 2019, 2020, 2021, 2022, 2023, 2024 then 2025:
• Germany: 36, 29, 26, 27, 28, 28, 29
• Belgium: 6, 4, 4, 4, 5, 5, 4
• China: 214, 202, 215, 236, 261, 276, 301
• Spain: 13, 9, 9, 8, 10, 10, 12
• United States: 171, 146, 151, 139, 156, 160, 163
• France: 22, 17, 17, 15, 18, 17, 16
• Italy: 19, 14, 15, 13, 16, 16, 15
• Japan: 31, 27, 27, 26, 31, 30, 30
• Netherlands: 5, 4, 3, 3, 4, 4, 4
• Poland: 6, 4, 5, 4, 5, 6, 6
• Portugal: 2 in every year
• United Kingdom: 23, 16, 17, 16, 19, 20, 20
• Turkey: 4, 6, 6, 6, 10, 10, 11
Key takeaways: China and the United States are far ahead of all other markets. Chinese sales rise from 214 to 301, while US sales fall from 171 to 163. Most European markets are below their 2019 level in 2025 (Germany, France, Italy, Belgium). Turkey grows from 4 to 11.
Fig. 2 – Variation in passenger car sales between 2019 and 2025 in 9 European countries
Download this infographic for your presentations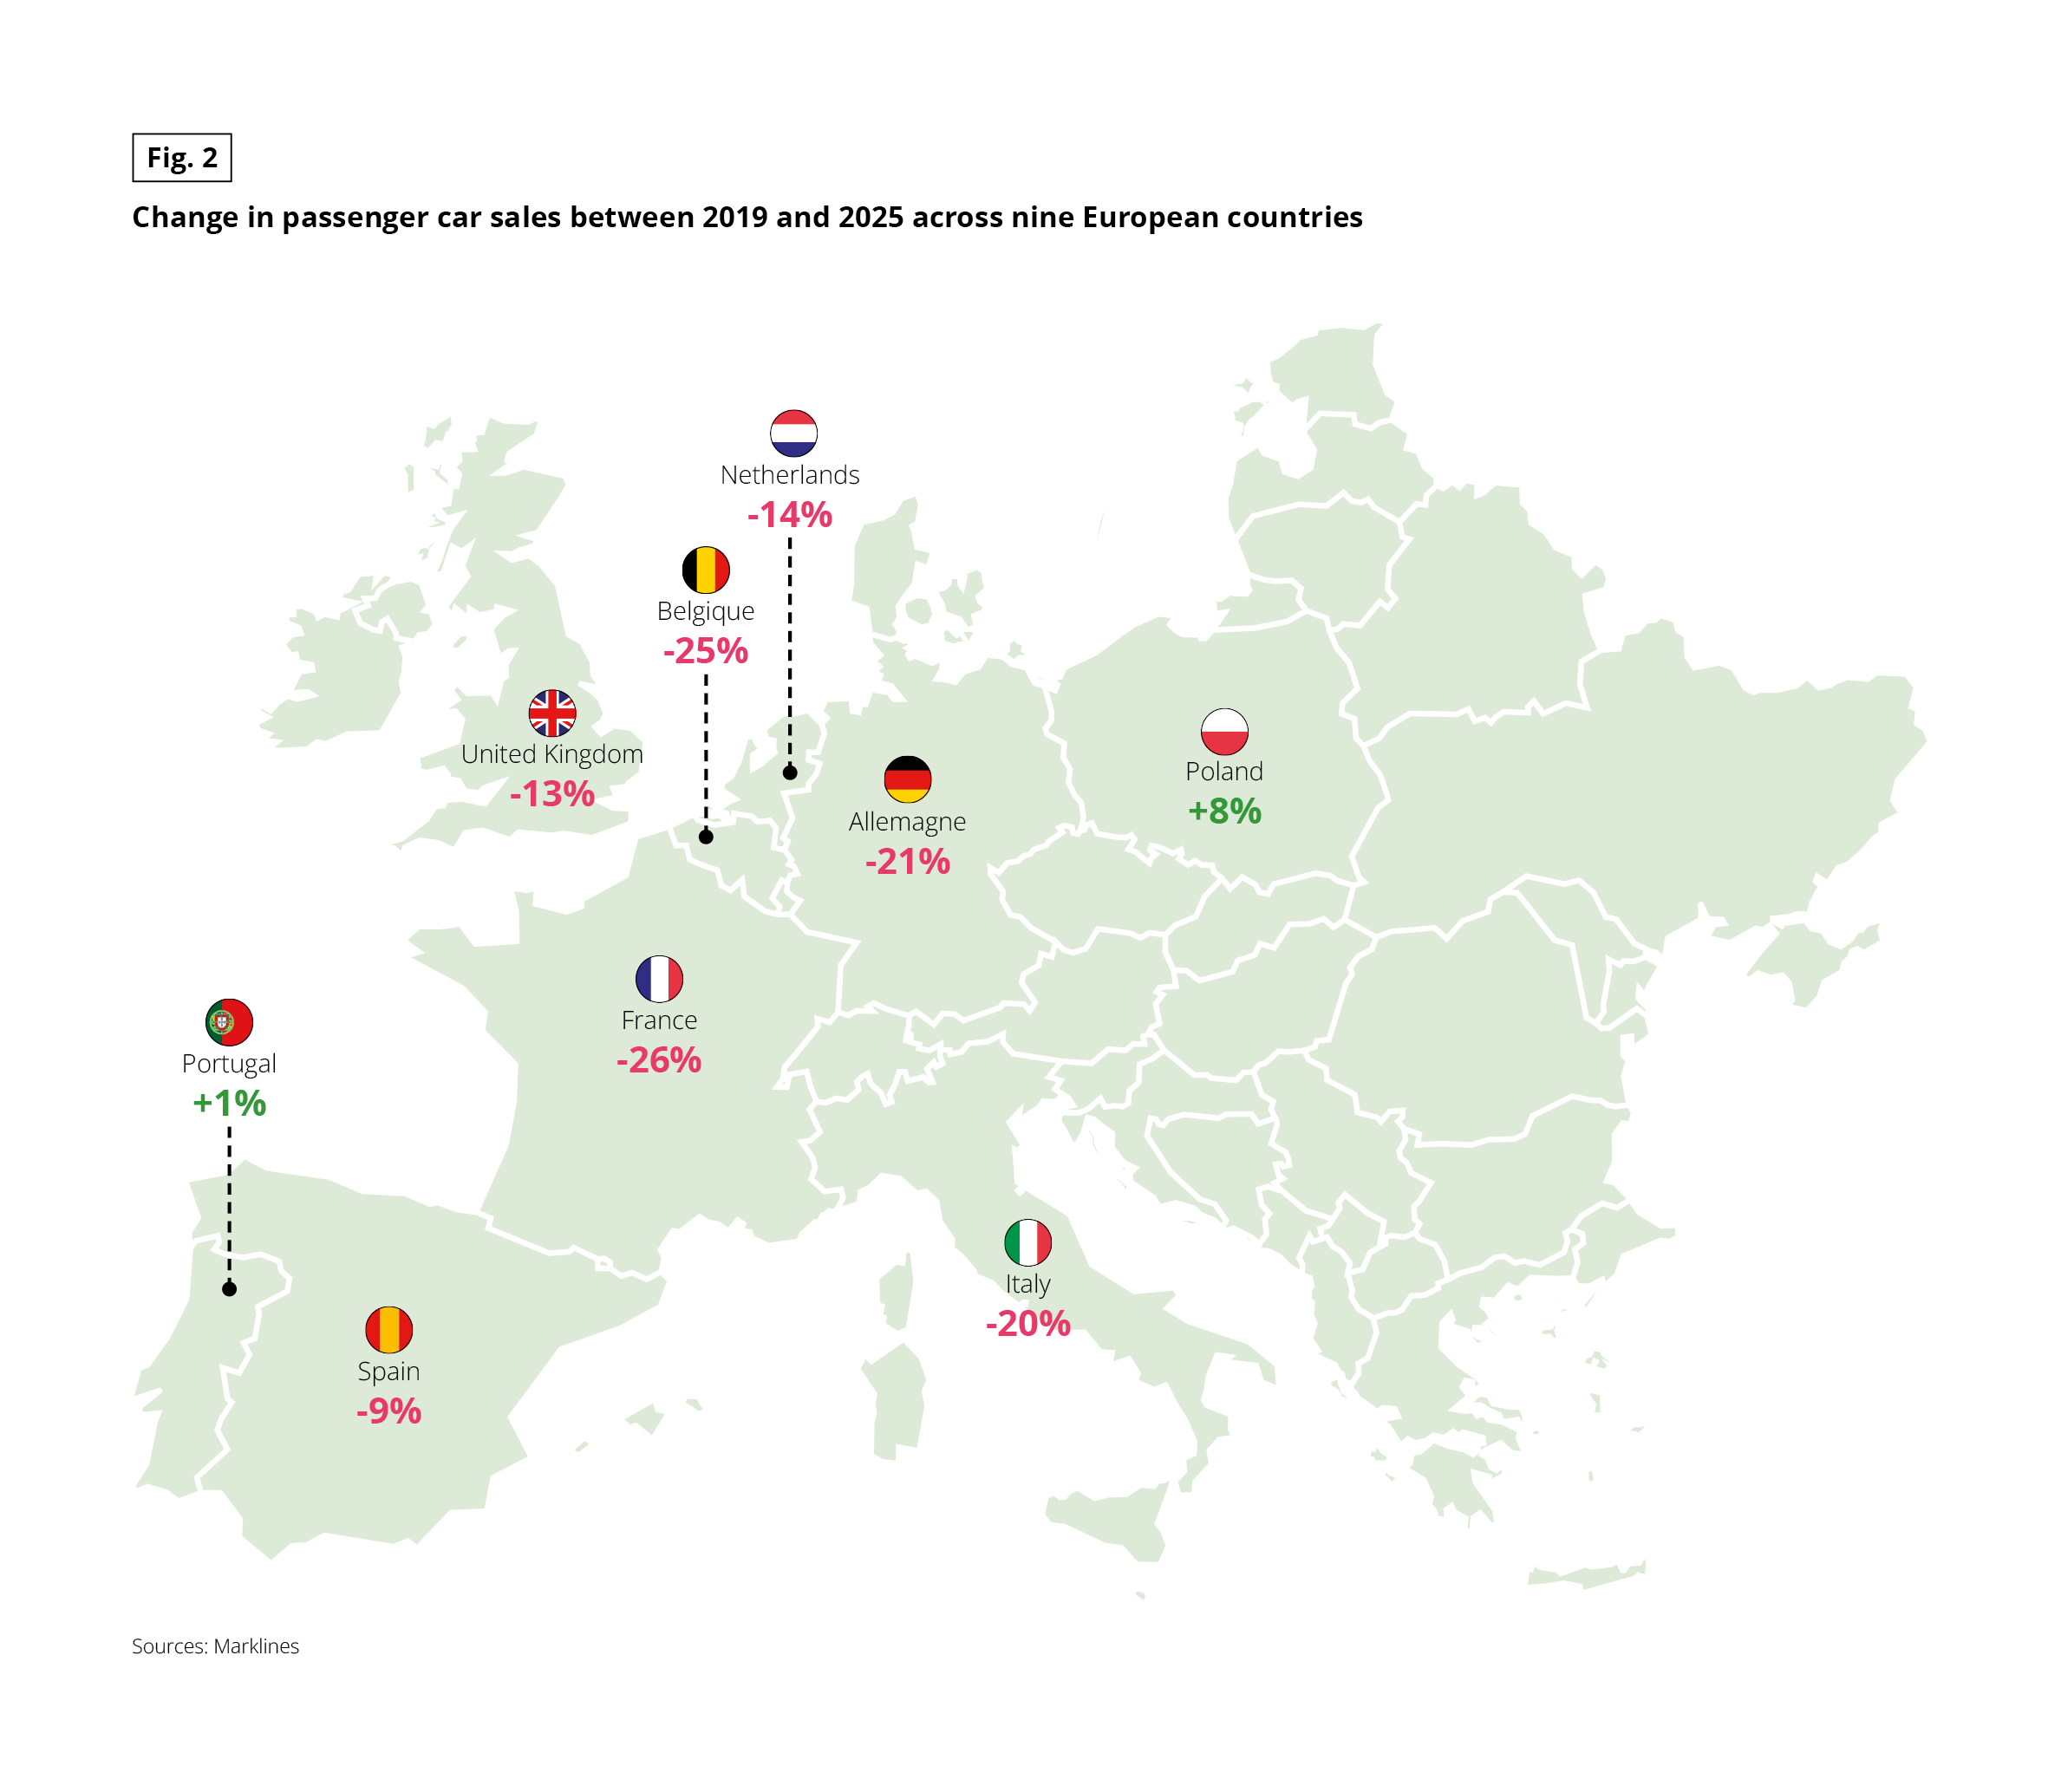 Map of Europe showing, for nine countries, the percentage change in passenger car sales between 2019 and 2025. Source: Marklines.
Seven countries are down, from the largest fall to the smallest:
• France: −26%
• Belgium: −25%
• Germany: −21%
• Italy: −20%
• Netherlands: −14%
• United Kingdom: −13%
• Spain: −9%
Two countries are up:
• Poland: +8%
• Portugal: +1%
Map of Europe showing, for nine countries, the percentage change in passenger car sales between 2019 and 2025. Source: Marklines.
Seven countries are down, from the largest fall to the smallest:
• France: −26%
• Belgium: −25%
• Germany: −21%
• Italy: −20%
• Netherlands: −14%
• United Kingdom: −13%
• Spain: −9%
Two countries are up:
• Poland: +8%
• Portugal: +1%
FAR FROM QUIET ON THE EASTERN FRONT
Fig. 3 – Annual production of passenger vehicles between 2019 and 2025 (in millions of vehicles)
Download this infographic for your presentations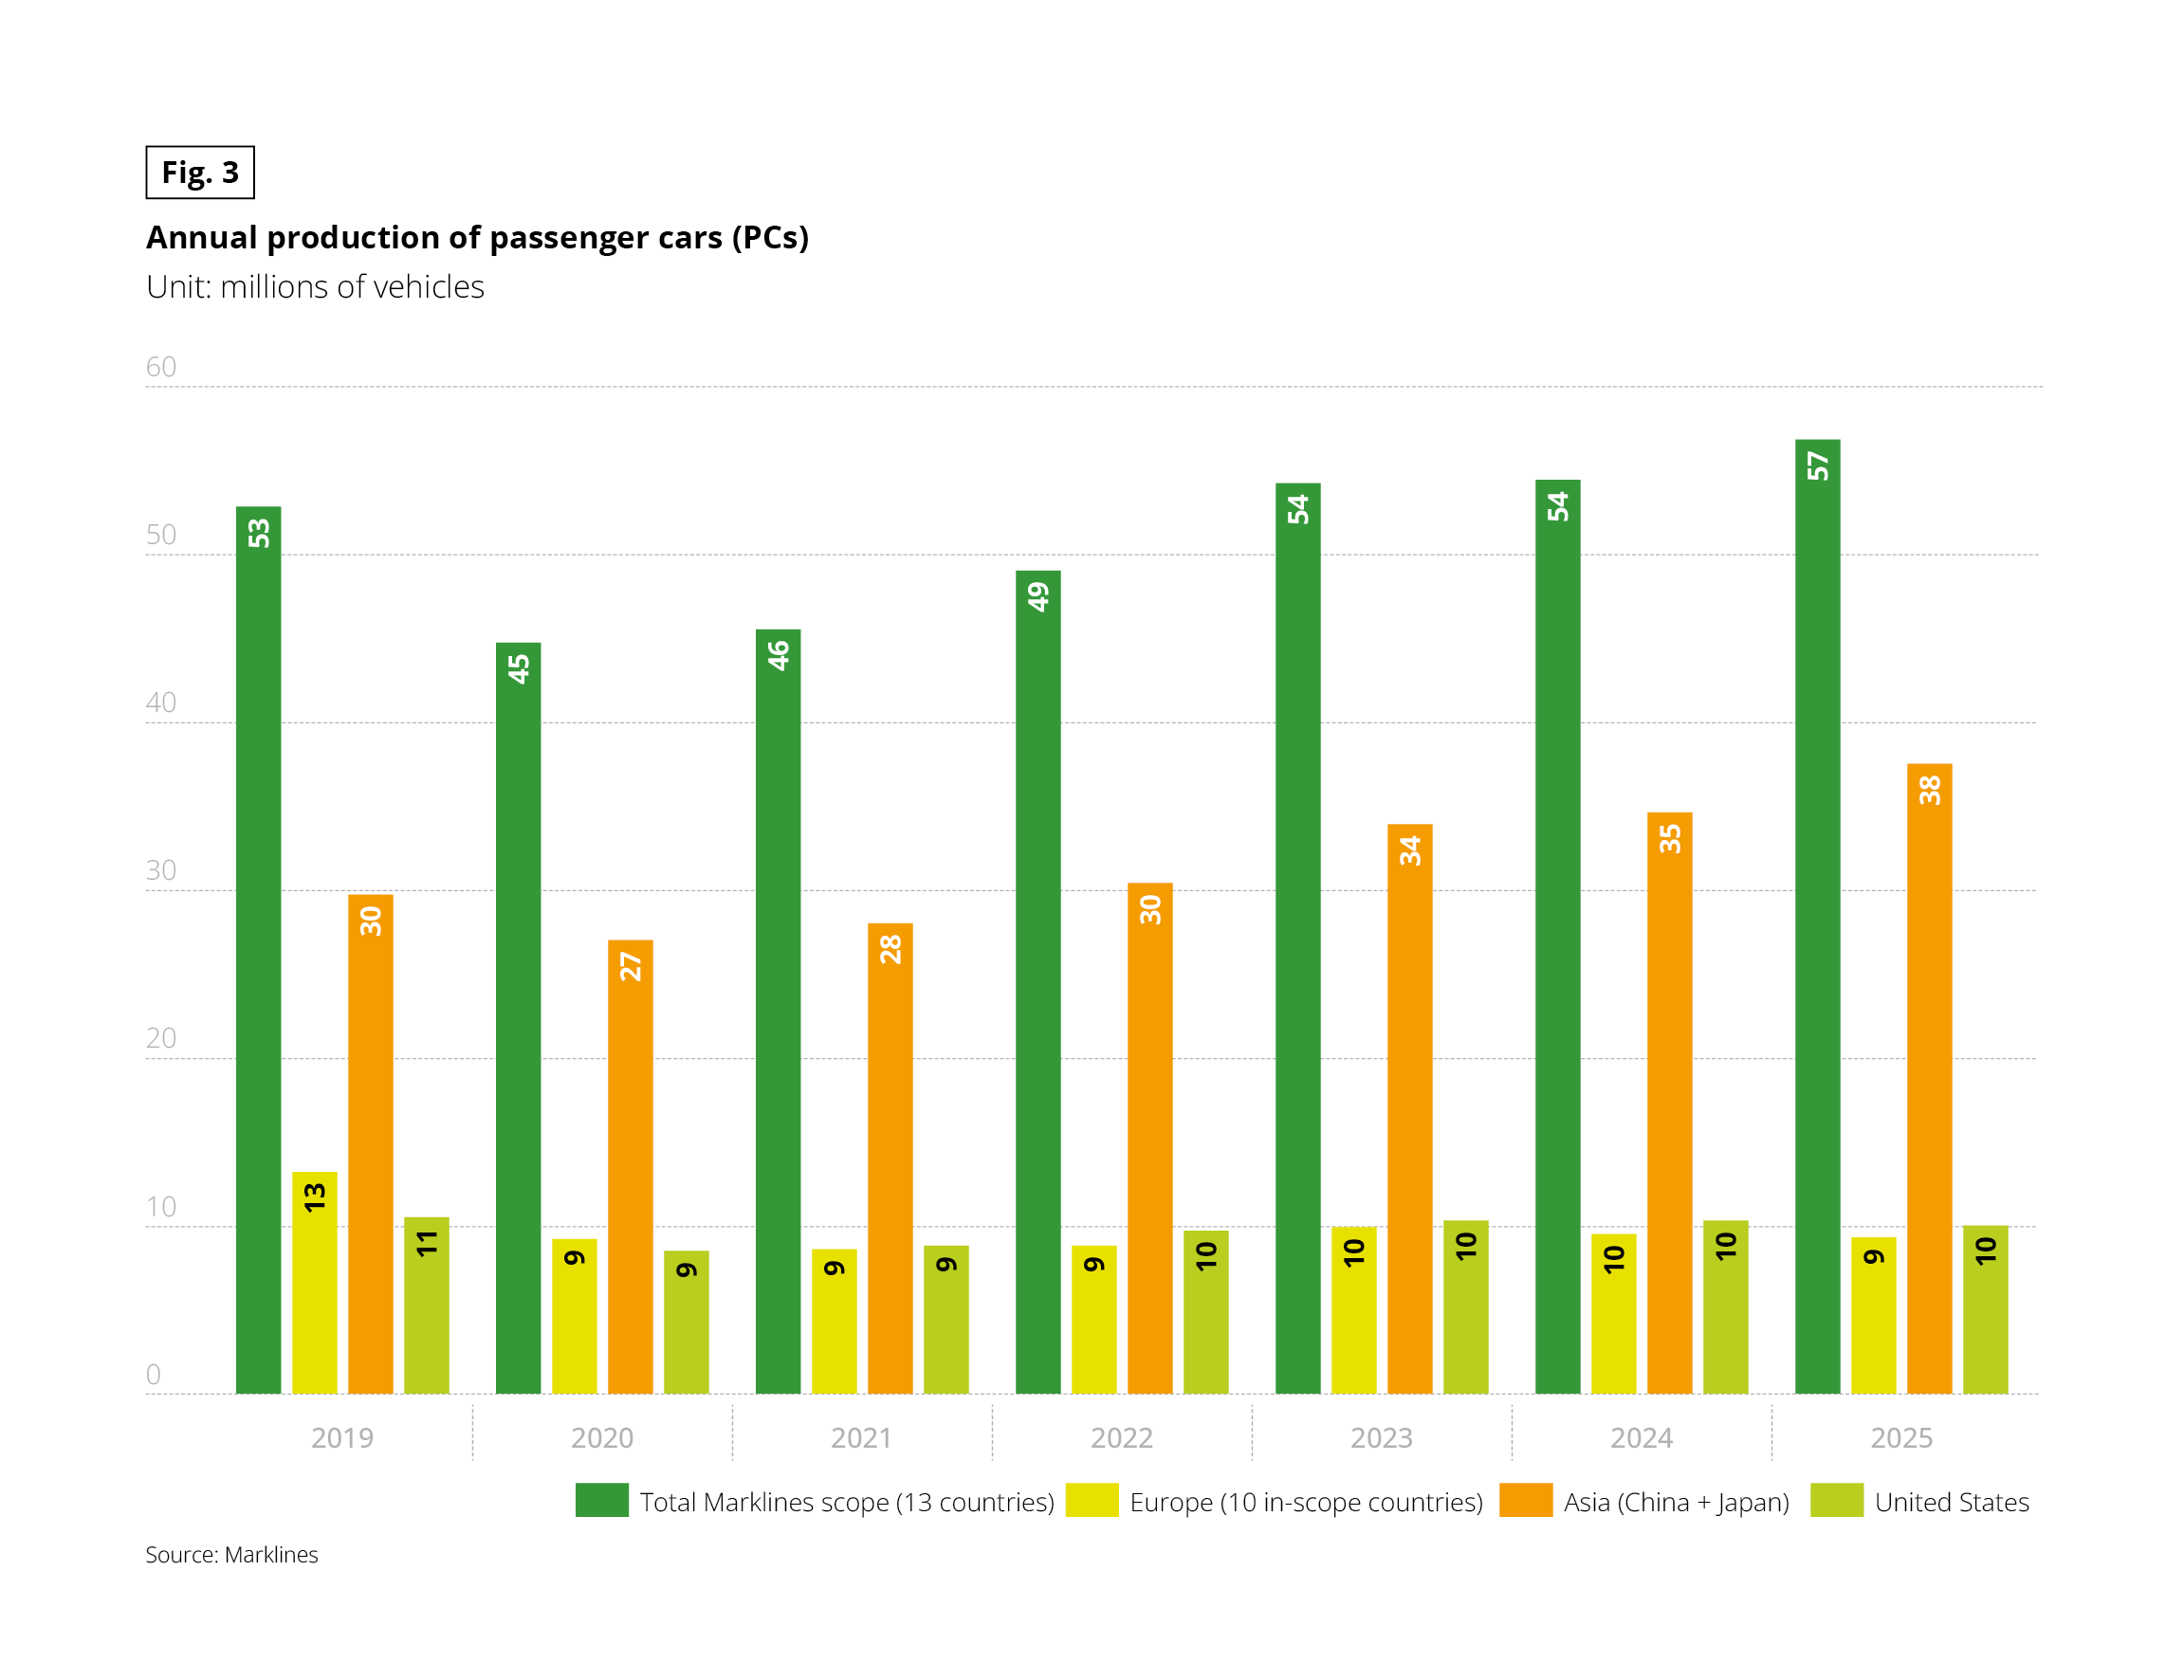 Grouped bar chart showing annual passenger car production from 2019 to 2025, in millions of
vehicles. Source: Marklines. Four series: total Marklines scope (13 countries), Europe (10 in-scope countries), Asia (China + Japan) and United States.
Values for 2019, 2020, 2021, 2022, 2023, 2024 then 2025:
Total Marklines scope (13 countries): 53, 45, 46, 49, 54, 54, 57
• Europe (10 in-scope countries): 13, 9, 9, 9, 10, 10, 9
• Asia (China + Japan): 30, 27, 28, 30, 34, 35, 38
• United States: 11, 9, 9, 10, 10, 10, 10
Key takeaways: the total drops in 2020 (45), exceeds its 2019 level from 2023 (54) and reaches 57 in 2025. The growth comes from Asia (30 to 38). Europe (13 to 9) and the United States (11 to 10) are stable or lower.
Grouped bar chart showing annual passenger car production from 2019 to 2025, in millions of
vehicles. Source: Marklines. Four series: total Marklines scope (13 countries), Europe (10 in-scope countries), Asia (China + Japan) and United States.
Values for 2019, 2020, 2021, 2022, 2023, 2024 then 2025:
Total Marklines scope (13 countries): 53, 45, 46, 49, 54, 54, 57
• Europe (10 in-scope countries): 13, 9, 9, 9, 10, 10, 9
• Asia (China + Japan): 30, 27, 28, 30, 34, 35, 38
• United States: 11, 9, 9, 10, 10, 10, 10
Key takeaways: the total drops in 2020 (45), exceeds its 2019 level from 2023 (54) and reaches 57 in 2025. The growth comes from Asia (30 to 38). Europe (13 to 9) and the United States (11 to 10) are stable or lower.
INDIA AND BRAZIL ON A ROLL
Lying outside the scope of this Observatoire Cetelem report, two major emerging markets, India and Brazil, posted NLV volume growth of 4% (4.4 million units) and 2% (2 million units) respectively in 2025 compared to 2024. The first half of 2026 looks set to be far more dynamic still, with registration growth reaching 24% in Brazil and 17% in India. All of which points towards an excellent 2026.
SHIELDING DOMESTIC MARKETS
The reasons for Asia’s success are manifold. The sheer size of the Chinese market, whose rapid expansion is still very recent, is one. The capacity for innovation, demonstrated, for instance, by Toyota’s mass-market launch of the first hybrid vehicle in 1997, is another. However, one cannot overlook a series of policy measures, particularly in China, that indirectly confer a clear competitive advantage on domestic brands. This proactivity leaves European countries largely failing to respond and, ultimately, empty-handed. The adoption of the IAA, and the potential alignment of public policies with new criteria, could once again reshape market dynamics.
Fig. 4 – Comparison of national protectionist measures in the automotive industry
Download this infographic for your presentations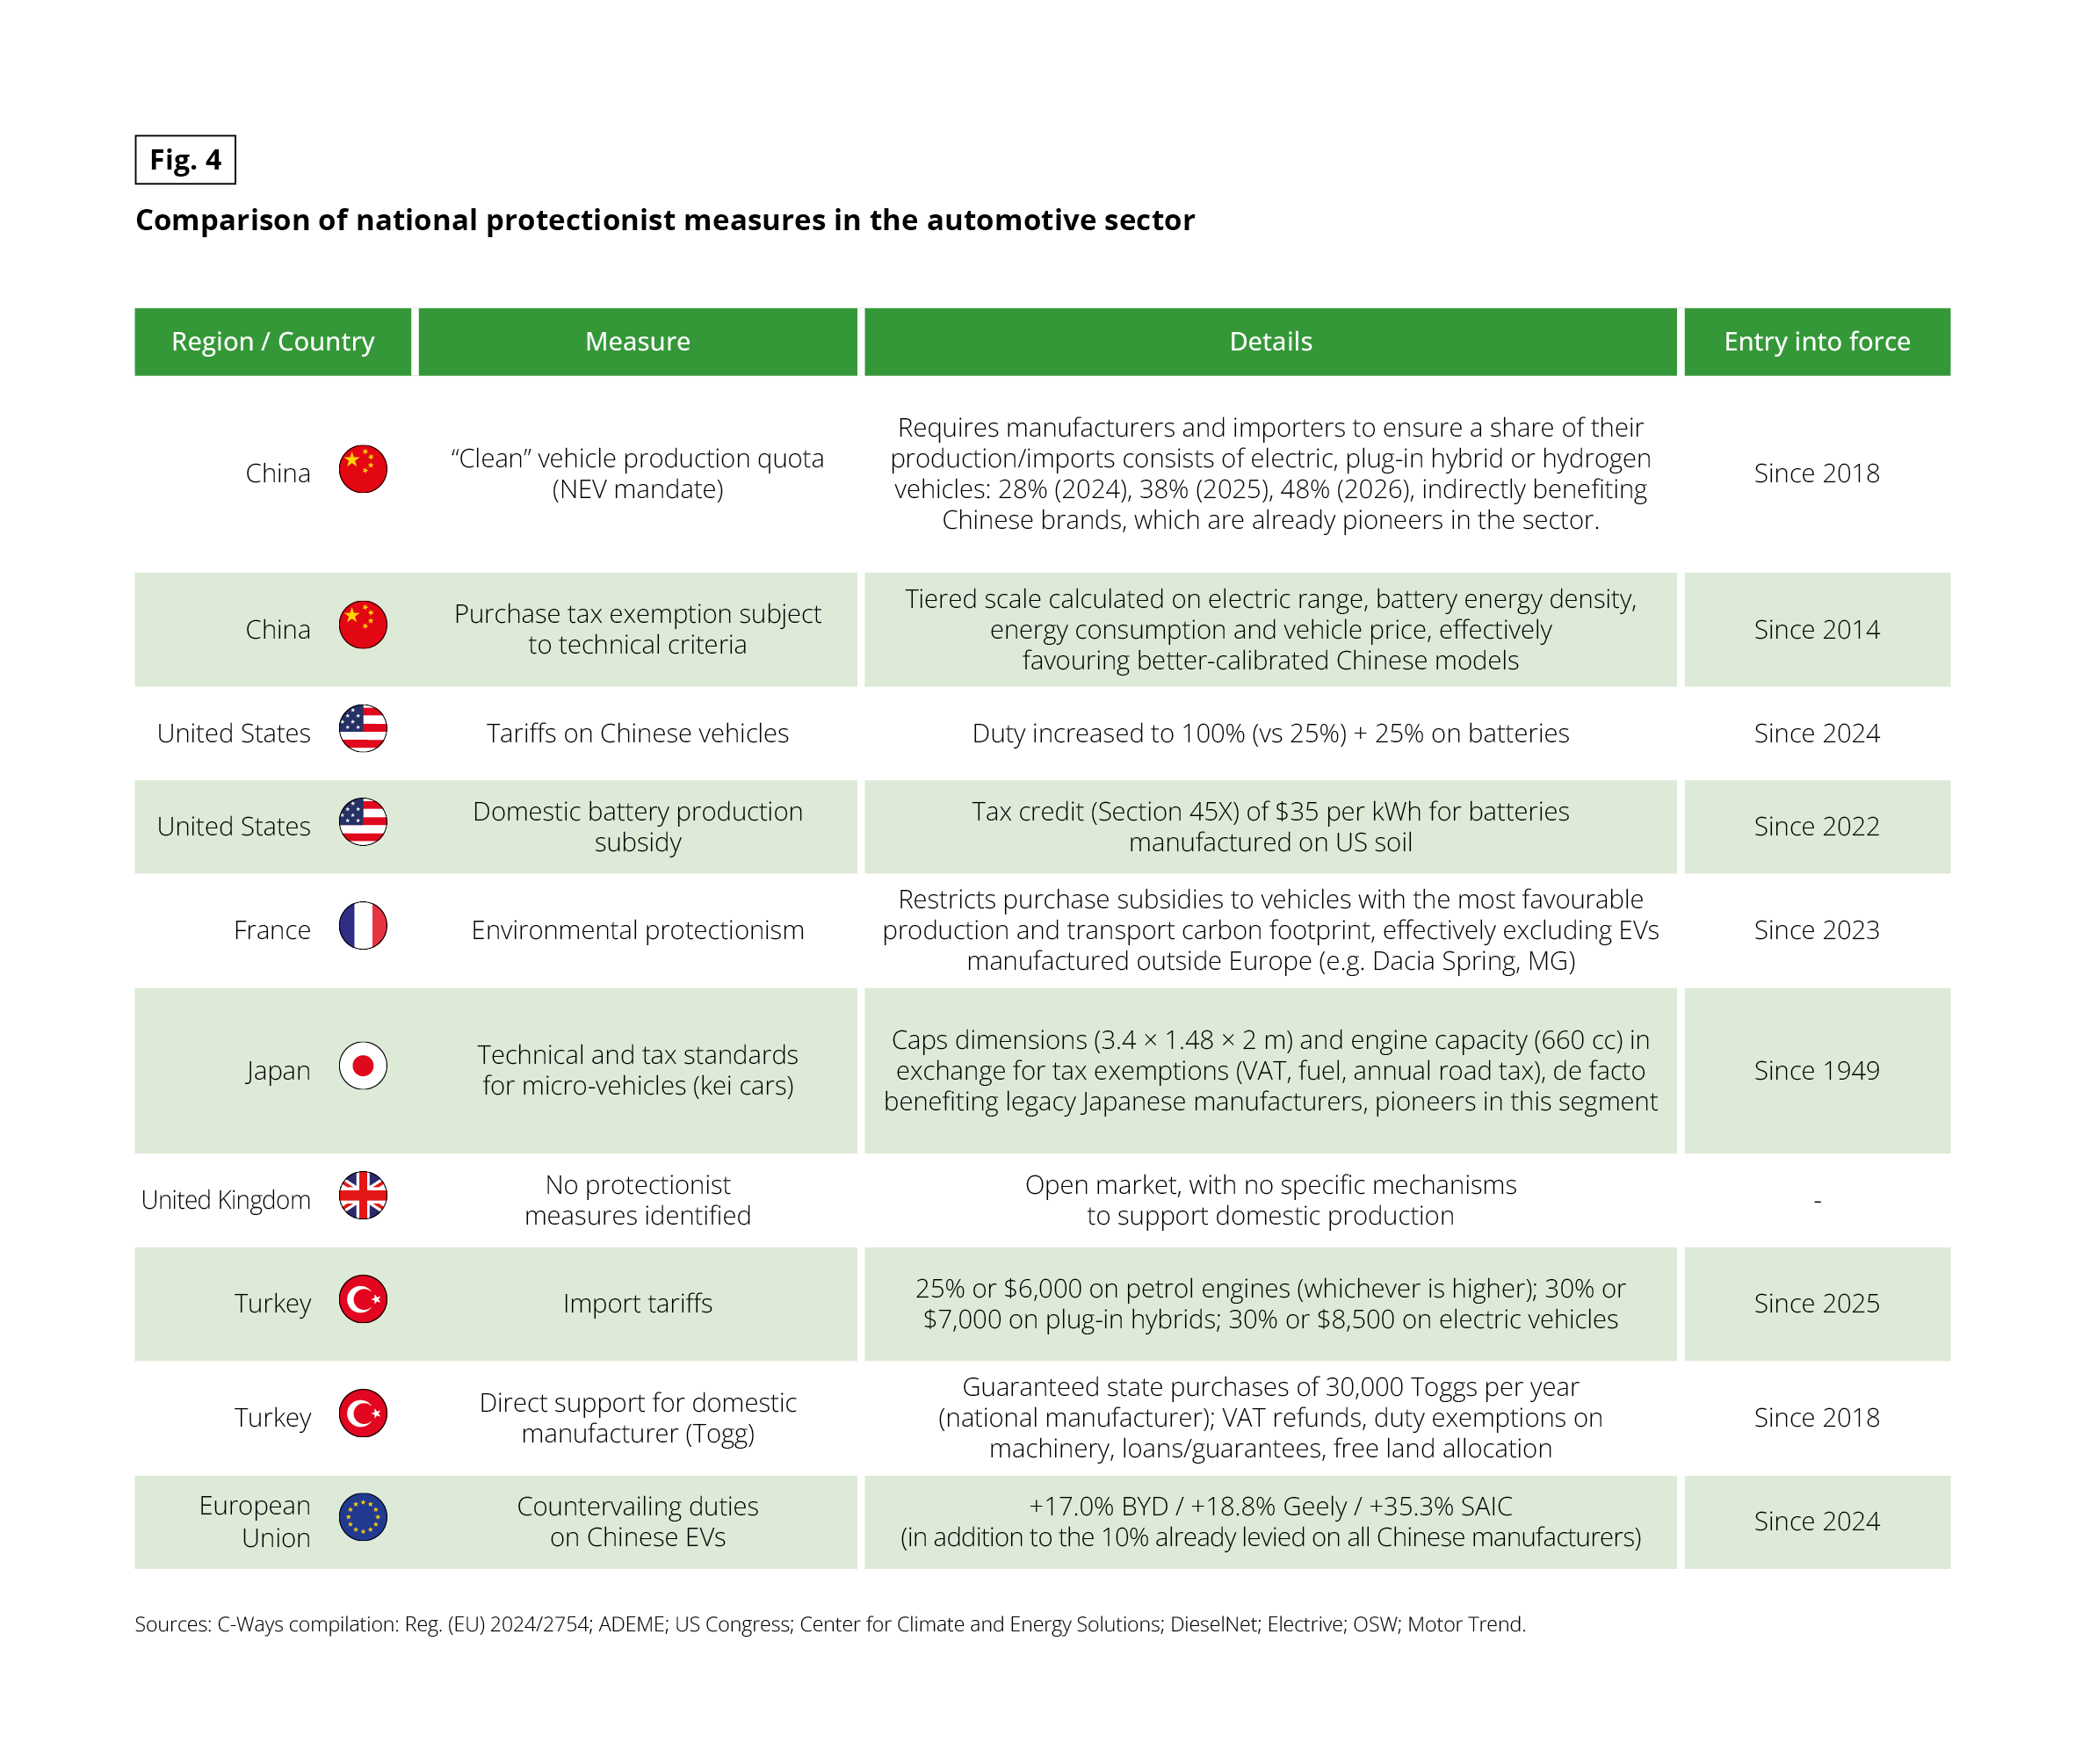 Table with four columns: region/country, measure, details, entry into force. It has ten rows.
Sources: C-Ways compilation: Reg. (EU) 2024/2754; ADEME; US Congress; Center for Climate and Energy Solutions; DieselNet; Electrive; OSW; Motor Trend.
1. China – “Clean” vehicle production quota (NEV mandate), since 2018. Manufacturers and importers must ensure a share of their production/imports consists of electric, plug-in hybrid or hydrogen vehicles: 28% (2024), 38% (2025), 48% (2026). This indirectly benefits Chinese brands, already pioneers in the sector.
2. China – Purchase tax exemption subject to technical criteria, since 2014. A tiered scale is calculated on electric range, battery energy density, energy consumption and vehicle price, effectively favouring better-calibrated Chinese models.
3. United States – Tariffs on Chinese vehicles, since 2024. Duty increased to 100% (from 25%), plus 25% on batteries.
4. United States – Domestic battery production subsidy, since 2022. Tax credit (Section 45X) of $35 per kWh for batteries manufactured on US soil.
5. France – Environmental protectionism, since 2023. Purchase subsidies are restricted to vehicles with the most favourable production and transport carbon footprint, effectively excluding EVs manufactured outside Europe (e.g. Dacia Spring, MG).
6. Japan – Technical and tax standards for micro-vehicles (kei cars), since 1949. Dimensions capped at 3.4 × 1.48 × 2 m and engine capacity at 660 cc, in exchange for tax exemptions (VAT, fuel, annual road tax). This de facto benefits legacy Japanese manufacturers, pioneers in this segment.
7. United Kingdom – No protectionist measures identified. Open market, with no specific mechanisms to support domestic production. No entry-into-force date.
8. Turkey – Import tariffs, since 2025: 25% or $6,000 on petrol engines (whichever is higher); 30% or $7,000 on plug-in hybrids; 30% or $8,500 on electric vehicles.
9. Turkey – Direct support for domestic manufacturer (Togg), since 2018. Guaranteed state purchases of 30,000 Toggs per year (national manufacturer); VAT refunds, duty exemptions on machinery, loans/guarantees, free land allocation.
10.European Union – Countervailing duties on Chinese EVs, since 2024: +17.0% BYD, +18.8% Geely, +35.3% SAIC. These come in addition to the 10% already levied on all Chinese manufacturers.
Table with four columns: region/country, measure, details, entry into force. It has ten rows.
Sources: C-Ways compilation: Reg. (EU) 2024/2754; ADEME; US Congress; Center for Climate and Energy Solutions; DieselNet; Electrive; OSW; Motor Trend.
1. China – “Clean” vehicle production quota (NEV mandate), since 2018. Manufacturers and importers must ensure a share of their production/imports consists of electric, plug-in hybrid or hydrogen vehicles: 28% (2024), 38% (2025), 48% (2026). This indirectly benefits Chinese brands, already pioneers in the sector.
2. China – Purchase tax exemption subject to technical criteria, since 2014. A tiered scale is calculated on electric range, battery energy density, energy consumption and vehicle price, effectively favouring better-calibrated Chinese models.
3. United States – Tariffs on Chinese vehicles, since 2024. Duty increased to 100% (from 25%), plus 25% on batteries.
4. United States – Domestic battery production subsidy, since 2022. Tax credit (Section 45X) of $35 per kWh for batteries manufactured on US soil.
5. France – Environmental protectionism, since 2023. Purchase subsidies are restricted to vehicles with the most favourable production and transport carbon footprint, effectively excluding EVs manufactured outside Europe (e.g. Dacia Spring, MG).
6. Japan – Technical and tax standards for micro-vehicles (kei cars), since 1949. Dimensions capped at 3.4 × 1.48 × 2 m and engine capacity at 660 cc, in exchange for tax exemptions (VAT, fuel, annual road tax). This de facto benefits legacy Japanese manufacturers, pioneers in this segment.
7. United Kingdom – No protectionist measures identified. Open market, with no specific mechanisms to support domestic production. No entry-into-force date.
8. Turkey – Import tariffs, since 2025: 25% or $6,000 on petrol engines (whichever is higher); 30% or $7,000 on plug-in hybrids; 30% or $8,500 on electric vehicles.
9. Turkey – Direct support for domestic manufacturer (Togg), since 2018. Guaranteed state purchases of 30,000 Toggs per year (national manufacturer); VAT refunds, duty exemptions on machinery, loans/guarantees, free land allocation.
10.European Union – Countervailing duties on Chinese EVs, since 2024: +17.0% BYD, +18.8% Geely, +35.3% SAIC. These come in addition to the 10% already levied on all Chinese manufacturers.