
An industrial heavyweight


 2 min
reading time
2 min
reading time
A ROLE IN MANUFACTURING SOMETIMES CALLED INTO QUESTION
Indeed, the automotive industry occupies a unique economic position, particularly when set against the manufacturing sector as a whole. This is especially true in Germany, where this macroeconomic data alone justifies German anxieties over the dominant rise of the Chinese automotive industry and its capacity to meet consumer expectations.
Fig. 5 – Share of the automotive sector in manufacturing value added (as a % of total manufacturing value added, branch C29)
Download this infographic for your presentations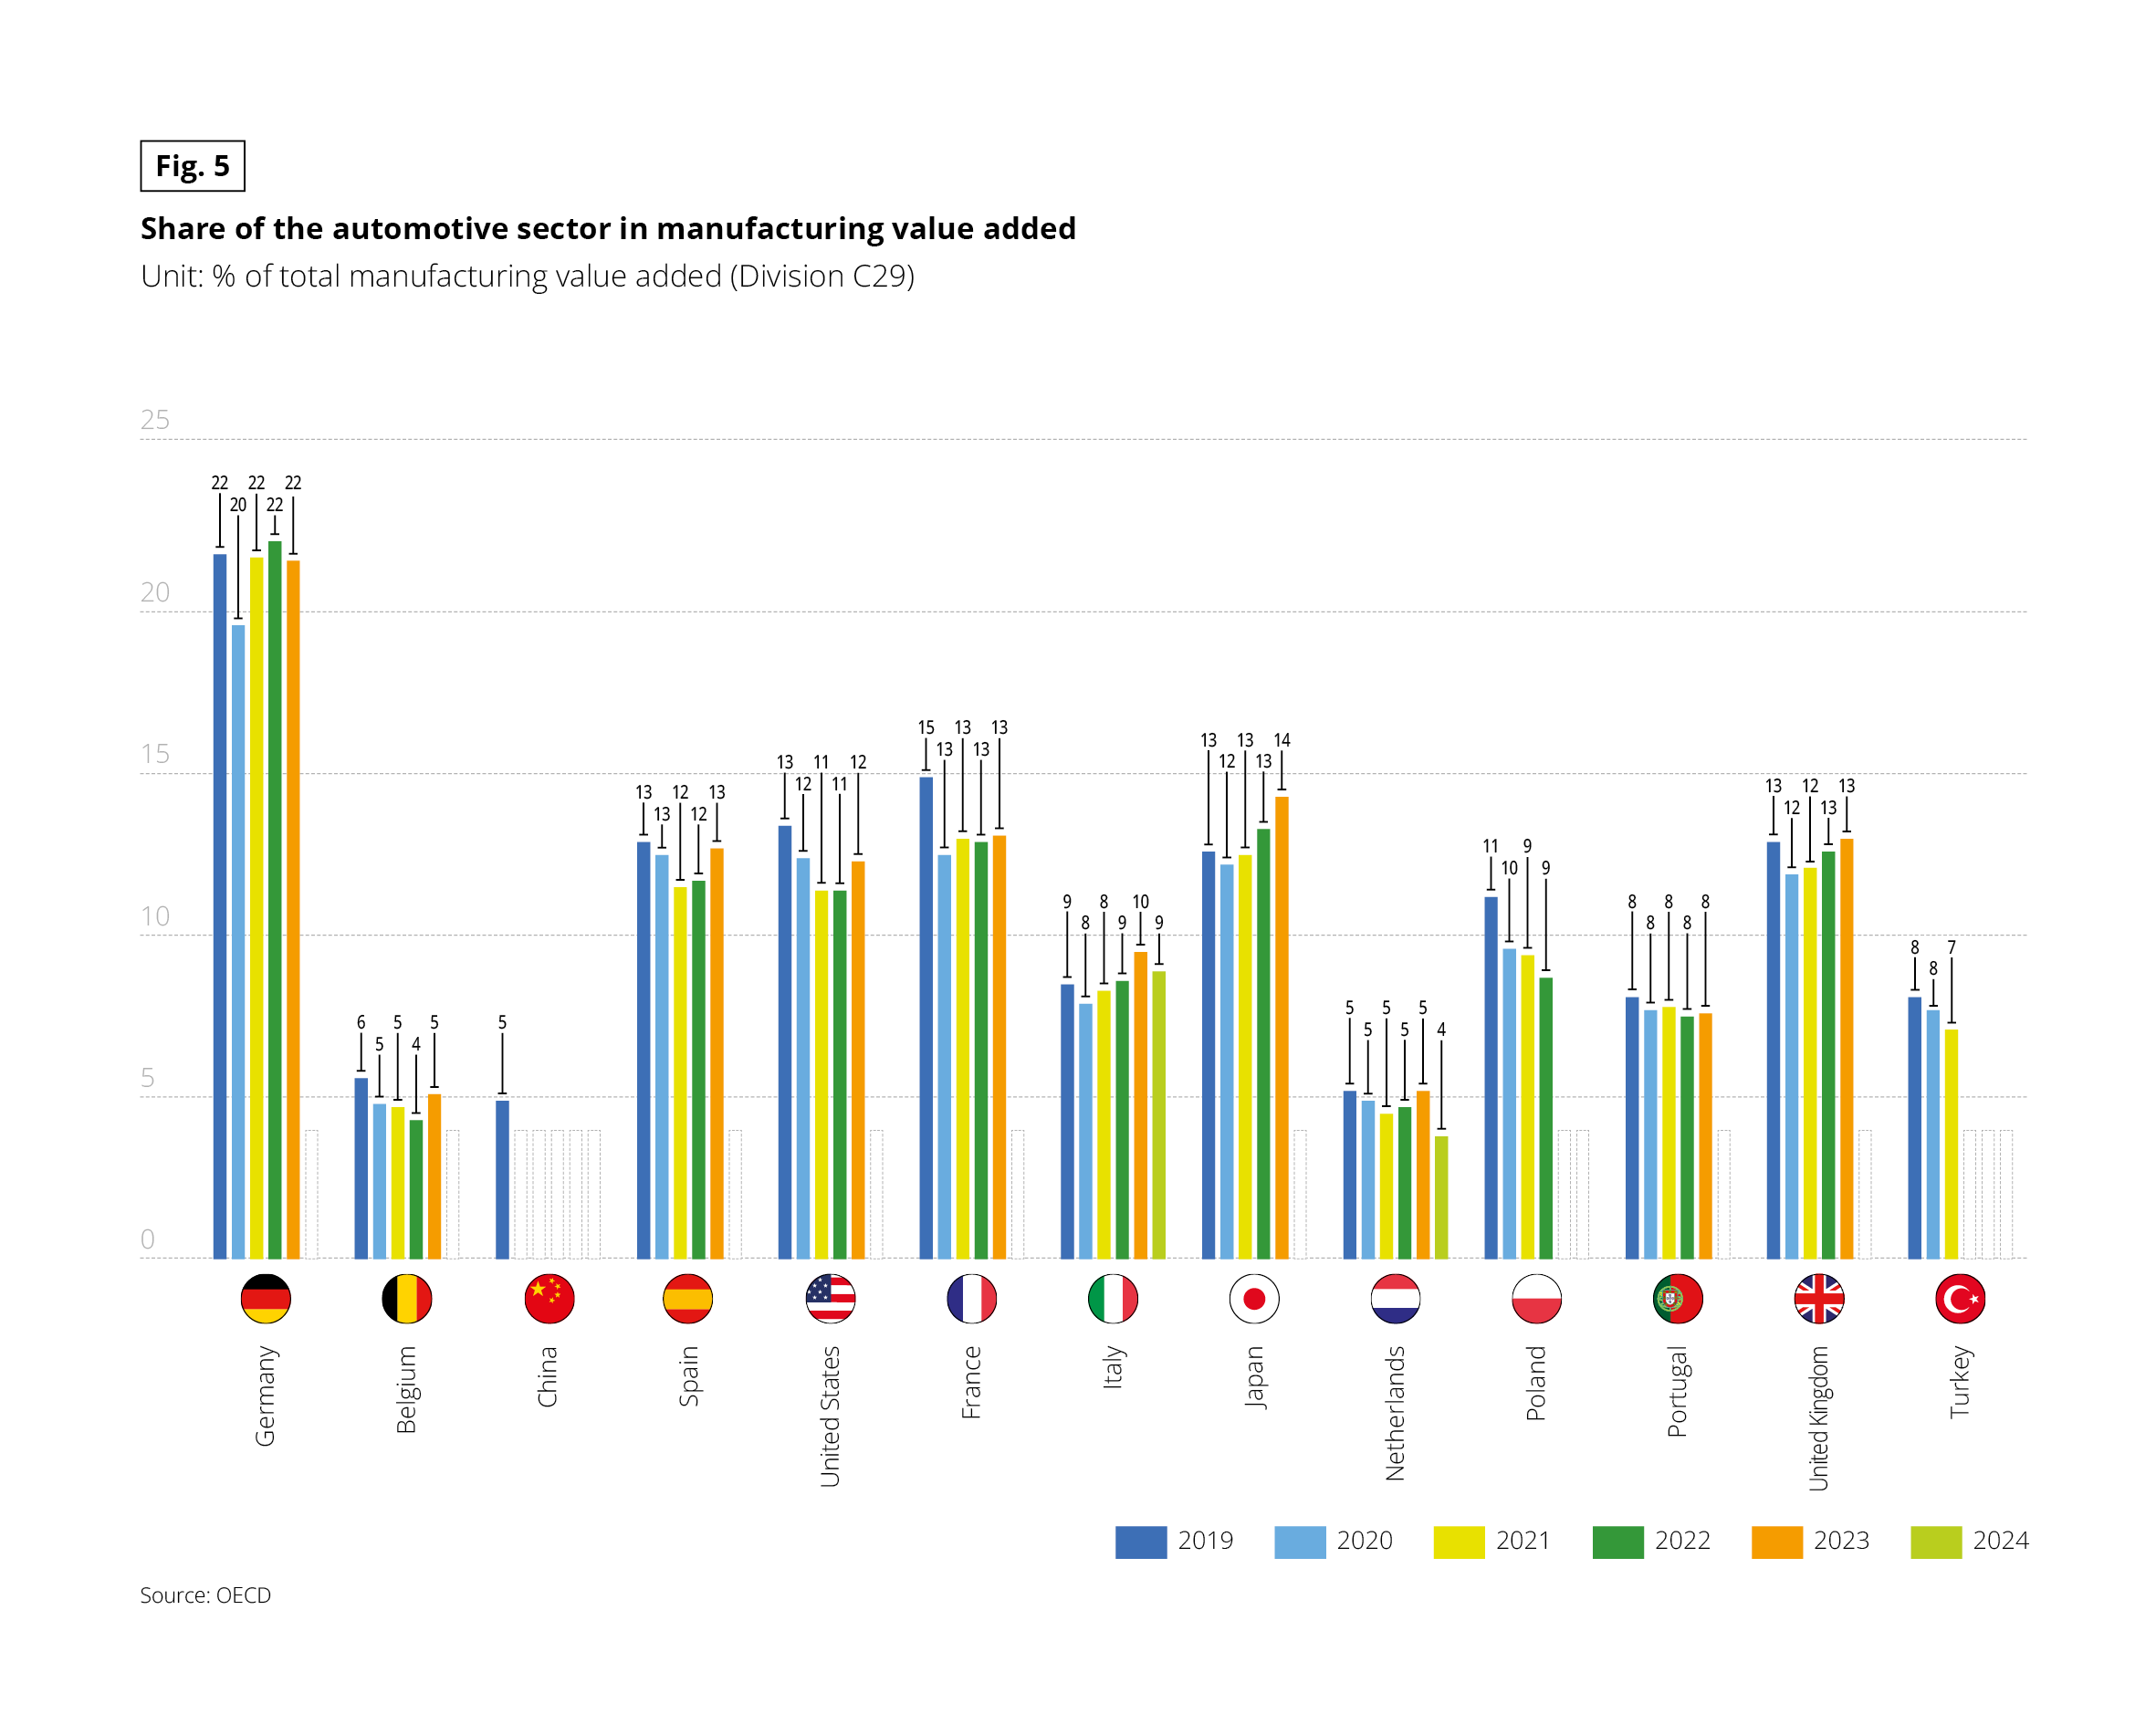 Grouped bar chart showing, for 13 countries and from 2019 to 2024, the share of the automotive sector (Division C29) in total manufacturing value added, as a percentage. Source: OECD. Years without data are shown as empty dotted bars.
Values by country, in chronological order of the available years:
• Germany (2019–2023): 22, 20, 22, 22, 22
• Belgium (2019–2023): 6, 5, 5, 4, 5
• China (2019 only): 5
• Spain (2019–2023): 13, 13, 12, 12, 13
• United States (2019–2023): 13, 12, 11, 11, 12
• France (2019–2023): 15, 13, 13, 13, 13
• Italy (2019–2024): 9, 8, 8, 9, 10, 9
• Japan (2019–2023): 13, 12, 13, 13, 14
• Netherlands (2019–2024): 5, 5, 5, 5, 5, 4
• Poland (2019–2022): 11, 10, 9, 9
• Portugal (2019–2023): 8, 8, 8, 8, 8
• United Kingdom (2019–2023): 13, 12, 12, 13, 13
• Turkey (2019–2021): 8, 8, 7
Key takeaways: Germany has the highest share (20 to 22%). France, Japan, Spain, the United States and the United Kingdom follow (11 to 15%). Belgium, China and the Netherlands are around 4 to 6%. No 2024 data is available except for Italy and the Netherlands.
Grouped bar chart showing, for 13 countries and from 2019 to 2024, the share of the automotive sector (Division C29) in total manufacturing value added, as a percentage. Source: OECD. Years without data are shown as empty dotted bars.
Values by country, in chronological order of the available years:
• Germany (2019–2023): 22, 20, 22, 22, 22
• Belgium (2019–2023): 6, 5, 5, 4, 5
• China (2019 only): 5
• Spain (2019–2023): 13, 13, 12, 12, 13
• United States (2019–2023): 13, 12, 11, 11, 12
• France (2019–2023): 15, 13, 13, 13, 13
• Italy (2019–2024): 9, 8, 8, 9, 10, 9
• Japan (2019–2023): 13, 12, 13, 13, 14
• Netherlands (2019–2024): 5, 5, 5, 5, 5, 4
• Poland (2019–2022): 11, 10, 9, 9
• Portugal (2019–2023): 8, 8, 8, 8, 8
• United Kingdom (2019–2023): 13, 12, 12, 13, 13
• Turkey (2019–2021): 8, 8, 7
Key takeaways: Germany has the highest share (20 to 22%). France, Japan, Spain, the United States and the United Kingdom follow (11 to 15%). Belgium, China and the Netherlands are around 4 to 6%. No 2024 data is available except for Italy and the Netherlands.
HUMAN CAPITAL
The weight of the automotive sector as a whole is also reflected in its human capital, accounting for hundreds of thousands of jobs. Ever since the 2000s, marked by the ripple effects of globalisation, employment in the sector has been under pressure, particularly in France and Italy, triggering significant redundancy plans. This phenomenon is now accelerating, especially over the past two years, which have seen a succession of new restructuring plans announced across most major groups, with German manufacturers no longer immune to the trend. Even so, Germany remains Europe’s automotive stronghold, accounting for nearly 1.75 million manufacturing jobs in 2024*, or 4.1% of the active workforce. In France, Europe’s second-largest automotive employer, the figures are roughly half that, at 743,000 jobs, representing 2.4% of the active workforce. These figures nevertheless remain lower than those of several other economic sectors. Furthermore, the relatively low proportion of automotive employment in China, the world’s top vehicle producer, should not obscure the fact that in the “factory of the world,” manufacturing spans a vast array of industries.
* Excludes trade, repair, spare parts sales, fuel sales, finance, driving schools, etc.
EMPLOYMENT
RELATIVE STABILITY IN RECENT YEARS…
Fig. 6 – Evolution in the number of jobs in the automotive sector, 2015-2024
Download this infographic for your presentations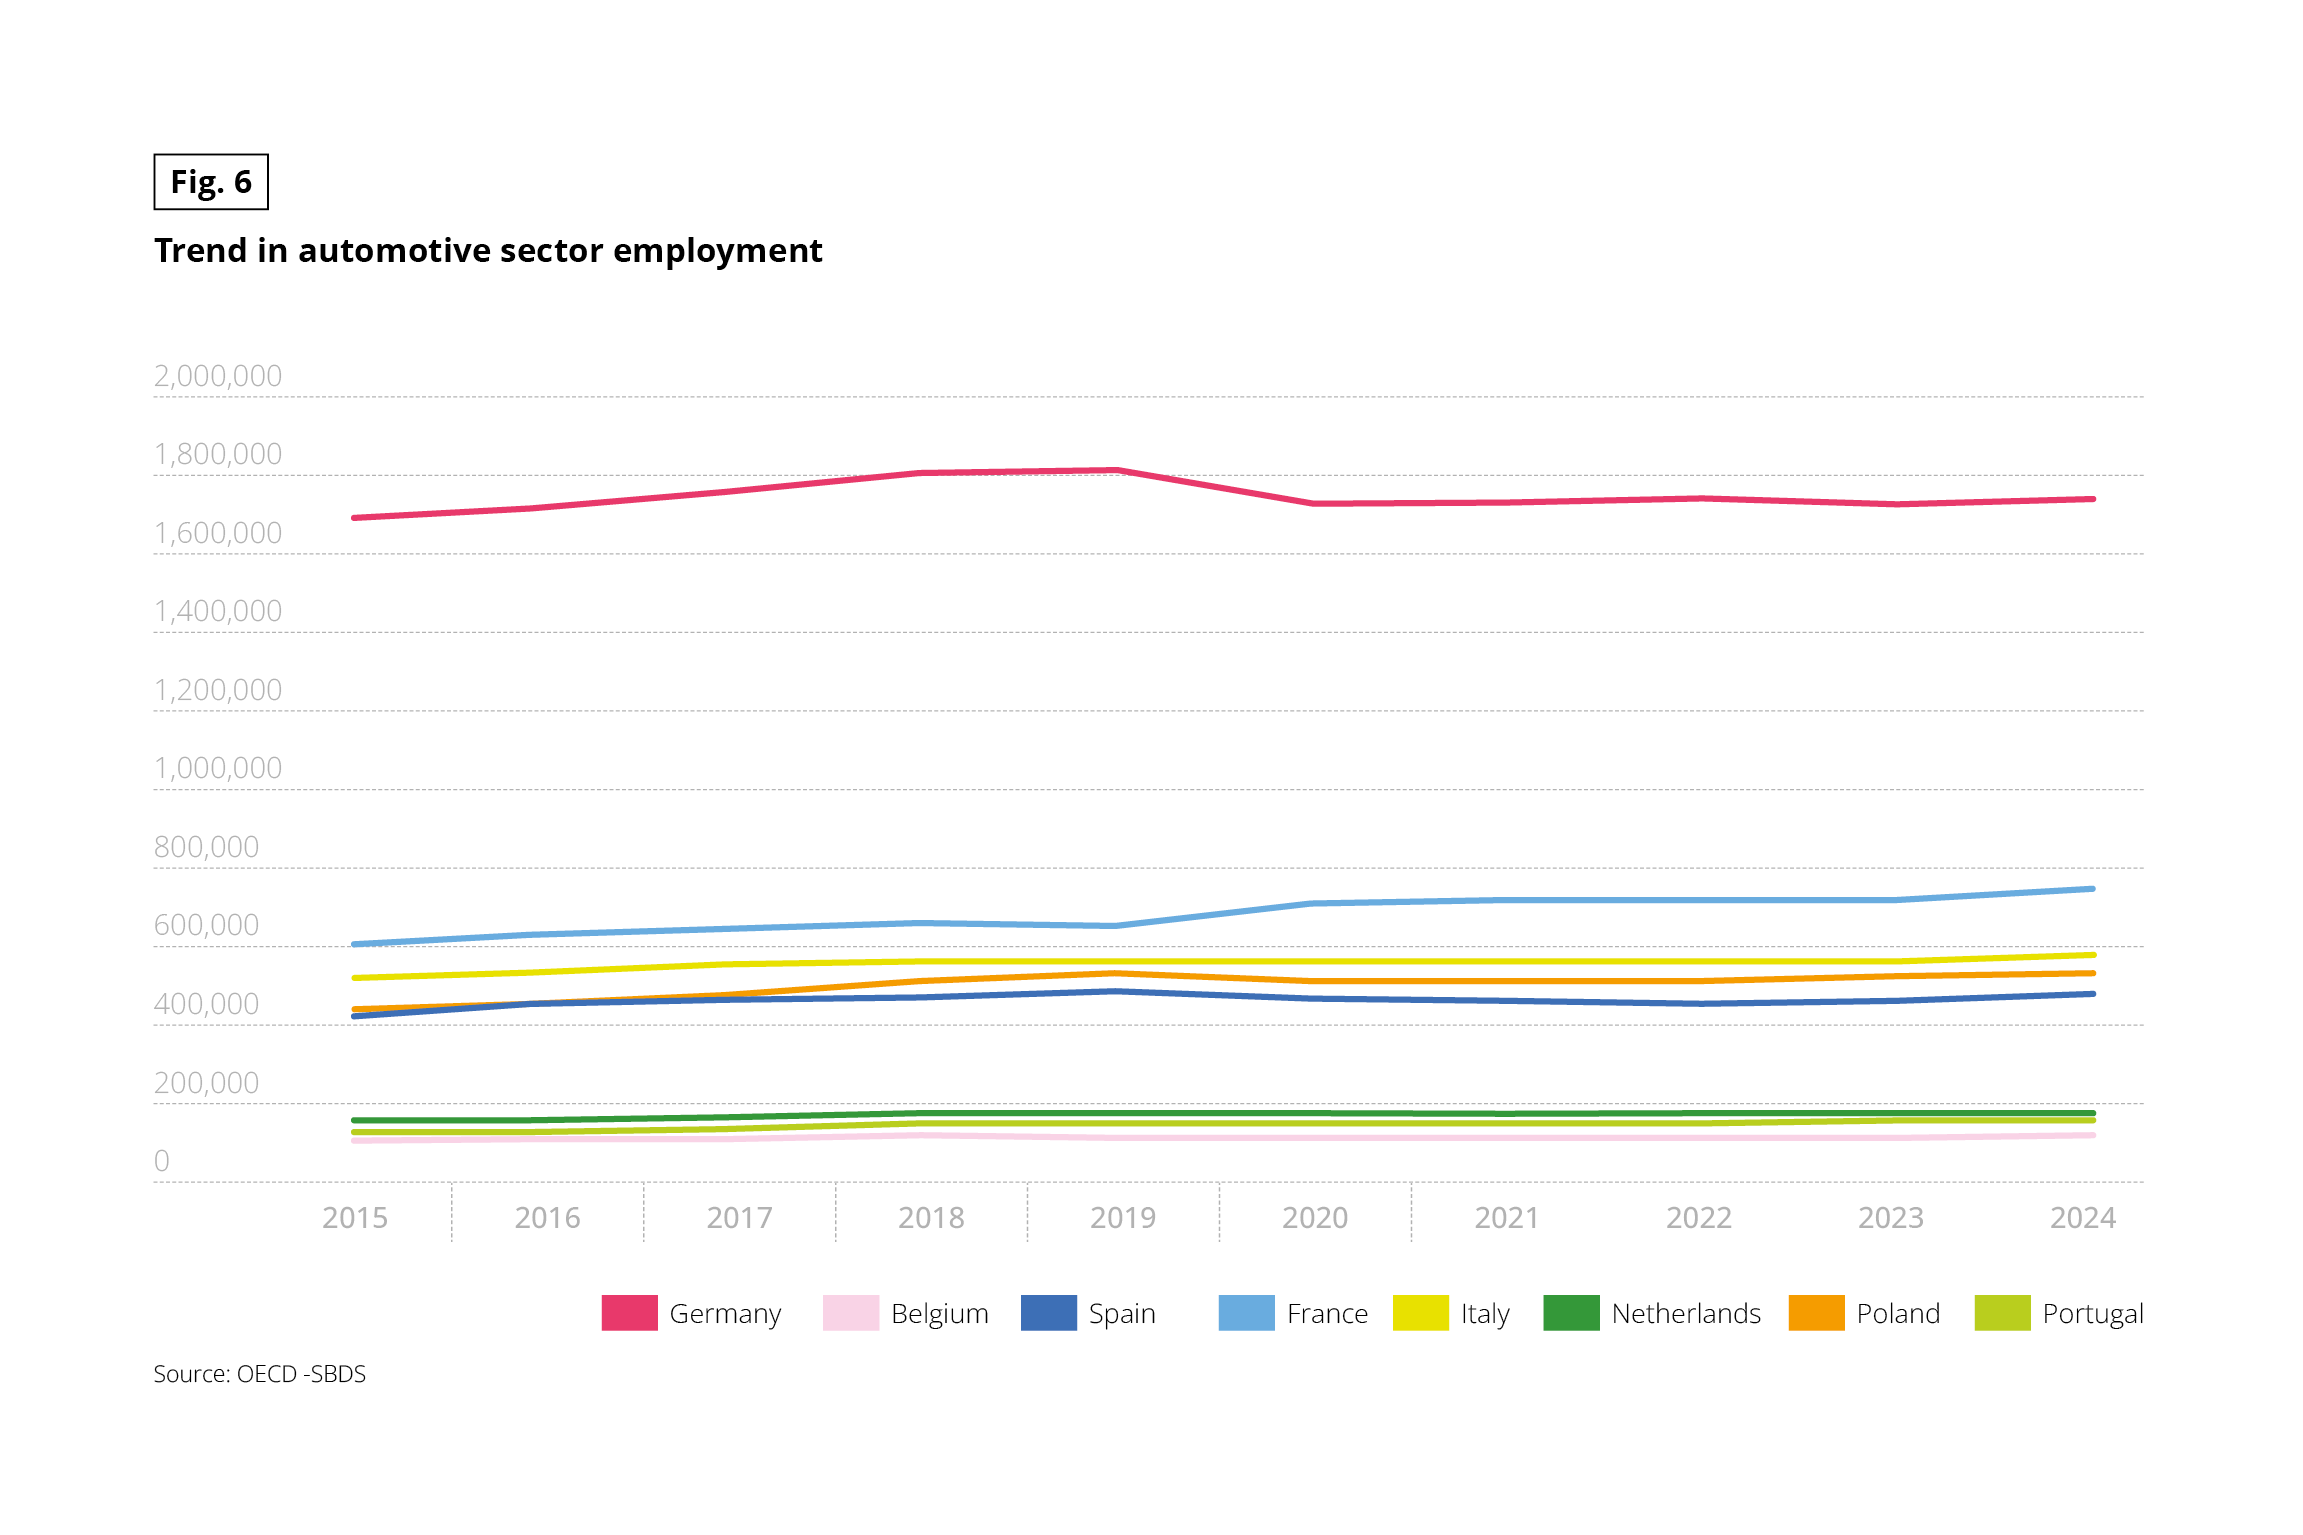 Line chart showing the trend in automotive sector employment from 2015 to 2024 for eight countries: Germany, Belgium, Spain, France, Italy, Netherlands, Poland and Portugal. Vertical axis from 0 to 2,000,000 jobs. Values are not labelled; those below are estimates read from the chart. Source: OECD-SBDS.
Approximate values in 2015, then 2024:
• Germany: about 1.69 million, then about 1.74 million. Peak of about 1.81 million in 2018– 2019, drop in 2020 (about 1.72 million), then near-stability.
• France: about 600,000, then about 745,000. Noticeable rise in 2020.
• Italy: about 520,000, then about 580,000.
• Poland: about 440,000, then about 530,000.
• Spain: about 420,000, then about 480,000.
• Netherlands: about 160,000, then about 180,000.
• Portugal: about 125,000, then about 160,000.
• Belgium: about 105,000, then about 115,000.
Key takeaways: Germany has more than twice as many jobs as France, the second-ranked country. Headcounts are broadly stable or slightly rising over the period.
Line chart showing the trend in automotive sector employment from 2015 to 2024 for eight countries: Germany, Belgium, Spain, France, Italy, Netherlands, Poland and Portugal. Vertical axis from 0 to 2,000,000 jobs. Values are not labelled; those below are estimates read from the chart. Source: OECD-SBDS.
Approximate values in 2015, then 2024:
• Germany: about 1.69 million, then about 1.74 million. Peak of about 1.81 million in 2018– 2019, drop in 2020 (about 1.72 million), then near-stability.
• France: about 600,000, then about 745,000. Noticeable rise in 2020.
• Italy: about 520,000, then about 580,000.
• Poland: about 440,000, then about 530,000.
• Spain: about 420,000, then about 480,000.
• Netherlands: about 160,000, then about 180,000.
• Portugal: about 125,000, then about 160,000.
• Belgium: about 105,000, then about 115,000.
Key takeaways: Germany has more than twice as many jobs as France, the second-ranked country. Headcounts are broadly stable or slightly rising over the period.
… BUT A SHARP DOWNTURN OVER TWO YEARS
Fig. 7 – Net variation in employment among car manufacturers and suppliers, Germany vs rest of the EU, 2022 – Q2 2026
Download this infographic for your presentations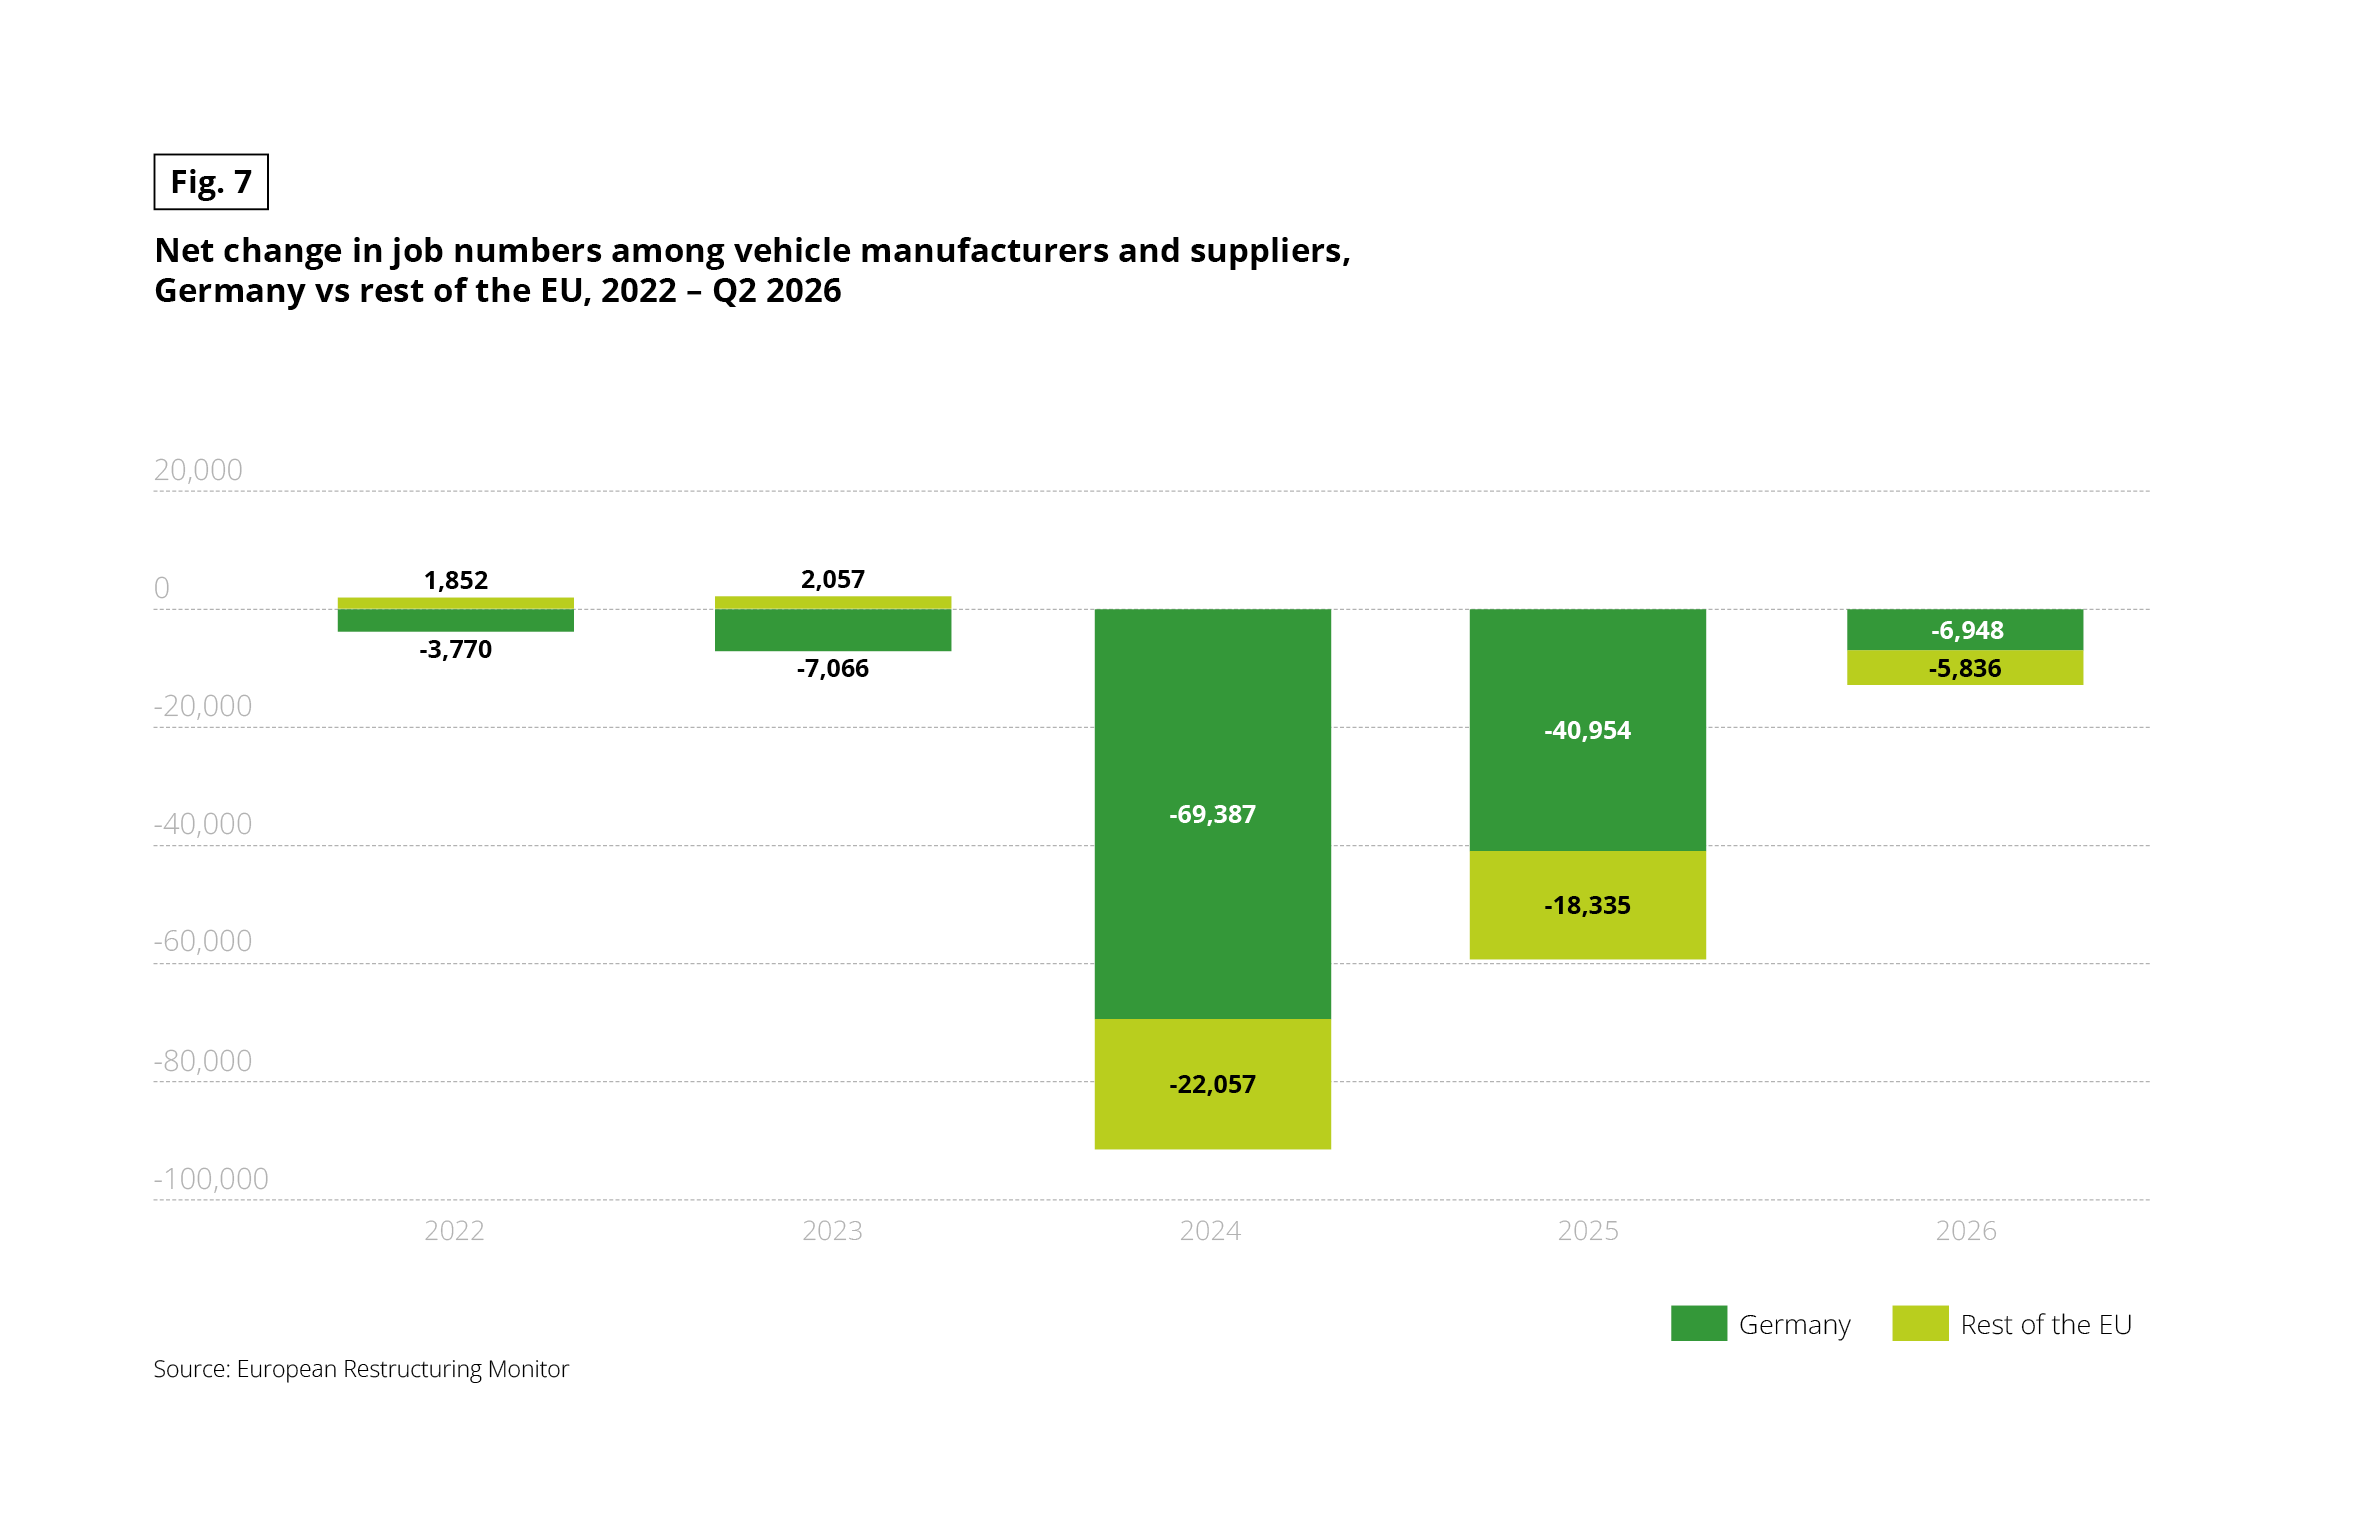 Stacked bar chart showing the net change in job numbers among vehicle manufacturers and suppliers, from 2022 to Q2 2026, distinguishing Germany from the rest of the EU. Source: European Restructuring Monitor.
Values (Germany / rest of the EU):
• 2022: −3,770 / +1,852
• 2023: −7,066 / +2,057
• 2024: −69,387 / −22,057
• 2025: −40,954 / −18,335
• 2026 (Q2): −6,948 / −5,836
Key takeaways: the rest of the EU shows net job creation in 2022 and 2023, but losses from 2024 to 2026. Combined losses (Germany + rest of the EU) reach 91,444 jobs in 2024 and 59,289 in 2025. Germany accounts for the majority of losses every year from 2022 to 2026.
Stacked bar chart showing the net change in job numbers among vehicle manufacturers and suppliers, from 2022 to Q2 2026, distinguishing Germany from the rest of the EU. Source: European Restructuring Monitor.
Values (Germany / rest of the EU):
• 2022: −3,770 / +1,852
• 2023: −7,066 / +2,057
• 2024: −69,387 / −22,057
• 2025: −40,954 / −18,335
• 2026 (Q2): −6,948 / −5,836
Key takeaways: the rest of the EU shows net job creation in 2022 and 2023, but losses from 2024 to 2026. Combined losses (Germany + rest of the EU) reach 91,444 jobs in 2024 and 59,289 in 2025. Germany accounts for the majority of losses every year from 2022 to 2026.
Automotive sector: 2% to 4% of the active workforce in 2024, a lower share than construction, trade and accommodation and food service activities.
Fig. 8 – Share of employment in the automotive sector as a percentage of the total workforce, compared to other major sectors (%)
Download this infographic for your presentations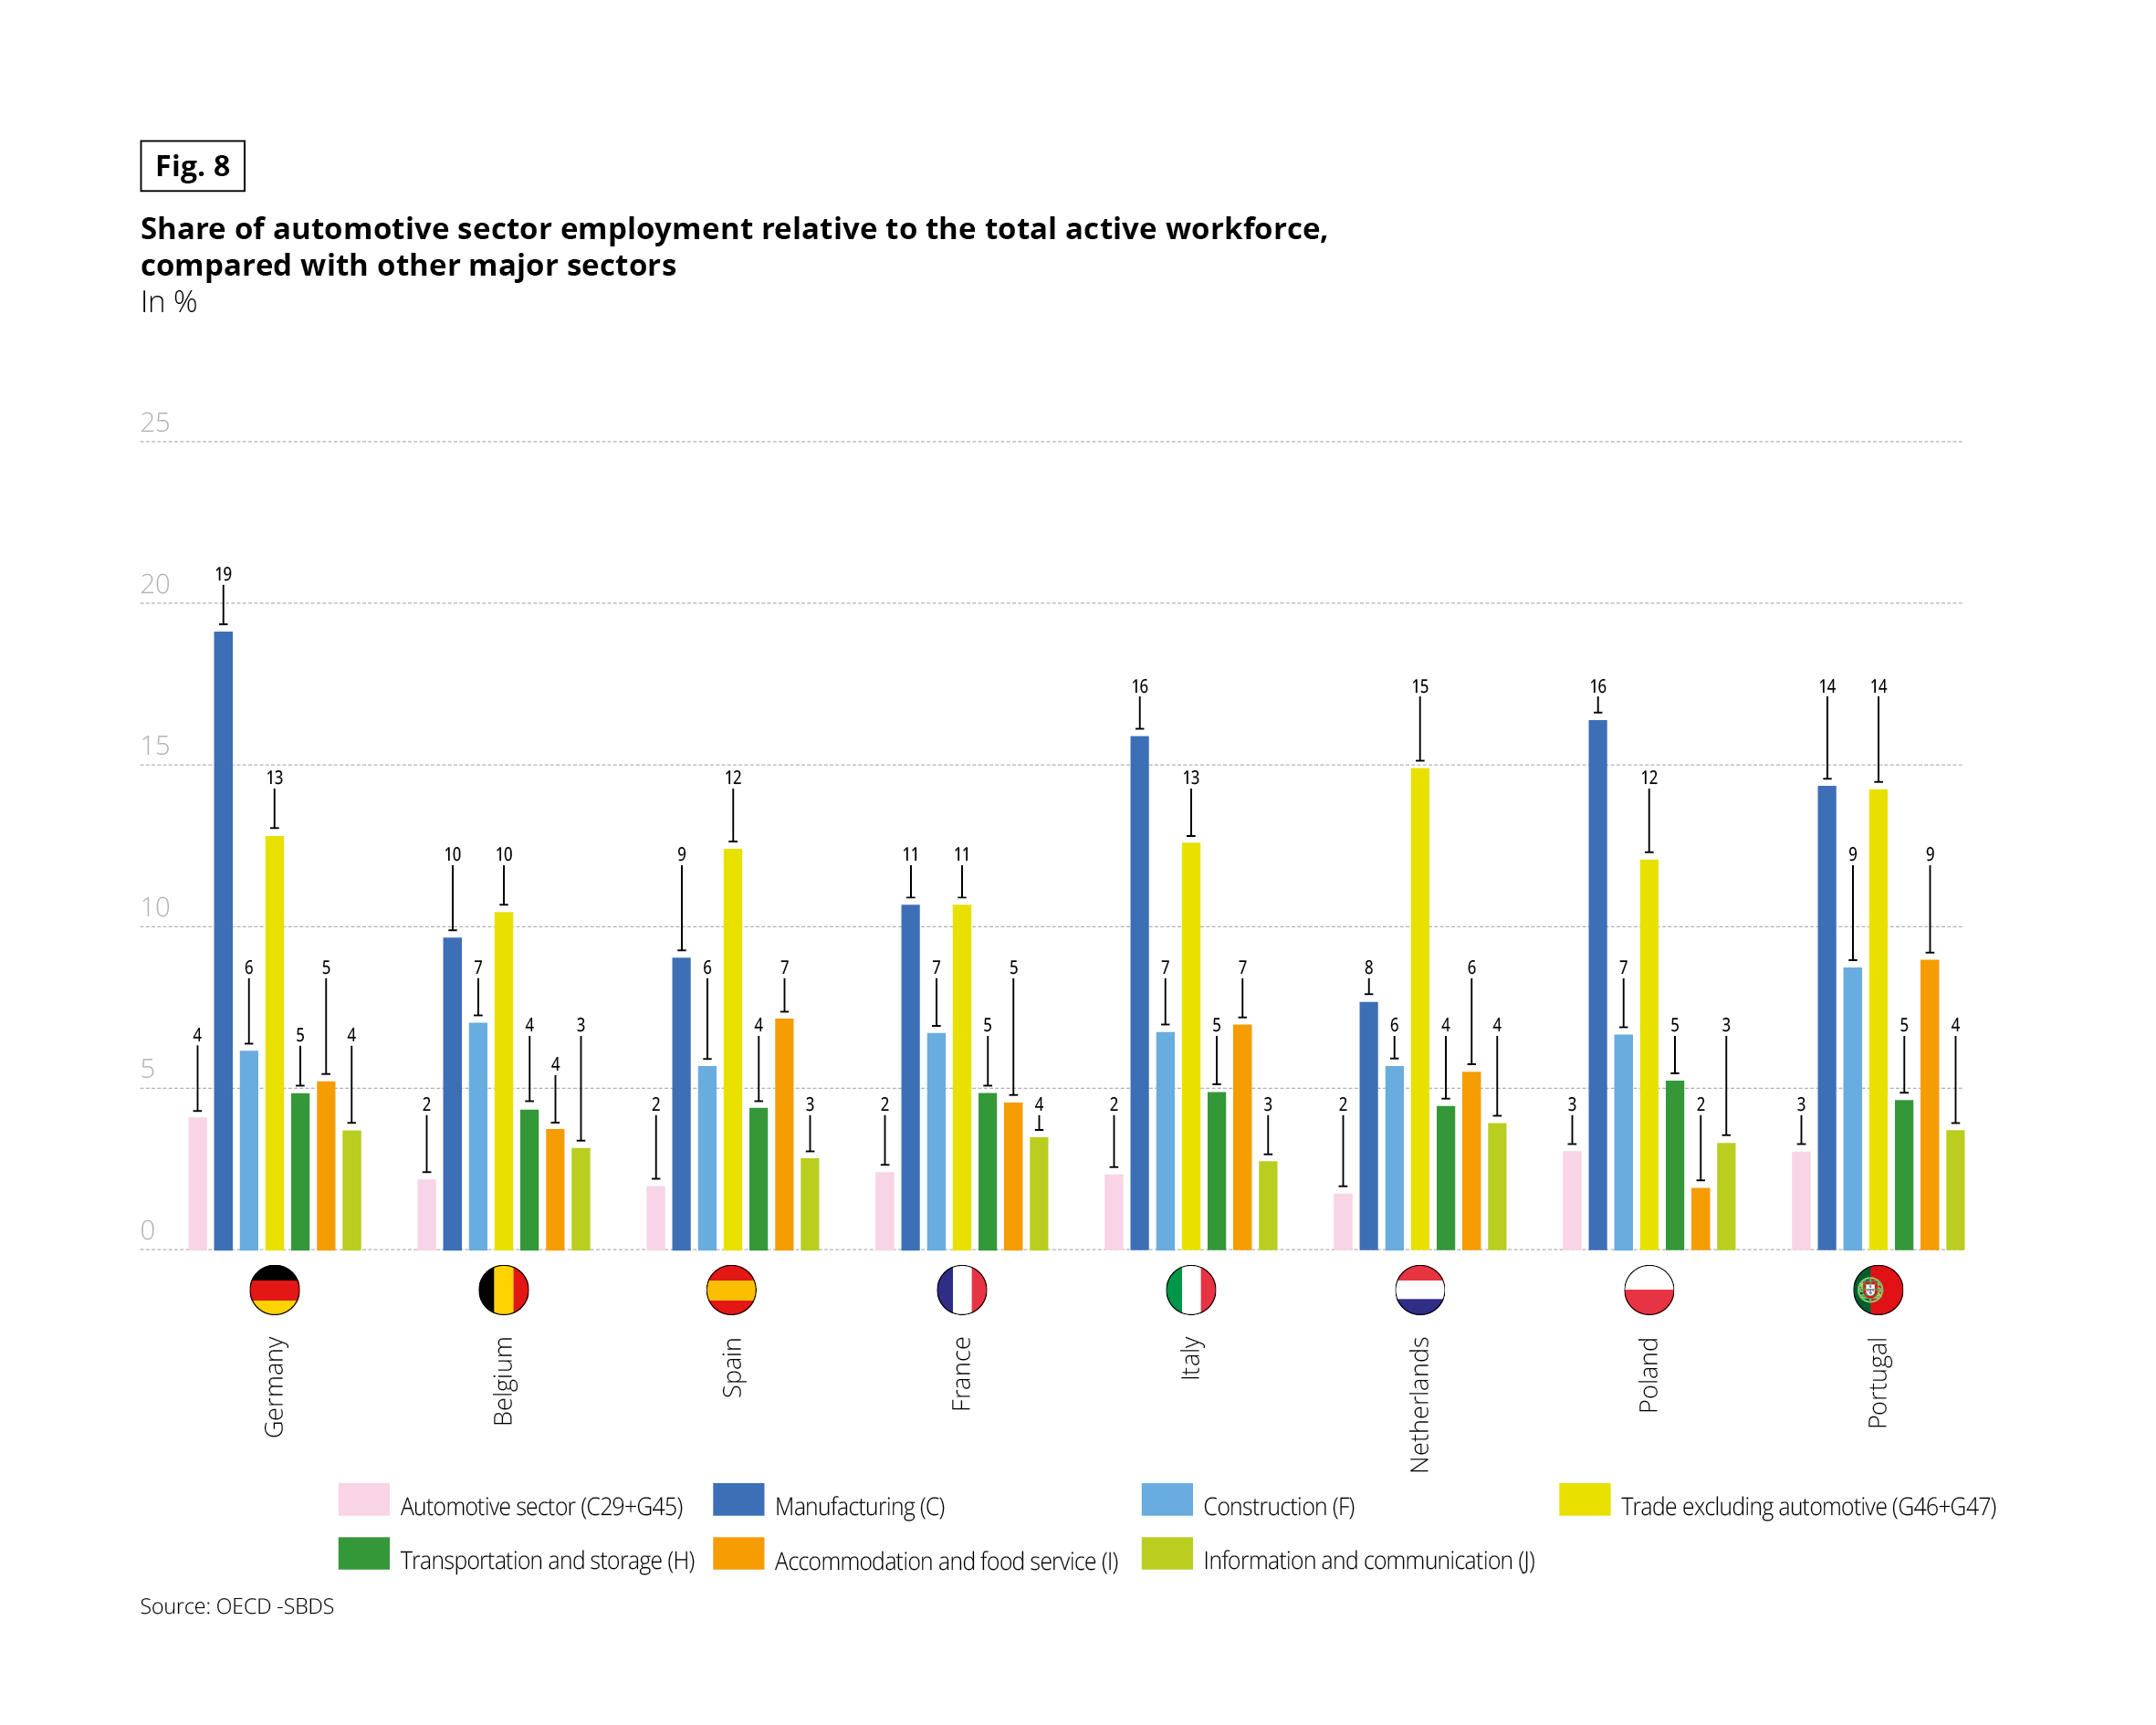 Grouped bar chart showing, for eight countries, the share of employment of seven sectors in the total active workforce, as a percentage. Source: OECD-SBDS. Sectors: automotive sector (C29+G45), manufacturing (C), construction (F), trade excluding automotive (G46+G47), transportation and storage (H), accommodation and food service (I), information and communication (J).
Values by country, in the order of the sectors above:
• Germany: 4, 19, 6, 13, 5, 5, 4
• Belgium: 2, 10, 7, 10, 4, 4, 3
• Spain: 2, 9, 6, 12, 4, 7, 3
• France: 2, 11, 7, 11, 5, 5, 4
• Italy: 2, 16, 7, 13, 5, 7, 3
• Netherlands: 2, 8, 6, 15, 4, 6, 4
• Poland: 3, 16, 7, 12, 5, 2, 3
• Portugal: 3, 14, 9, 14, 5, 9, 4
Key takeaways: the automotive sector accounts for 2 to 4% of employment depending on the country, with Germany the highest (4%). It is lower than manufacturing, trade excluding automotive and construction everywhere, and close to information and communication.
Grouped bar chart showing, for eight countries, the share of employment of seven sectors in the total active workforce, as a percentage. Source: OECD-SBDS. Sectors: automotive sector (C29+G45), manufacturing (C), construction (F), trade excluding automotive (G46+G47), transportation and storage (H), accommodation and food service (I), information and communication (J).
Values by country, in the order of the sectors above:
• Germany: 4, 19, 6, 13, 5, 5, 4
• Belgium: 2, 10, 7, 10, 4, 4, 3
• Spain: 2, 9, 6, 12, 4, 7, 3
• France: 2, 11, 7, 11, 5, 5, 4
• Italy: 2, 16, 7, 13, 5, 7, 3
• Netherlands: 2, 8, 6, 15, 4, 6, 4
• Poland: 3, 16, 7, 12, 5, 2, 3
• Portugal: 3, 14, 9, 14, 5, 9, 4
Key takeaways: the automotive sector accounts for 2 to 4% of employment depending on the country, with Germany the highest (4%). It is lower than manufacturing, trade excluding automotive and construction everywhere, and close to information and communication.
Fig. 9 – Germany’s automotive industry is also in trouble
Download this infographic for your presentations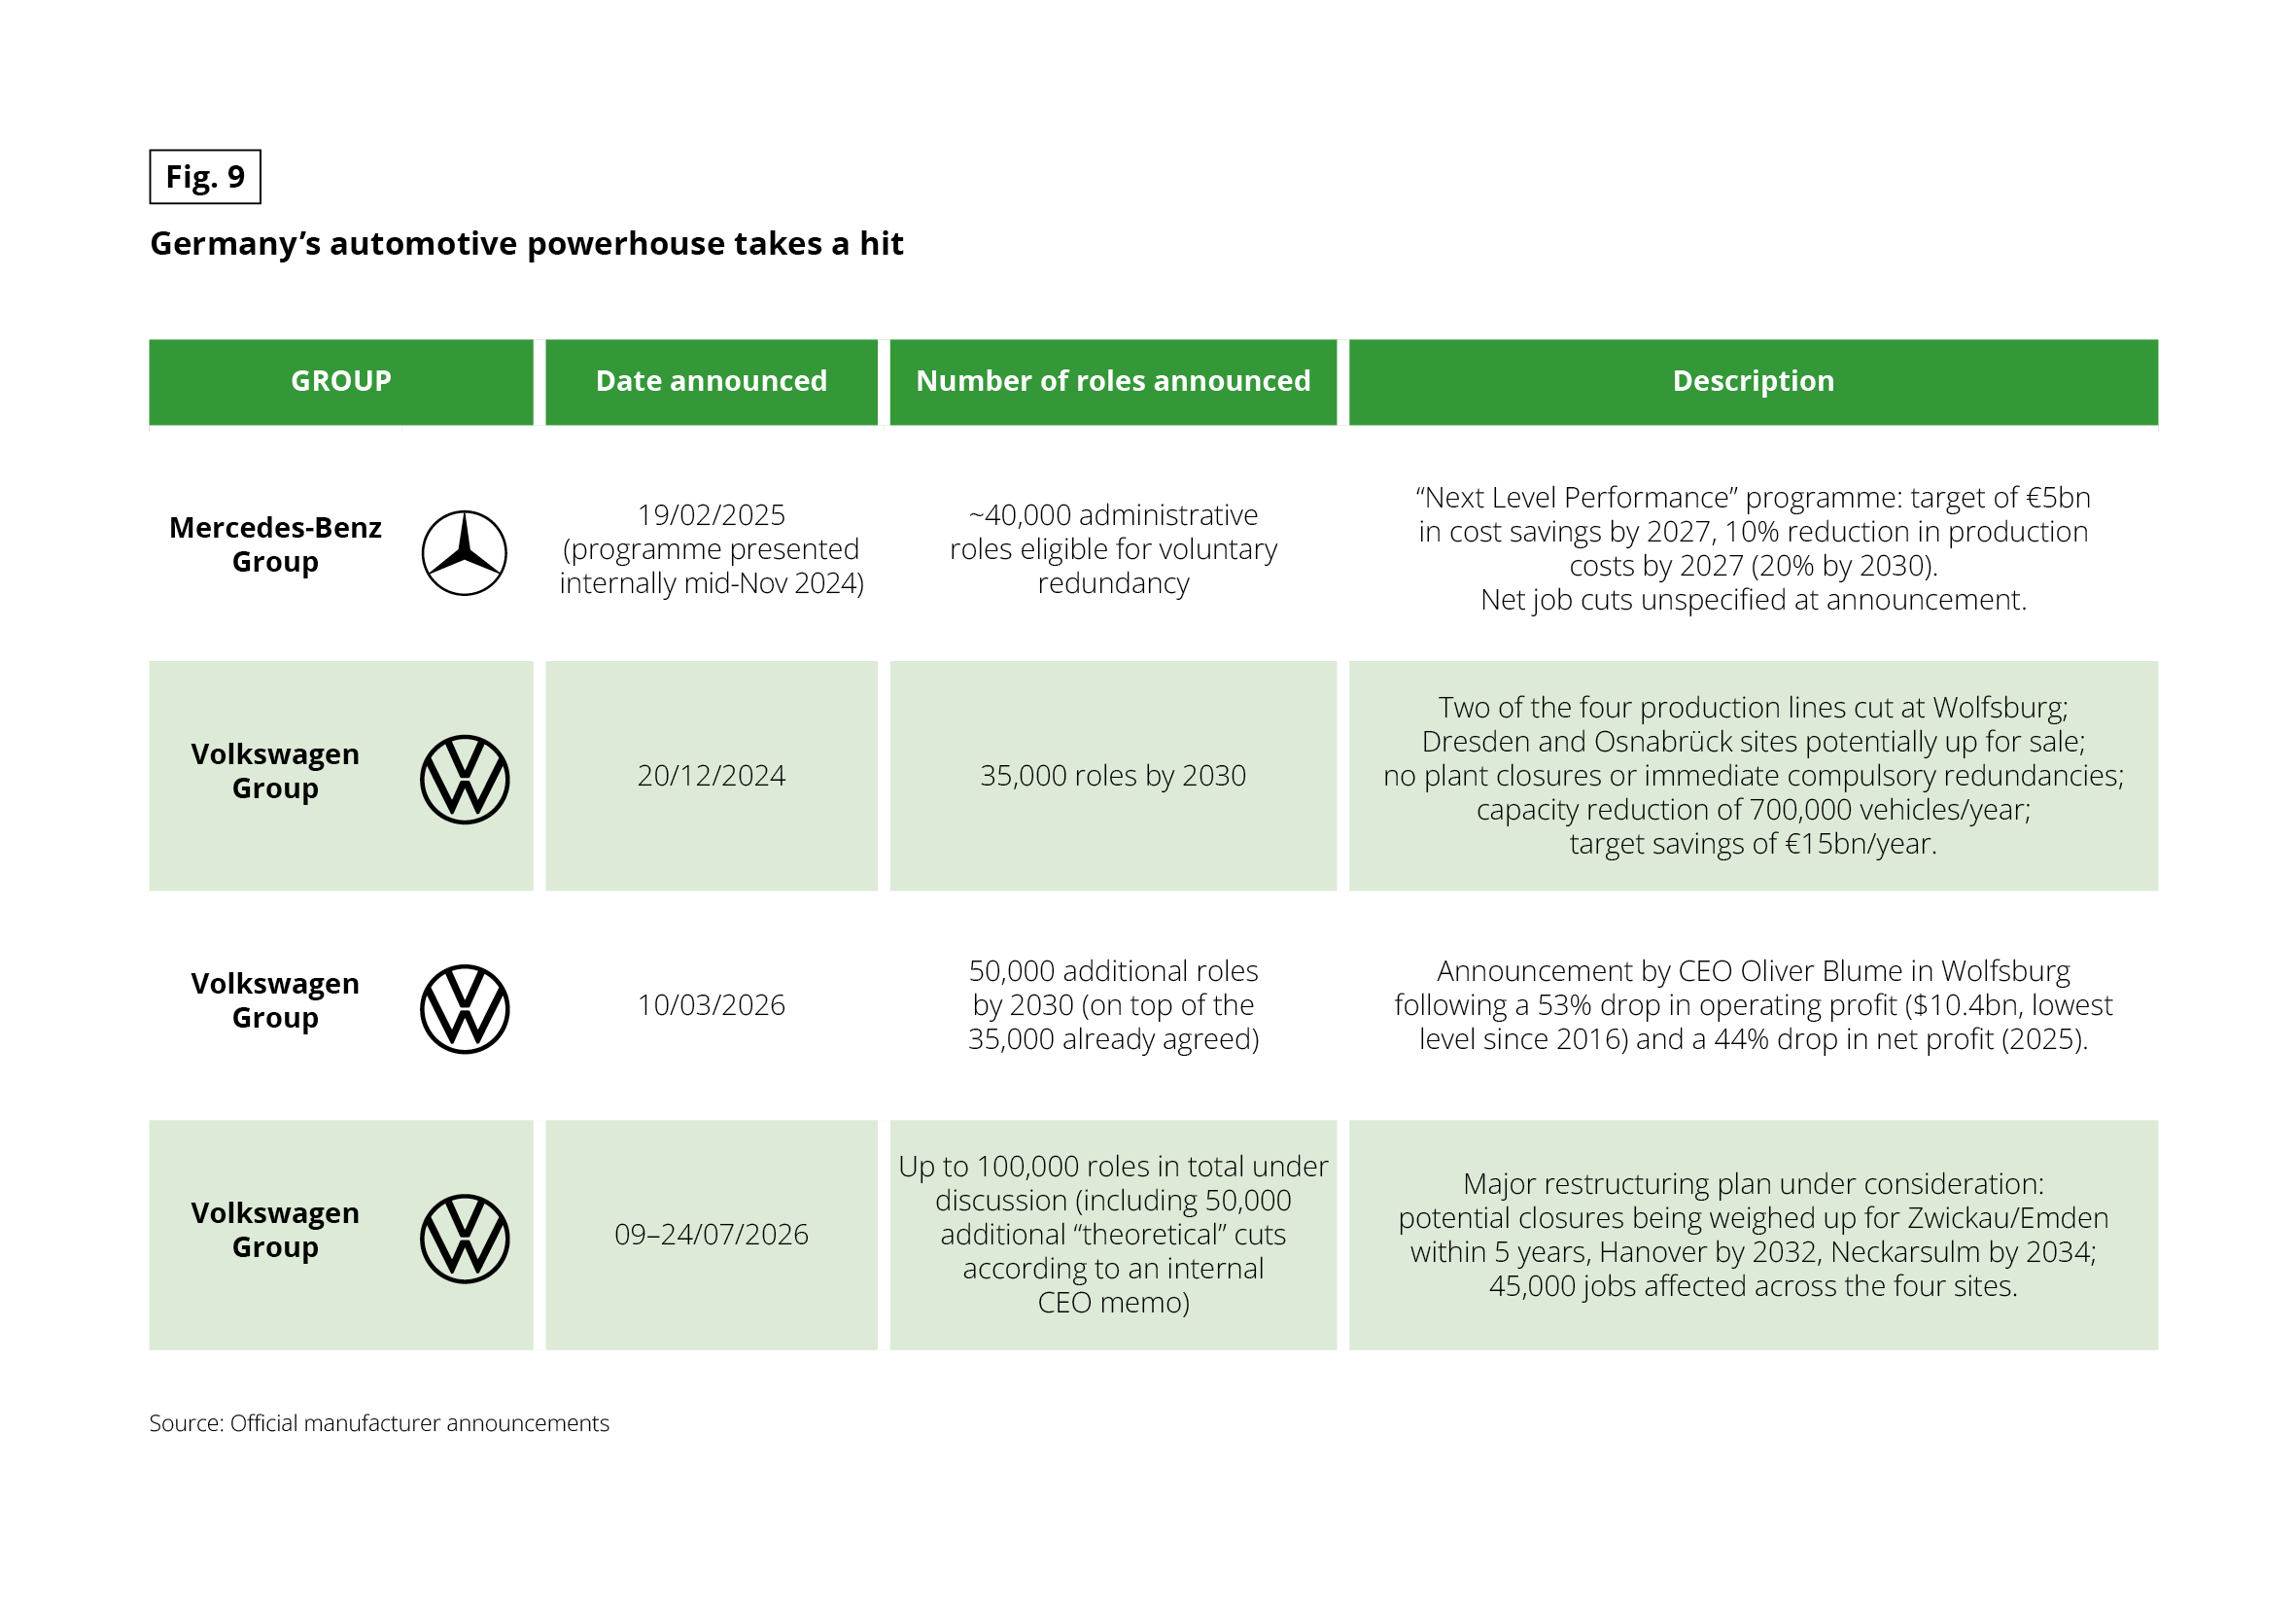 Table with four columns: group, date announced, number of roles announced, description. It has four rows. Source: official manufacturer announcements.
1. Mercedes-Benz Group – 19/02/2025 (programme presented internally mid-November 2024). About 40,000 administrative roles eligible for voluntary redundancy. “Next Level Performance” programme: target of €5bn in cost savings by 2027, 10% reduction in production costs by 2027 (20% by 2030). Net job cuts unspecified at announcement.
2. Volkswagen Group – 20/12/2024. 35,000 roles by 2030. Two of the four production lines cut at Wolfsburg; Dresden and Osnabrück sites potentially up for sale; no plant closures or immediate compulsory redundancies; capacity reduction of 700,000 vehicles per year; target savings of €15bn per year.
3. Volkswagen Group – 10/03/2026. 50,000 additional roles by 2030, on top of the 35,000 already agreed. Announcement by CEO Oliver Blume in Wolfsburg following a 53% drop in operating profit ($10.4bn, lowest level since 2016) and a 44% drop in net profit (2025).
4. Volkswagen Group – 09–24/07/2026. Up to 100,000 roles in total under discussion, including 50,000 additional “theoretical” cuts according to an internal CEO memo. Major restructuring plan under consideration: potential closures being weighed up for Zwickau/ Emden within 5 years, Hanover by 2032, Neckarsulm by 2034. 45,000 jobs affected across the four sites.
Table with four columns: group, date announced, number of roles announced, description. It has four rows. Source: official manufacturer announcements.
1. Mercedes-Benz Group – 19/02/2025 (programme presented internally mid-November 2024). About 40,000 administrative roles eligible for voluntary redundancy. “Next Level Performance” programme: target of €5bn in cost savings by 2027, 10% reduction in production costs by 2027 (20% by 2030). Net job cuts unspecified at announcement.
2. Volkswagen Group – 20/12/2024. 35,000 roles by 2030. Two of the four production lines cut at Wolfsburg; Dresden and Osnabrück sites potentially up for sale; no plant closures or immediate compulsory redundancies; capacity reduction of 700,000 vehicles per year; target savings of €15bn per year.
3. Volkswagen Group – 10/03/2026. 50,000 additional roles by 2030, on top of the 35,000 already agreed. Announcement by CEO Oliver Blume in Wolfsburg following a 53% drop in operating profit ($10.4bn, lowest level since 2016) and a 44% drop in net profit (2025).
4. Volkswagen Group – 09–24/07/2026. Up to 100,000 roles in total under discussion, including 50,000 additional “theoretical” cuts according to an internal CEO memo. Major restructuring plan under consideration: potential closures being weighed up for Zwickau/ Emden within 5 years, Hanover by 2032, Neckarsulm by 2034. 45,000 jobs affected across the four sites.
HEADWINDS HITTING PRODUCTION
Driven by China’s post-pandemic recovery and continued growth, the number of motor vehicles produced globally in 2023 surpassed 2019 levels. However, as with sales, sharp geographical disparities remain, reflecting the rise of new forms of automotive mobility. China alone continues its relentless push forward, while other markets, most notably Japan, struggle to regain momentum. In France and Italy, the best-case scenario is a holding pattern that halts the ongoing drain on output, unless effective protectionist policies are introduced. French production of passenger cars dropped from 1.47 million units in 2019 to just 0.99 million in 2025. In Italy, the situation represents nothing short of a collapse: falling from 590,000 units in 2019 to a mere 270,000 in 2025.
Fig. 10 – Annual production of passenger vehicles, 2019-2025 (100,000 vehicles)
Download this infographic for your presentations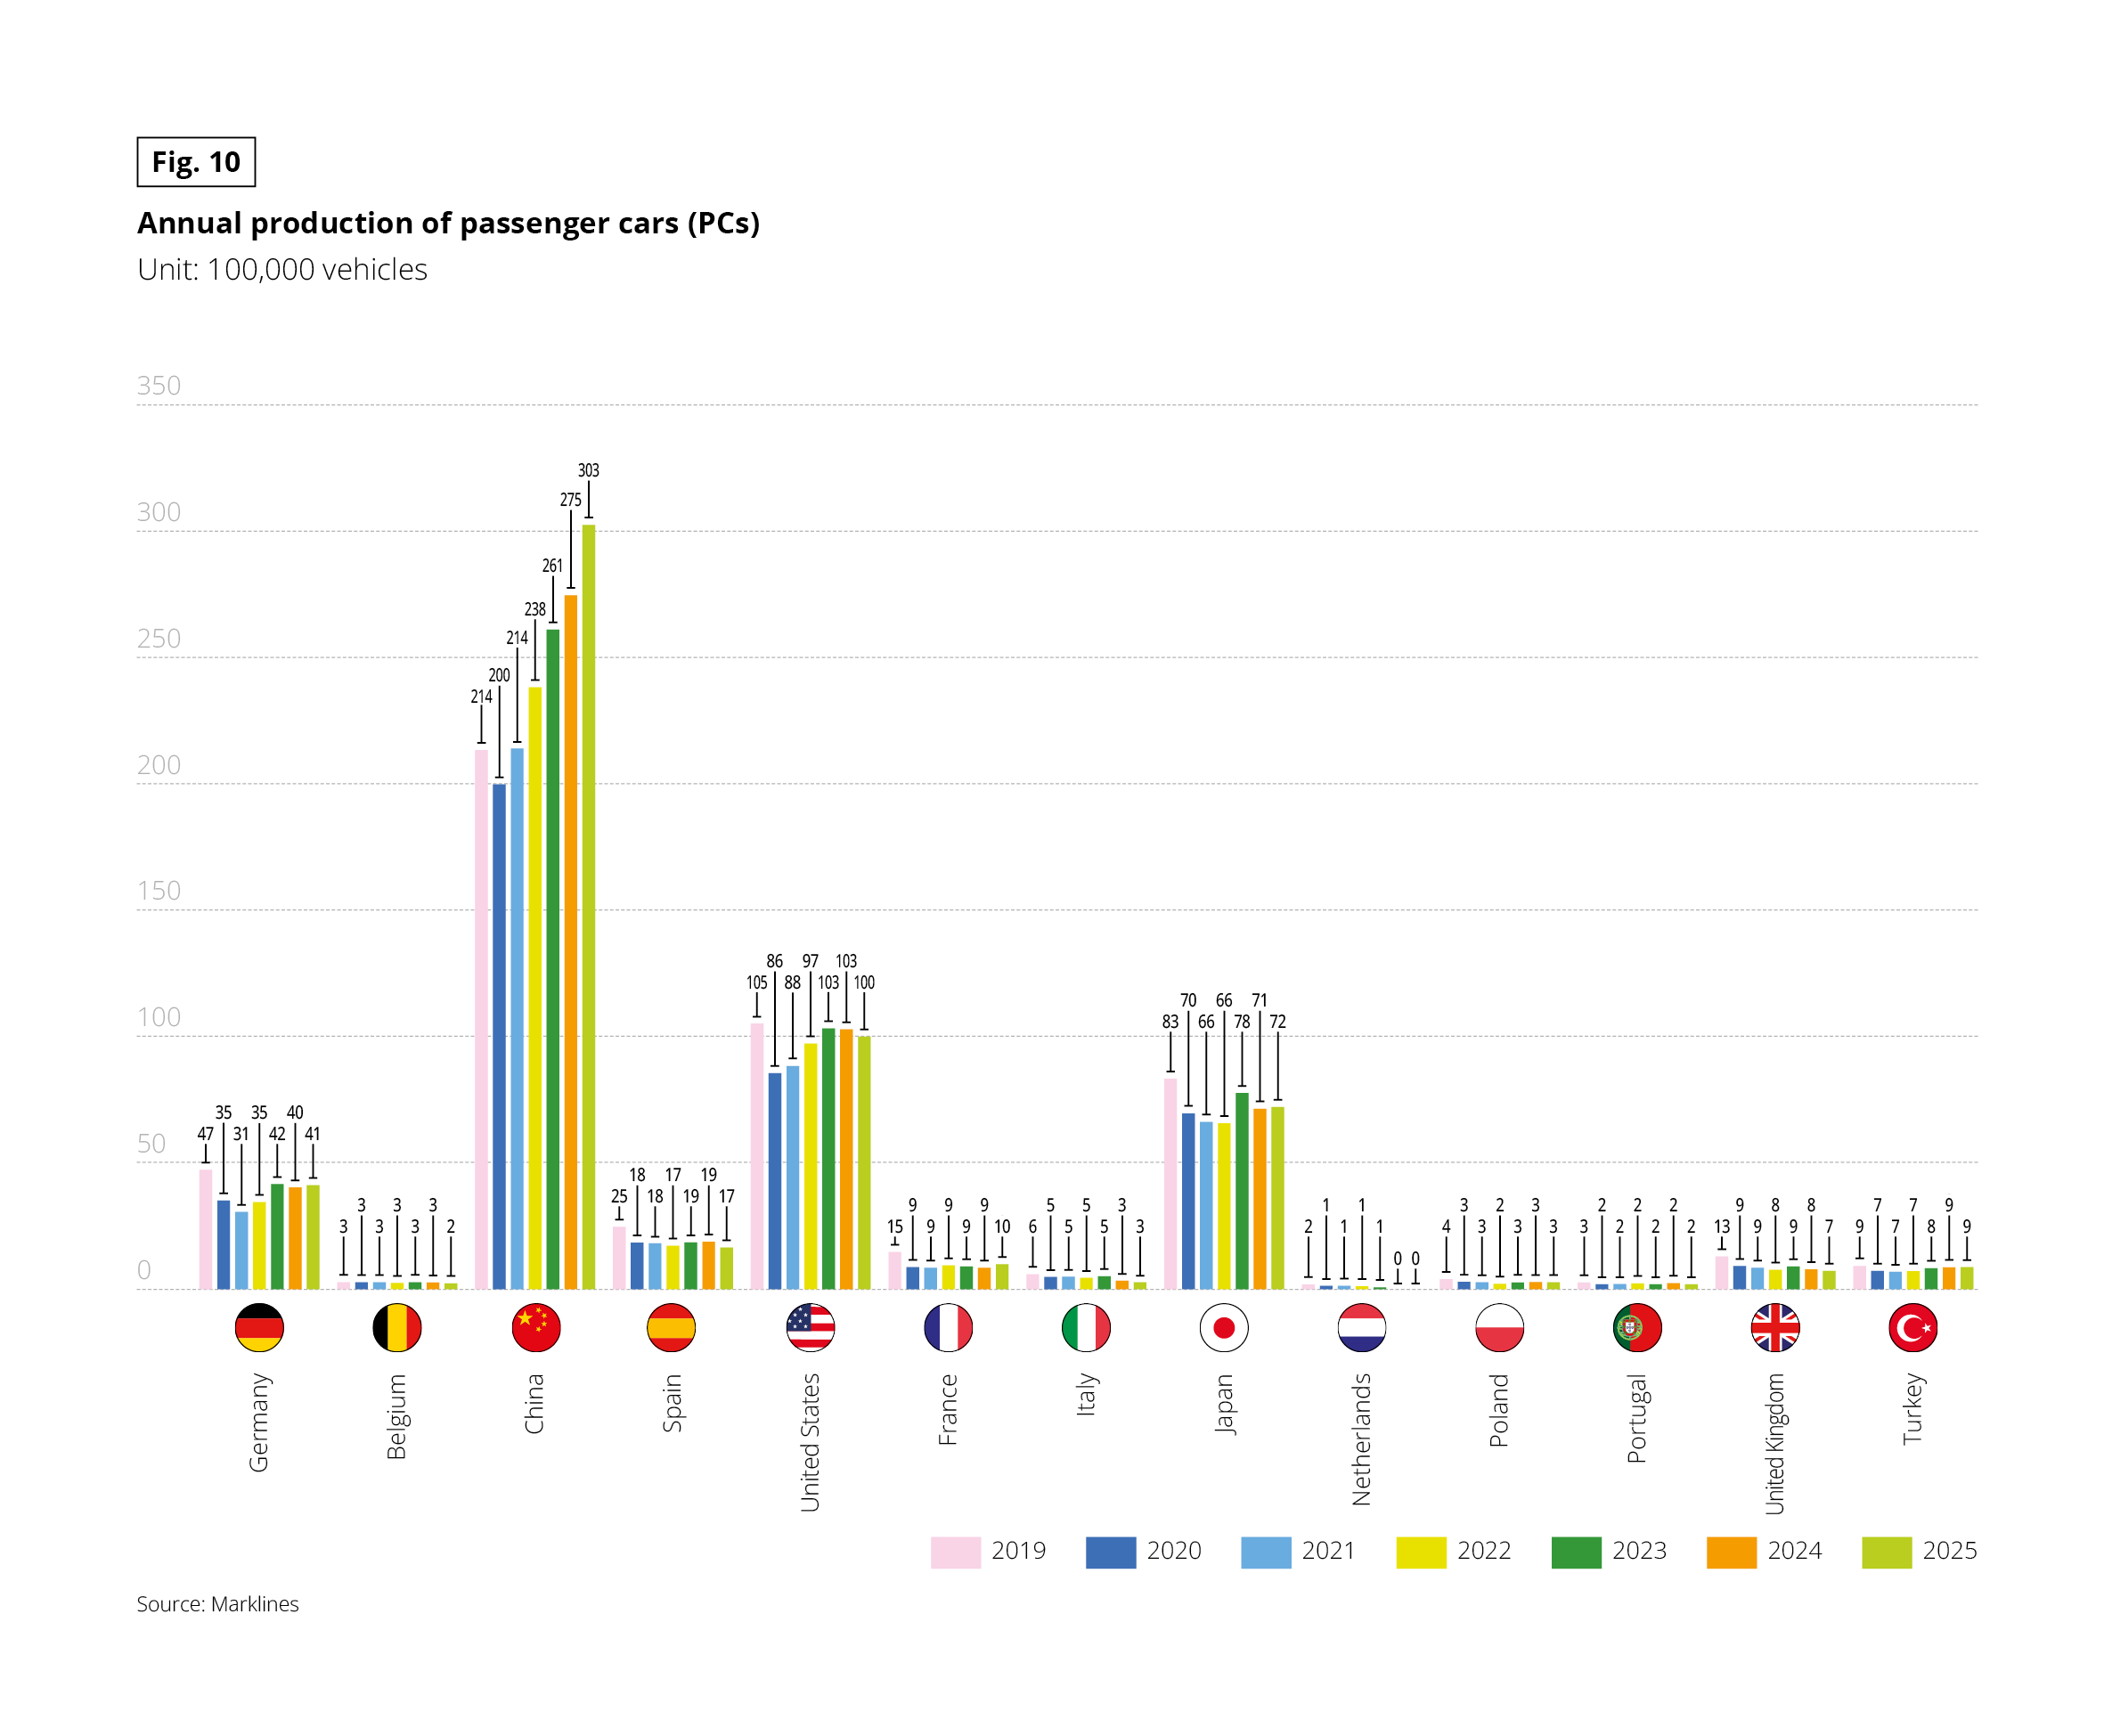 Grouped bar chart showing annual passenger car production in 13 countries from 2019 to 2025. Unit: 100,000 vehicles (47 means 4.7 million). Source: Marklines.
Values for 2019, 2020, 2021, 2022, 2023, 2024 then 2025:
• Germany: 47, 35, 31, 35, 42, 40, 41
• Belgium: 3, 3, 3, 3, 3, 3, 2
• China: 214, 200, 214, 238, 261, 275, 303
• Spain: 25, 18, 18, 17, 19, 19, 17
• United States: 105, 86, 88, 97, 103, 103, 100
• France: 15, 9, 9, 9, 9, 9, 10
• Italy: 6, 5, 5, 5, 5, 3, 3
• Japan: 83, 70, 66, 66, 78, 71, 72
• Netherlands: 2, 1, 1, 1, 1, 0, 0
• Poland: 4, 3, 3, 2, 3, 3, 3
• Portugal: 3, 2, 2, 2, 2, 2, 2
• United Kingdom: 13, 9, 9, 8, 9, 8, 7
• Turkey: 9, 7, 7, 7, 8, 9, 9
Key takeaways: China dominates with 303 in 2025 (+42% compared with 2019), ahead of the United States (100) and Japan (72). In Europe, only Turkey regains its 2019 level; Germany (41), Spain (17), France (10), Italy (3) and the United Kingdom (7) remain below.
Grouped bar chart showing annual passenger car production in 13 countries from 2019 to 2025. Unit: 100,000 vehicles (47 means 4.7 million). Source: Marklines.
Values for 2019, 2020, 2021, 2022, 2023, 2024 then 2025:
• Germany: 47, 35, 31, 35, 42, 40, 41
• Belgium: 3, 3, 3, 3, 3, 3, 2
• China: 214, 200, 214, 238, 261, 275, 303
• Spain: 25, 18, 18, 17, 19, 19, 17
• United States: 105, 86, 88, 97, 103, 103, 100
• France: 15, 9, 9, 9, 9, 9, 10
• Italy: 6, 5, 5, 5, 5, 3, 3
• Japan: 83, 70, 66, 66, 78, 71, 72
• Netherlands: 2, 1, 1, 1, 1, 0, 0
• Poland: 4, 3, 3, 2, 3, 3, 3
• Portugal: 3, 2, 2, 2, 2, 2, 2
• United Kingdom: 13, 9, 9, 8, 9, 8, 7
• Turkey: 9, 7, 7, 7, 8, 9, 9
Key takeaways: China dominates with 303 in 2025 (+42% compared with 2019), ahead of the United States (100) and Japan (72). In Europe, only Turkey regains its 2019 level; Germany (41), Spain (17), France (10), Italy (3) and the United Kingdom (7) remain below.