
Made in… where? A secondary factor


 3 min
reading time
3 min
reading time
A SYMBOLIC POWERHOUSE, YET GEOGRAPHICALLY FRAGMENTED
The internal combustion engine is inextricably linked with the Industrial Revolution. Its placement under the bonnet of a moving vehicle remains one of the era’s most striking symbols. In 1878, Amédée Bollée commercialised La Mancelle, the first mass-produced vehicle powered by a steam engine. In 1886, Carl Benz’s Benz Patent-Motorwagen became the first vehicle powered by a single-cylinder petrol engine. In the space of nearly 150 years, from the Ford Model T to the Ferrari Testarossa by way of the Golf GTI, the motor car has fundamentally shaped societal evolution. Given that its symbolic status is beyond doubt, the Observatoire Cetelem sought to determine whether the automobile remains synonymous with economic power. The findings reveal that the automotive industry, cited by a quarter of respondents, ranks only fourth among sectors deemed to best embody economic power.
Germany and Japan express this sentiment most strongly as the only countries where respondents put the automotive sector in top spot, with half of those surveyed doing so. In France, only 18% of respondents view it as the most powerful sector, heavily favouring the energy sector instead (40%). With 37% of overall responses, the energy sector takes a commanding lead across all surveyed nations as a whole. This view is strongest in Italy and Belgium (49% and 46% respectively). The energy crisis of recent months has undoubtedly played a role in this outcome. More broadly, individual countries tend to highlight whichever sector enjoys the highest international profile at home: tourism in Spain, technology in Japan and China, and agriculture in Poland.
Fig. 11 – Economic sector that best characterizes the economic power of a country (% of respondents, multiple answers possible)
Download this infographic for your presentations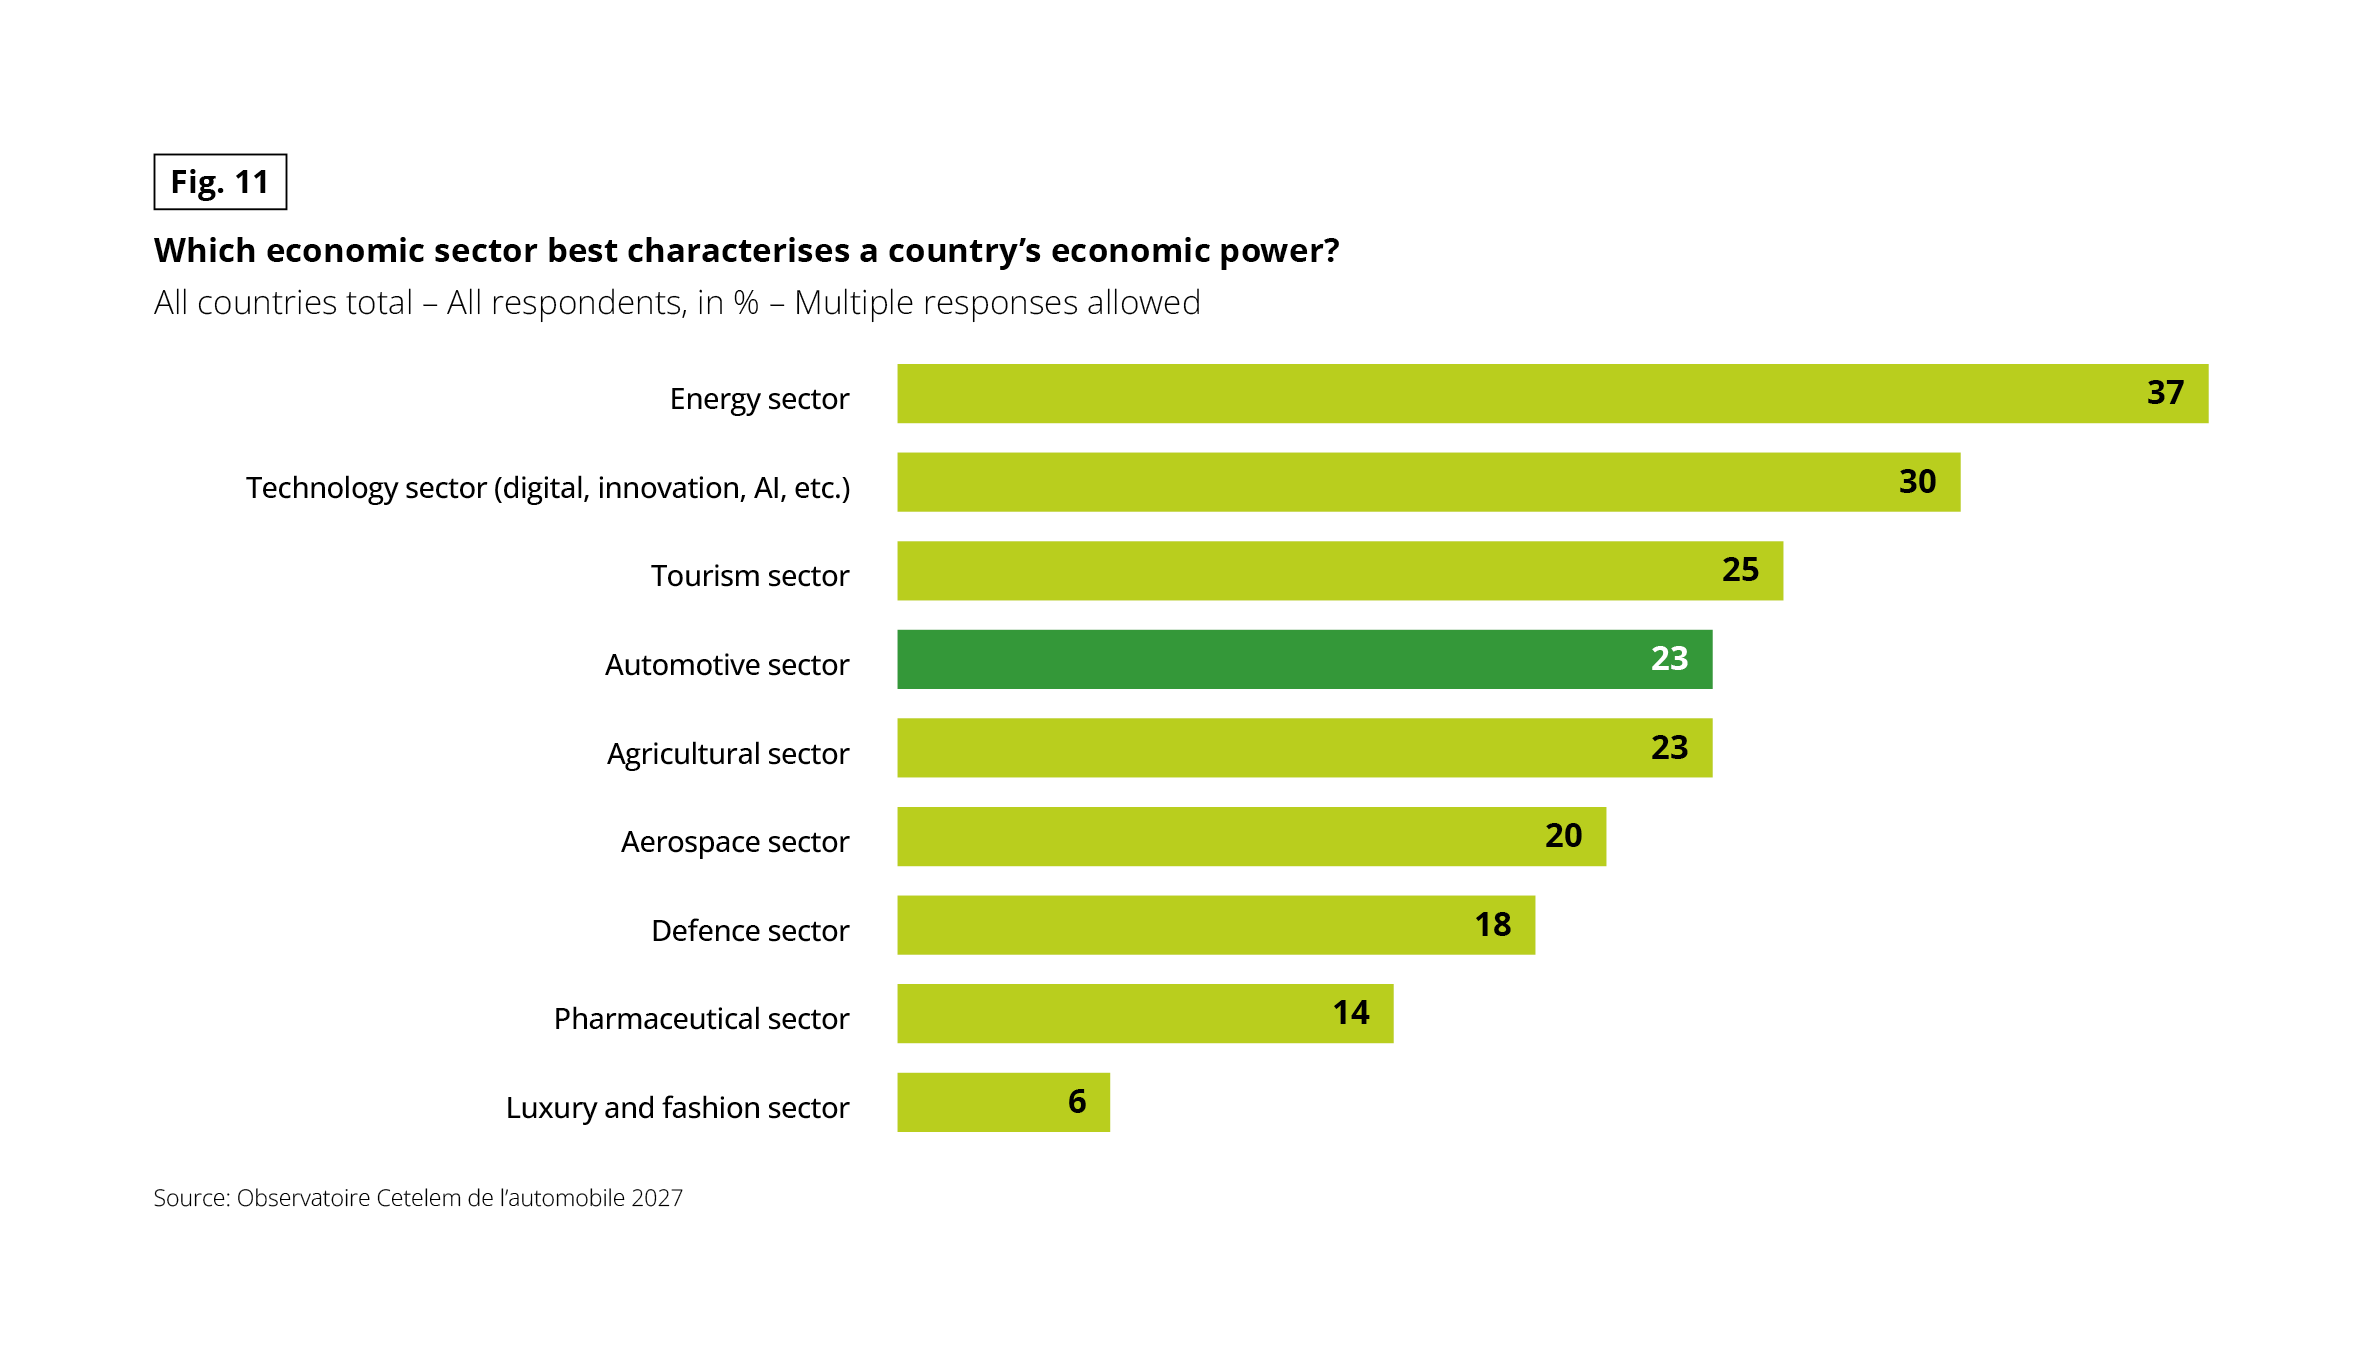 Horizontal bar chart showing, as a percentage of all respondents, the sectors cited as best characterising a country’s economic power. Multiple responses were allowed. The automotive sector is highlighted with a distinct colour. Source: Observatoire Cetelem de l’automobile 2027.
From most to least cited:
• Energy sector: 37
• Technology sector (digital, innovation, AI, etc.): 30
• Tourism sector: 25
• Automotive sector: 23
• Agricultural sector: 23
• Aerospace sector: 20
• Defence sector: 18
• Pharmaceutical sector: 14
• Luxury and fashion sector: 6
Key takeaways: energy (37%) and technology (30%) are well ahead. The automotive sector, level with agriculture (23%), sits in the middle of the ranking.
Horizontal bar chart showing, as a percentage of all respondents, the sectors cited as best characterising a country’s economic power. Multiple responses were allowed. The automotive sector is highlighted with a distinct colour. Source: Observatoire Cetelem de l’automobile 2027.
From most to least cited:
• Energy sector: 37
• Technology sector (digital, innovation, AI, etc.): 30
• Tourism sector: 25
• Automotive sector: 23
• Agricultural sector: 23
• Aerospace sector: 20
• Defence sector: 18
• Pharmaceutical sector: 14
• Luxury and fashion sector: 6
Key takeaways: energy (37%) and technology (30%) are well ahead. The automotive sector, level with agriculture (23%), sits in the middle of the ranking.
A VEHICLE’S COUNTRY OF ORIGIN AROUSES LITTLE INTEREST
Looking more closely at the data reveals that this downplaying of the automotive sector’s economic clout is coupled with a relative indifference towards where a vehicle is actually built. In fact, country of origin is the factor drivers care about least when choosing a car (23%). The Japanese once again demonstrate a streak of nationalism, a recurring theme throughout this report, with a mere 9% paying any heed to where a vehicle is produced. While views across all other countries are broadly aligned, Portugal and the Netherlands show the greatest disinterest in the country of manufacture.
Fig. 12 – Least considered criteria in choosing a car, 2027 and 2024 surveys (%, max. 3 responses)
Download this infographic for your presentations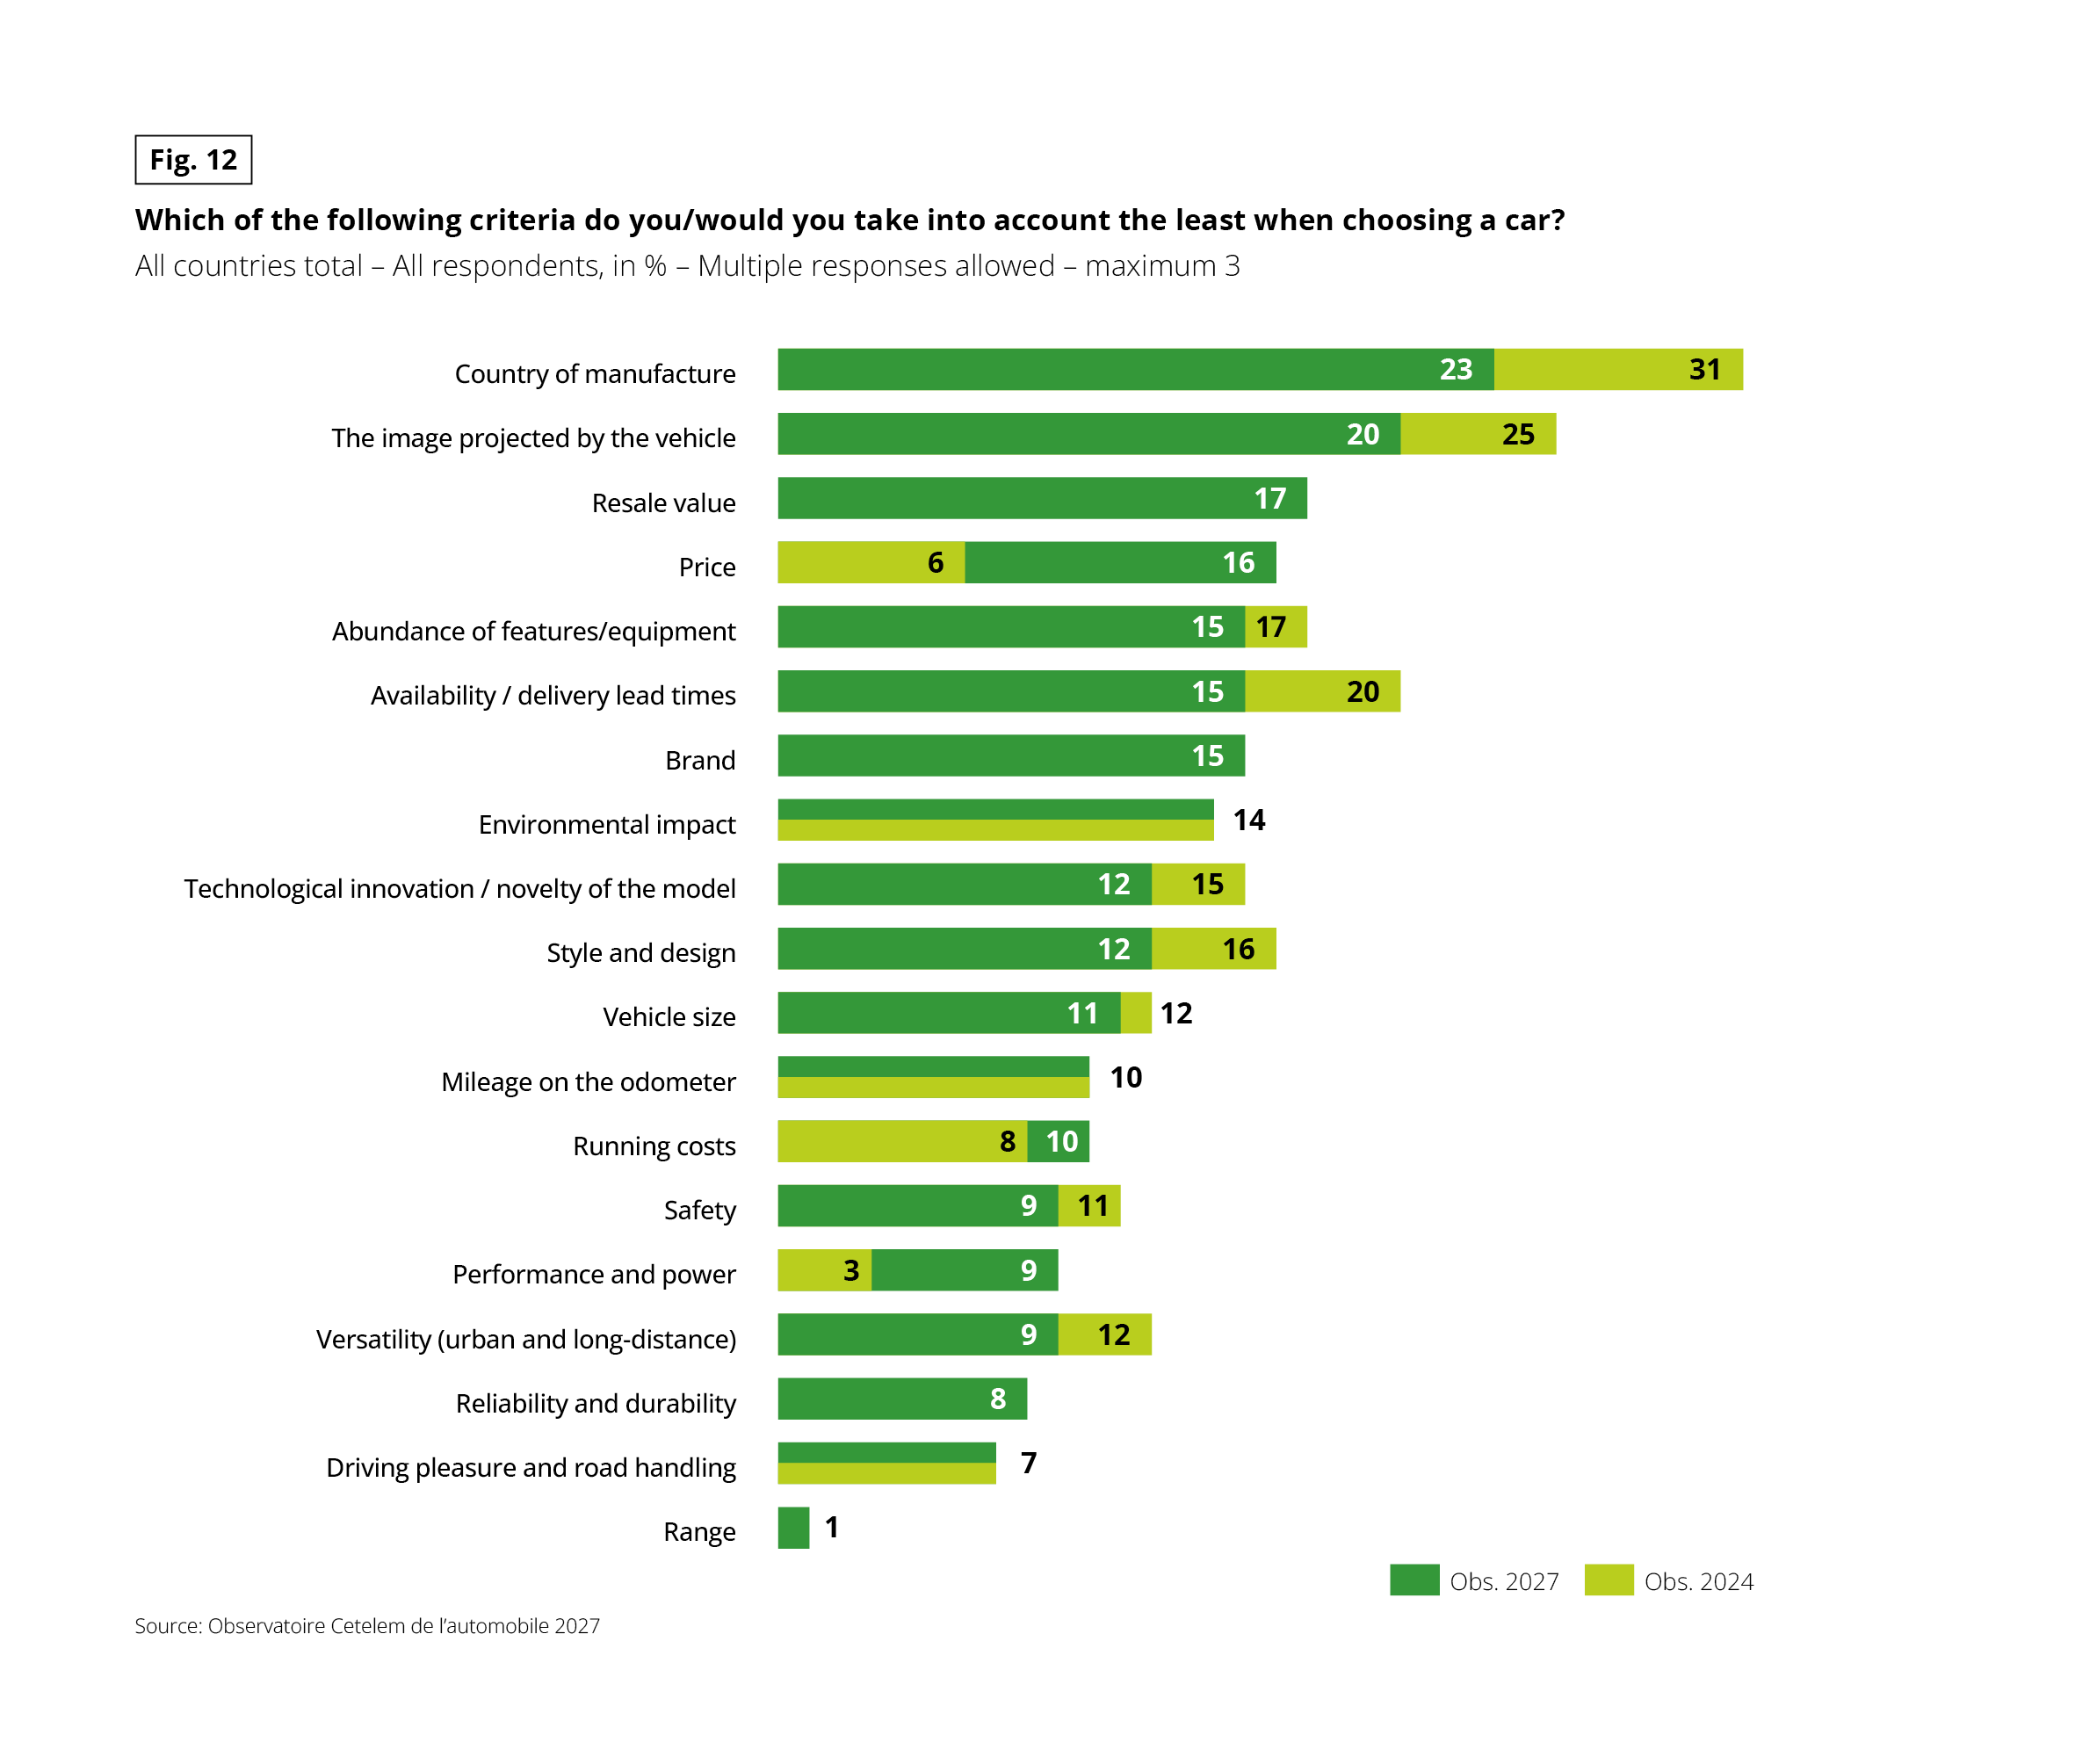 Horizontal bar chart comparing, for 19 criteria, the share of respondents who take them into account the least when choosing a car, in the 2027 and 2024 surveys. All countries total, all respondents, in percent, multiple responses allowed (maximum 3). Source: Observatoire Cetelem de l’automobile 2027.
Values (2027 then 2024), from most to least cited in 2027:
• Country of manufacture: 23 then 31
• The image projected by the vehicle: 20 then 25
• Resale value: 17 (no 2024 value shown)
• Price: 16 then 6
• Abundance of features/equipment: 15 then 17
• Availability / delivery lead times: 15 then 20
• Brand: 15 (no 2024 value shown)
• Environmental impact: 14 in both 2027 and 2024
• Technological innovation / novelty of the model: 12 then 15
• Style and design: 12 then 16
• Vehicle size: 11 then 12
• Mileage on the odometer: 10 in both 2027 and 2024
• Running costs: 10 then 8
• Safety: 9 then 11
• Performance and power: 9 then 3
• Versatility (urban and long-distance): 9 then 12
• Reliability and durability: 8 (no 2024 value shown)
• Driving pleasure and road handling: 7 in both 2027 and 2024
• Range: 1 (no 2024 value shown)
Key takeaways: country of manufacture remains the least considered criterion in both surveys. For most comparable criteria the share falls between 2024 and 2027. It rises for price (6 to 16), performance and power (3 to 9) and running costs (8 to 10).
Horizontal bar chart comparing, for 19 criteria, the share of respondents who take them into account the least when choosing a car, in the 2027 and 2024 surveys. All countries total, all respondents, in percent, multiple responses allowed (maximum 3). Source: Observatoire Cetelem de l’automobile 2027.
Values (2027 then 2024), from most to least cited in 2027:
• Country of manufacture: 23 then 31
• The image projected by the vehicle: 20 then 25
• Resale value: 17 (no 2024 value shown)
• Price: 16 then 6
• Abundance of features/equipment: 15 then 17
• Availability / delivery lead times: 15 then 20
• Brand: 15 (no 2024 value shown)
• Environmental impact: 14 in both 2027 and 2024
• Technological innovation / novelty of the model: 12 then 15
• Style and design: 12 then 16
• Vehicle size: 11 then 12
• Mileage on the odometer: 10 in both 2027 and 2024
• Running costs: 10 then 8
• Safety: 9 then 11
• Performance and power: 9 then 3
• Versatility (urban and long-distance): 9 then 12
• Reliability and durability: 8 (no 2024 value shown)
• Driving pleasure and road handling: 7 in both 2027 and 2024
• Range: 1 (no 2024 value shown)
Key takeaways: country of manufacture remains the least considered criterion in both surveys. For most comparable criteria the share falls between 2024 and 2027. It rises for price (6 to 16), performance and power (3 to 9) and running costs (8 to 10).
EQUIVALENCE OF ORIGIN AND ECONOMIC CHARACTERISTICS
More broadly, when it comes to economic or financial criteria, drivers generally do not single out any particular feature to assess a vehicle. Ownership structure, brand origin and manufacturing location are weighed with equal importance. The China–US–Japan trio, a grouping that recurs throughout this study, attaches the greatest importance to these factors, contrasting sharply with another trio, Belgium–Netherlands–Portugal, which pays them the least attention.
Fig. 13 – Importance for a car to be produced in its country, under a national brand or with national capital
Download this infographic for your presentations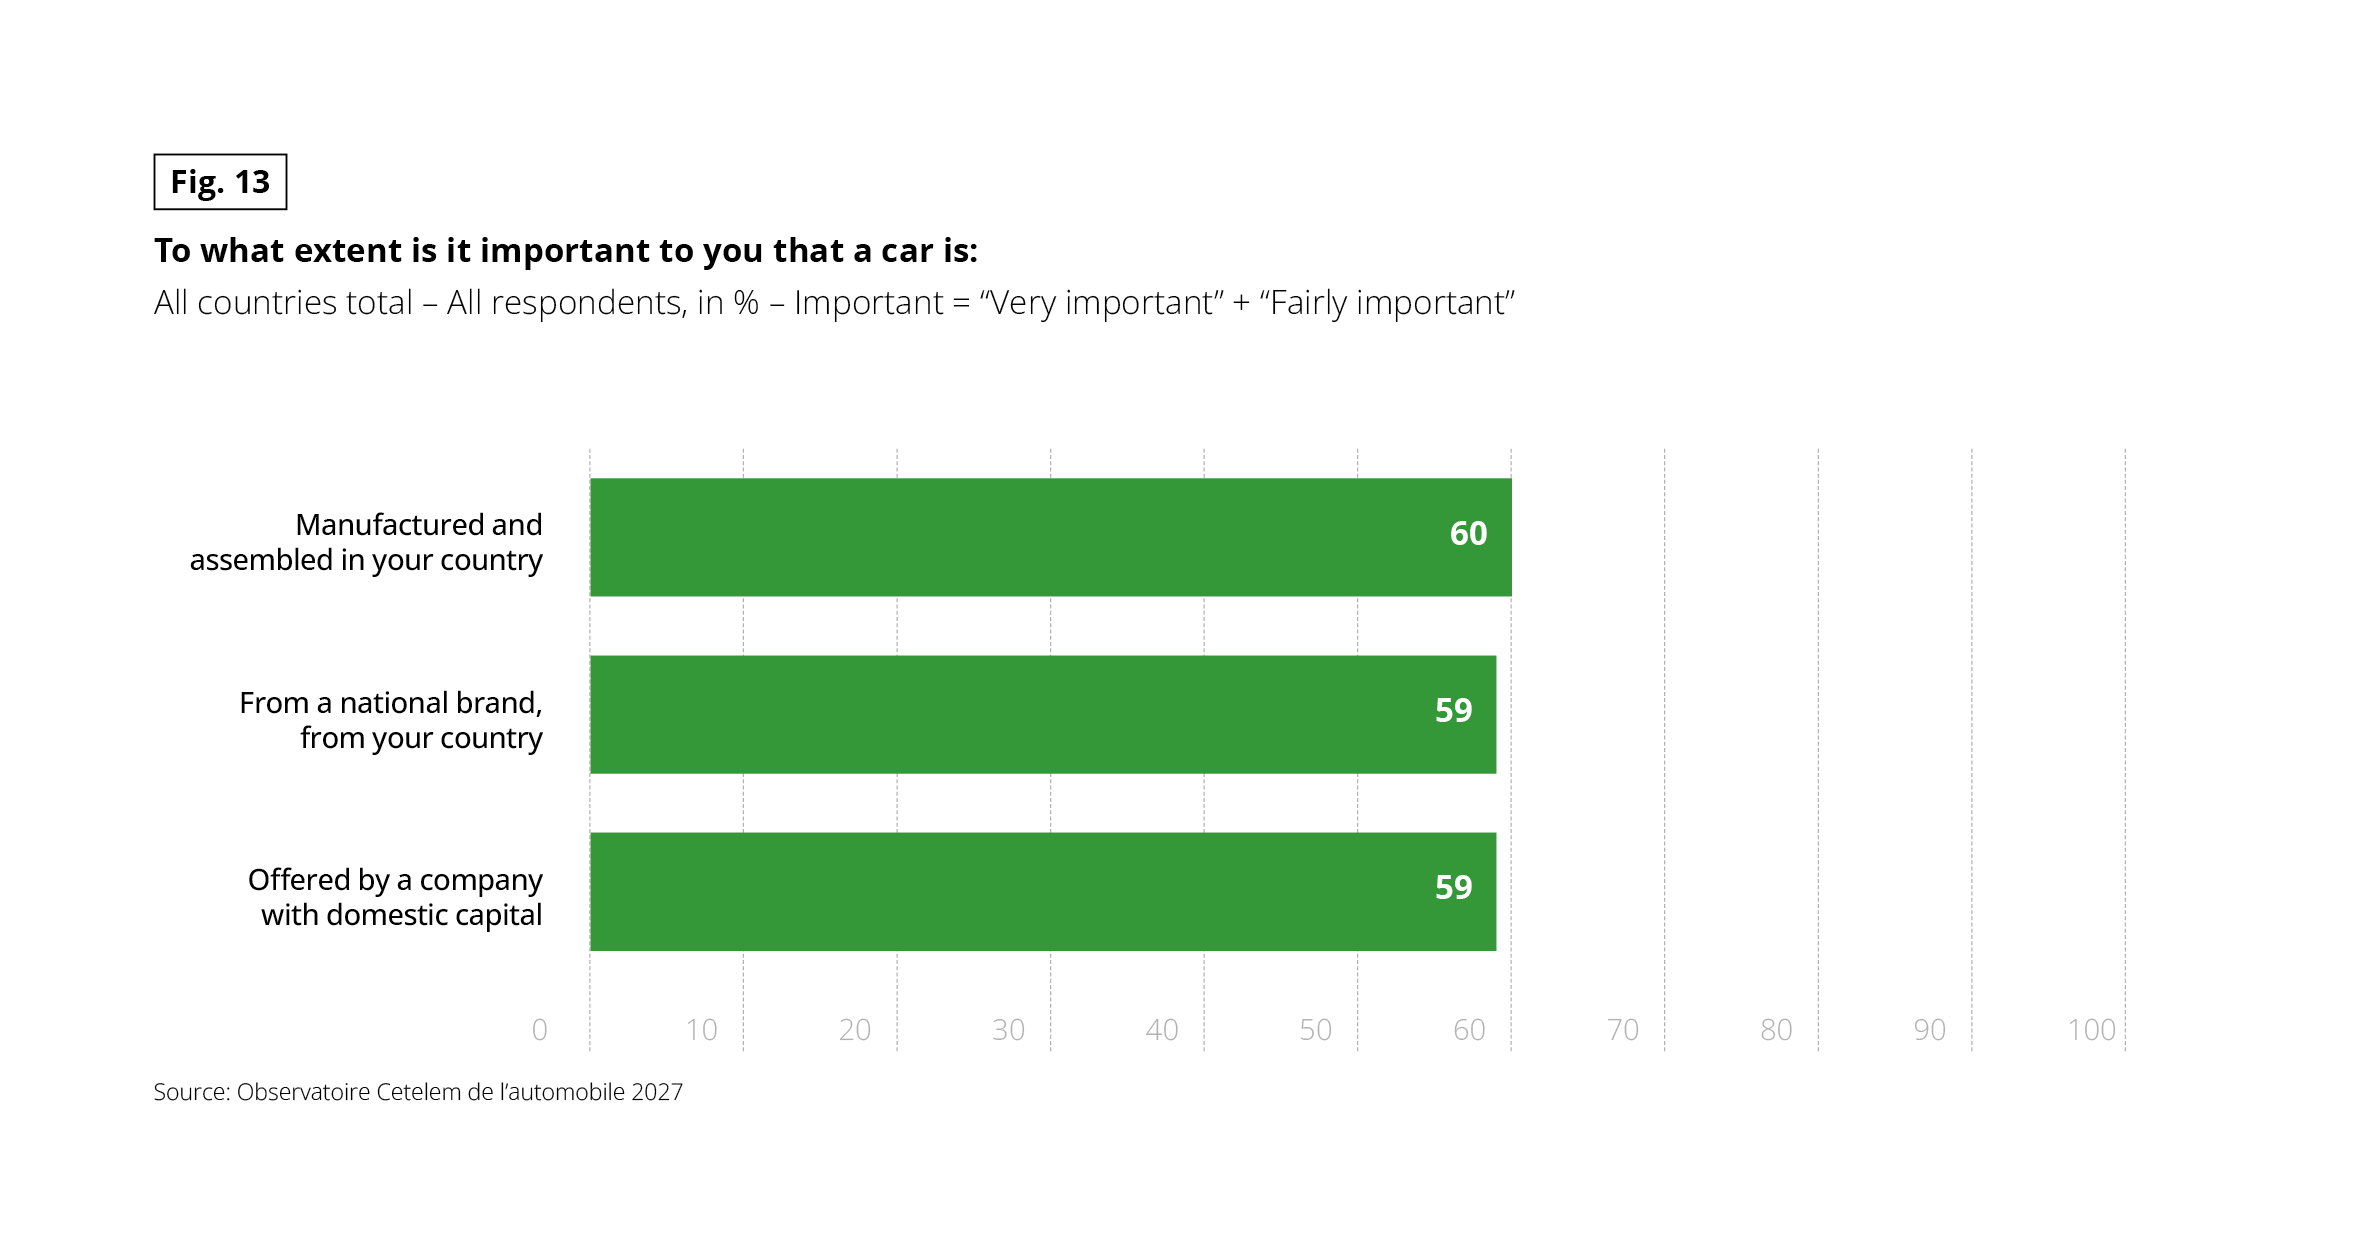 Horizontal bar chart showing the share of respondents for whom it is important that a car is manufactured and assembled in their country, from a national brand, or offered by a company with domestic capital. All countries total, all respondents, in percent. “Important” combines “Very important” and “Fairly important”. Source: Observatoire Cetelem de l’automobile 2027.
• Manufactured and assembled in your country: 60
• From a national brand, from your country: 59
• Offered by a company with domestic capital: 59
Key takeaways: the three criteria are almost identical and concern about 6 respondents in 10.
Horizontal bar chart showing the share of respondents for whom it is important that a car is manufactured and assembled in their country, from a national brand, or offered by a company with domestic capital. All countries total, all respondents, in percent. “Important” combines “Very important” and “Fairly important”. Source: Observatoire Cetelem de l’automobile 2027.
• Manufactured and assembled in your country: 60
• From a national brand, from your country: 59
• Offered by a company with domestic capital: 59
Key takeaways: the three criteria are almost identical and concern about 6 respondents in 10.
HEAD OFFICE AND ORIGIN: BROADLY ALIGNED
For most brands, the country of origin coincides with group headquarters. This dynamic also translates into proportionally strong domestic sales, particularly for Ford and BYD. With its head office based in the Netherlands, Stellantis group brands stand apart, as sales in their host country are naturally negligible.
Fig. 14 – Country’s share in the brand’s global sales, 2019-2025 (%)
Download this infographic for your presentations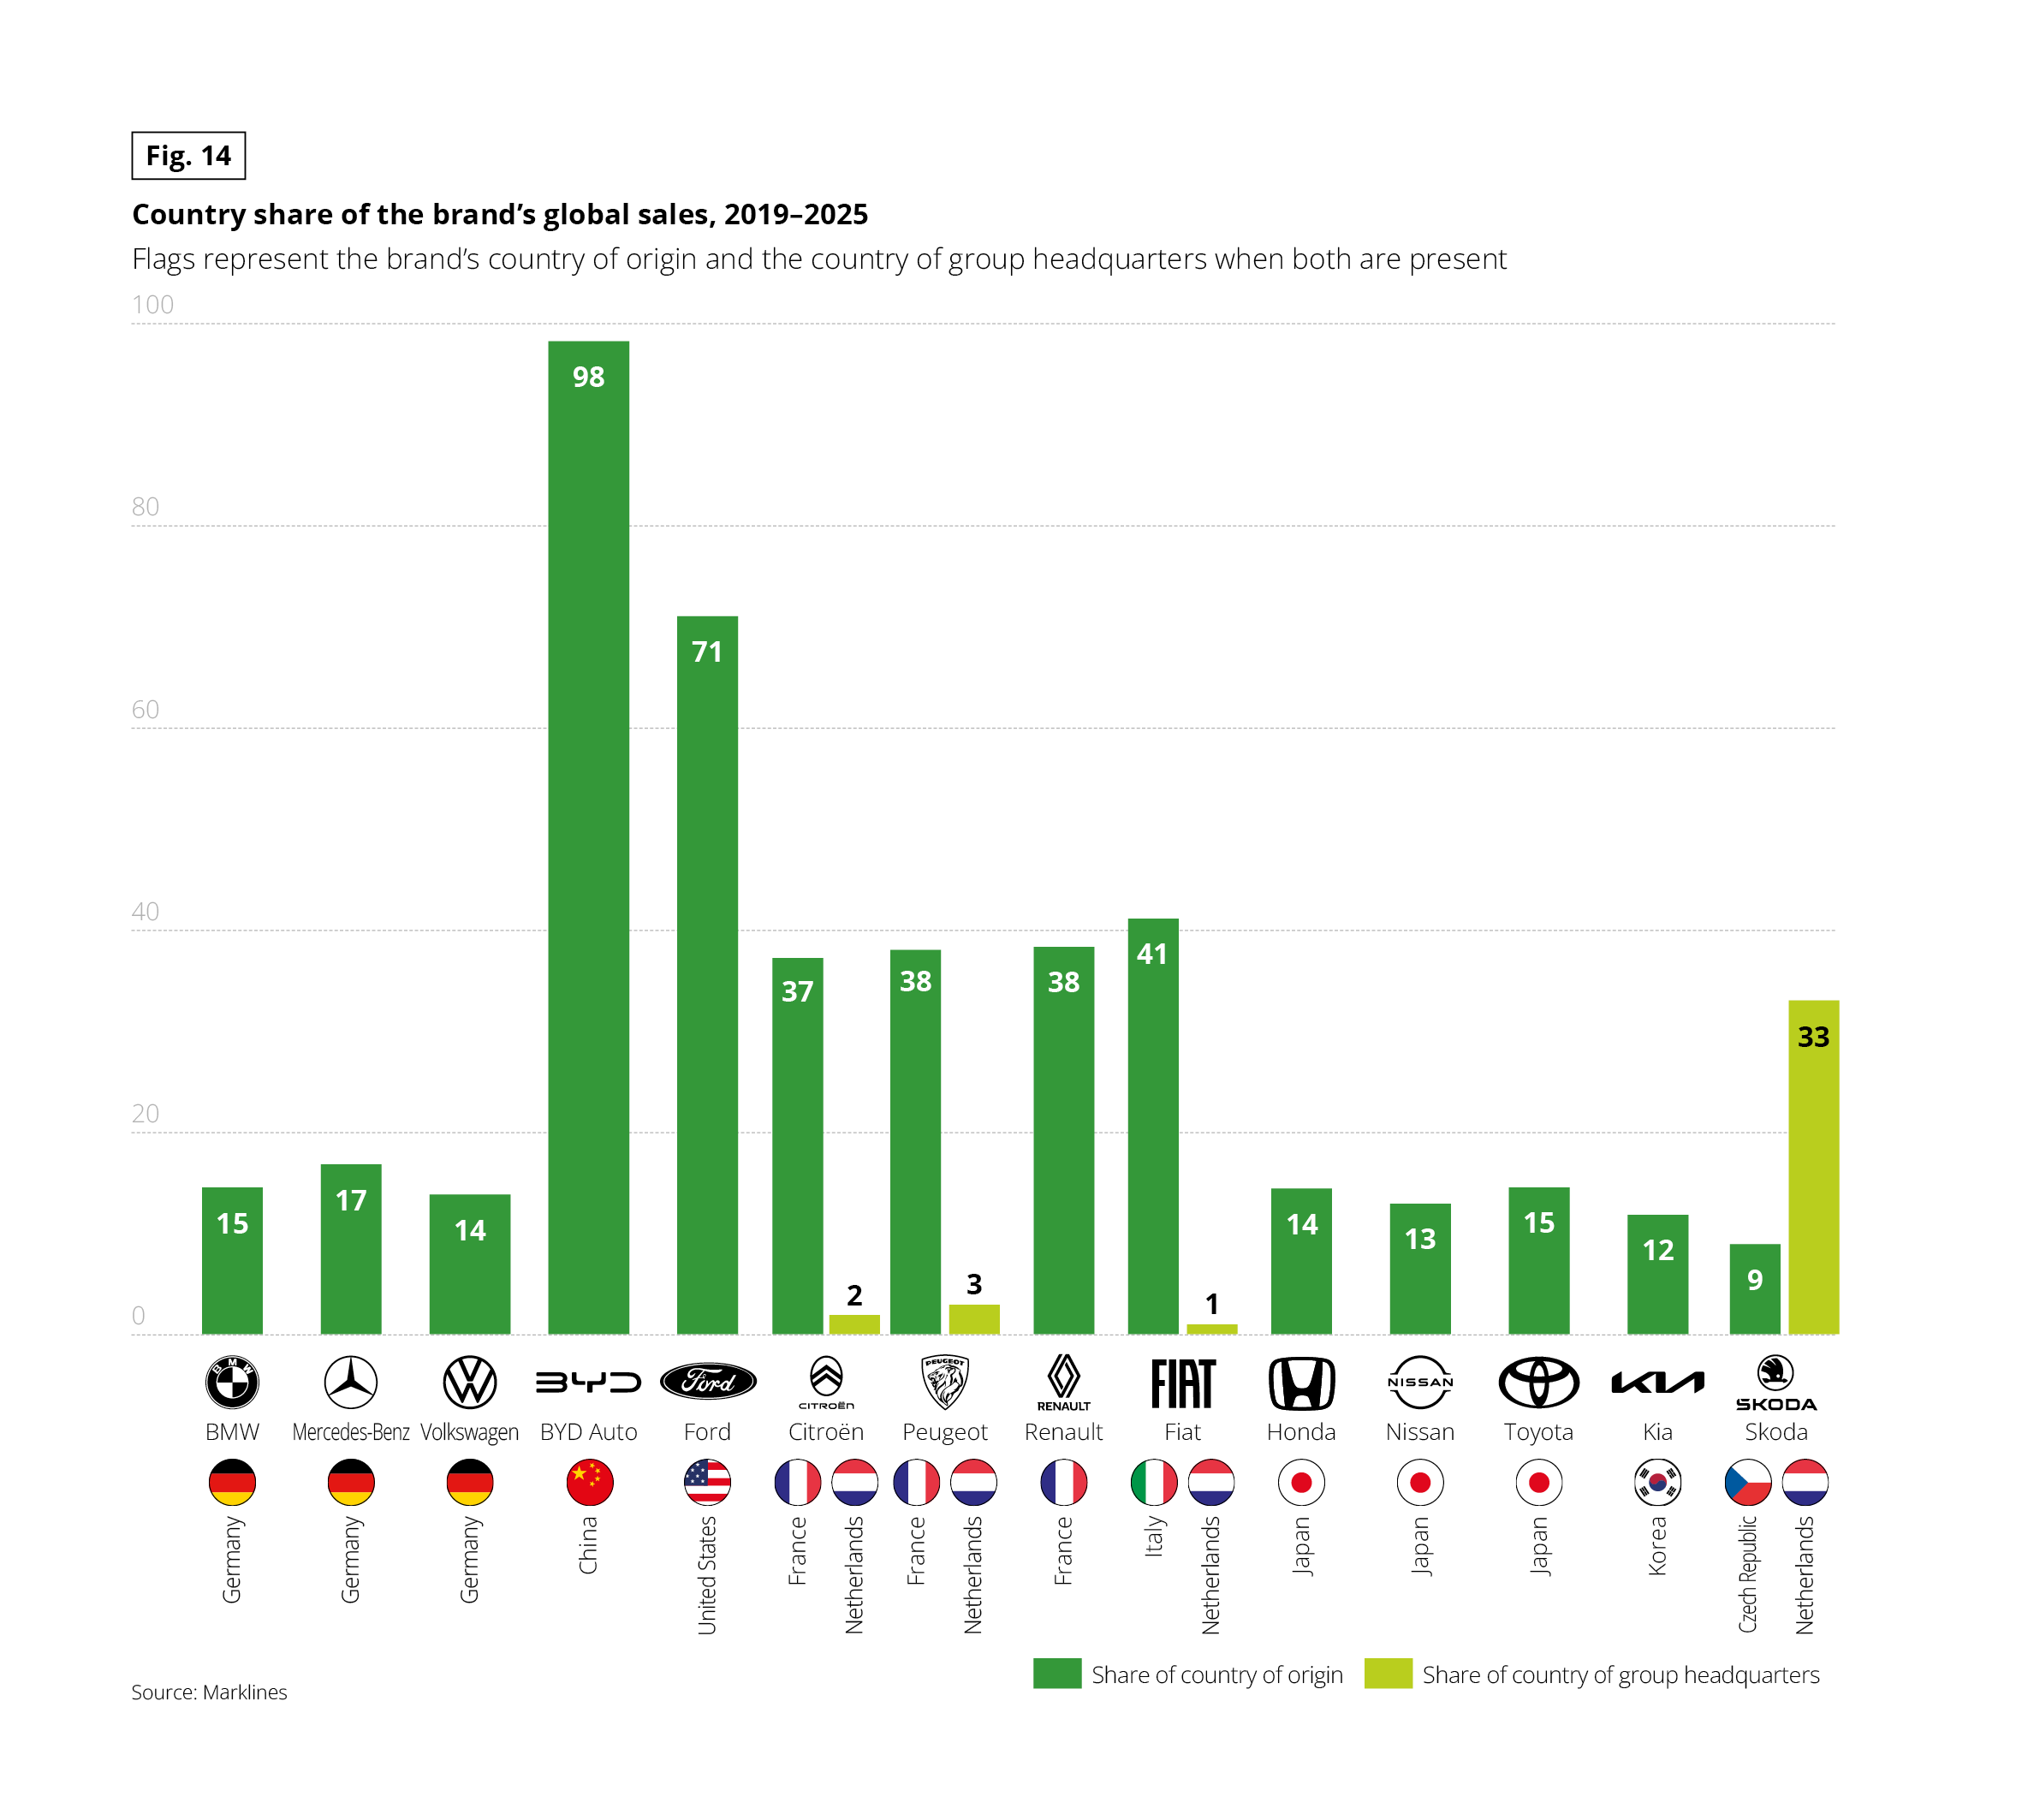 Grouped bar chart showing, for 14 brands, the country’s share of the brand’s global sales over 2019–2025. Two series: share of the country of origin, and share of the country of group headquarters, shown when the two differ (five brands only). The unit is not stated and is presumably percent. Source: Marklines.
Values (country of origin; country of group headquarters where applicable):
• BMW (Germany): 15
• Mercedes-Benz (Germany): 17
• Volkswagen (Germany): 14
• BYD Auto (China): 98
• Ford (United States): 71
• Citroën (France; headquarters Netherlands): 37; 2
• Peugeot (France; headquarters Netherlands): 38; 3
• Renault (France): 38
• Fiat (Italy; headquarters Netherlands): 41; 1
• Honda (Japan): 14
• Nissan (Japan): 13
• Toyota (Japan): 15
• Kia (Korea): 12
• Skoda (Czech Republic; headquarters Netherlands): 9; 33
Key takeaways: BYD (98%) and Ford (71%) make most or a large part of their sales in their home country. German and Japanese brands make 13 to 17% there. French brands and Fiat are between 37 and 41%.
Grouped bar chart showing, for 14 brands, the country’s share of the brand’s global sales over 2019–2025. Two series: share of the country of origin, and share of the country of group headquarters, shown when the two differ (five brands only). The unit is not stated and is presumably percent. Source: Marklines.
Values (country of origin; country of group headquarters where applicable):
• BMW (Germany): 15
• Mercedes-Benz (Germany): 17
• Volkswagen (Germany): 14
• BYD Auto (China): 98
• Ford (United States): 71
• Citroën (France; headquarters Netherlands): 37; 2
• Peugeot (France; headquarters Netherlands): 38; 3
• Renault (France): 38
• Fiat (Italy; headquarters Netherlands): 41; 1
• Honda (Japan): 14
• Nissan (Japan): 13
• Toyota (Japan): 15
• Kia (Korea): 12
• Skoda (Czech Republic; headquarters Netherlands): 9; 33
Key takeaways: BYD (98%) and Ford (71%) make most or a large part of their sales in their home country. German and Japanese brands make 13 to 17% there. French brands and Fiat are between 37 and 41%.
KEY FIGURES
- 71 millions vehicles sold worldwide in 2026
- 2,42% of the active population in France is employed by the automotive sector
- 1 in 4 people believes the automobile best embodies a country’s economic power
- 1 in 4 people will disregard country of manufacture when choosing a vehicle, the lowest-ranked criterion