The mood among Europeans: time for a bounce back


Conducted between 5 and 19 November 2021, when the Delta variant was already having a significant impact and Omicron was still in its infancy, the Observatoire Cetelem Barometer highlights the renewed optimism of Europeans. Whether they are asked about the general situation in their country or their personal circumstances, the mood among consumers is better than it has been in many years. The billions of euros of support provided and the numerous measures taken by governments to alleviate the devastating effects of the Covid-19 crisis on economies have put Europeans back on track financially. Their consumption levels remain sensible and are coupled with a strong tendency to save. But just as the skies look to be clearing, new clouds are rolling in: a return to high inflation and the strength of the Omicron wave mean that the next few months will continue to be marked by uncertainty. We should therefore take heart from the good news this Barometer brings, without necessarily minimising the concerns it raises.
The 2021 Observatoire Cetelem Barometer left us in no doubt regarding the gloom felt by Europeans. Successive Covid waves had eroded the euphoria observed the previous year.
High scores for national situations
This latest edition sees a smile returning to people’s faces. The average score people give the general situation in their country is 5.4, exactly the same as before the crisis and the highest score in the last 15 years.

And yet, this average figure masks disparities between the countries. The “happy” countries in the North post particularly high scores. Indeed, Denmark, the birthplace of hygge, the art of happiness, and Norway post the highest score: 7.1 out of 10. Conversely, the more “timorous” countries tend to be concentrated in Eastern Europe, with Bulgaria and Slovakia in particular posting a feeble rating of 3.8. What’s more, Slovakia and the Czech Republic post lower scores than in the previous edition.
France, Spain and the United Kingdom display the biggest improvements: +1.1 points. It is also worth noting that, despite this bounce, several countries are a long way off returning to the high scores of the 2020 edition.
This is especially true for Austria and Germany (-1.1 pts and -0.7 pts respectively between 2020 and 2022) (Fig. 1 Barometer).
Fig. 1 Perceived country situation in 2021–2022
Download this infographic for your presentations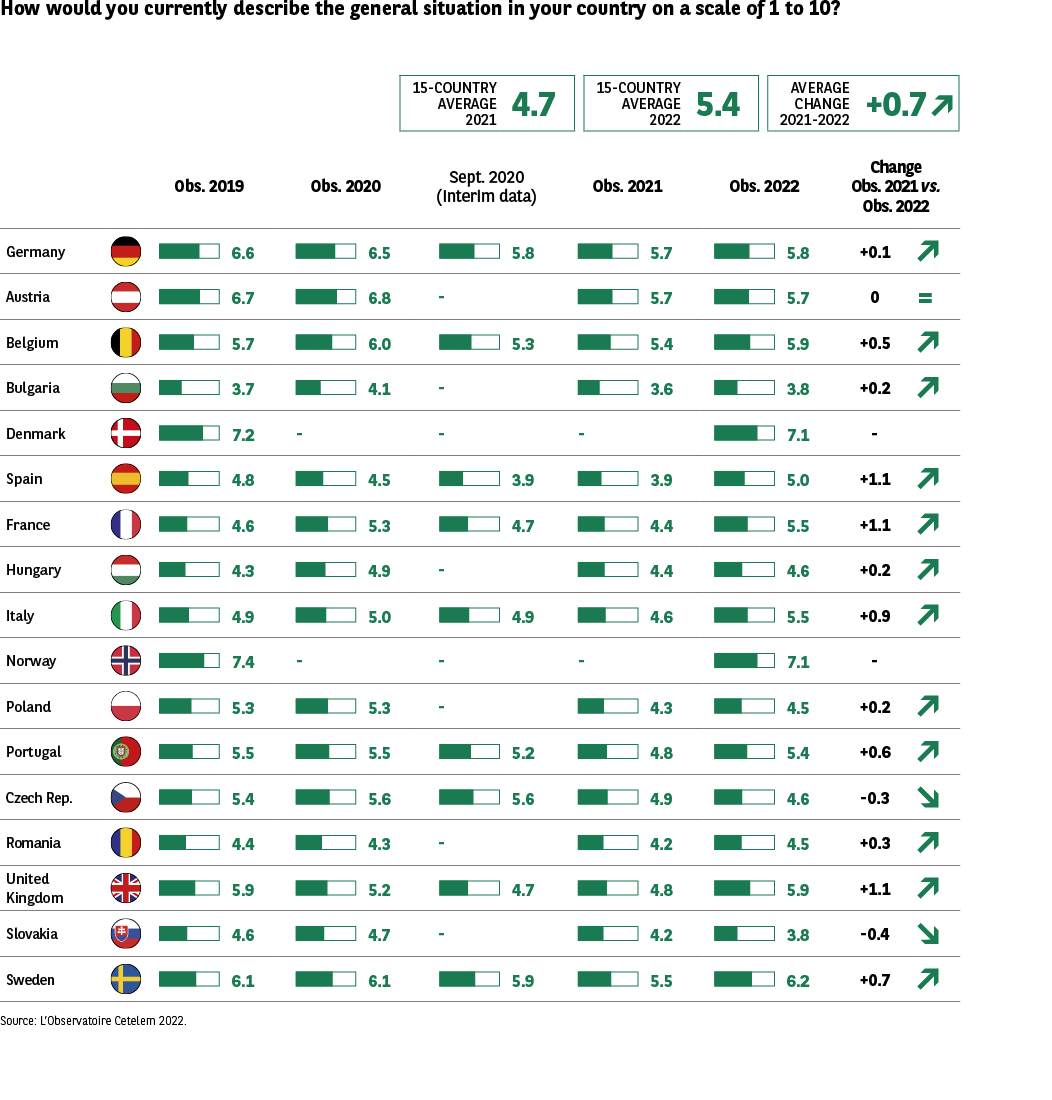 The image shows results from the Observatoire Cetelem 2021 survey.
It presents how residents of 15 European countries rate the general situation of their country on a scale from 1 to 10, for the years 2020, an intermediate measurement in September 2020, and 2021.
A 2020–2021 change is shown for each country.
Decorative arrows indicate the direction of variation.
Key Visual Elements
• A list of countries with their flags.
• For each country:
• Average score in 2020
• Intermediate score in September 2020 (when available)
• Average score in 2021
• Change between 2020 and 2021
• Header figures:
• 2020 average across 15 countries: 5.4
• 2021 average across 15 countries: 4.7
• Average change: –0.7
Country
2020
Sept. 2020
2021
Change 20–21
Germany
6.5
5.8
5.7
–0.8
Austria
6.8
(unreadable/absent)
5.7
–1.1
Belgium
6.0
5.3
5.4
–0.6
Bulgaria
4.1
(unreadable/absent)
3.6
–0.5
Spain
4.5
3.9
3.9
–0.6
France
5.3
4.7
4.4
–0.9
Hungary
4.9
(unreadable/absent)
4.4
–0.5
Italy
5.0
4.9
4.6
–0.4
Poland
5.3
(unreadable/absent)
4.3
–1.0
Portugal
5.5
5.2
4.8
–0.7
Czech Republic
5.6
5.6
4.9
–0.7
Romania
4.3
(unreadable/absent)
4.2
–0.2
United Kingdom
5.2
4.7
4.8
–0.4
Slovakia
4.7
(unreadable/absent)
4.2
–0.5
Sweden
6.1
5.9
5.5
–0.6
Main Insight
Across all 15 countries, perceived national situation declined between 2020 and 2021.
The average drop is –0.7 points, with the sharpest decreases in Austria (–1.1) and Poland (–1.0).
No country shows an increase.
The image shows results from the Observatoire Cetelem 2021 survey.
It presents how residents of 15 European countries rate the general situation of their country on a scale from 1 to 10, for the years 2020, an intermediate measurement in September 2020, and 2021.
A 2020–2021 change is shown for each country.
Decorative arrows indicate the direction of variation.
Key Visual Elements
• A list of countries with their flags.
• For each country:
• Average score in 2020
• Intermediate score in September 2020 (when available)
• Average score in 2021
• Change between 2020 and 2021
• Header figures:
• 2020 average across 15 countries: 5.4
• 2021 average across 15 countries: 4.7
• Average change: –0.7
Country
2020
Sept. 2020
2021
Change 20–21
Germany
6.5
5.8
5.7
–0.8
Austria
6.8
(unreadable/absent)
5.7
–1.1
Belgium
6.0
5.3
5.4
–0.6
Bulgaria
4.1
(unreadable/absent)
3.6
–0.5
Spain
4.5
3.9
3.9
–0.6
France
5.3
4.7
4.4
–0.9
Hungary
4.9
(unreadable/absent)
4.4
–0.5
Italy
5.0
4.9
4.6
–0.4
Poland
5.3
(unreadable/absent)
4.3
–1.0
Portugal
5.5
5.2
4.8
–0.7
Czech Republic
5.6
5.6
4.9
–0.7
Romania
4.3
(unreadable/absent)
4.2
–0.2
United Kingdom
5.2
4.7
4.8
–0.4
Slovakia
4.7
(unreadable/absent)
4.2
–0.5
Sweden
6.1
5.9
5.5
–0.6
Main Insight
Across all 15 countries, perceived national situation declined between 2020 and 2021.
The average drop is –0.7 points, with the sharpest decreases in Austria (–1.1) and Poland (–1.0).
No country shows an increase.
From a personal standpoint, things are good and things are better
As is usually the case, people view their personal circumstances more positively than the overall situation. And here once again, the bounce back has been tremendous. With an average of 6.2, Europeans have never been so optimistic. Also significant is the fact that no nation scores lower than 5 out of 10, with only the Czech Republic posting a lower rating than previously (by just 0.1 points).
The rises posted fall short of the increases recorded for overall national situations, with the United Kingdom again registering the sharpest growth (+0.9 pts), joining Italy and Spain in a trio of European populations who consider their circumstances to be better than they were before the crisis.
One quirk in the data is that the Danes and Norwegians score their personal circumstances lower than the general situation in their country (Fig. 3 Barometer).
Fig. 2 Annual variations in GDP per capita
Download this infographic for your presentations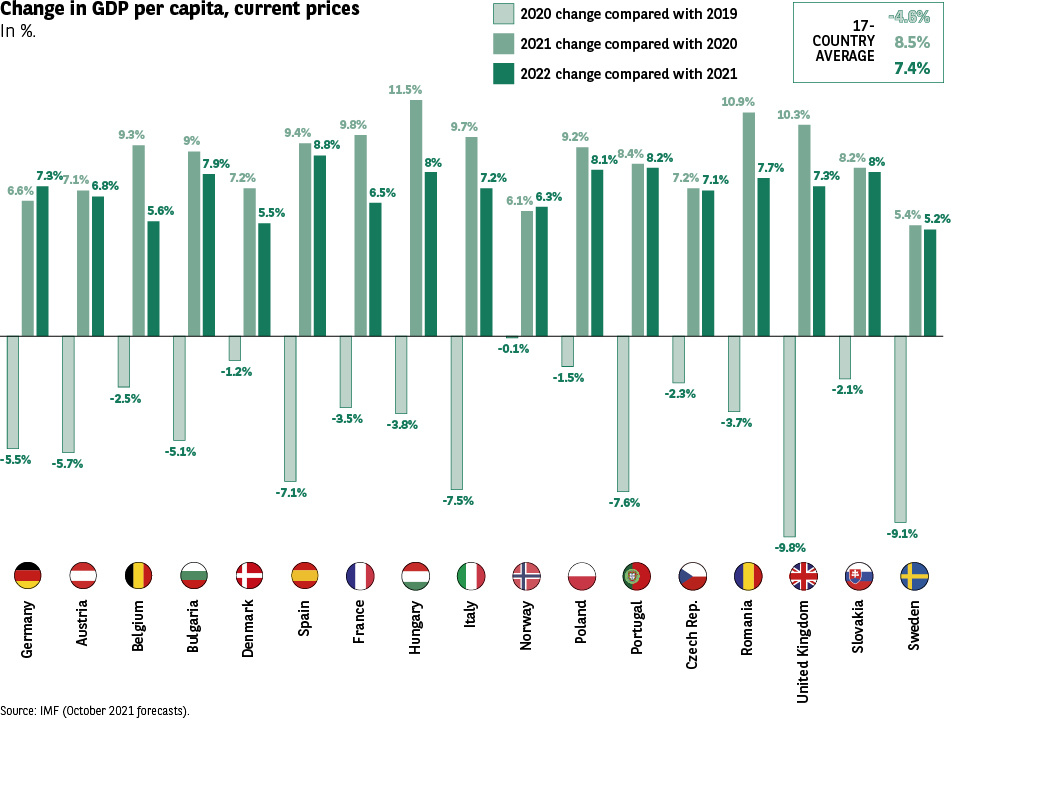 The infographic presents the variations in GDP per capita in current prices, expressed as a percentage, for 17 European countries.
Three years are compared:
• 2020 vs 2019
• 2021 vs 2020
• 2022 vs 2021
The vertical bars represent:
• 2020 (light gray)
• 2021 (medium gray)
• 2022 (dark green)
The visual arrows are decorative.
A box summarizes the averages for the 17 countries:
• 2020: -4.6%
• 2021: +8.5%
• 2022: +7.4%
Source: IMF (projections – October 2021).
Key visual elements
• 17 countries represented with their flag.
• For each country, three bars of annual variation.
• The variations in 2020 are negative for all countries.
• The variations in 2021 and 2022 are positive for all countries.
• The heights vary greatly from country to country.
Transcription of data by country
Germany
• 2020: -5.5%
• 2021: +7.3%
• 2022: +7.1%
Austria
• 2020: -5.7%
• 2021: +9.3%
• 2022: +6.8%
Belgium
• 2020: -5.1%
• 2021: +7.9%
• 2022: +7.4%
Bulgaria
• 2020: -2.5%
• 2021: +9.4%
• 2022: +8.6%
Denmark
• 2020: -1.2%
• 2021: +8.8%
• 2022: +6.5%
Spain
• 2020: -7.1%
• 2021: +11.5%
• 2022: +9%
France
• 2020: -3.5%
• 2021: +9.7%
• 2022: +7.2%
Hungary
• 2020: -3.8%
• 2021: +8%
• 2022: +6.1%
Italy
• 2020: -7.5%
• 2021: +9.2%
• 2022: +6.3%
Norway
• 2020: -0.1%
• 2021: +8.1%
• 2022: +8.4%
Poland
• 2020: -1.5%
• 2021: +8.4%
• 2022: +6.2%
Portugal
• 2020: -7.6%
• 2021: +7.2%
• 2022: +7.1%
Czech Republic
• 2020: -2.3%
• 2021: +7.7%
• 2022: +7.2%
Romania
• 2020: -3.7%
• 2021: +10.9%
• 2022: +7.3%
United Kingdom
• 2020: -9.8%
• 2021: +10.3%
• 2022: +8.2%
Slovakia
• 2020: -2.1%
• 2021: +8%
• 2022: +6%
Sweden
• 2020: -9.1%
• 2021: +5.4%
• 2022: +5.2%
Main teaching
All countries recorded a sharp decline in GDP per capita in 2020, followed by a marked rebound in 2021 and still positive growth in 2022, albeit slightly lower.
The variations in 2020 ranged from -0.1% (Norway) to -9.8% (United Kingdom).
The strongest rebounds in 2021 concerned Spain, Romania, and the United Kingdom
The infographic presents the variations in GDP per capita in current prices, expressed as a percentage, for 17 European countries.
Three years are compared:
• 2020 vs 2019
• 2021 vs 2020
• 2022 vs 2021
The vertical bars represent:
• 2020 (light gray)
• 2021 (medium gray)
• 2022 (dark green)
The visual arrows are decorative.
A box summarizes the averages for the 17 countries:
• 2020: -4.6%
• 2021: +8.5%
• 2022: +7.4%
Source: IMF (projections – October 2021).
Key visual elements
• 17 countries represented with their flag.
• For each country, three bars of annual variation.
• The variations in 2020 are negative for all countries.
• The variations in 2021 and 2022 are positive for all countries.
• The heights vary greatly from country to country.
Transcription of data by country
Germany
• 2020: -5.5%
• 2021: +7.3%
• 2022: +7.1%
Austria
• 2020: -5.7%
• 2021: +9.3%
• 2022: +6.8%
Belgium
• 2020: -5.1%
• 2021: +7.9%
• 2022: +7.4%
Bulgaria
• 2020: -2.5%
• 2021: +9.4%
• 2022: +8.6%
Denmark
• 2020: -1.2%
• 2021: +8.8%
• 2022: +6.5%
Spain
• 2020: -7.1%
• 2021: +11.5%
• 2022: +9%
France
• 2020: -3.5%
• 2021: +9.7%
• 2022: +7.2%
Hungary
• 2020: -3.8%
• 2021: +8%
• 2022: +6.1%
Italy
• 2020: -7.5%
• 2021: +9.2%
• 2022: +6.3%
Norway
• 2020: -0.1%
• 2021: +8.1%
• 2022: +8.4%
Poland
• 2020: -1.5%
• 2021: +8.4%
• 2022: +6.2%
Portugal
• 2020: -7.6%
• 2021: +7.2%
• 2022: +7.1%
Czech Republic
• 2020: -2.3%
• 2021: +7.7%
• 2022: +7.2%
Romania
• 2020: -3.7%
• 2021: +10.9%
• 2022: +7.3%
United Kingdom
• 2020: -9.8%
• 2021: +10.3%
• 2022: +8.2%
Slovakia
• 2020: -2.1%
• 2021: +8%
• 2022: +6%
Sweden
• 2020: -9.1%
• 2021: +5.4%
• 2022: +5.2%
Main teaching
All countries recorded a sharp decline in GDP per capita in 2020, followed by a marked rebound in 2021 and still positive growth in 2022, albeit slightly lower.
The variations in 2020 ranged from -0.1% (Norway) to -9.8% (United Kingdom).
The strongest rebounds in 2021 concerned Spain, Romania, and the United Kingdom
Fig. 3 Evaluation of personal situation 2019-2022
Download this infographic for your presentations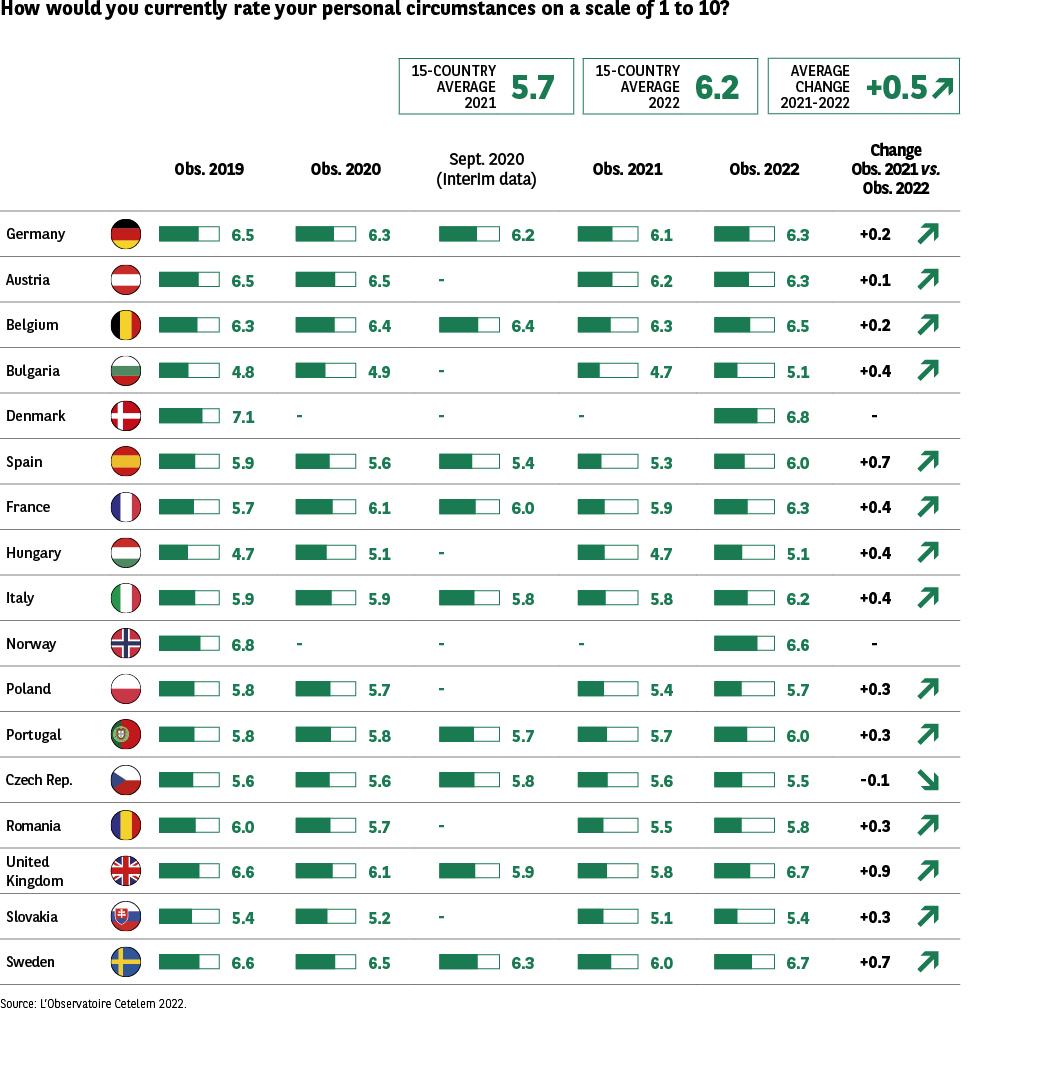 The infographic presents the results of the Cetelem Observatory 2022.
It shows how the inhabitants of 17 European countries evaluate their current personal situation, on a scale of 1 to 10, for the years 2019, 2020, an intermediate measure in September 2020, 2021, and 2022.
The infographic also displays the evolution between 2021 and 2022.
The arrows present in the image are decorative and simply indicate the direction of the variation.
Header information:
• Average of 15 countries in 2021: 5.7
• Average of 17 countries in 2022: 6.2
• Average evolution 2021-2022: +0.5
Key visual elements
• List of countries with associated flag.
• For each country:
• Score 2019
• Score 2020
• Intermediate score (September 2020, if present)
• Score 2021
• Score 2022
• Variation 2021-2022
• Horizontal bars indicating the score from 1 to 10 for each year.
Transcription of data by country
Country 2019 2020 Sept. 2020 2021 2022 Evolution 21-22
Germany 6.5 6.3 6.2 6.1 6.3 +0.2
Austria 6.5 6.5 (absent) 6.2 6.3 +0.1
Belgium 6.4 6.4 6.4 6.2 6.4 +0.2
Bulgaria 4.8 4.9 (absent) 4.7 5.1 +0.4
Denmark 7.1 7.2 (absent) 6.8 6.8 0
Spain 5.9 5.6 5.4 5.3 6.0 +0.7
France 5.7 6.1 6.0 5.9 6.3 +0.4
Hungary 4.7 5.1 (absent) 4.7 5.1 +0.4
Italy 5.9 5.9 5.8 5.8 6.2 +0.4
Norway 6.8 6.7 (absent) 6.6 6.6 0
Poland 5.8 5.7 (absent) 5.4 5.7 +0.3
Portugal 5.8 5.8 5.7 5.7 6.0 +0.3
Czech Republic 5.6 5.6 5.8 5.5 5.4 -0.1
Romania 6.0 5.7 5.7 5.5 5.8 +0.3
United Kingdom 6.0 6.1 5.9 5.9 6.8 +0.9
Slovakia 5.4 5.2 (absent) 5.1 5.4 +0.3
Sweden 6.6 6.5 6.3 6.0 6.7 +0.7
Main teaching
The perception of the personal situation improves overall between 2021 and 2022 in the majority of countries.
The strongest progress concerns the United Kingdom (+0.9), Spain (+0.7), and Sweden (+0.7).
Only the Czech Republic experiences a slight decline (-0.1).
Denmark and Norway remain stable.
The infographic presents the results of the Cetelem Observatory 2022.
It shows how the inhabitants of 17 European countries evaluate their current personal situation, on a scale of 1 to 10, for the years 2019, 2020, an intermediate measure in September 2020, 2021, and 2022.
The infographic also displays the evolution between 2021 and 2022.
The arrows present in the image are decorative and simply indicate the direction of the variation.
Header information:
• Average of 15 countries in 2021: 5.7
• Average of 17 countries in 2022: 6.2
• Average evolution 2021-2022: +0.5
Key visual elements
• List of countries with associated flag.
• For each country:
• Score 2019
• Score 2020
• Intermediate score (September 2020, if present)
• Score 2021
• Score 2022
• Variation 2021-2022
• Horizontal bars indicating the score from 1 to 10 for each year.
Transcription of data by country
Country 2019 2020 Sept. 2020 2021 2022 Evolution 21-22
Germany 6.5 6.3 6.2 6.1 6.3 +0.2
Austria 6.5 6.5 (absent) 6.2 6.3 +0.1
Belgium 6.4 6.4 6.4 6.2 6.4 +0.2
Bulgaria 4.8 4.9 (absent) 4.7 5.1 +0.4
Denmark 7.1 7.2 (absent) 6.8 6.8 0
Spain 5.9 5.6 5.4 5.3 6.0 +0.7
France 5.7 6.1 6.0 5.9 6.3 +0.4
Hungary 4.7 5.1 (absent) 4.7 5.1 +0.4
Italy 5.9 5.9 5.8 5.8 6.2 +0.4
Norway 6.8 6.7 (absent) 6.6 6.6 0
Poland 5.8 5.7 (absent) 5.4 5.7 +0.3
Portugal 5.8 5.8 5.7 5.7 6.0 +0.3
Czech Republic 5.6 5.6 5.8 5.5 5.4 -0.1
Romania 6.0 5.7 5.7 5.5 5.8 +0.3
United Kingdom 6.0 6.1 5.9 5.9 6.8 +0.9
Slovakia 5.4 5.2 (absent) 5.1 5.4 +0.3
Sweden 6.6 6.5 6.3 6.0 6.7 +0.7
Main teaching
The perception of the personal situation improves overall between 2021 and 2022 in the majority of countries.
The strongest progress concerns the United Kingdom (+0.9), Spain (+0.7), and Sweden (+0.7).
Only the Czech Republic experiences a slight decline (-0.1).
Denmark and Norway remain stable.