Low cost for all, but for differing reasons


Day-to-day consumption
Armed with these advantages, and far from being merely a source of occasional consumerist opportunities, low-cost consumption has become a natural day-to-day habit for Europeans. Indeed, 54% of those surveyed say that they regularly consume low-cost products. In this respect, no clear geographical trends can be identified, given that the concept’s most enthusiastic proponents are to be found in Hungary (74%), Portugal (65%), Spain (63%) and the United Kingdom (62%). One must go to the Czech Republic, Slovakia and Belgium to find a more moderate level of interest in low-cost consumption (33%, 39% and 44%) (Fig. 19).
Fig 19 – Frequent use of low-cost products in Europe
Download this infographic for your presentations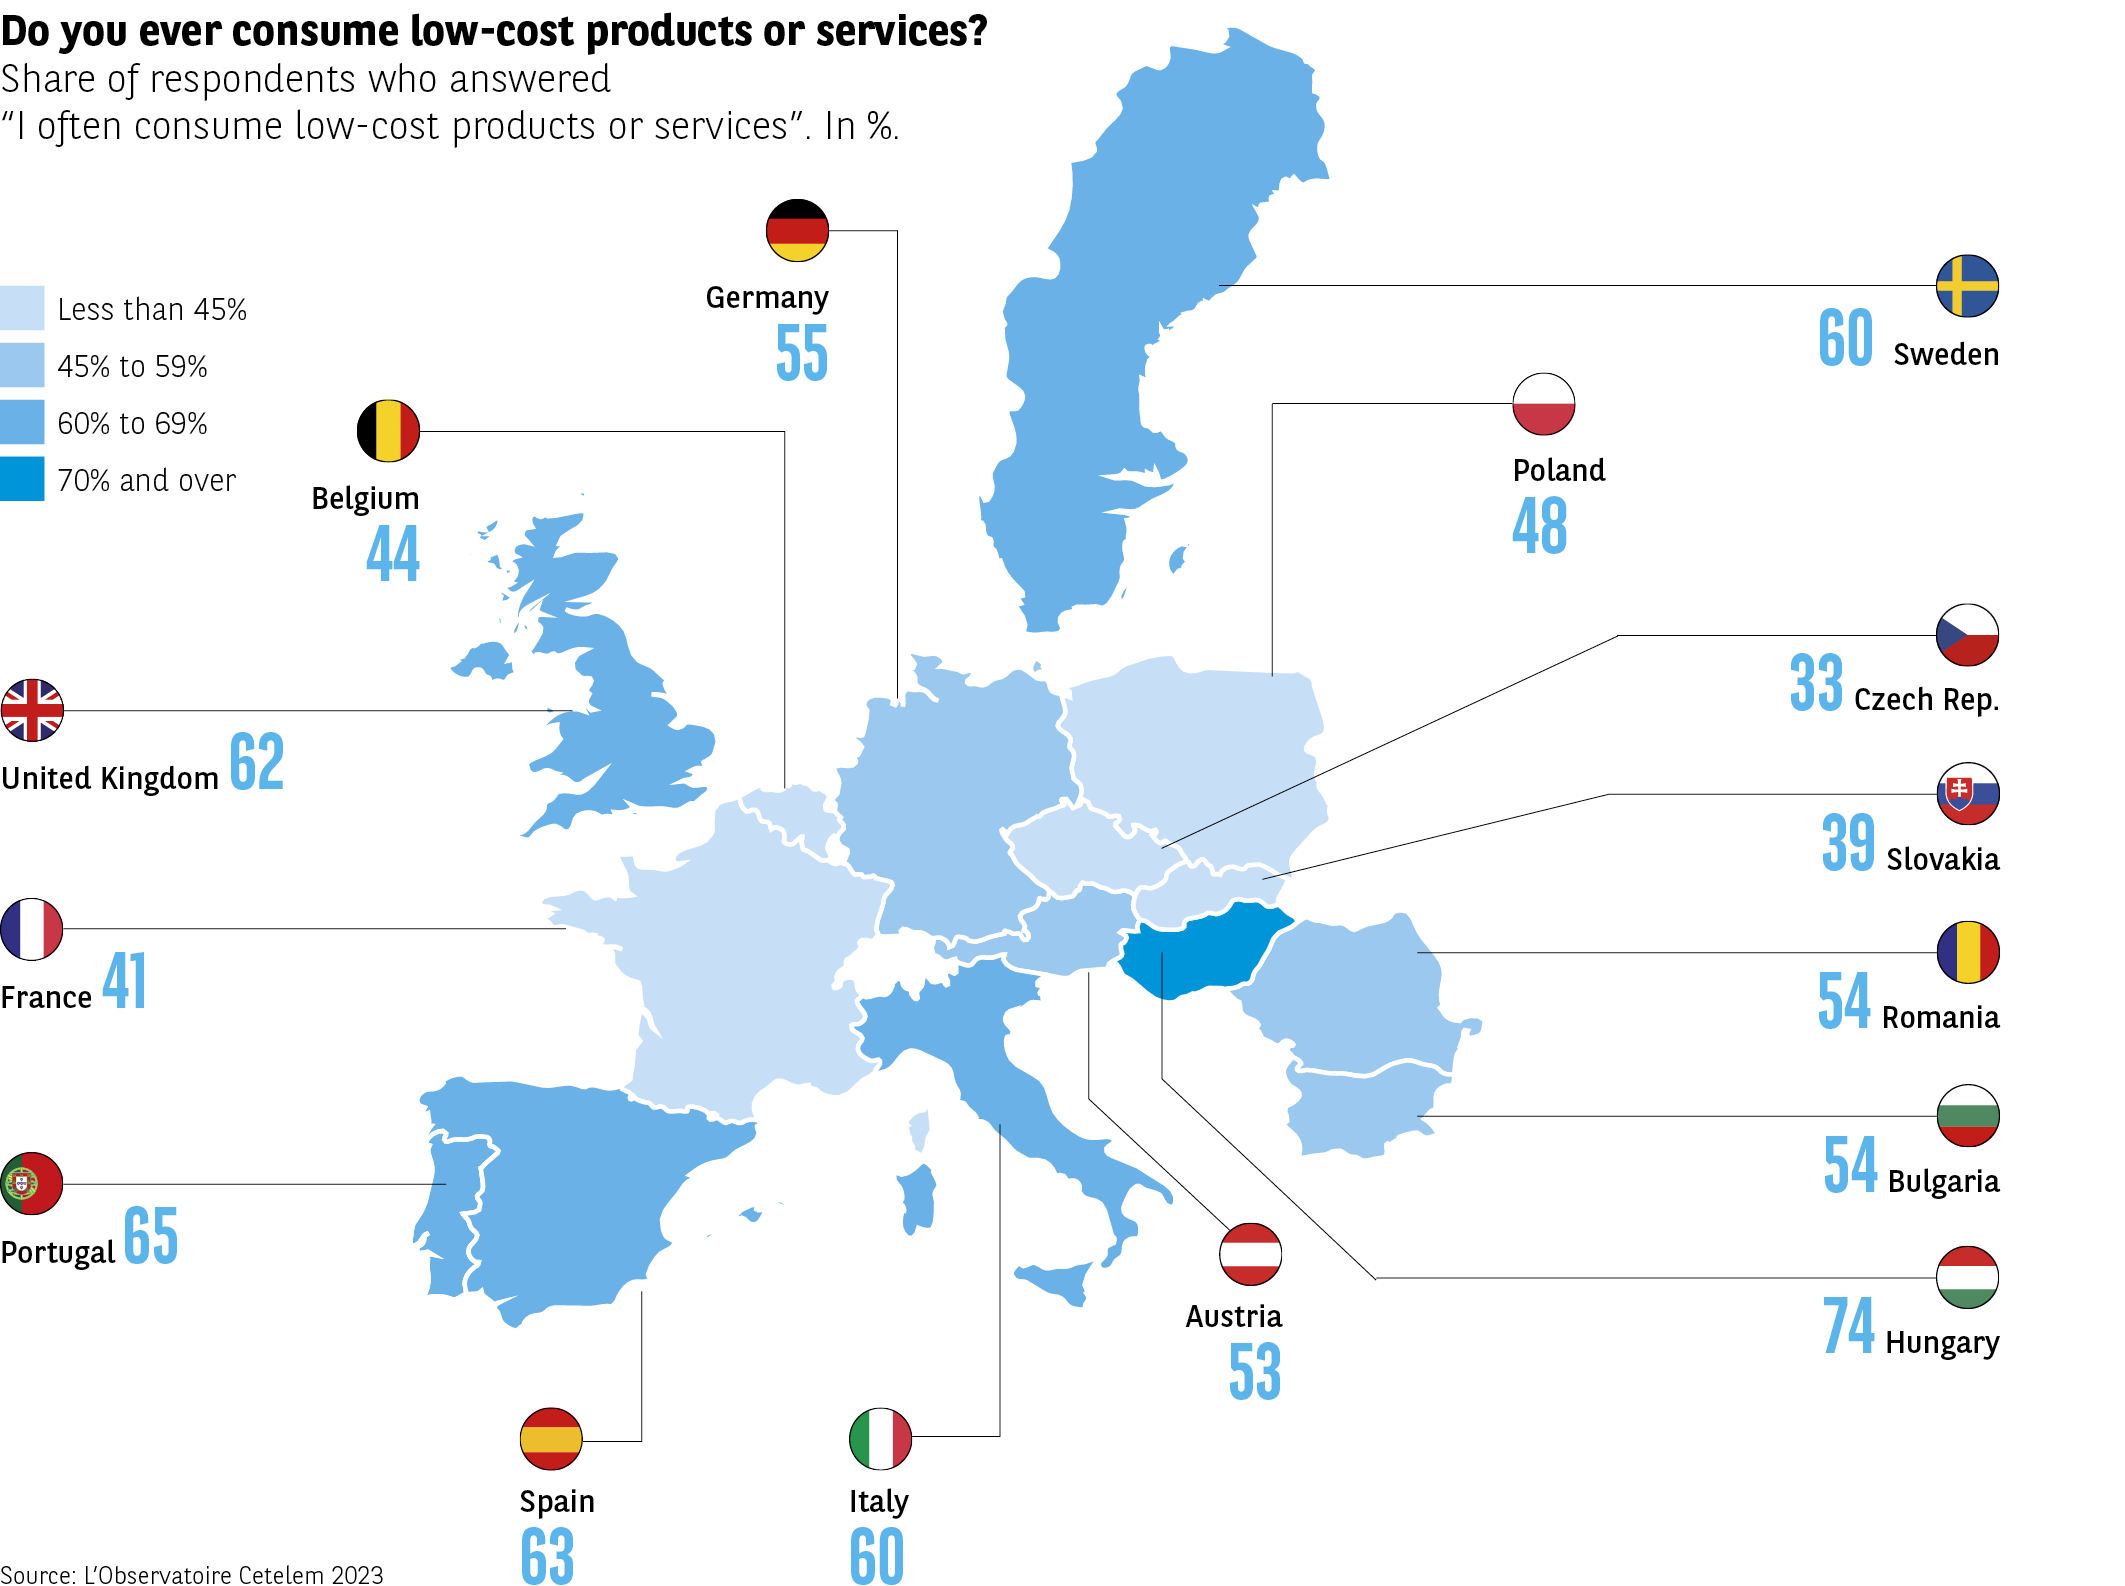 The map presents the percentage of respondents stating that they “often consume low-cost products or services”. An average of the 15 countries is indicated at 54%. The countries are colored according to four percentage ranges.
Data by country:
United Kingdom: 62%
Portugal: 65%
Spain: 63%
Italy: 60%
Germany: 55%
Austria: 53%
Sweden: 60%
Poland: 48%
Belgium: 44%
France: 41%
Czech Republic: 33%
Slovakia: 39%
Romania: 54%
Bulgaria: 54%
Hungary: 74%
Usage is higher in several Southern European countries and Hungary, and lower in some Central European countries.
Source: Cetelem Observatory 2023
The map presents the percentage of respondents stating that they “often consume low-cost products or services”. An average of the 15 countries is indicated at 54%. The countries are colored according to four percentage ranges.
Data by country:
United Kingdom: 62%
Portugal: 65%
Spain: 63%
Italy: 60%
Germany: 55%
Austria: 53%
Sweden: 60%
Poland: 48%
Belgium: 44%
France: 41%
Czech Republic: 33%
Slovakia: 39%
Romania: 54%
Bulgaria: 54%
Hungary: 74%
Usage is higher in several Southern European countries and Hungary, and lower in some Central European countries.
Source: Cetelem Observatory 2023
High incomes in the East, low incomes in the West
An income-based analysis suggests that everyone takes advantage of the low-cost market, whether they are on low or high incomes. The gap between these two categories is only 3 points (56% of the former and 53% of the latter). Further analysis reveals that there is a clear geographical divide between inhabitants of Western and Eastern Europe. In the West, low-income earners are more likely to state that they choose low-cost options than more affluent individuals (59% vs. 53%, which remains a far-from-negligible proportion). In the East, the trend is reversed, with a larger share of individuals on higher incomes indicating that they have embraced the low-cost concept (54% vs. 46%) (Fig. 20). This result might be considered counter-intuitive, given the cut-price approach that lies at the heart of the low-cost model, which would suggest that it is aimed primarily at those with limited resources.
Fig 20 – Use of low-cost according to income level
Download this infographic for your presentations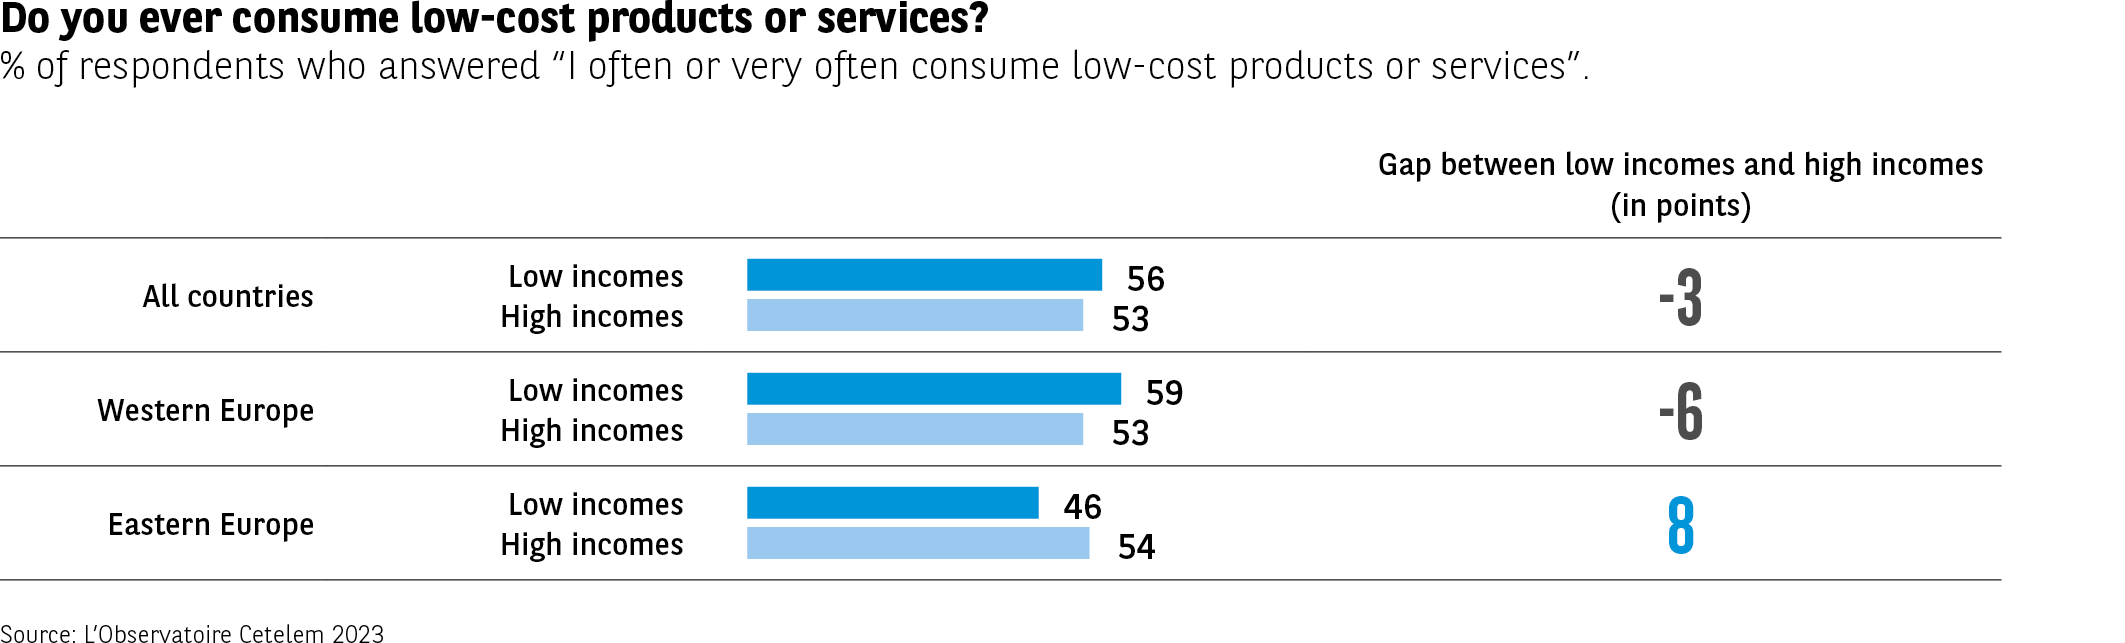 The infographic shows, in percentage, the share of respondents stating that they “often or very often” consume low-cost products or services, according to two income categories. The results are presented for all countries, Western Europe, and Eastern Europe. A “low income – high income” gap is calculated.
Data:
All countries
Low income: 56%
High income: 53%
Gap: -3 points
Western Europe
Low income: 59%
High income: 53%
Gap: -6 points
Eastern Europe
Low income: 46%
High income: 54%
Gap: +8 points
The consumption gaps between income levels vary by region: low-income households consume more low-cost products in Western Europe, while the opposite is observed in Eastern Europe.
Source: Cetelem Observatory 2023
The infographic shows, in percentage, the share of respondents stating that they “often or very often” consume low-cost products or services, according to two income categories. The results are presented for all countries, Western Europe, and Eastern Europe. A “low income – high income” gap is calculated.
Data:
All countries
Low income: 56%
High income: 53%
Gap: -3 points
Western Europe
Low income: 59%
High income: 53%
Gap: -6 points
Eastern Europe
Low income: 46%
High income: 54%
Gap: +8 points
The consumption gaps between income levels vary by region: low-income households consume more low-cost products in Western Europe, while the opposite is observed in Eastern Europe.
Source: Cetelem Observatory 2023
Essential items are the main focus for the low-cost model
Let us continue to unpack this analysis of low-cost consumption relative to income by examining the impact of the latter in the different sectors, again with respect to the geographical location of consumers. In the East, the propensity of high-income households to embrace low-cost consumption mainly revolves around non-essential spending. When it comes to hotels, gardening and DIY, the gap is 5 points, while for air travel the difference is 4 points. However, in the case of clothing, food, energy and several other consumer sectors, the differential is reversed. In these categories, the least affluent households buy more low-cost products than wealthy households.
The same is true in the West, where in all the sectors associated with essential purchases, less wealthy households have a greater tendency to purchase low-cost options. In the food category, the gap between low and high-income earners reaches 8 points, the widest in this survey. For clothing, the difference is 6 points. The only sector in which higher-income individuals are more attracted to low-cost products is air travel. Indeed, why would those who fall into this social class, who tend to fly more frequently, pay more than they need to for the short or medium-haul flights they take for their weekends away? (Fig. 21)
Fig 21 – Use of low-cost by sector and income level
Download this infographic for your presentations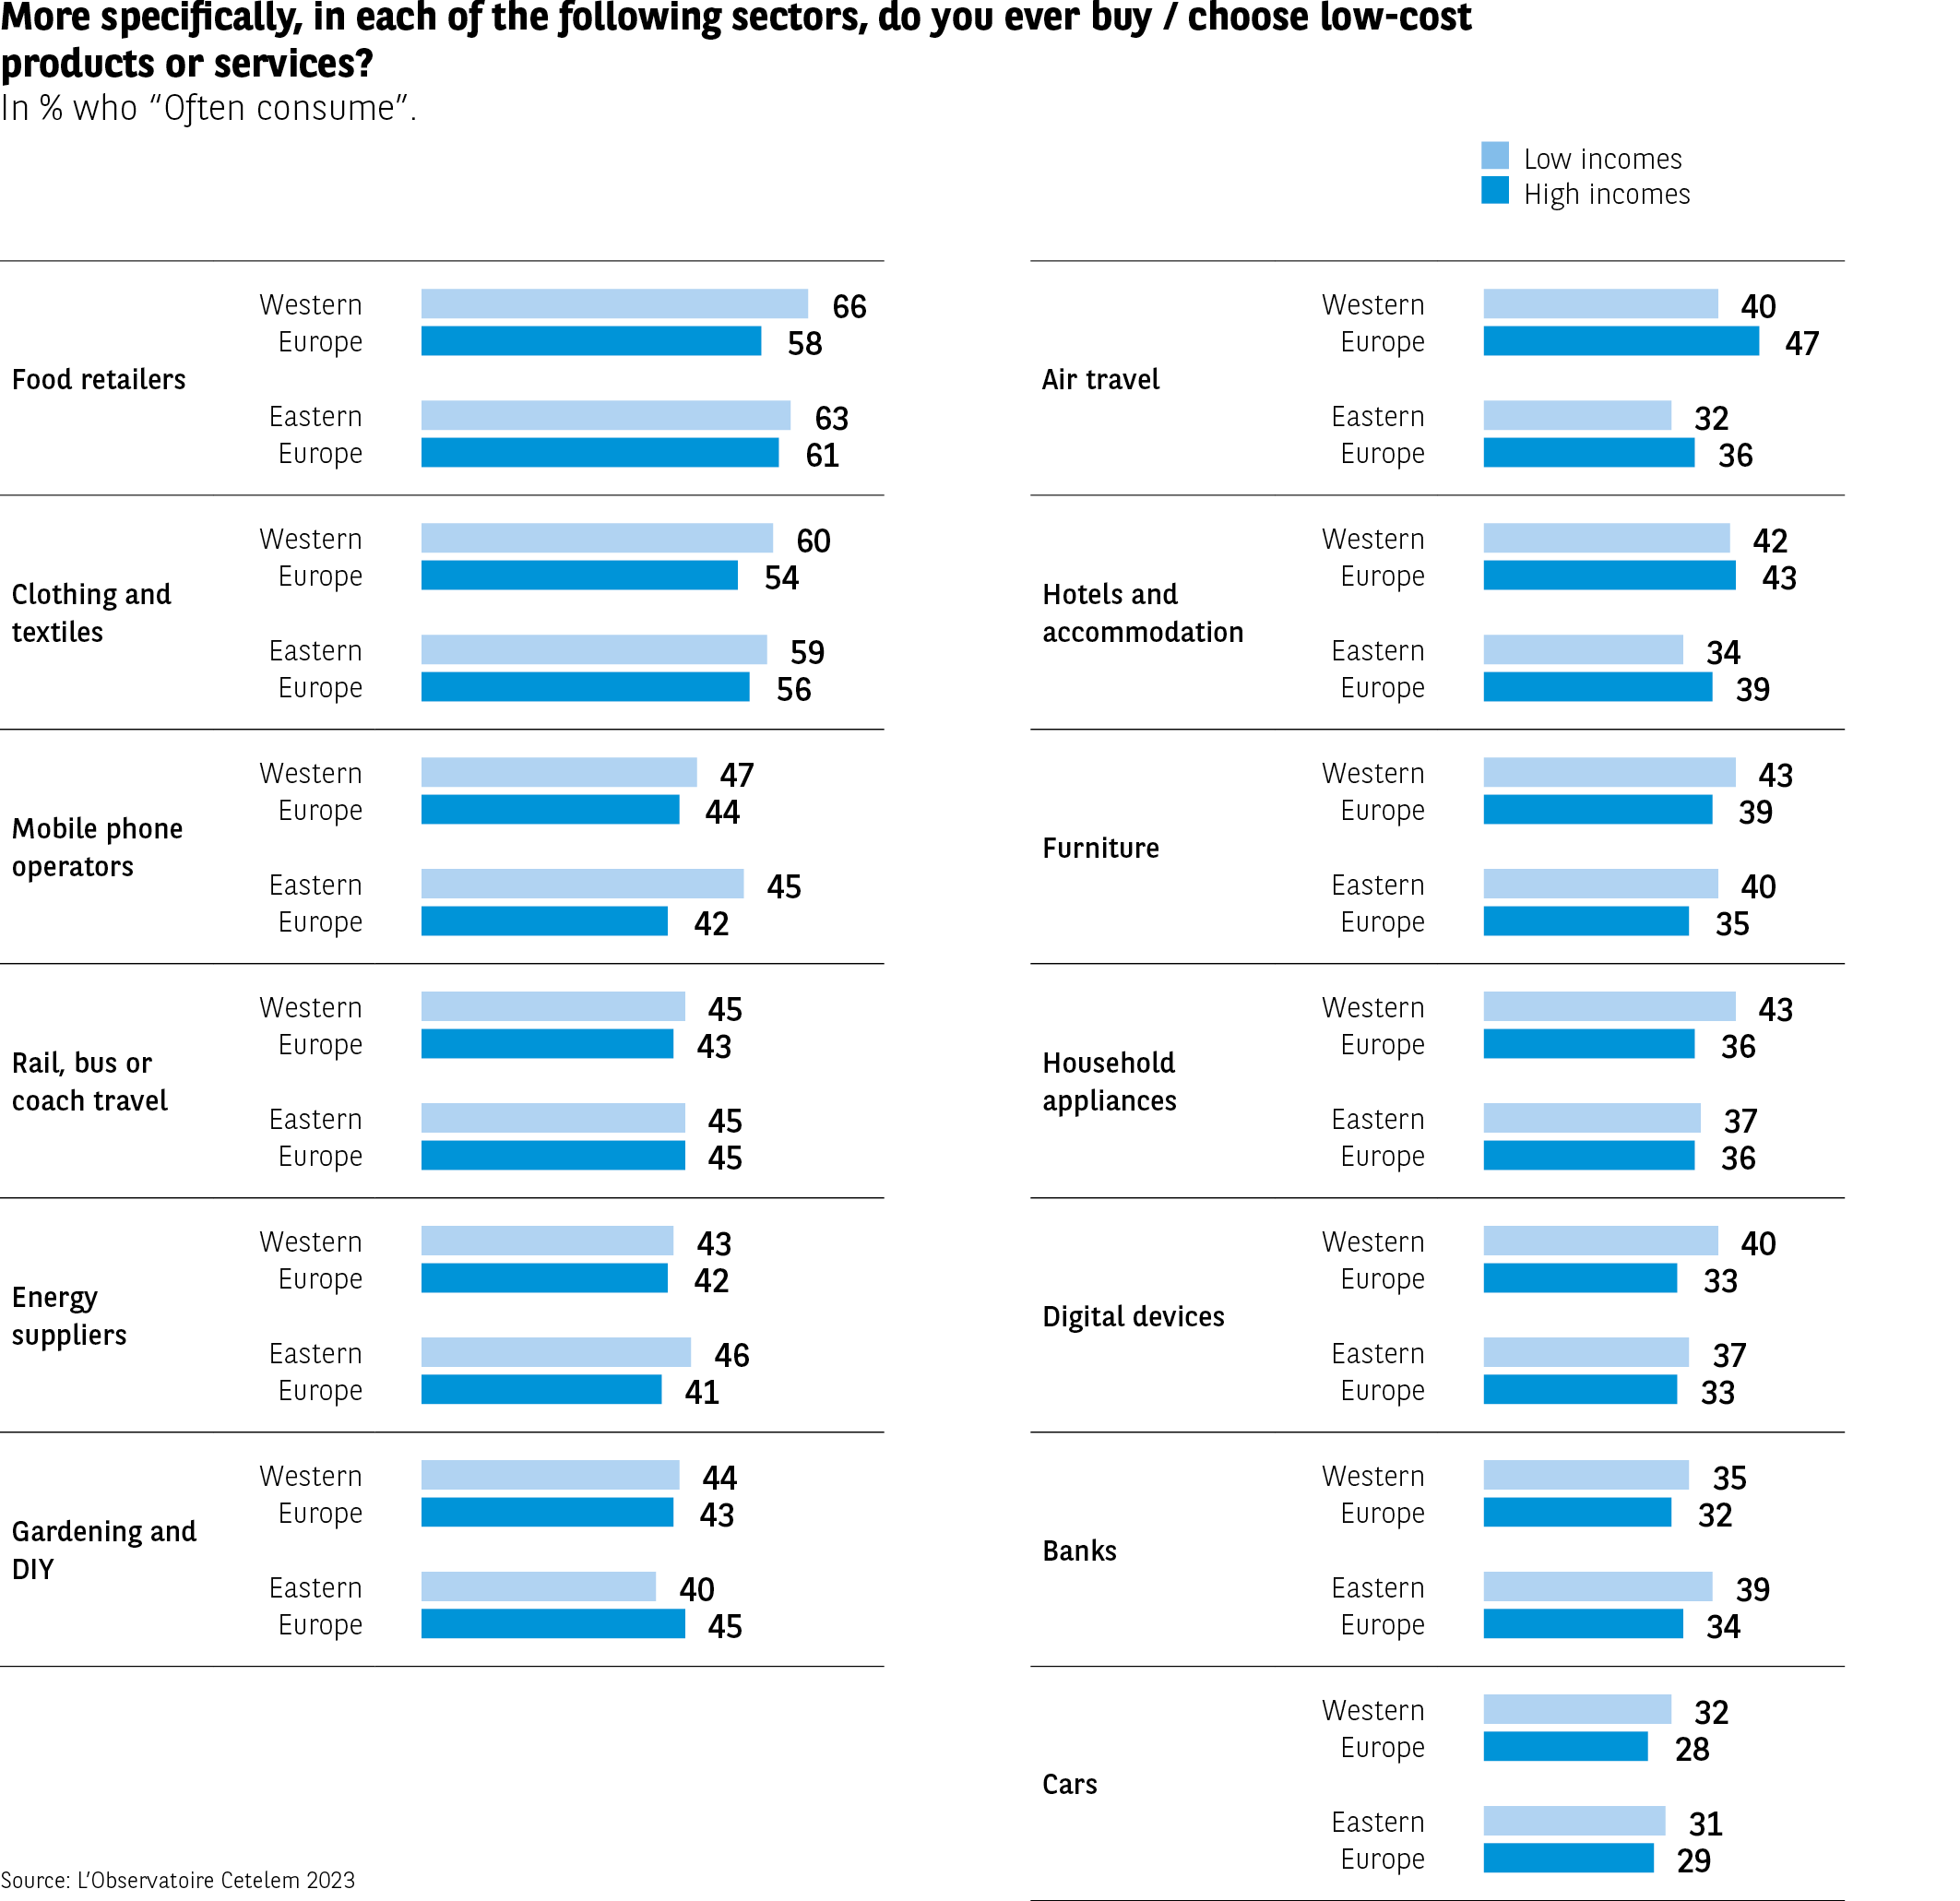 The infographic indicates, in percentage, the share of respondents stating that they “often” consume low-cost products or services in several sectors. The results are presented for Western Europe and Eastern Europe, and broken down by low income and high income.
Data by sector
Food retailers
Western Europe: 66 (low income), 58 (high income)
Eastern Europe: 63 (low income), 61 (high income)
Clothing, textiles
Western Europe: 60, 54
Eastern Europe: 59, 56
Mobile phone services
Western Europe: 47, 44
Eastern Europe: 45, 42
Rail, bus, car transportation
Western Europe: 45, 43
Eastern Europe: 45, 45
Energy providers
Western Europe: 43, 42
Eastern Europe: 46, 41
Gardening and DIY
Western Europe: 44, 43
Eastern Europe: 40, 45
Air transportation
Western Europe: 40, 47
Eastern Europe: 32, 36
Hotels, accommodation
Western Europe: 42, 43
Eastern Europe: 34, 39
Furniture
Western Europe: 43, 39
Eastern Europe: 40, 35
Appliances
Western Europe: 43, 36
Eastern Europe: 37, 36
Digital tools
Western Europe: 40, 33
Eastern Europe: 37, 33
Banks
Western Europe: 35, 32
Eastern Europe: 39, 34
Automobiles
Western Europe: 32, 28
Eastern Europe: 31, 29
Main lesson
In most sectors, the use of low-cost is comparable between low and high incomes, with some differences according to regions and activities.
Source: Cetelem Observatory 2023
The infographic indicates, in percentage, the share of respondents stating that they “often” consume low-cost products or services in several sectors. The results are presented for Western Europe and Eastern Europe, and broken down by low income and high income.
Data by sector
Food retailers
Western Europe: 66 (low income), 58 (high income)
Eastern Europe: 63 (low income), 61 (high income)
Clothing, textiles
Western Europe: 60, 54
Eastern Europe: 59, 56
Mobile phone services
Western Europe: 47, 44
Eastern Europe: 45, 42
Rail, bus, car transportation
Western Europe: 45, 43
Eastern Europe: 45, 45
Energy providers
Western Europe: 43, 42
Eastern Europe: 46, 41
Gardening and DIY
Western Europe: 44, 43
Eastern Europe: 40, 45
Air transportation
Western Europe: 40, 47
Eastern Europe: 32, 36
Hotels, accommodation
Western Europe: 42, 43
Eastern Europe: 34, 39
Furniture
Western Europe: 43, 39
Eastern Europe: 40, 35
Appliances
Western Europe: 43, 36
Eastern Europe: 37, 36
Digital tools
Western Europe: 40, 33
Eastern Europe: 37, 33
Banks
Western Europe: 35, 32
Eastern Europe: 39, 34
Automobiles
Western Europe: 32, 28
Eastern Europe: 31, 29
Main lesson
In most sectors, the use of low-cost is comparable between low and high incomes, with some differences according to regions and activities.
Source: Cetelem Observatory 2023
There is no shame in going low cost
In 2010, L’Observatoire Cetelem de la Consommation remarked that “In many European countries, we are seeing a democratisation of the hard discount model, which means it is reaching new categories of clientele. Having initially attracted students and homemakers, we now see business executives and other professionals succumbing to the temptations of the hard-discount market. Wealthier individuals are no longer ashamed of entering these stores, because everyone ultimately wants to save money in these times of economic hardship.”
Over a decade later, it is seen as no more demeaning to consume low-cost products, particularly for Europeans on high incomes. While 26% of all respondents view low-cost consumption in a negative light, only 22% of the most affluent Europeans feel this way, compared with 30% of the most disadvantaged individuals (Fig. 22).
Overall, a similar difference can be observed in the East and West. However, from a macro-economic perspective, the idea that low-cost consumption is “shameful” is especially prevalent in the more developed economies. In Germany, the UK, Belgium and France, at least 30% of respondents feel this way. It is interesting to note that only 8% of Portuguese consumers share this view.
Fig 22 – Perception of low-cost valuation
Download this infographic for your presentations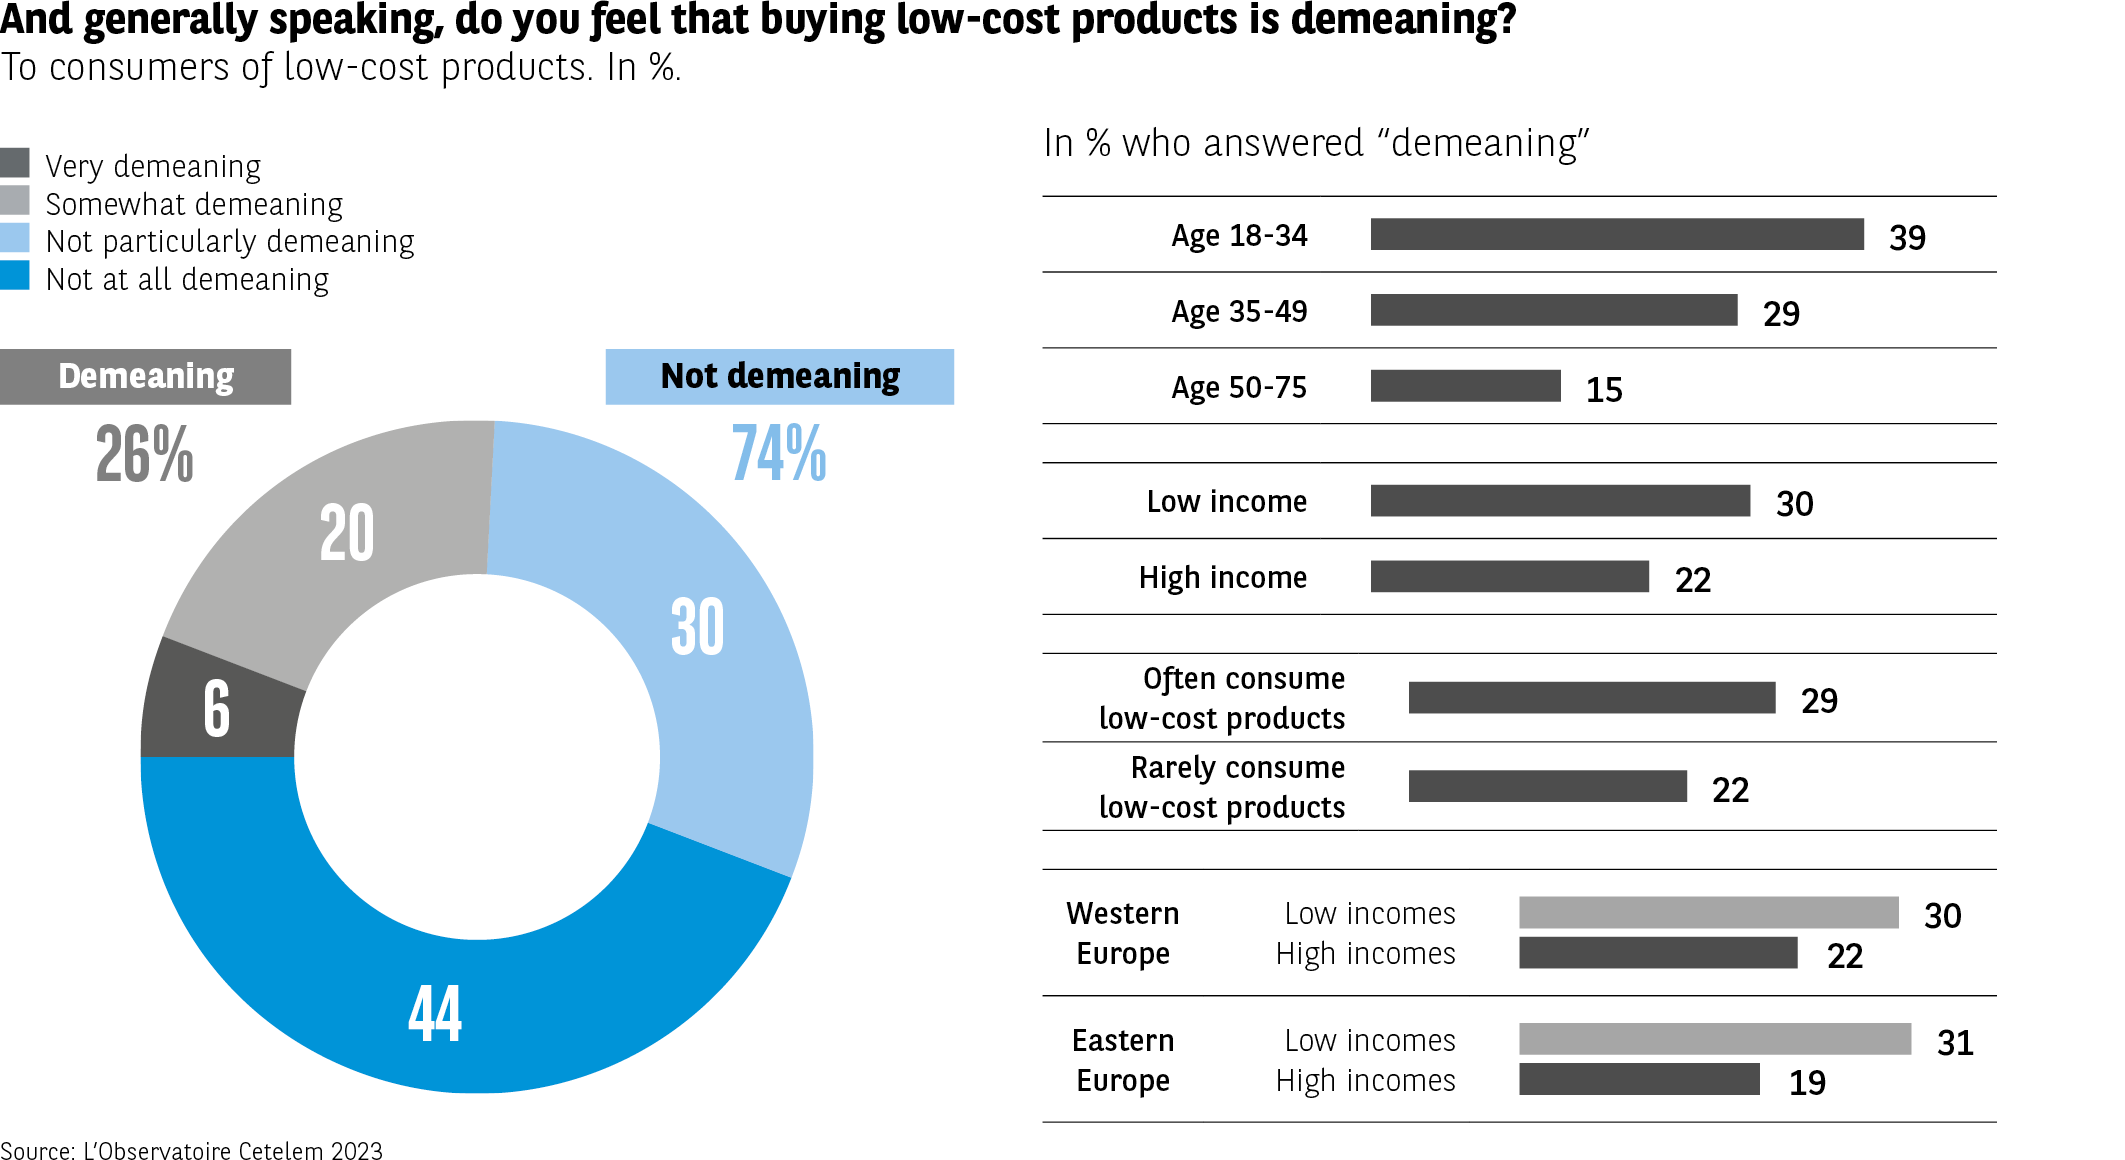 The infographic presents the proportion of low-cost consumers who estimate that buying low-cost products is “devaluing” or not.
Ring chart – Total
Total “not devaluing”: 74%
Not at all devaluing: 44%
Rather not devaluing: 30%
Total “devaluing”: 26%
Rather devaluing: 20%
Very devaluing: 6%
Bars – Proportion responding “devaluing” (sum of 2 modalities)
18-34 years: 39%
35-49 years: 29%
50-75 years: 15%
Low income: 30%
High income: 22%
Frequent low-cost consumer: 29%
Infrequent low-cost consumer: 22%
Western Europe
Low income: 30%
High income: 22%
Eastern Europe
Low income: 31%
High income: 19%
The devaluing perception decreases with age and is less present among high-income individuals and frequent consumers.
Source: Cetelem Observatory 2023
The infographic presents the proportion of low-cost consumers who estimate that buying low-cost products is “devaluing” or not.
Ring chart – Total
Total “not devaluing”: 74%
Not at all devaluing: 44%
Rather not devaluing: 30%
Total “devaluing”: 26%
Rather devaluing: 20%
Very devaluing: 6%
Bars – Proportion responding “devaluing” (sum of 2 modalities)
18-34 years: 39%
35-49 years: 29%
50-75 years: 15%
Low income: 30%
High income: 22%
Frequent low-cost consumer: 29%
Infrequent low-cost consumer: 22%
Western Europe
Low income: 30%
High income: 22%
Eastern Europe
Low income: 31%
High income: 19%
The devaluing perception decreases with age and is less present among high-income individuals and frequent consumers.
Source: Cetelem Observatory 2023
55% of Europeans go for low-cost options out of choice, rather than necessity.
Low-cost consumption, a choice rather than a necessity
We saw that very little stigma was attached to low-cost consumption, but is it a choice or a necessity? For a slim majority of Europeans (55%), it is the former. This is more likely to be the case for older respondents (58% of over-50s) and especially for people on high incomes (64%, compared with 47% of low-income earners) (Fig. 23).
Fig 23 – Reasons for buying low-cost products
Download this infographic for your presentations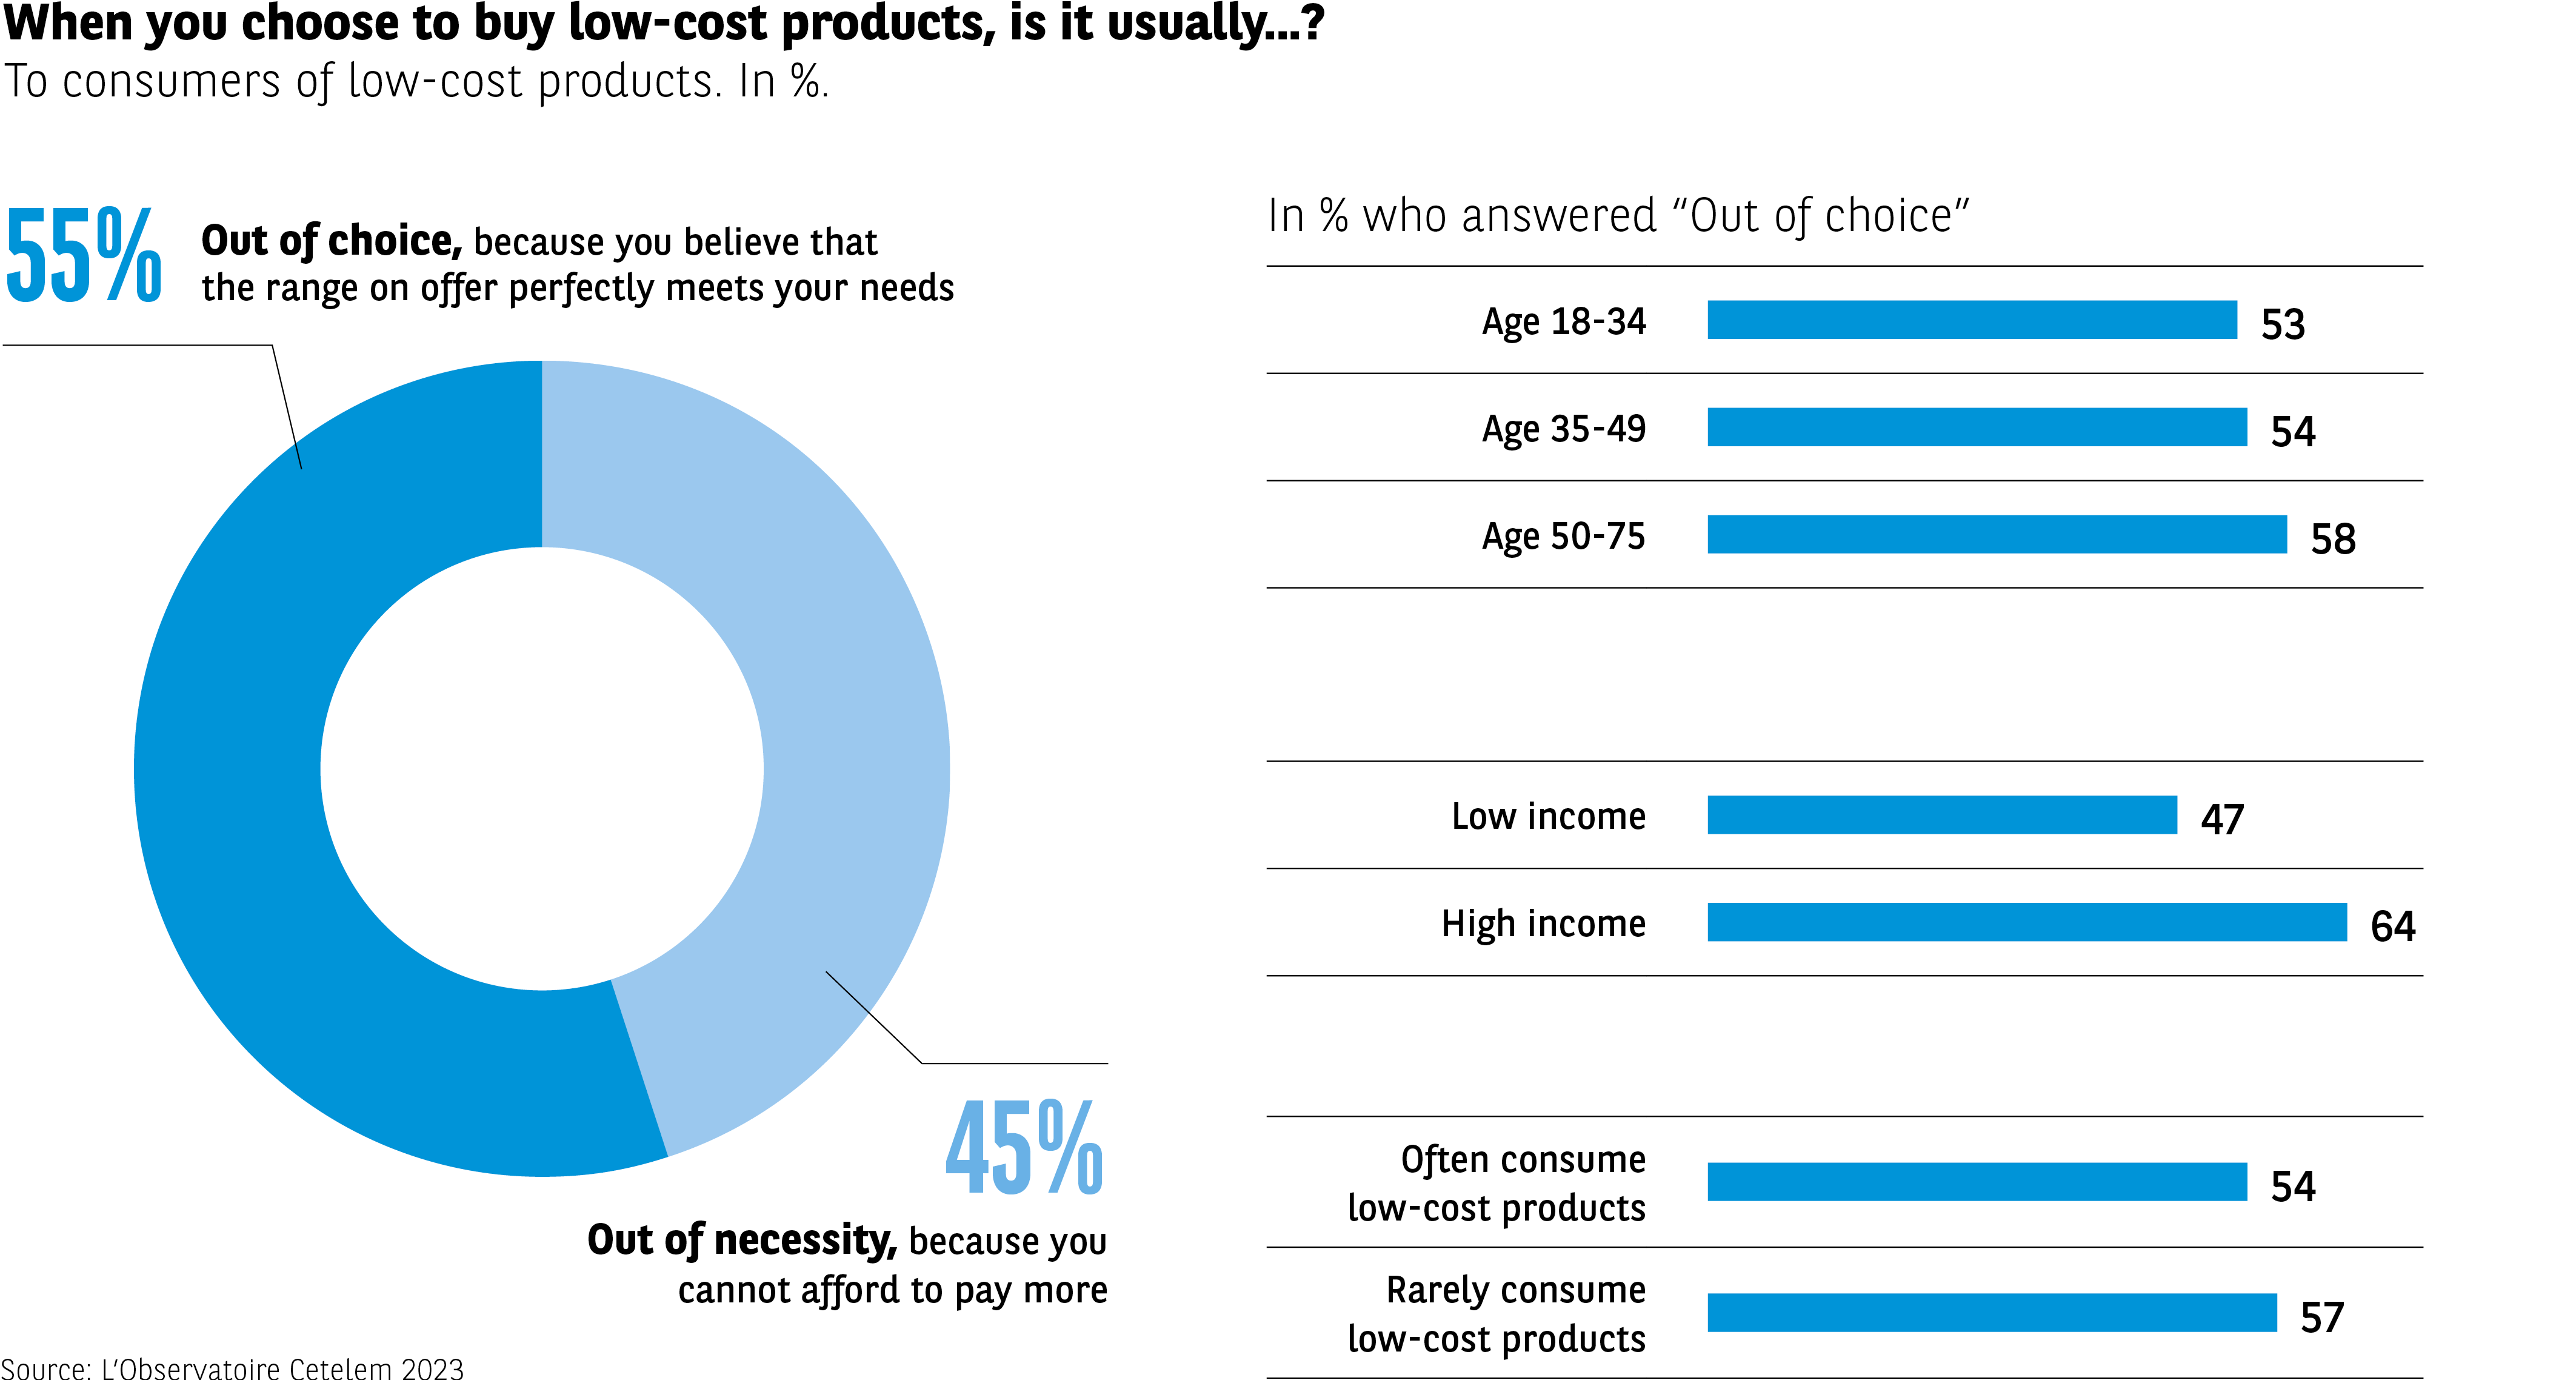 The infographic presents the motivations of low-cost consumers when they buy these products.
Ring chart – Total
By choice: 55% Respondents estimate that the offer suits them.
By constraint: 45% Respondents indicate that they cannot afford to pay more.
Bars – Proportion responding “By choice”
18-34 years: 53%
35-49 years: 54%
50-75 years: 58%
Low income: 47%
High income: 64%
Frequent consumers: 54%
Infrequent consumers: 57%
The purchase of low-cost products is mainly a matter of choice, especially among high-income individuals and those over 50 years old.
Source: Cetelem Observatory 2023
The infographic presents the motivations of low-cost consumers when they buy these products.
Ring chart – Total
By choice: 55% Respondents estimate that the offer suits them.
By constraint: 45% Respondents indicate that they cannot afford to pay more.
Bars – Proportion responding “By choice”
18-34 years: 53%
35-49 years: 54%
50-75 years: 58%
Low income: 47%
High income: 64%
Frequent consumers: 54%
Infrequent consumers: 57%
The purchase of low-cost products is mainly a matter of choice, especially among high-income individuals and those over 50 years old.
Source: Cetelem Observatory 2023
This is doubtless because those who can afford to buy “high-cost” products have greater agency to opt for “low-cost” alternatives out of choice. When people consume low-cost products because they have chosen to, the above-average score they assign to the items purchased suggests that their level of satisfaction is greater, as (Fig. 24).
Fig 24 – Satisfaction with low-cost products
Download this infographic for your presentations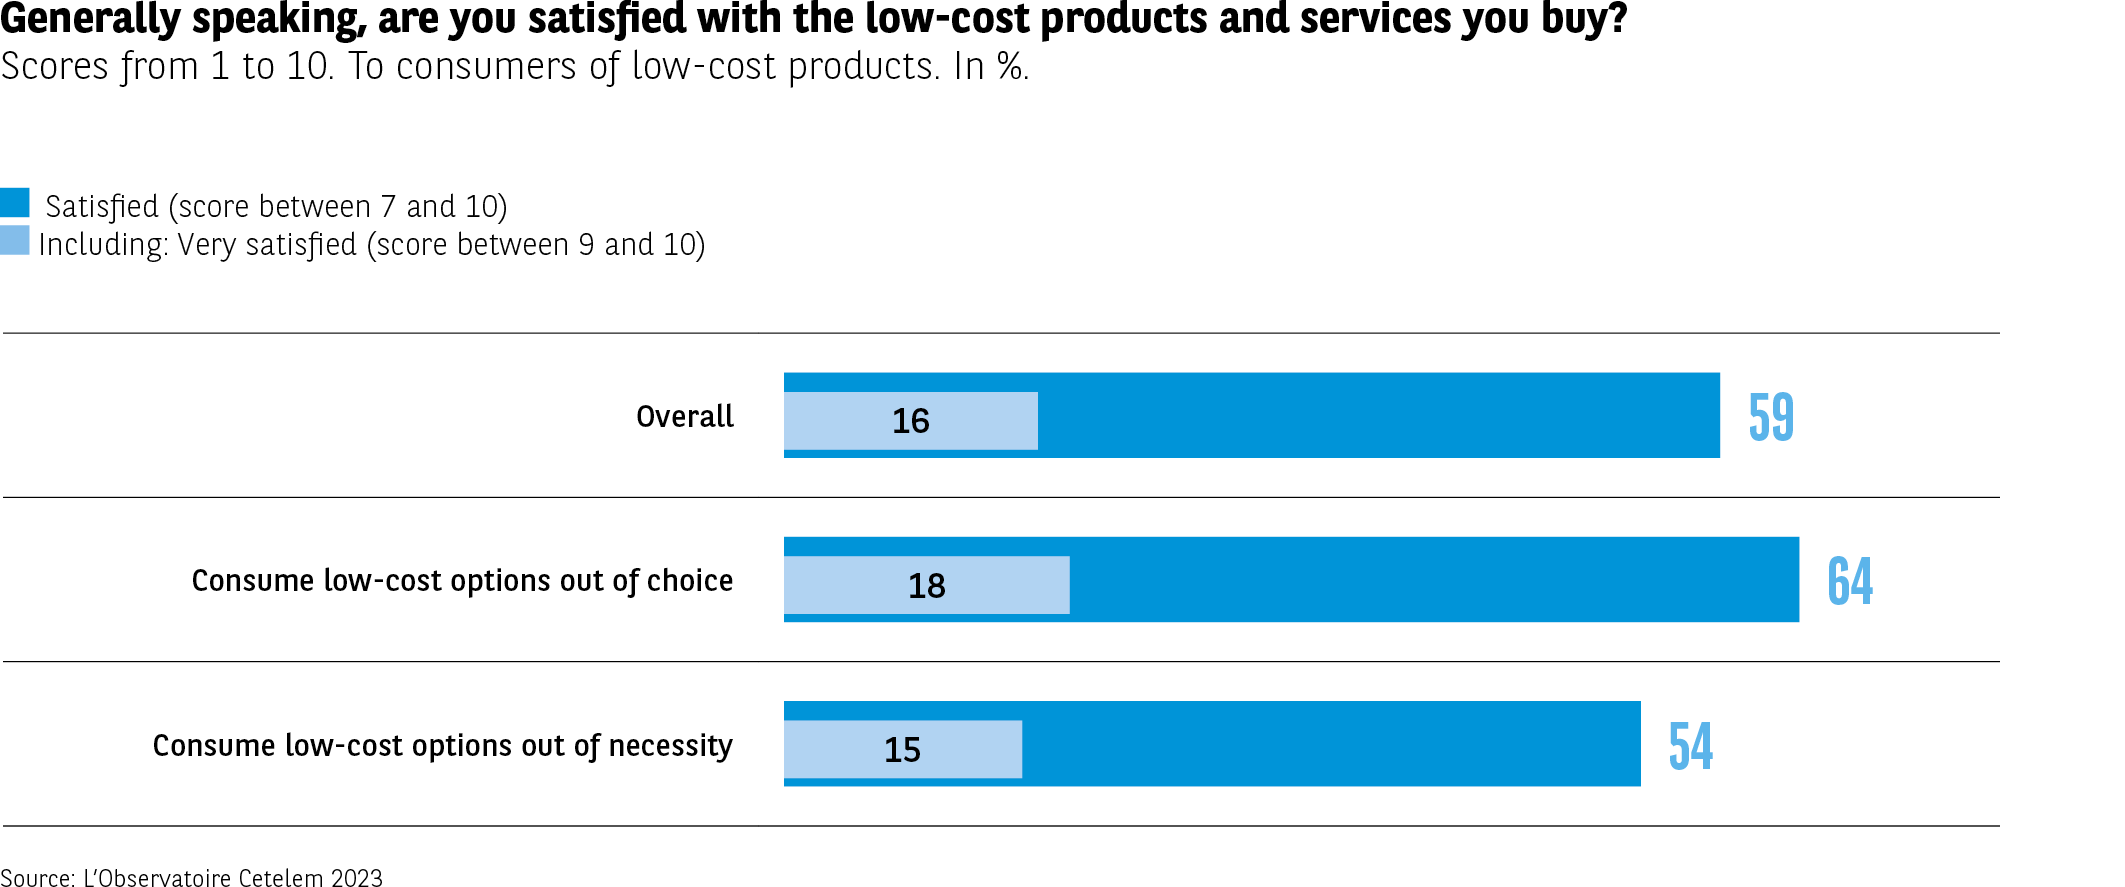 The infographic shows the levels of satisfaction (scores 7-10) and very high satisfaction (scores 9-10) among low-cost consumers.
Data:
Total
Very satisfied: 16%
Satisfied (total): 59%
Consume low-cost by choice
Very satisfied: 18%
Satisfied: 64%
Consume low-cost by constraint
Very satisfied: 15%
Satisfied: 54%
Satisfaction is generally high, but stronger among those who consume by choice.
Source: Cetelem Observatory 2023
The infographic shows the levels of satisfaction (scores 7-10) and very high satisfaction (scores 9-10) among low-cost consumers.
Data:
Total
Very satisfied: 16%
Satisfied (total): 59%
Consume low-cost by choice
Very satisfied: 18%
Satisfied: 64%
Consume low-cost by constraint
Very satisfied: 15%
Satisfied: 54%
Satisfaction is generally high, but stronger among those who consume by choice.
Source: Cetelem Observatory 2023
Only in three countries is low-cost consumption seen as a necessity by the majority of respondents: Hungary, Poland and Romania. Low-cost consumption out of choice is most widespread in Sweden, France and Spain.
In many cases, it is an adjustment variable
Looking beyond the fact that low-income households make low-cost purchases out of necessity (36%), they also believe that doing so offers significant advantages. 32% state that the savings achieved allow them to make other purchases. An equal number declare that they are satisfied with low-cost options and that it would be pointless to pay more (32%). Both of these factors are even more important to high-income earners (41% and 38%, respectively), while necessity due to income restrictions is much less commonly cited (21%) (Fig. 25).
Fig 25 – Reasons for buying more low-cost
Download this infographic for your presentations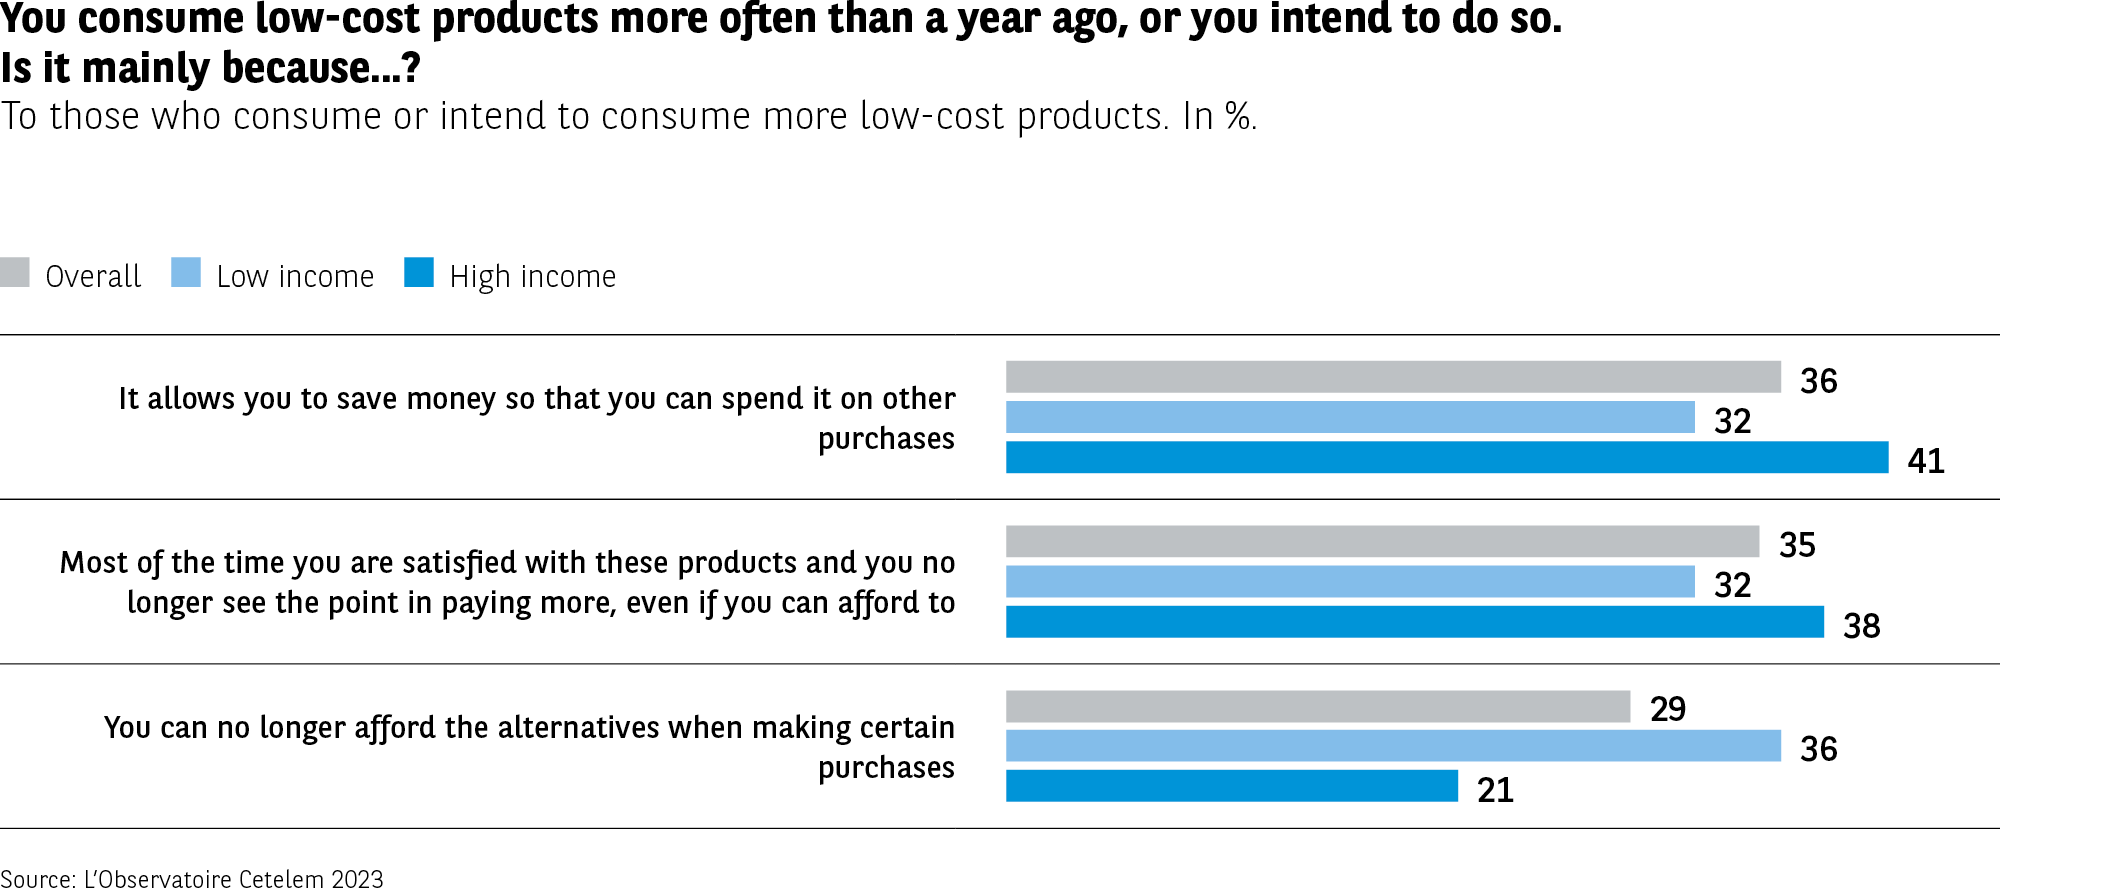 The infographic presents the main reasons given by people who have increased or plan to increase their consumption of low-cost products.
Data (Total / Low income / High income):
Allows for savings and spending on other purchases
Total: 36%
Low income: 32%
High income: 41%
General satisfaction and lack of interest in paying more, even if they can afford it
Total: 35%
Low income: 32%
High income: 38%
Lack of means to do otherwise for certain purchases
Total: 29%
Low income: 21%
High income: 36%
Savings are the primary reason, but high-income individuals more often cite a choice related to satisfaction, while low-income individuals more often mention financial constraints.
Source: Cetelem Observatory 2023
The infographic presents the main reasons given by people who have increased or plan to increase their consumption of low-cost products.
Data (Total / Low income / High income):
Allows for savings and spending on other purchases
Total: 36%
Low income: 32%
High income: 41%
General satisfaction and lack of interest in paying more, even if they can afford it
Total: 35%
Low income: 32%
High income: 38%
Lack of means to do otherwise for certain purchases
Total: 29%
Low income: 21%
High income: 36%
Savings are the primary reason, but high-income individuals more often cite a choice related to satisfaction, while low-income individuals more often mention financial constraints.
Source: Cetelem Observatory 2023
Products that are relatively well rated
Thus, it appears that low-cost products cater well for these expectations. However, enthusiasm for the genre is fairly measured, rather than being overwhelming, much like the image of low-cost consumption as a whole, as we saw in part one.
With the average rating standing at 6.8, the vast majority of individuals surveyed assign these products a score of between 5 and 8 (Fig. 26). This is a score rooted in reason rather than passion, one that could be considered relatively high for the products and services in question.
Fig 26 – Distribution of low-cost satisfaction scores
Download this infographic for your presentations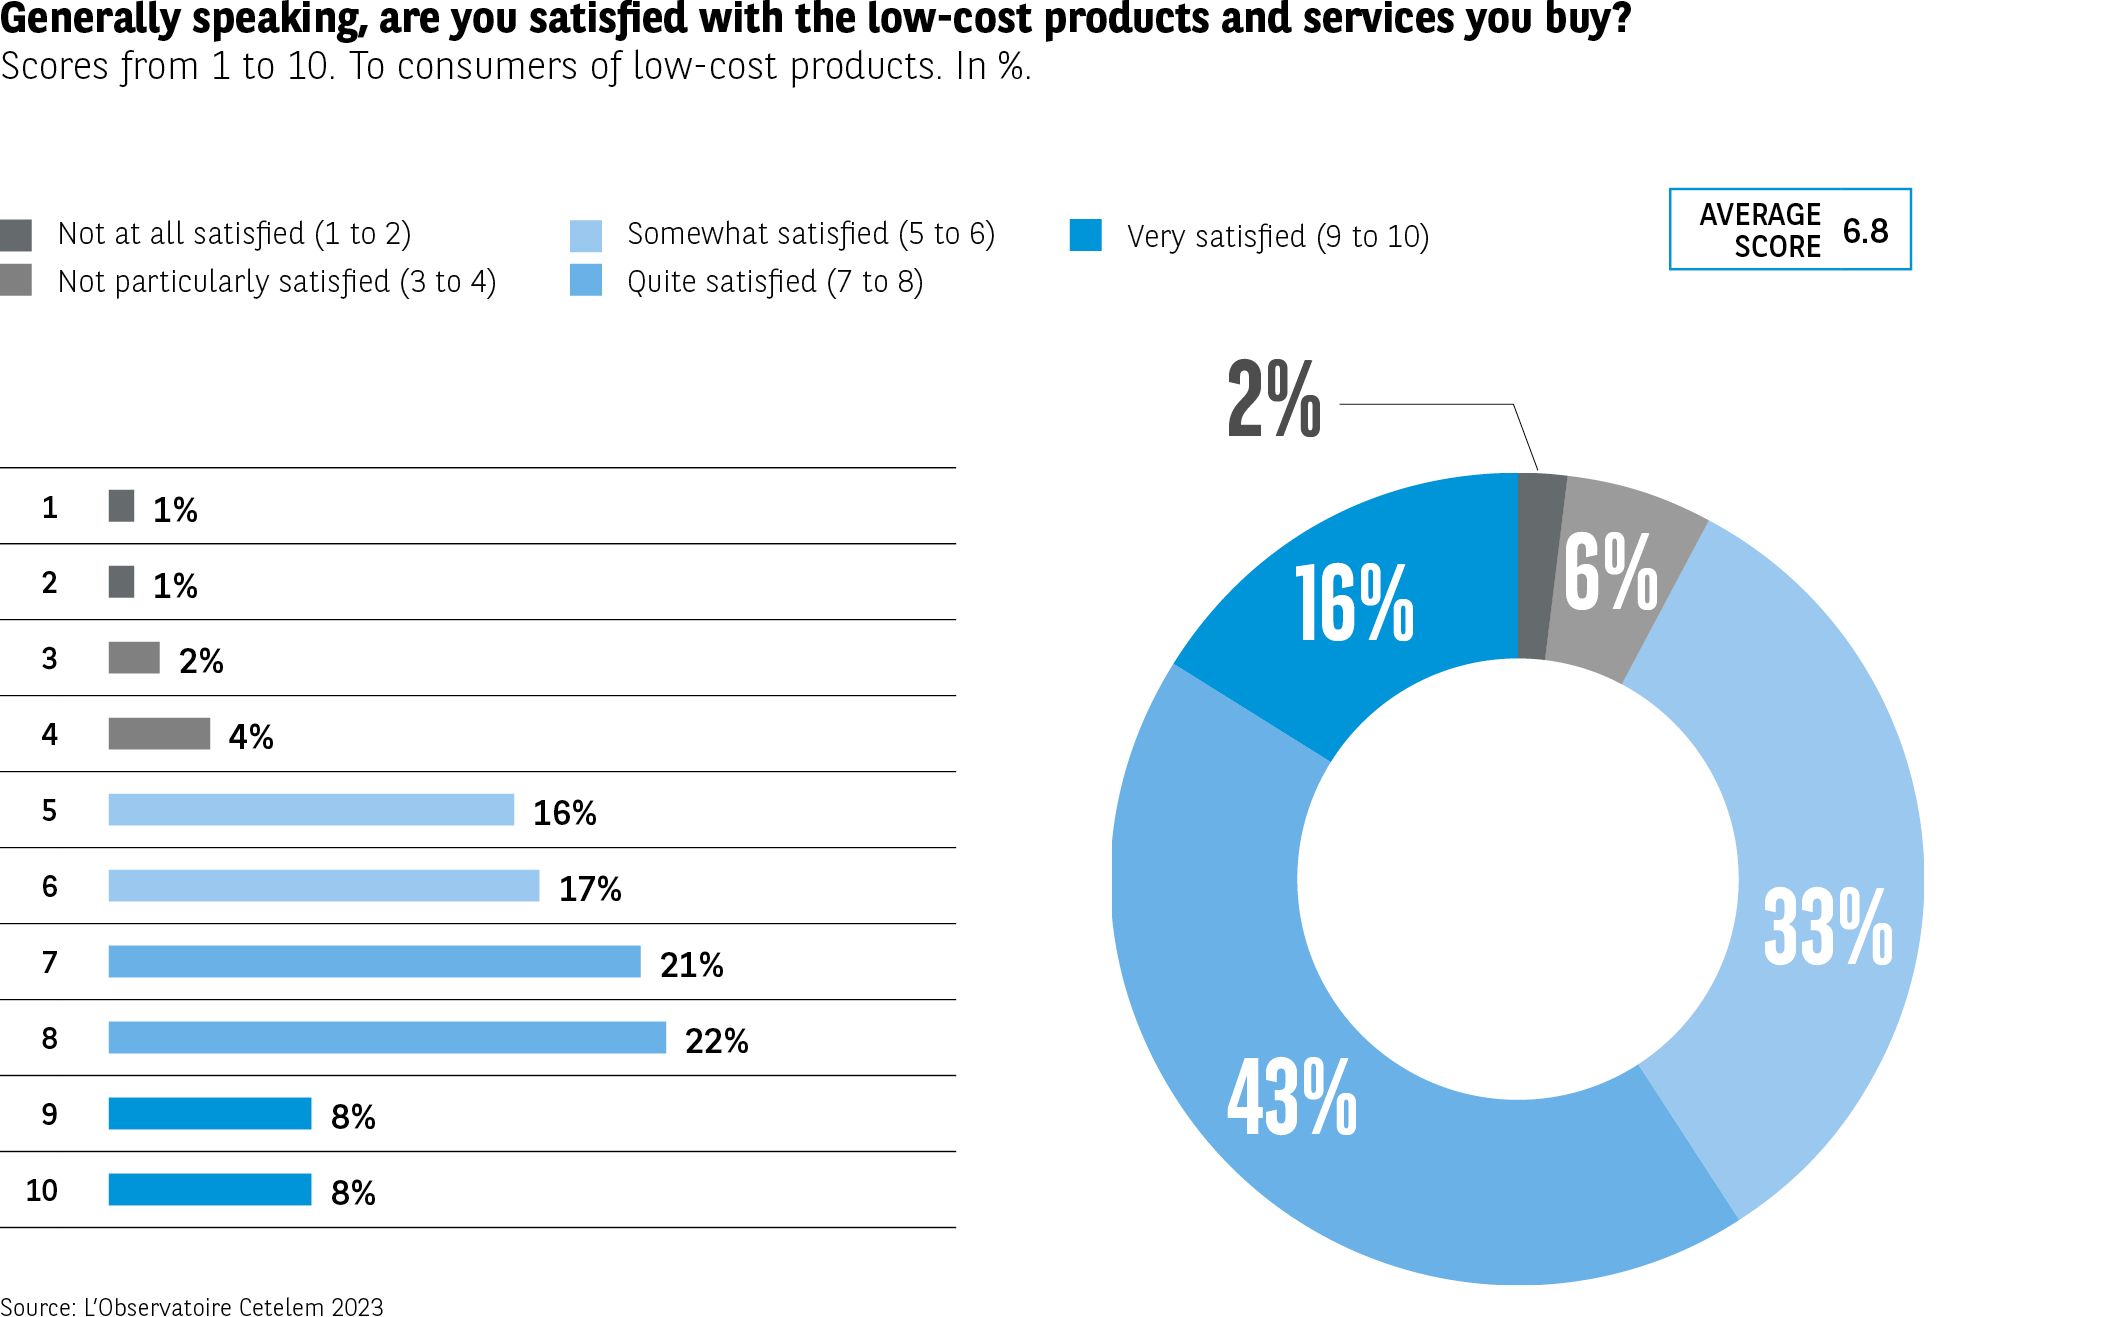 The infographic presents the complete distribution of scores attributed to low-cost product satisfaction from 1 to 10, with:
1-2 corresponding to “not satisfied at all”, 3-4 corresponding to “rather not satisfied”, 5-6 corresponding to “moderately satisfied”, 7-8 corresponding to “rather satisfied”, and 9-10 corresponding to “very satisfied”.
The overall average score is 6.8.
Detailed distribution of scores:
1: 1%
2: 1%
3: 2%
4: 4%
5: 16%
6: 17%
7: 21%
8: 22%
9: 8%
10: 8%
We therefore have, at a global level, the following results:
Not satisfied (1-4): 6%
Moderately satisfied (5-6): 33%
Rather satisfied (7-8): 43%
Very satisfied (9-10): 16%
Other visual mentions: 2% (non-textual graphic element, probably the cumulative share of scores 1-2)
The majority of consumers assign medium to high scores (7-8), while very low scores remain marginal.
Source: Cetelem Observatory 2023
The infographic presents the complete distribution of scores attributed to low-cost product satisfaction from 1 to 10, with:
1-2 corresponding to “not satisfied at all”, 3-4 corresponding to “rather not satisfied”, 5-6 corresponding to “moderately satisfied”, 7-8 corresponding to “rather satisfied”, and 9-10 corresponding to “very satisfied”.
The overall average score is 6.8.
Detailed distribution of scores:
1: 1%
2: 1%
3: 2%
4: 4%
5: 16%
6: 17%
7: 21%
8: 22%
9: 8%
10: 8%
We therefore have, at a global level, the following results:
Not satisfied (1-4): 6%
Moderately satisfied (5-6): 33%
Rather satisfied (7-8): 43%
Very satisfied (9-10): 16%
Other visual mentions: 2% (non-textual graphic element, probably the cumulative share of scores 1-2)
The majority of consumers assign medium to high scores (7-8), while very low scores remain marginal.
Source: Cetelem Observatory 2023
Breaking down the figures geographically reveals no real stand-out results. The highest and lowest scores are both produced in Eastern Europe, namely in Romania (7.4) and Bulgaria (6.1), respectively. Most other countries fall close to the overall average (Fig. 27).
Fig 27 – Low-cost satisfaction by country
Download this infographic for your presentations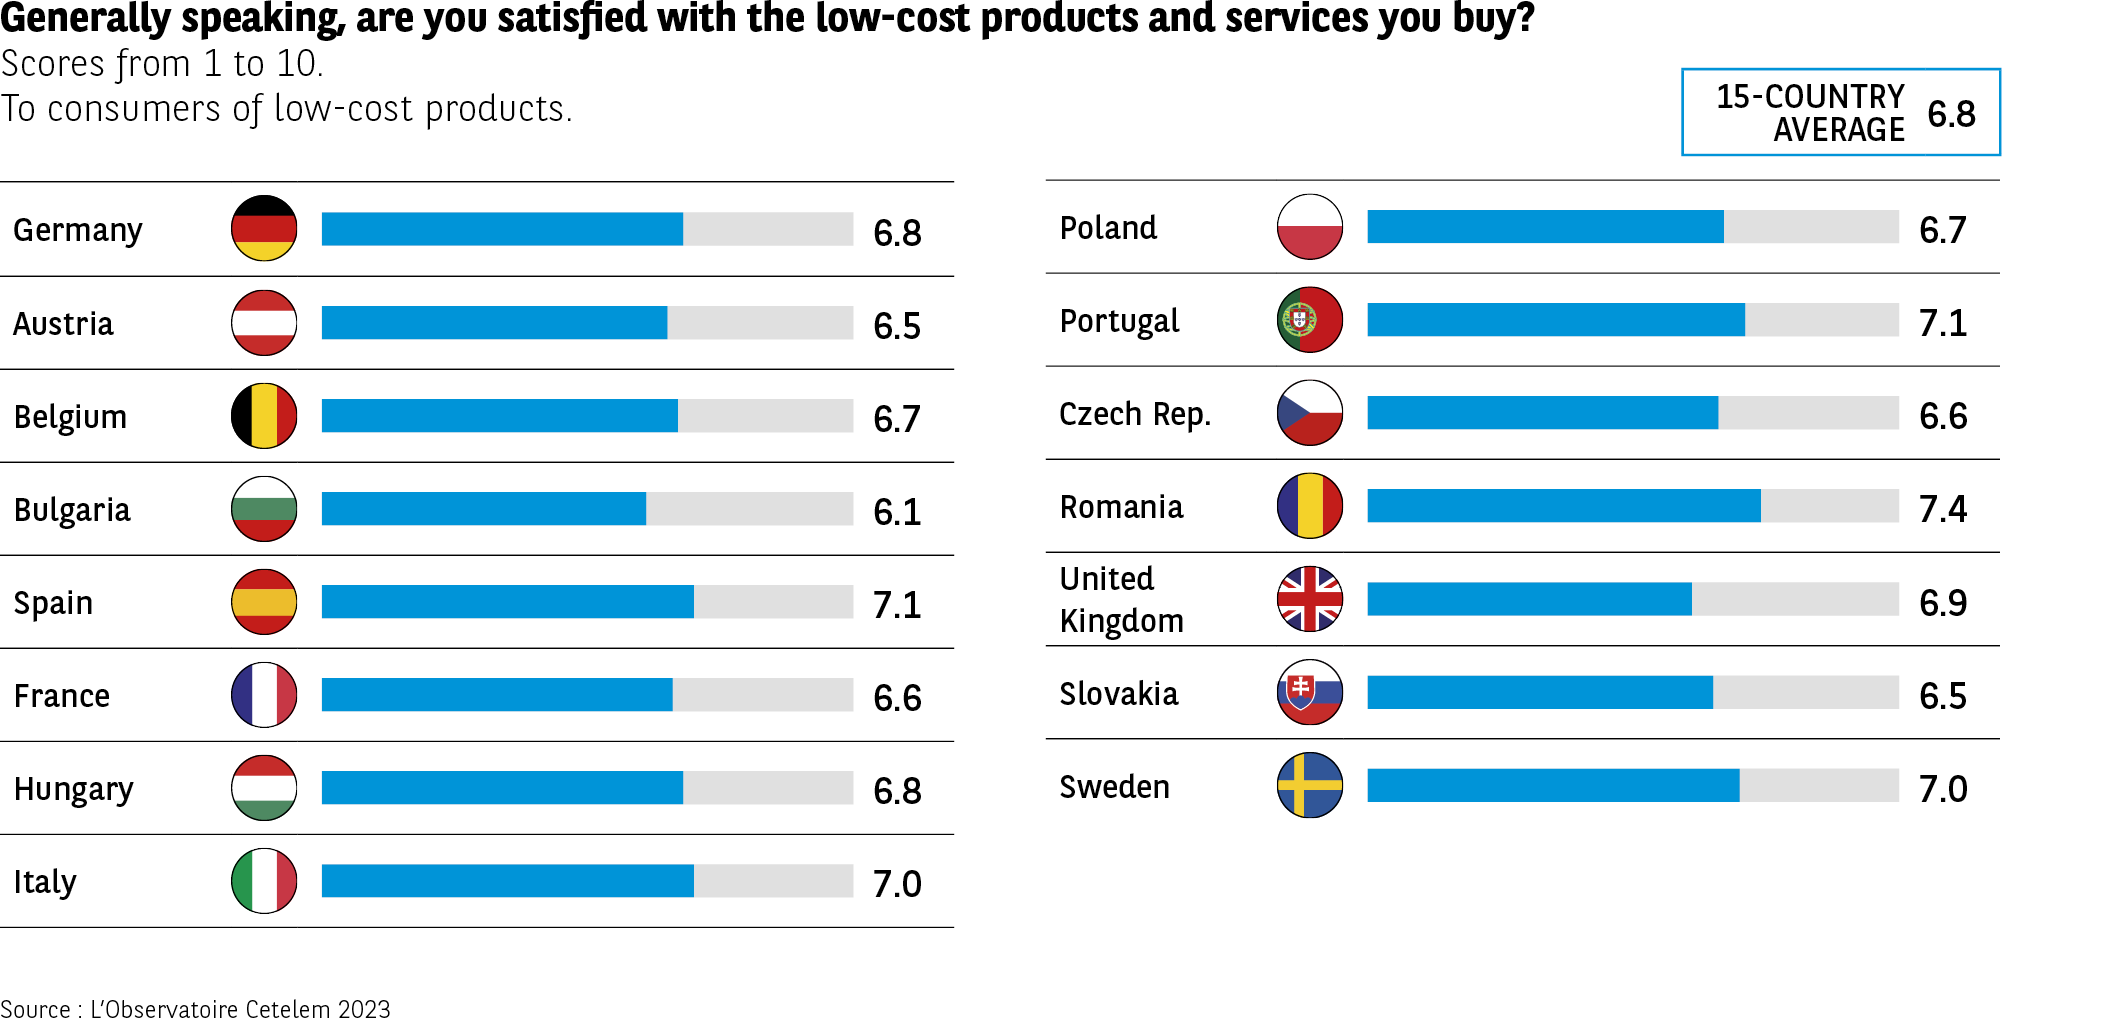 The infographic presents the satisfaction scores attributed to low-cost products and services by country. An average score of the 15 countries is indicated: 6.8.
Data by country (average score)
Germany: 6.8
Austria: 6.5
Belgium: 6.7
Bulgaria: 6.1
Spain: 7.1
France: 6.6
Hungary: 6.8
Italy: 7.0
Poland: 6.7
Portugal: 7.1
Czech Republic: 6.6
Romania: 7.4
United Kingdom: 6.9
Slovakia: 6.5
Sweden: 7.0
Satisfaction levels vary by country, with the highest scores found in Romania, Spain, and Portugal.
Source: Cetelem Observatory 2023
The infographic presents the satisfaction scores attributed to low-cost products and services by country. An average score of the 15 countries is indicated: 6.8.
Data by country (average score)
Germany: 6.8
Austria: 6.5
Belgium: 6.7
Bulgaria: 6.1
Spain: 7.1
France: 6.6
Hungary: 6.8
Italy: 7.0
Poland: 6.7
Portugal: 7.1
Czech Republic: 6.6
Romania: 7.4
United Kingdom: 6.9
Slovakia: 6.5
Sweden: 7.0
Satisfaction levels vary by country, with the highest scores found in Romania, Spain, and Portugal.
Source: Cetelem Observatory 2023
The Essential
