More commitment and clarity required from governments

An imperative revival
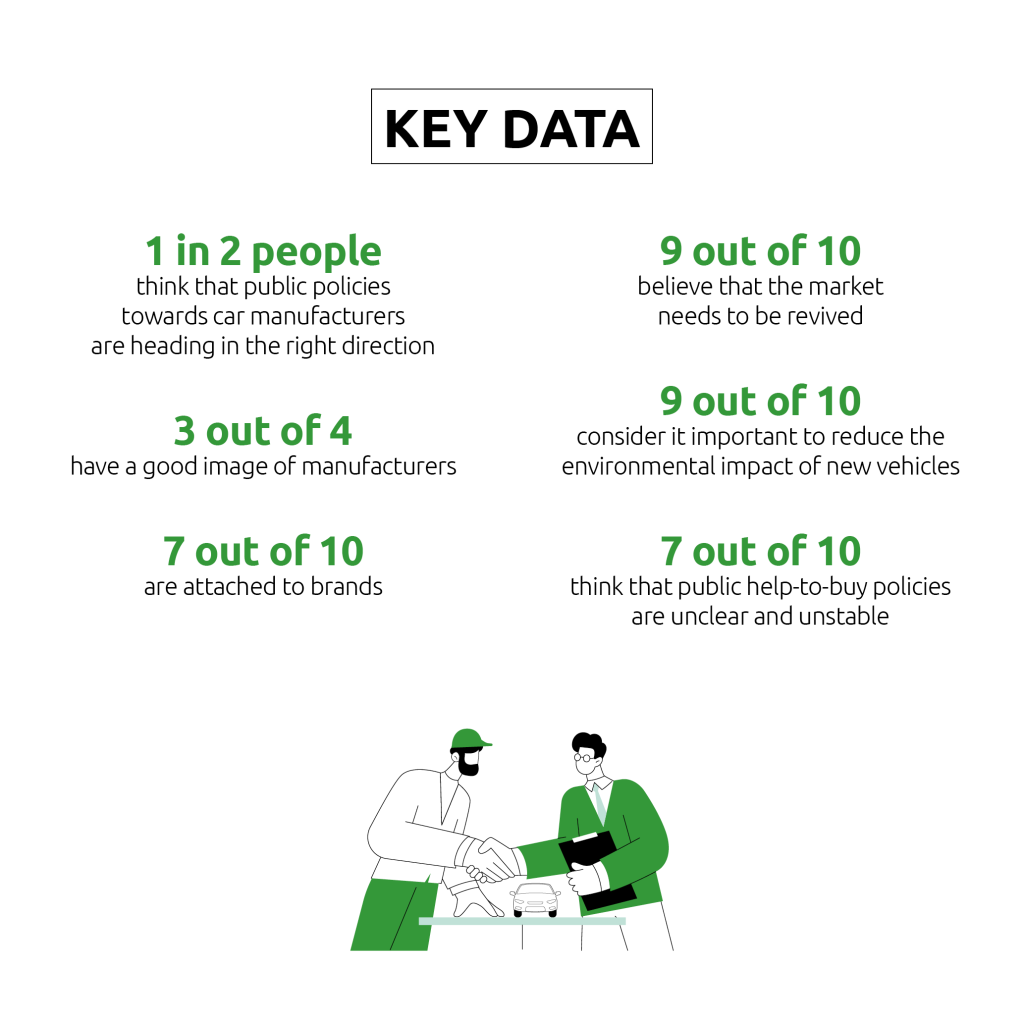
Cars we love… Manufacturers we appreciate… And a market that needs to be revived. 9 out of 10 people questioned said so, mainly in countries with strong brands and a large car industry. (Fig. 21).
Only the champion of cycling, the Netherlands, is more moderate in its enthusiasm (76%). Another piece of good news for the sector is that young people are the most supportive of this drive for recovery, as are city dwellers and high-income earners. It should be noted, however, that for half the people questioned, while this revival is important, it is not a priority.
Fig 21 – The need to revive the new car market
Download this infographic for your presentations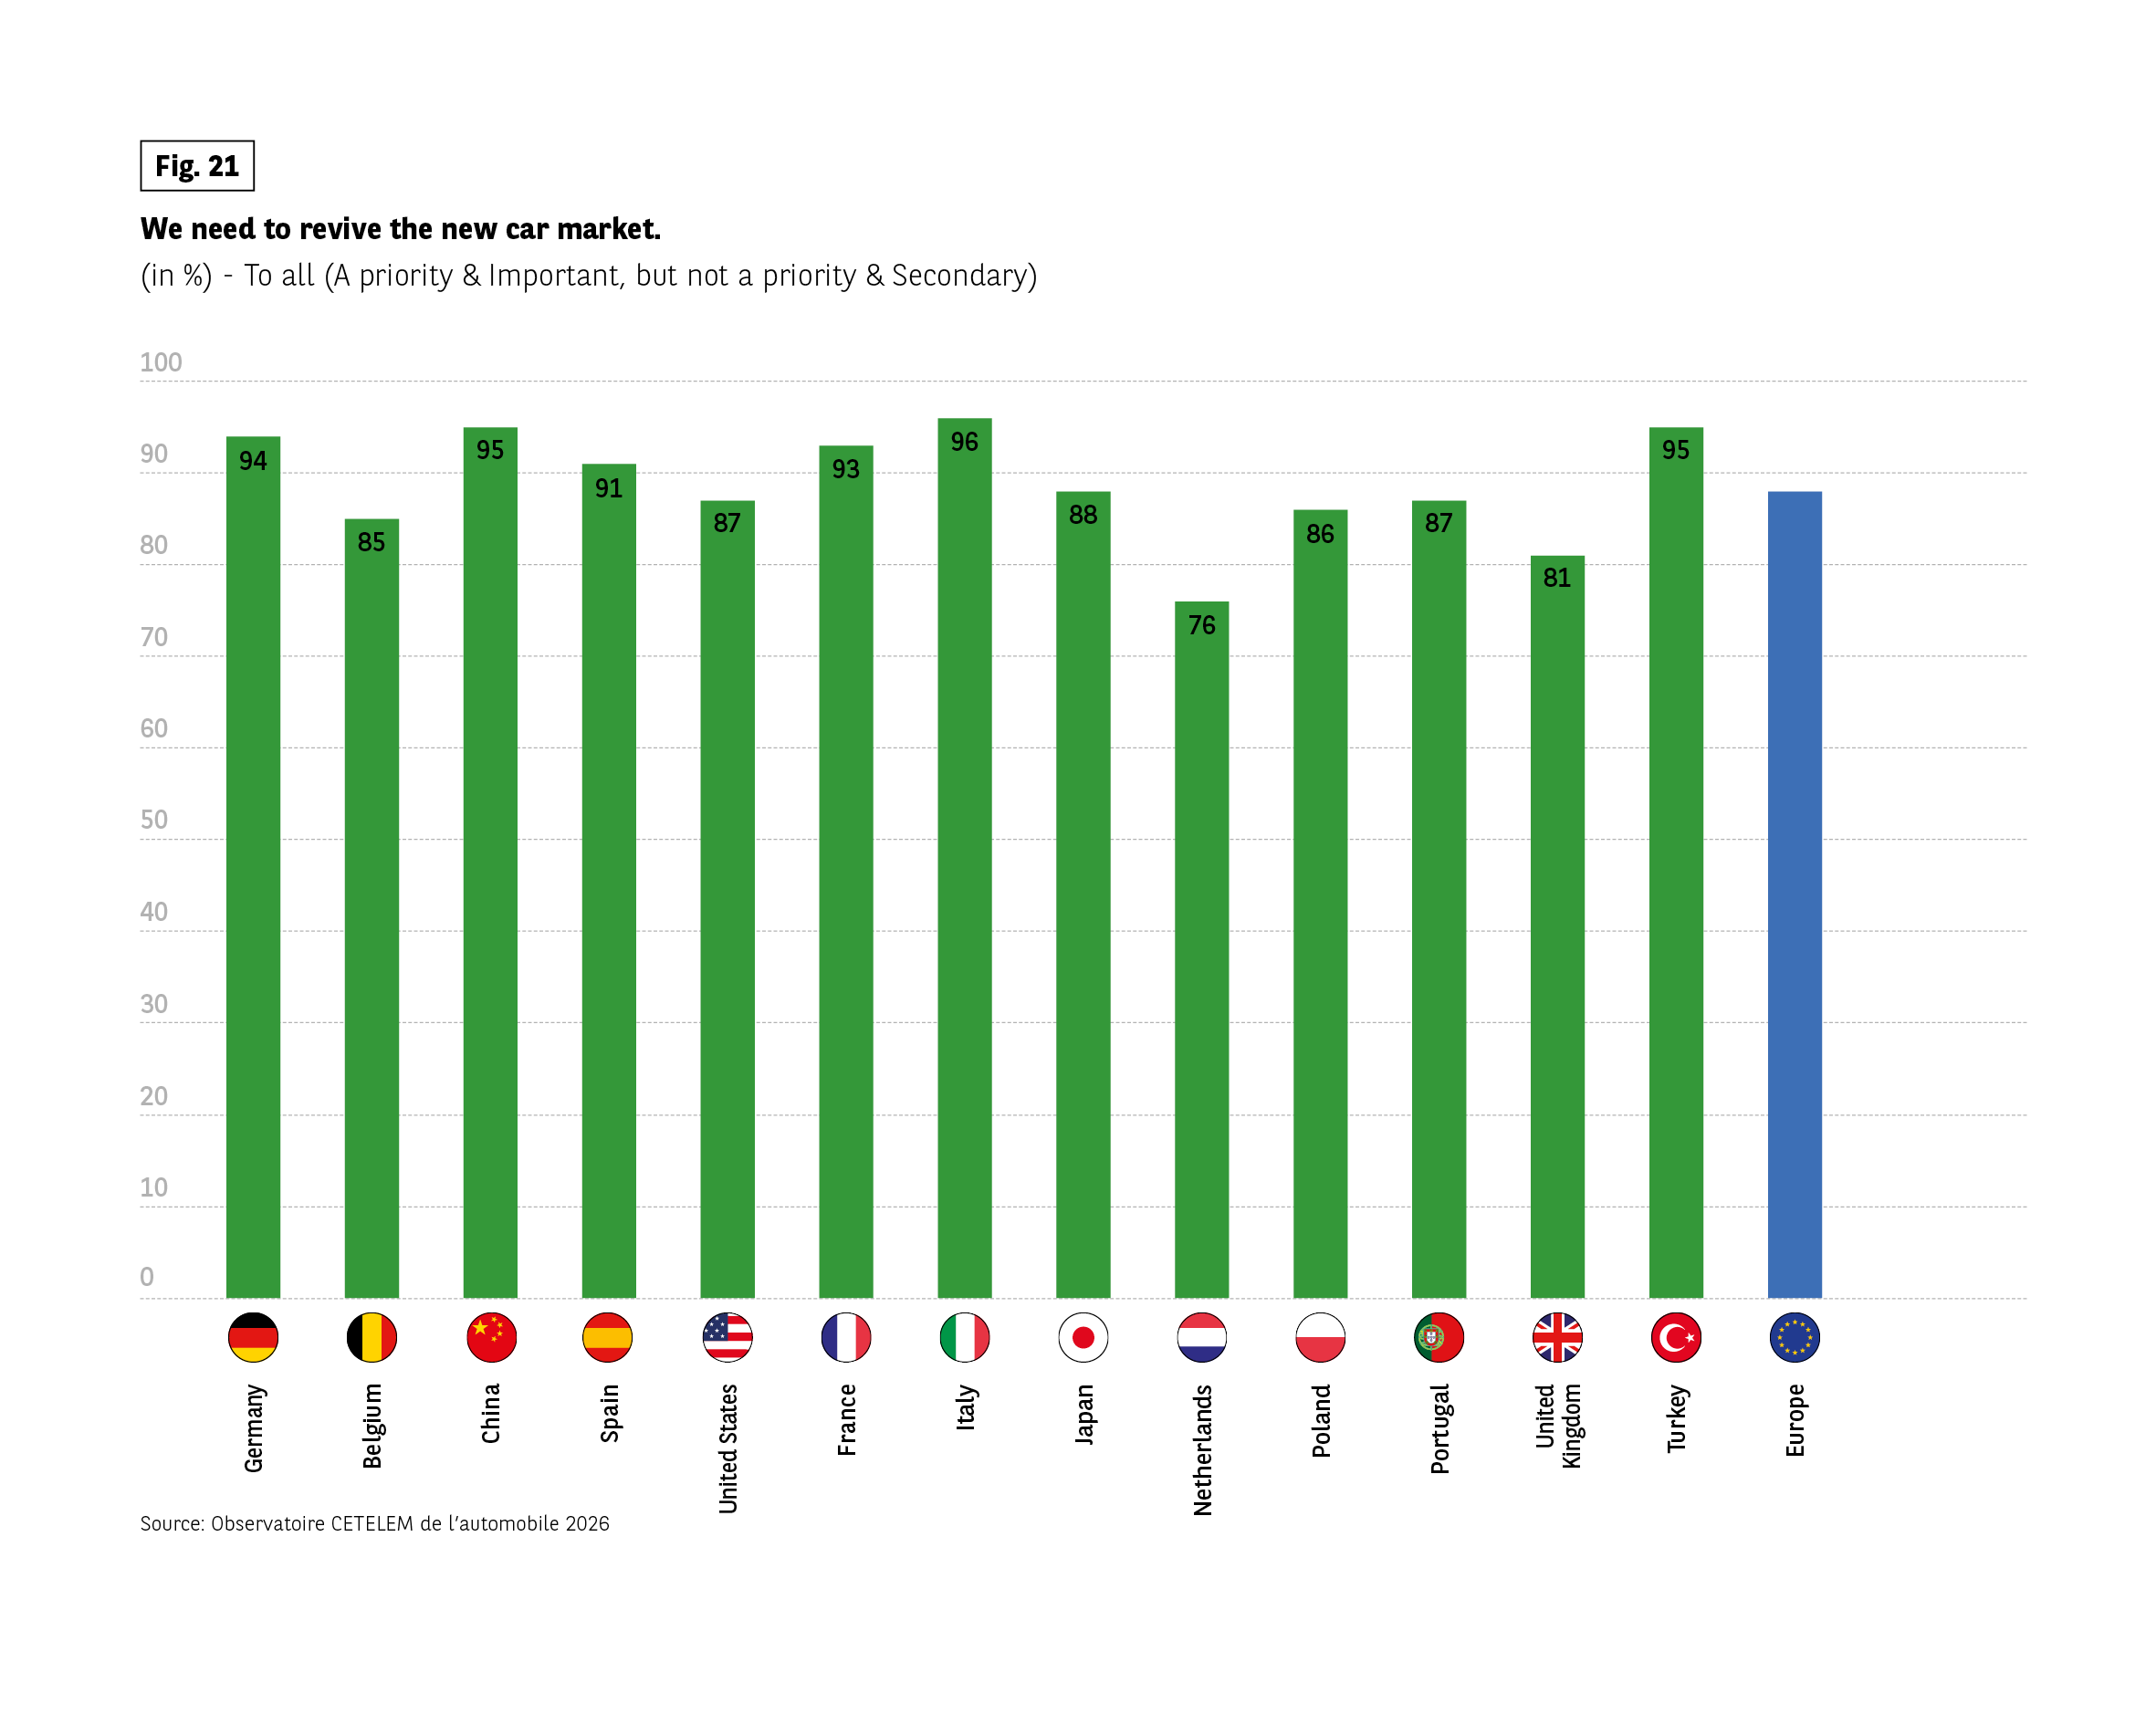 The bar chart shows the percentage of respondents who say that reviving the new car market is either a priority or important but not a priority.
Germany: 94%
Belgium: 85%
China: 95%
Spain: 91%
United States: 87%
France: 93%
Italy: 96%
Japan: 88%
Netherlands: 76%
Poland: 86%
Portugal: 87%
United Kingdom: 81%
Turkey: 95%
Europe: 86%
Source: Observatoire Cetelem de l’Automobile 2026.
The bar chart shows the percentage of respondents who say that reviving the new car market is either a priority or important but not a priority.
Germany: 94%
Belgium: 85%
China: 95%
Spain: 91%
United States: 87%
France: 93%
Italy: 96%
Japan: 88%
Netherlands: 76%
Poland: 86%
Portugal: 87%
United Kingdom: 81%
Turkey: 95%
Europe: 86%
Source: Observatoire Cetelem de l’Automobile 2026.
Don’t forget the environment…
However, this revival must be green, and not at any cost. 9 out of 10 people think it is important to reduce the environmental impact of new vehicles, although half of the respondents do not consider this to be a priority. (Fig. 22).
The views expressed in the different countries are relatively equivalent, with the Japanese being the least likely to mention this importance.
Fig 22 – Priority given to reducing the environmental impact of cars
Download this infographic for your presentations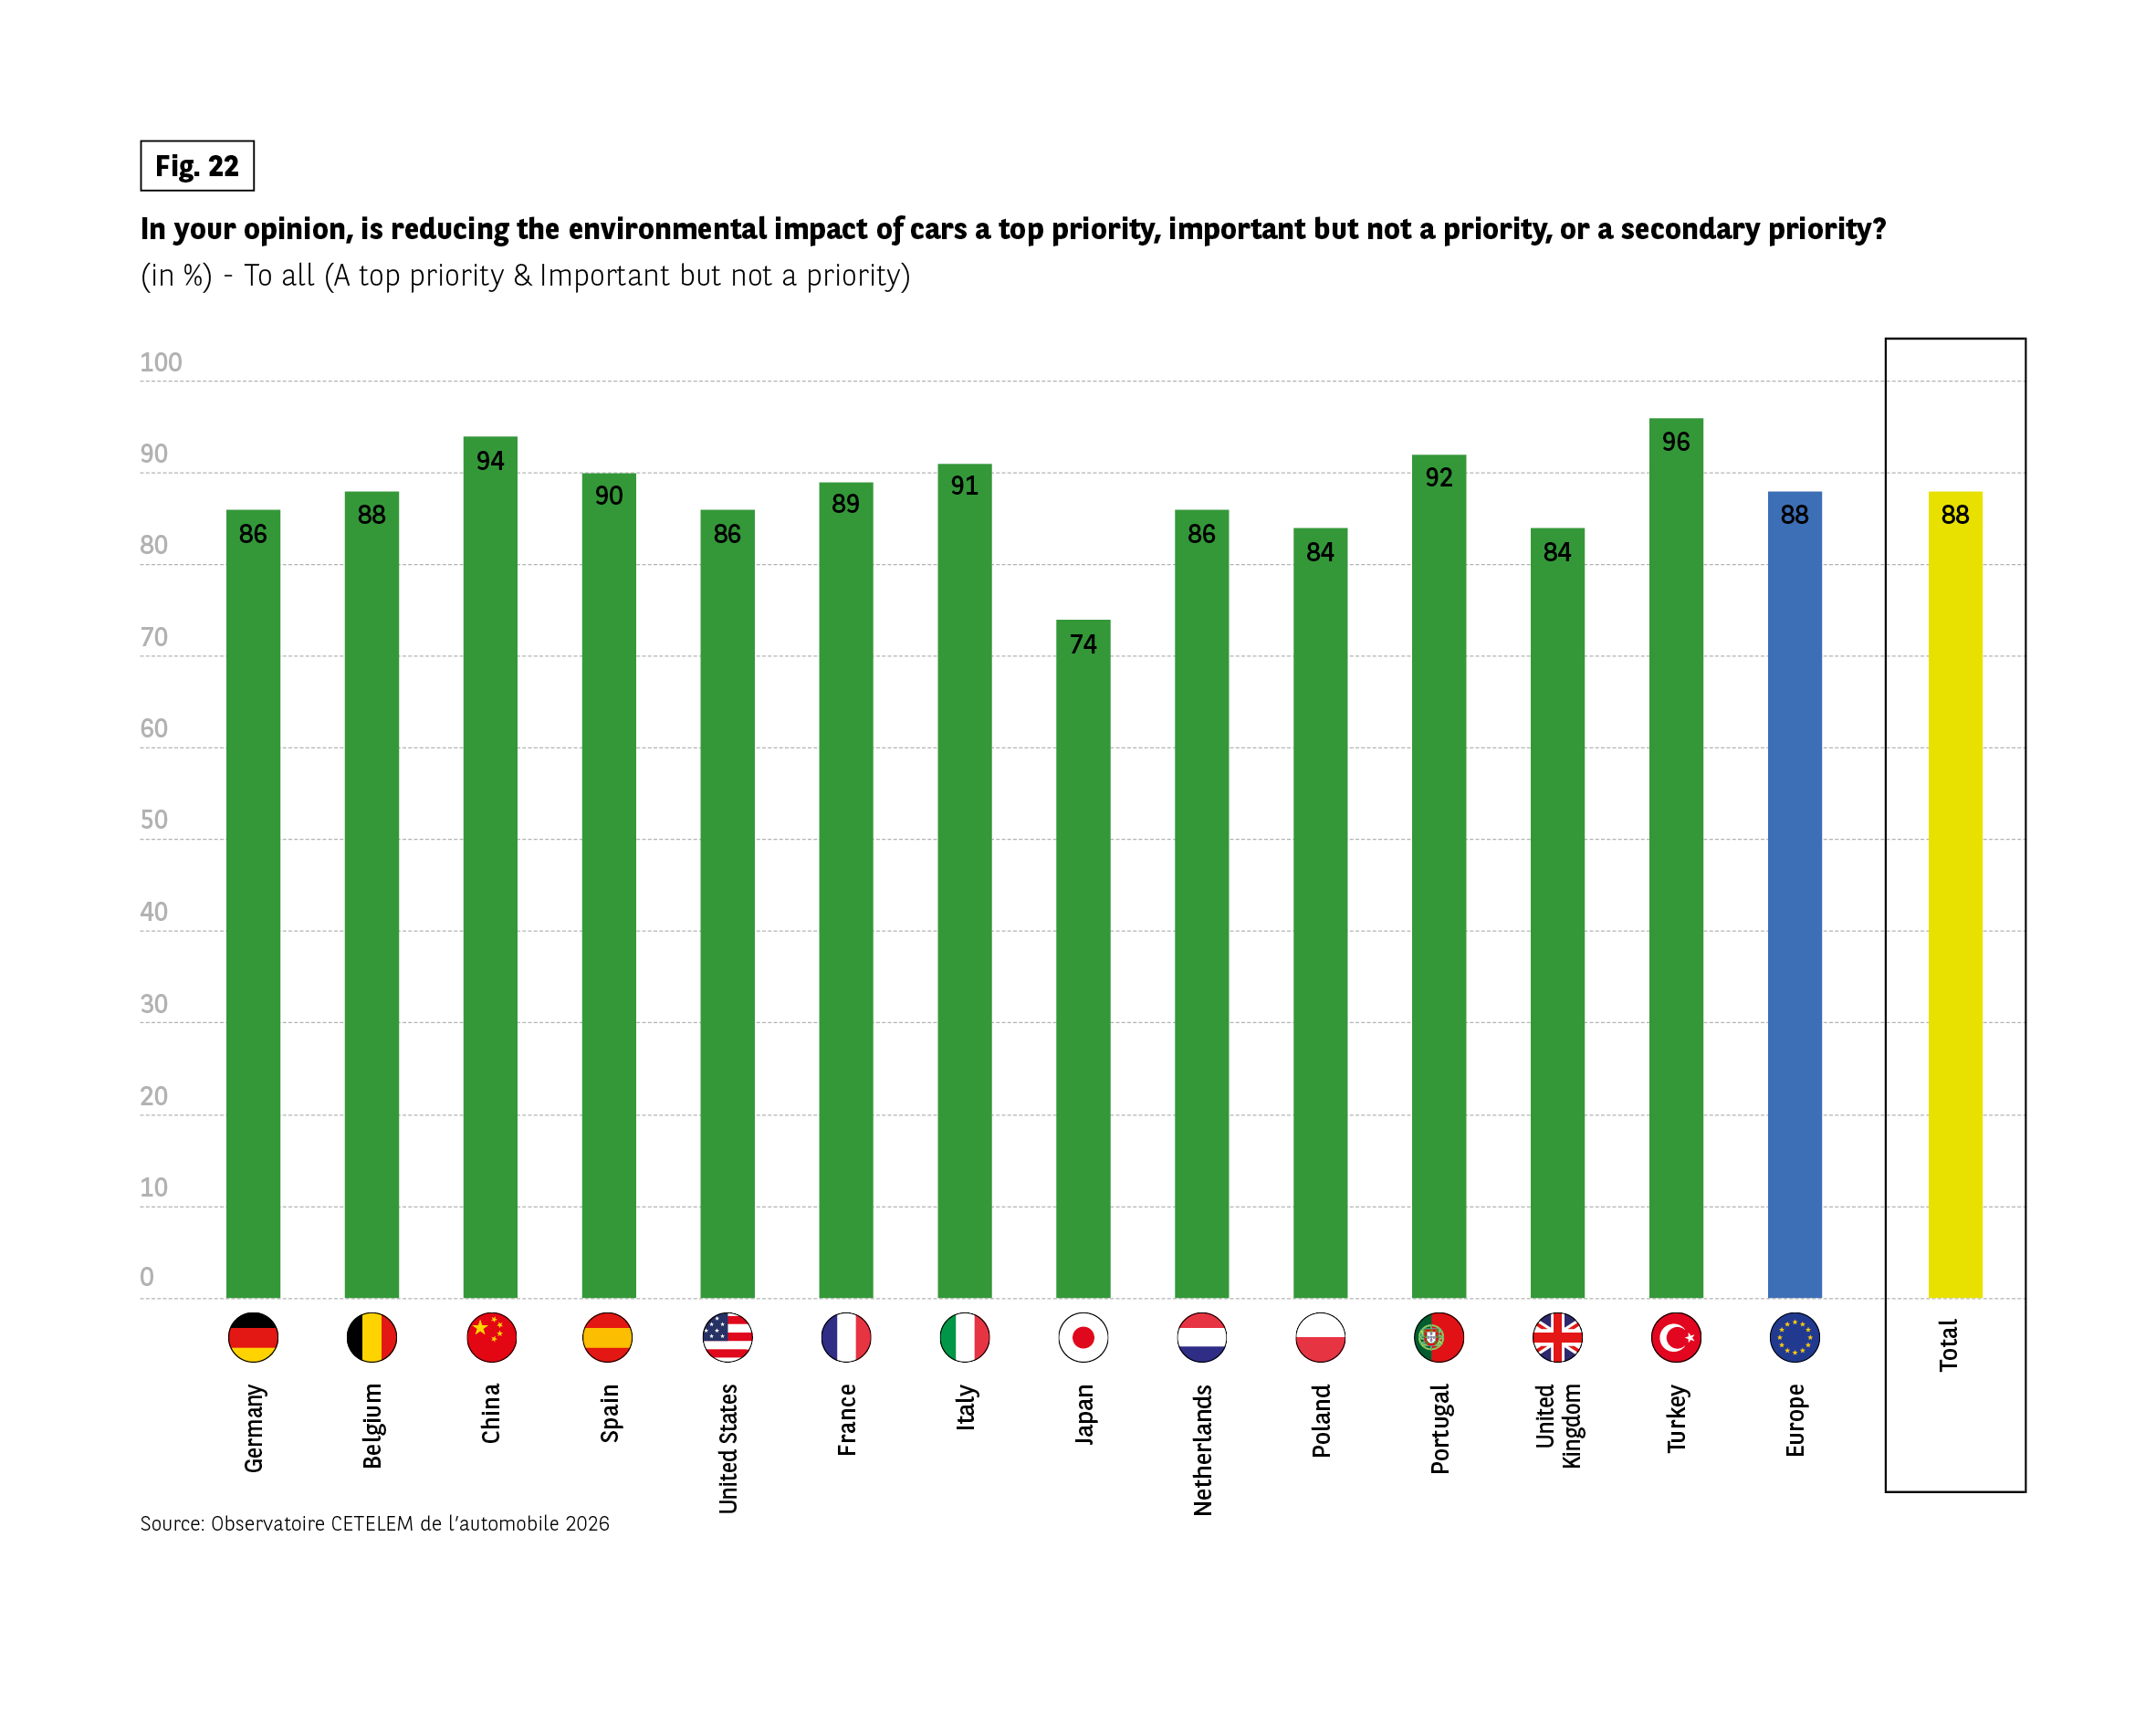 The bar chart shows the percentage of respondents who consider reducing the environmental impact of cars either a top priority or important but not a priority.
Germany: 86%
Belgium: 88%
China: 94%
Spain: 90%
United States: 86%
France: 89%
Italy: 91%
Japan: 74%
Netherlands: 86%
Poland: 84%
Portugal: 92%
United Kingdom: 84%
Turkey: 96%
Europe: 88%
Total: 88%
Source: Observatoire Cetelem de l’Automobile 2026.
The bar chart shows the percentage of respondents who consider reducing the environmental impact of cars either a top priority or important but not a priority.
Germany: 86%
Belgium: 88%
China: 94%
Spain: 90%
United States: 86%
France: 89%
Italy: 91%
Japan: 74%
Netherlands: 86%
Poland: 84%
Portugal: 92%
United Kingdom: 84%
Turkey: 96%
Europe: 88%
Total: 88%
Source: Observatoire Cetelem de l’Automobile 2026.
… with relatively positive policies
When asked about this issue, a small majority of respondents believed that public policy is heading in the right direction. (Fig. 23).
At the risk of repeating ourselves over and over again, while the Chinese are still the most enthusiastic, many European countries are reluctant to define them as positive.
In Germany, France and the Netherlands, this view is even in the minority.
Fig 23 – Public policy direction on environmental impact of cars
Download this infographic for your presentations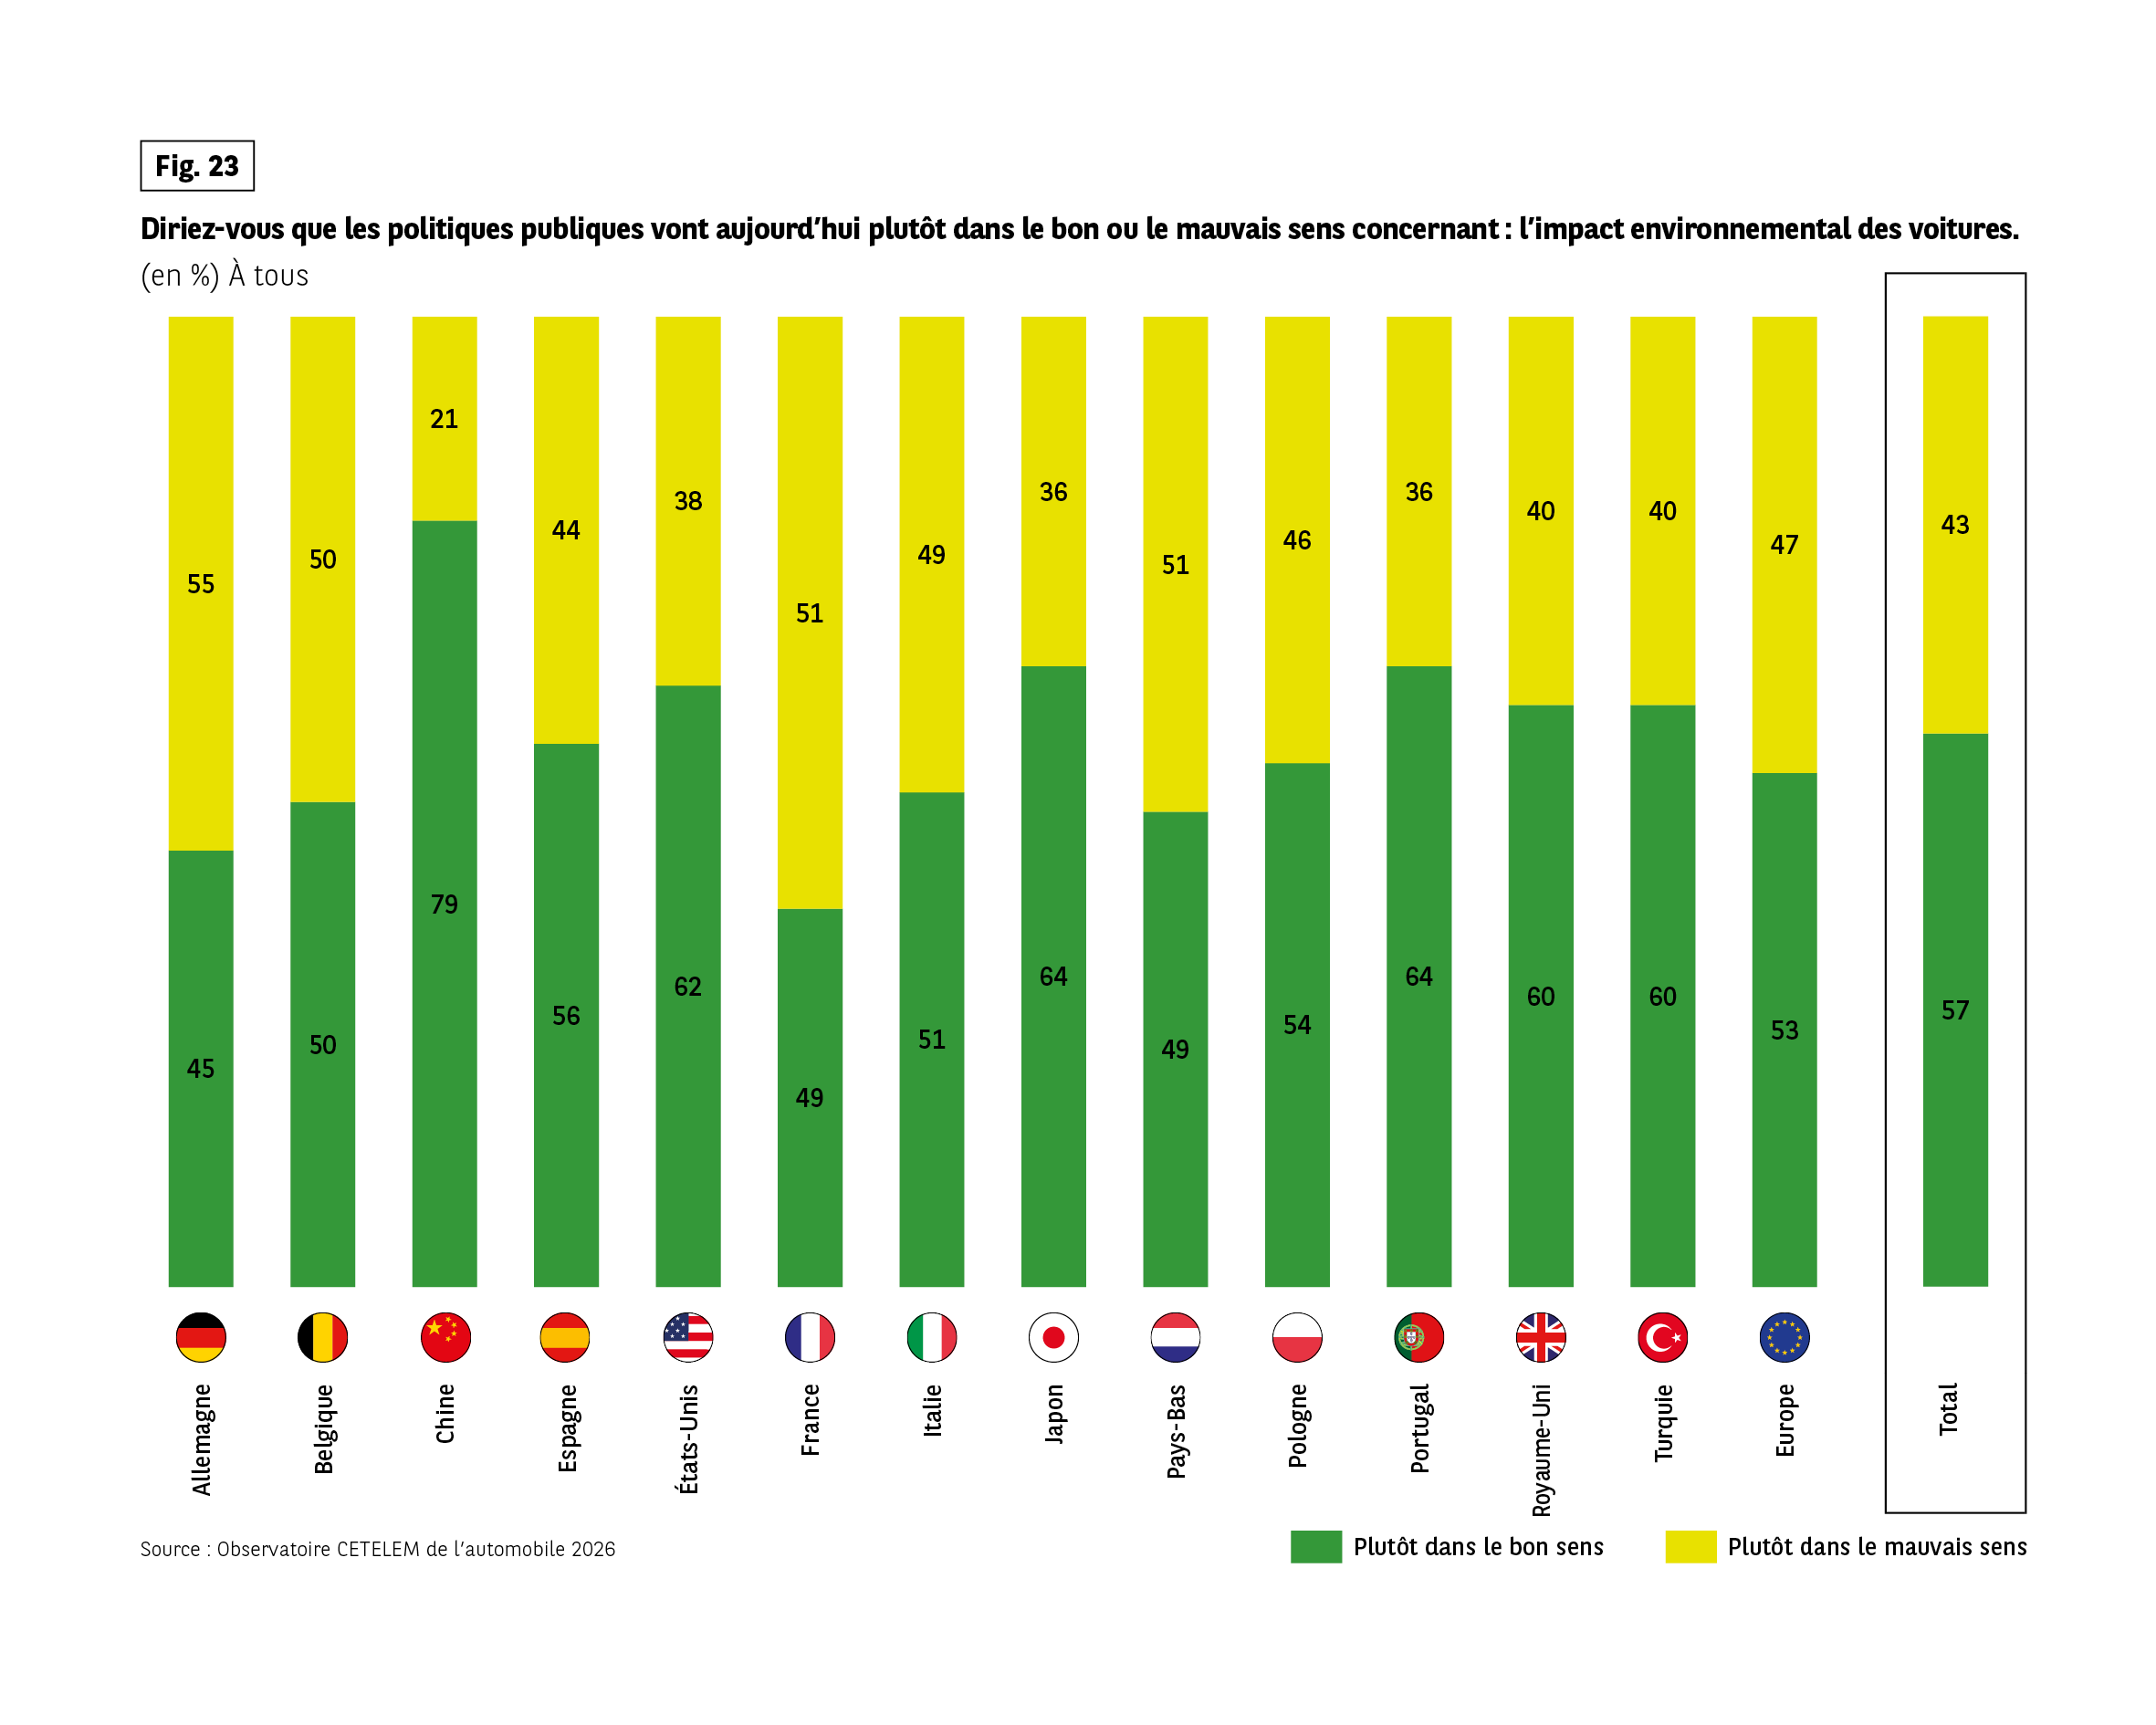 Graphique comparant la perception des politiques publiques concernant l’impact environnemental des voitures. Deux réponses possibles : « plutôt dans le bon sens » et « plutôt dans le mauvais sens ».
Bon sens / Mauvais sens par pays :
Allemagne 45 / 55, Belgique 50 / 50, Chine 79 / 21, Espagne 56 / 44, États-Unis 62 / 38, France 49 / 51, Italie 64 / 36, Japon 49 / 51, Pays-Bas 54 / 46, Pologne 64 / 36, Portugal 60 / 40, Royaume-Uni 60 / 40, Turquie 53 / 47, Europe 57 / 43.
Enseignement principal : perception globalement positive en Chine, États-Unis et Europe centrale ; plus divisée en France, Japon et Allemagne.
Source : Observatoire Cetelem de l’automobile 2026
Graphique comparant la perception des politiques publiques concernant l’impact environnemental des voitures. Deux réponses possibles : « plutôt dans le bon sens » et « plutôt dans le mauvais sens ».
Bon sens / Mauvais sens par pays :
Allemagne 45 / 55, Belgique 50 / 50, Chine 79 / 21, Espagne 56 / 44, États-Unis 62 / 38, France 49 / 51, Italie 64 / 36, Japon 49 / 51, Pays-Bas 54 / 46, Pologne 64 / 36, Portugal 60 / 40, Royaume-Uni 60 / 40, Turquie 53 / 47, Europe 57 / 43.
Enseignement principal : perception globalement positive en Chine, États-Unis et Europe centrale ; plus divisée en France, Japon et Allemagne.
Source : Observatoire Cetelem de l’automobile 2026
Unclear and unstable help-to-buy policies
The issue of the environment raised doubts about the positive intentions of public policies. Another issue, linked to the purchase itself, confirms that these policies certainly lack clarity. 7 out of 10 respondents said that help-to-buy policies were definitely opaque, with Portugal and Japan leading the way in this opinion. (Fig. 24).
Most European car-producing nations, particularly France, share this view.
Is there a country where everything is clear and there is no room for doubt? China, of course. Seniors and residents of towns and rural areas are the most vocal critics of public policies directed at the purchase of cars.
Fig 24 – Public policies on buying a new car
Download this infographic for your presentations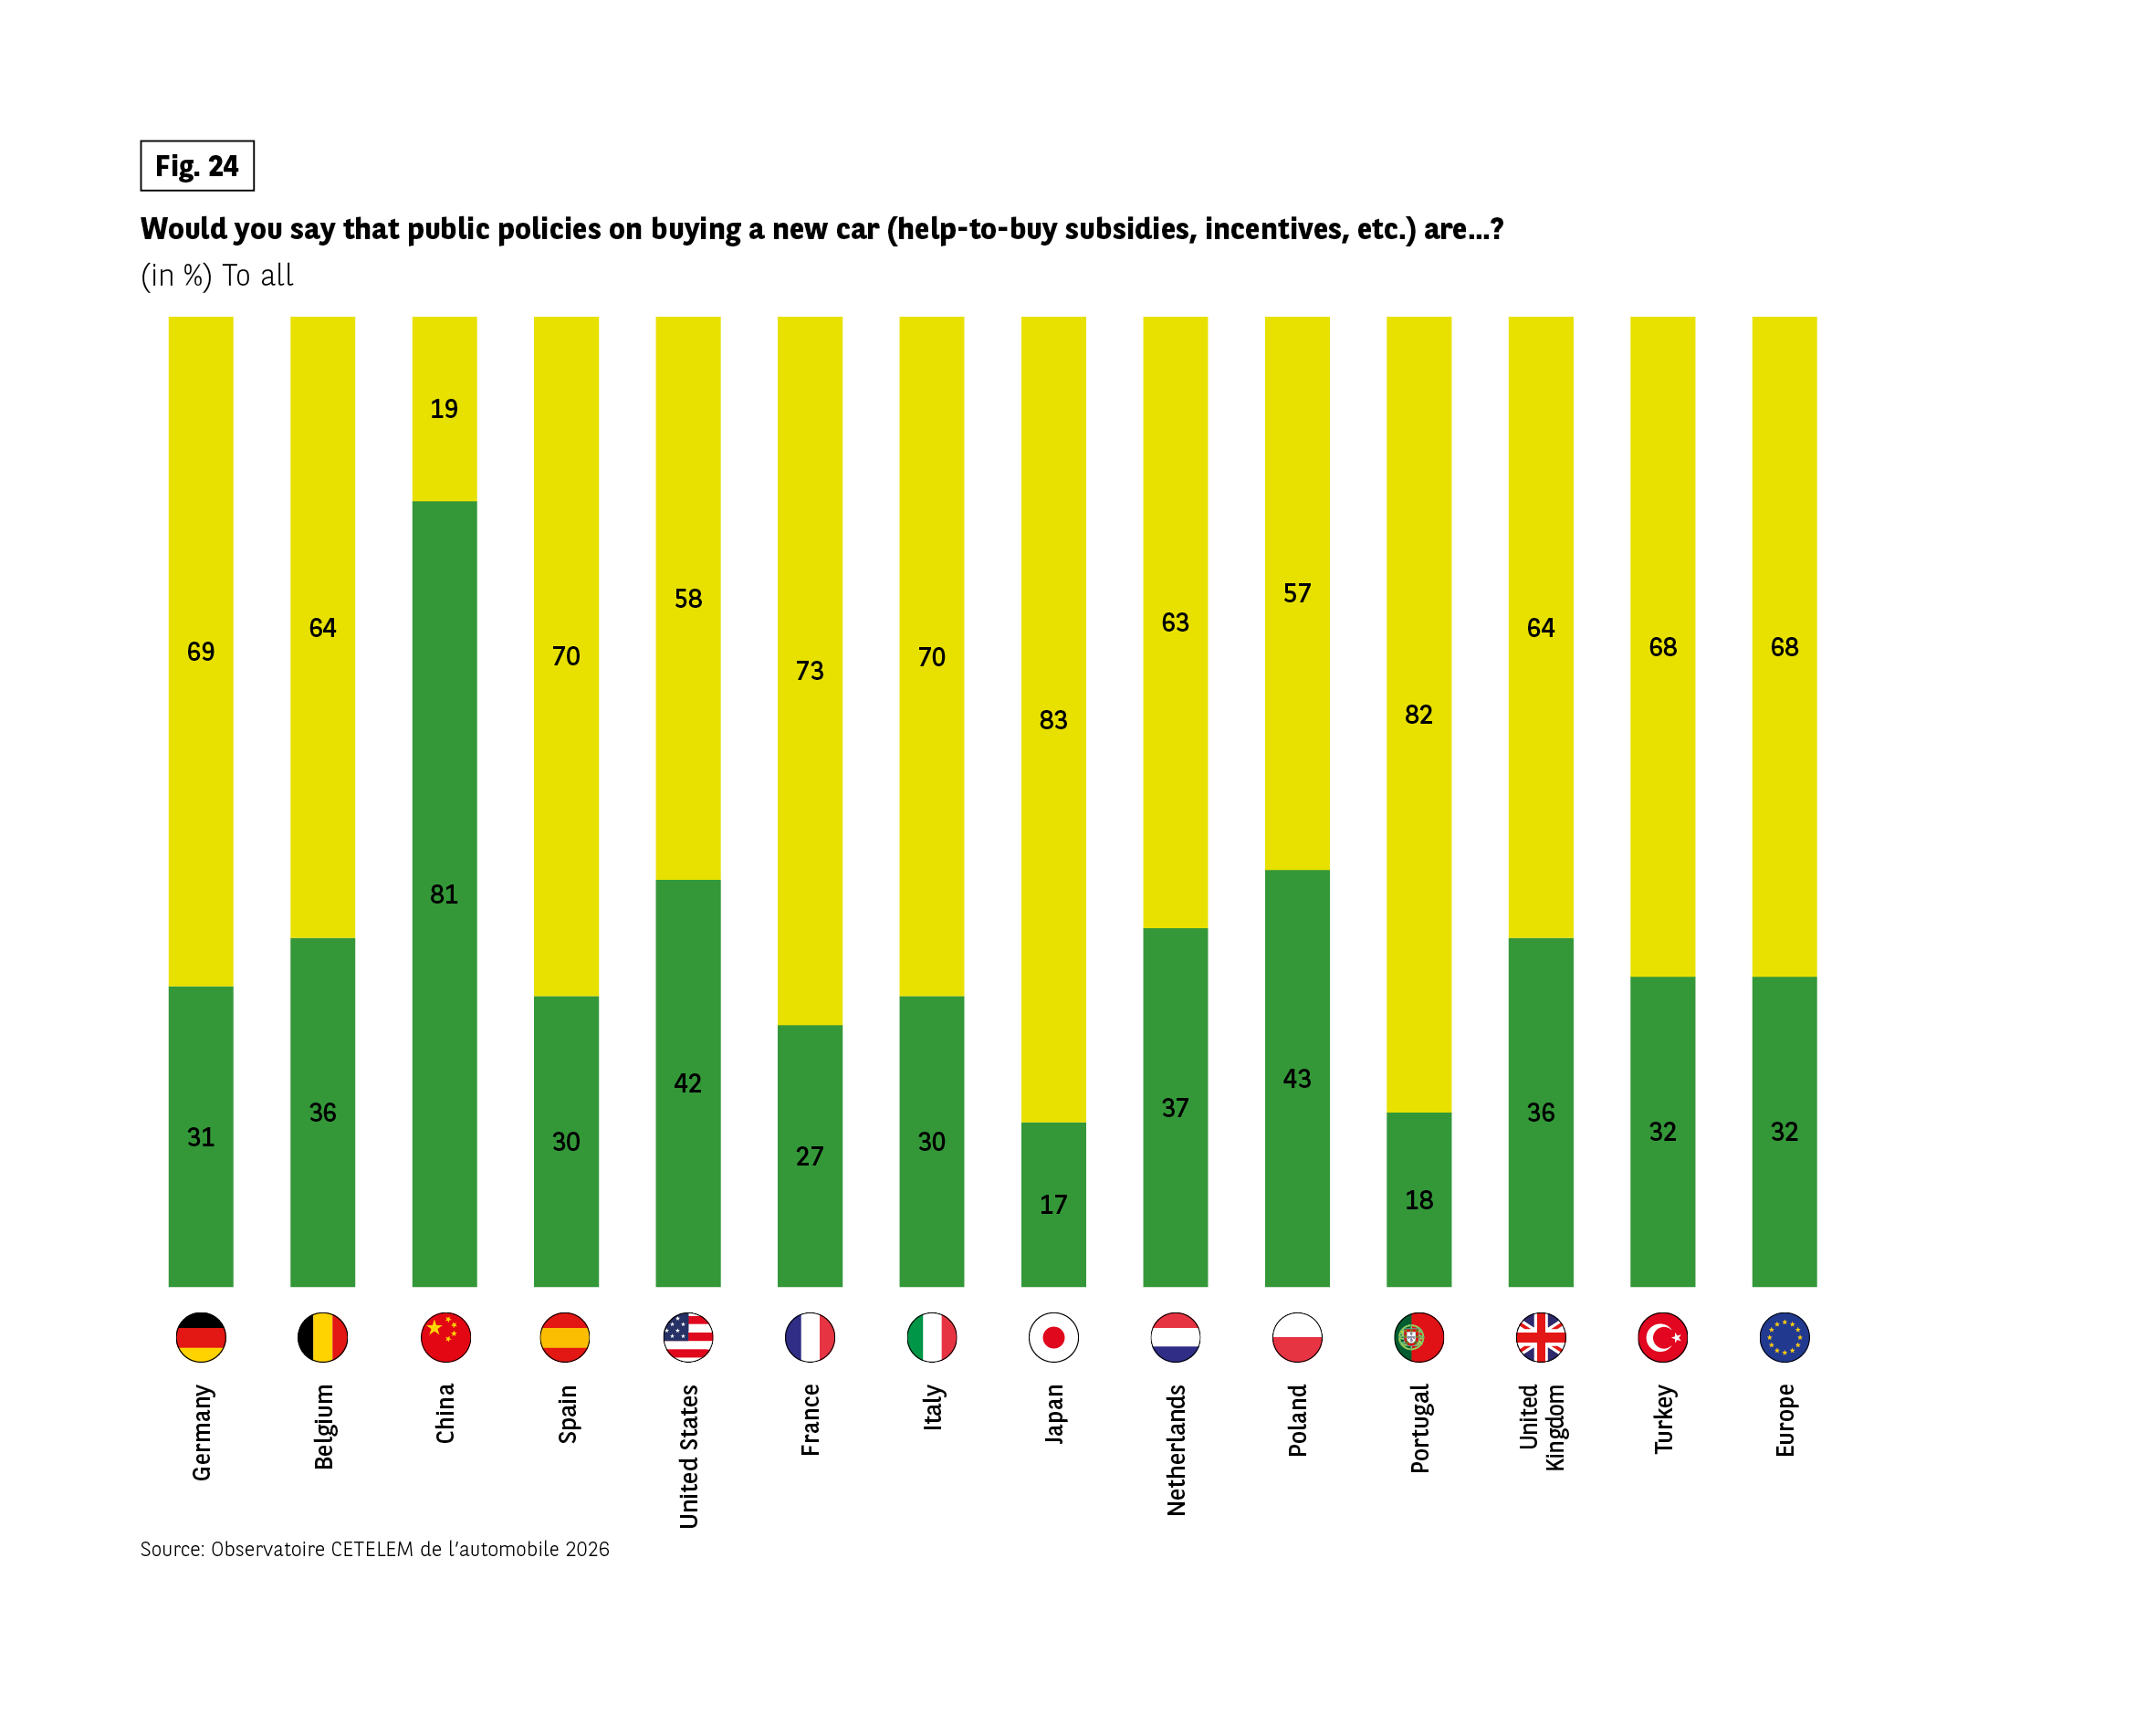 The stacked bar chart shows the share of respondents who believe public policies on buying a new car are supportive (green) or not supportive (yellow).
Supportive vs not supportive:
Germany: 31% supportive, 69% not supportive
Belgium: 36% supportive, 64% not supportive
China: 81% supportive, 19% not supportive
Spain: 30% supportive, 70% not supportive
United States: 42% supportive, 58% not supportive
France: 27% supportive, 73% not supportive
Italy: 30% supportive, 70% not supportive
Japan: 17% supportive, 83% not supportive
Netherlands: 37% supportive, 63% not supportive
Poland: 43% supportive, 57% not supportive
Portugal: 18% supportive, 82% not supportive
United Kingdom: 36% supportive, 64% not supportive
Turkey: 32% supportive, 68% not supportive
Europe: 32% supportive, 68% not supportive
Source: Observatoire Cetelem de l’Automobile 2026.
The stacked bar chart shows the share of respondents who believe public policies on buying a new car are supportive (green) or not supportive (yellow).
Supportive vs not supportive:
Germany: 31% supportive, 69% not supportive
Belgium: 36% supportive, 64% not supportive
China: 81% supportive, 19% not supportive
Spain: 30% supportive, 70% not supportive
United States: 42% supportive, 58% not supportive
France: 27% supportive, 73% not supportive
Italy: 30% supportive, 70% not supportive
Japan: 17% supportive, 83% not supportive
Netherlands: 37% supportive, 63% not supportive
Poland: 43% supportive, 57% not supportive
Portugal: 18% supportive, 82% not supportive
United Kingdom: 36% supportive, 64% not supportive
Turkey: 32% supportive, 68% not supportive
Europe: 32% supportive, 68% not supportive
Source: Observatoire Cetelem de l’Automobile 2026.
This criticism surrounding the policies’ lack of clarity is bolstered by another criticism, that of instability, with the latter leading to the former. Here again, in all countries except China, a clear majority point to this instability. (Fig. 25).
Japan, Italy, France and Portugal are the most vocal critics of this instability. Seniors and people living in rural areas once again stand out as adopting the same position.
Fig 25 – Stability of public policies on buying a new car
Download this infographic for your presentations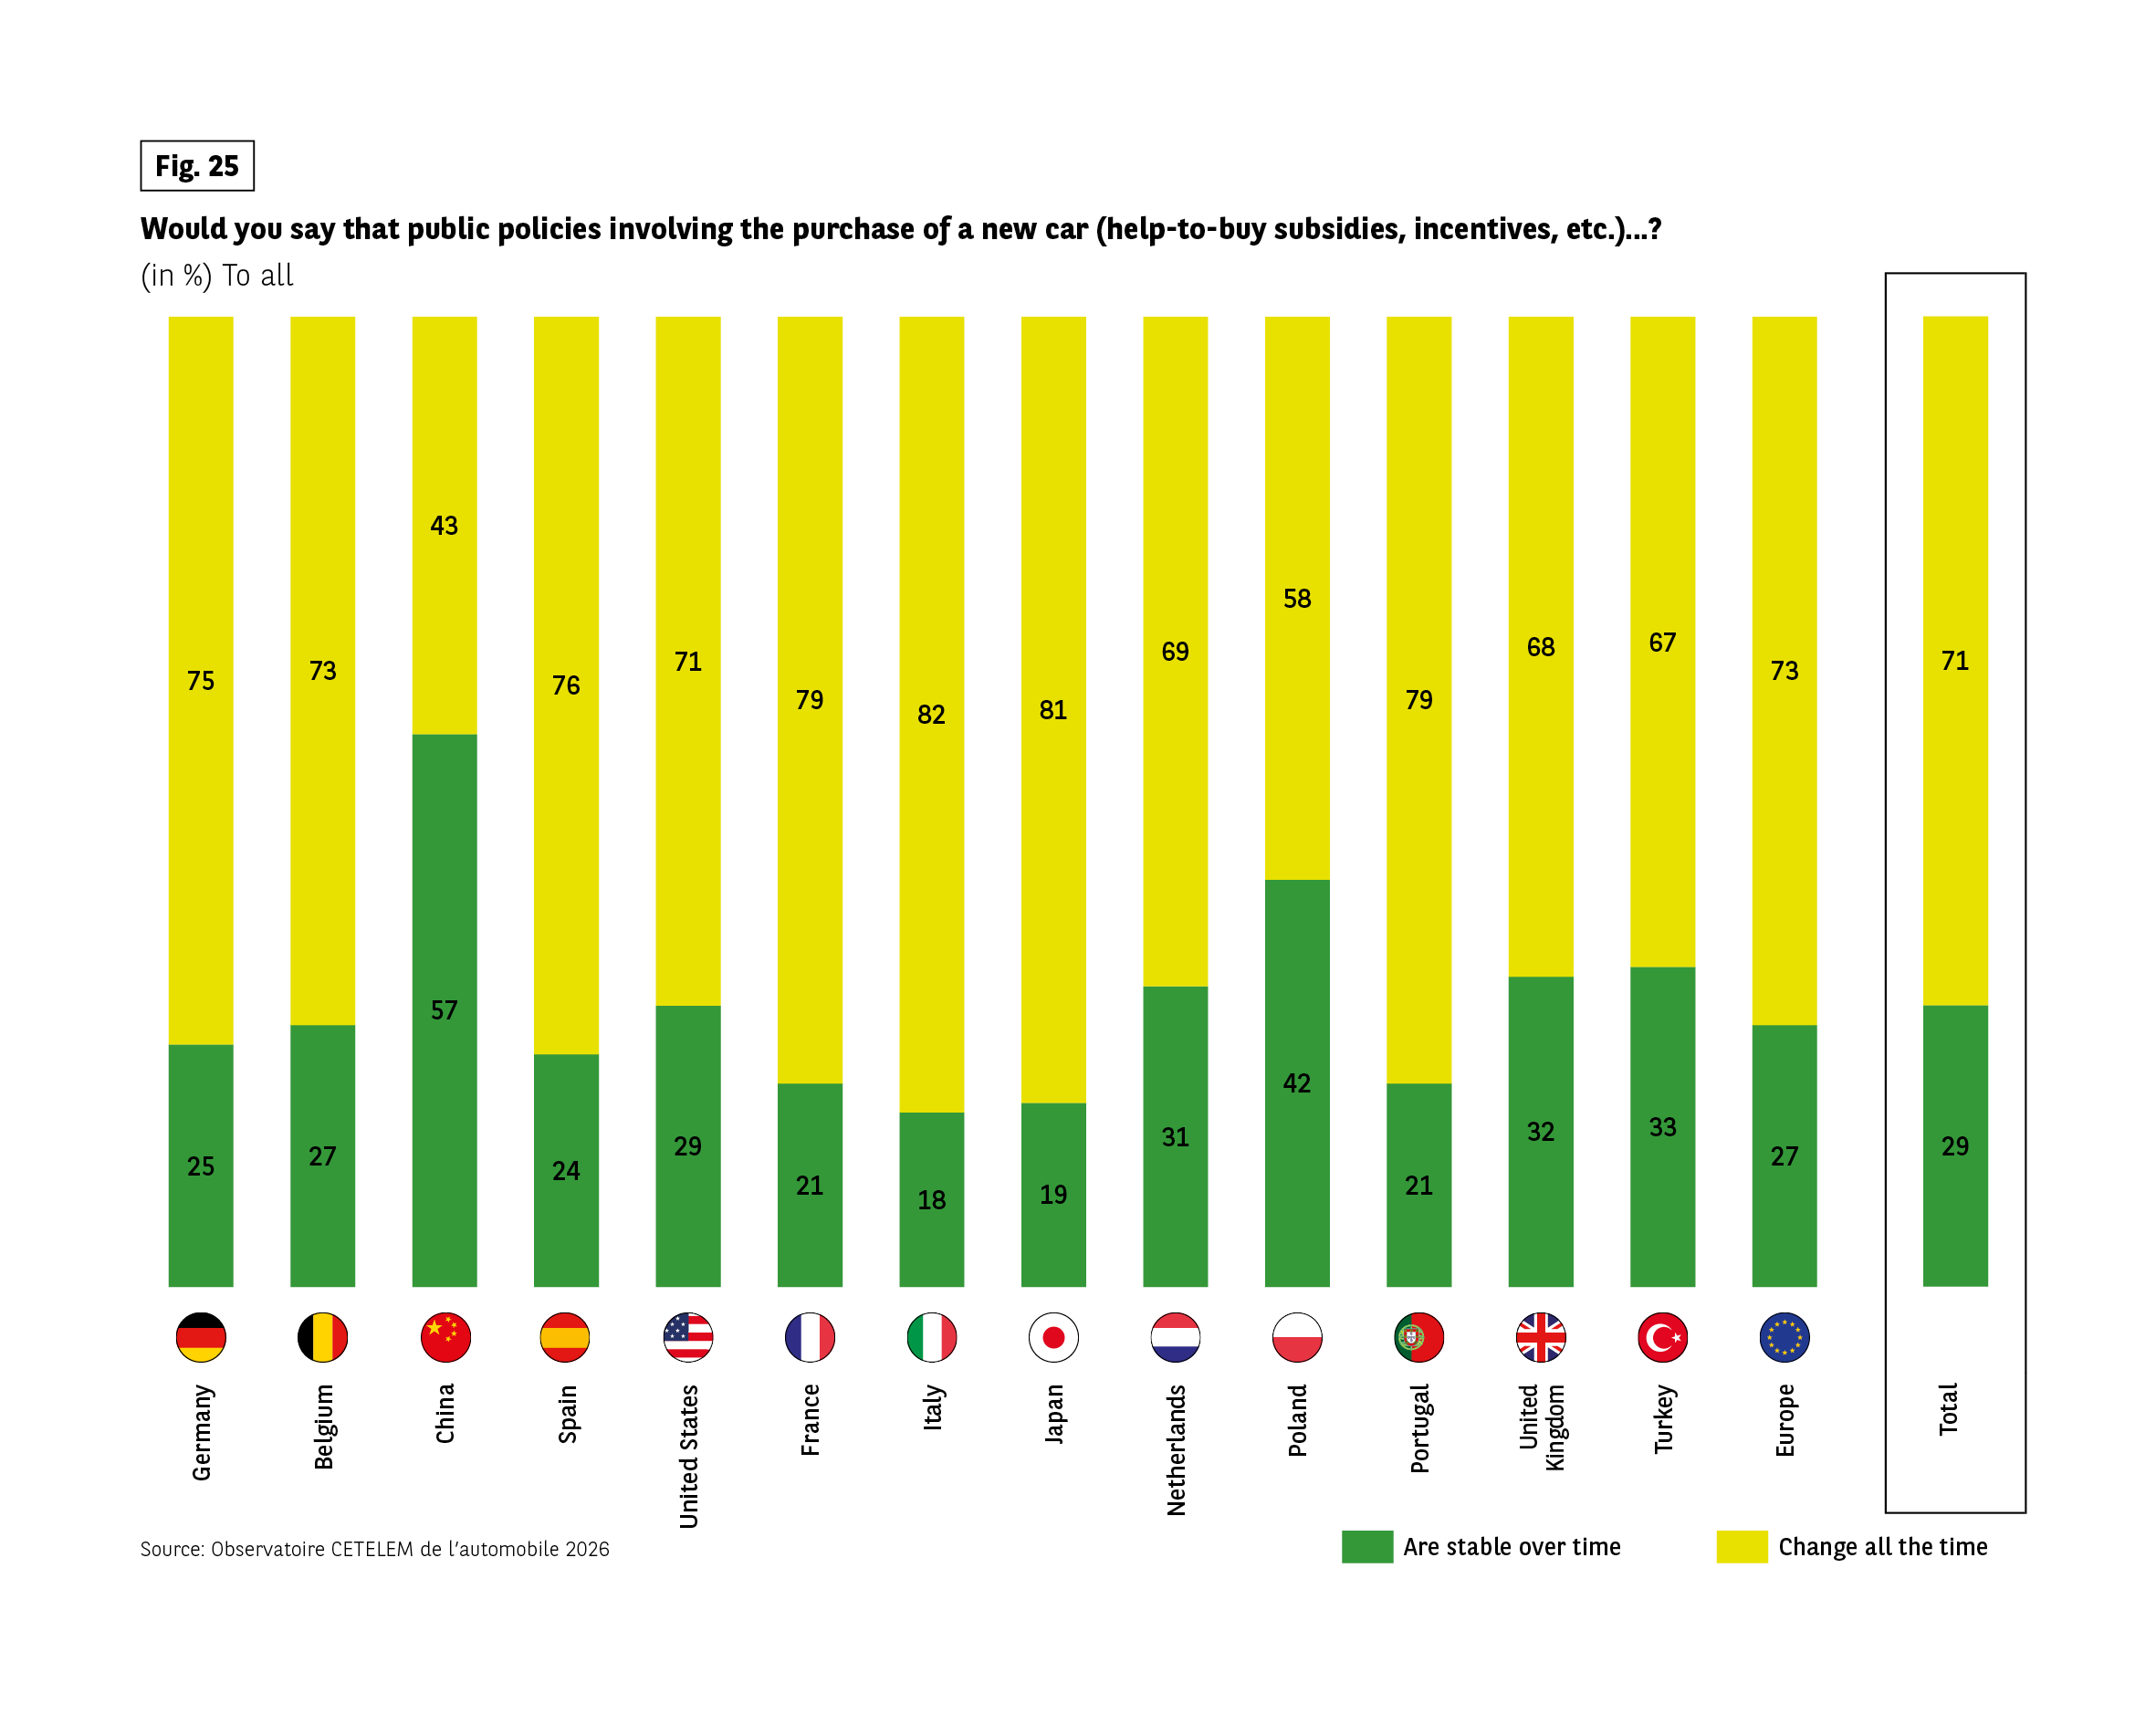 The stacked bar chart shows the share of respondents who believe public policies on buying a new car are stable over time or change all the time.
Stable vs changing all the time:
Germany: 25% stable, 75% changing
Belgium: 27% stable, 73% changing
China: 57% stable, 43% changing
Spain: 24% stable, 76% changing
United States: 29% stable, 71% changing
France: 21% stable, 79% changing
Italy: 18% stable, 82% changing
Japan: 19% stable, 81% changing
Netherlands: 31% stable, 69% changing
Poland: 42% stable, 58% changing
Portugal: 21% stable, 79% changing
United Kingdom: 32% stable, 68% changing
Turkey: 33% stable, 67% changing
Europe: 27% stable, 73% changing
Total: 29% stable, 71% changing
Source: Observatoire Cetelem de l’Automobile 2026.
The stacked bar chart shows the share of respondents who believe public policies on buying a new car are stable over time or change all the time.
Stable vs changing all the time:
Germany: 25% stable, 75% changing
Belgium: 27% stable, 73% changing
China: 57% stable, 43% changing
Spain: 24% stable, 76% changing
United States: 29% stable, 71% changing
France: 21% stable, 79% changing
Italy: 18% stable, 82% changing
Japan: 19% stable, 81% changing
Netherlands: 31% stable, 69% changing
Poland: 42% stable, 58% changing
Portugal: 21% stable, 79% changing
United Kingdom: 32% stable, 68% changing
Turkey: 33% stable, 67% changing
Europe: 27% stable, 73% changing
Total: 29% stable, 71% changing
Source: Observatoire Cetelem de l’Automobile 2026.