Price


Faced with a car market that is going through a crisis of varying intensity, measures are expected and a revival is hoped for. By listening to motorists and gathering their opinions in a number of countries that account for most of the world’s car production and sales, L’Observatoire Cetelem has identified five levers capable of revitalising the market. These five areas should be the focus for more effective action.
Boosting growth by offering cheaper cars
We have already seen the importance attached to the price of cars, with their ever-increasing cost being denounced in all countries except China. It’s hardly surprising that lowering vehicle prices is the first lever identified. Making cheaper and simpler cars is a priority for 1 in 2 people in order to revive the market. (Fig. 26).
This opinion is most strongly expressed in France, while it is less popular in Turkey, China and Germany, the home of expensive saloon cars and SUVs. Seniors are very sensitive to this issue, as are people on modest and median incomes, and people living in rural areas.
Fig 26 – Priority to revive the new car market through cheaper and simpler cars
Download this infographic for your presentations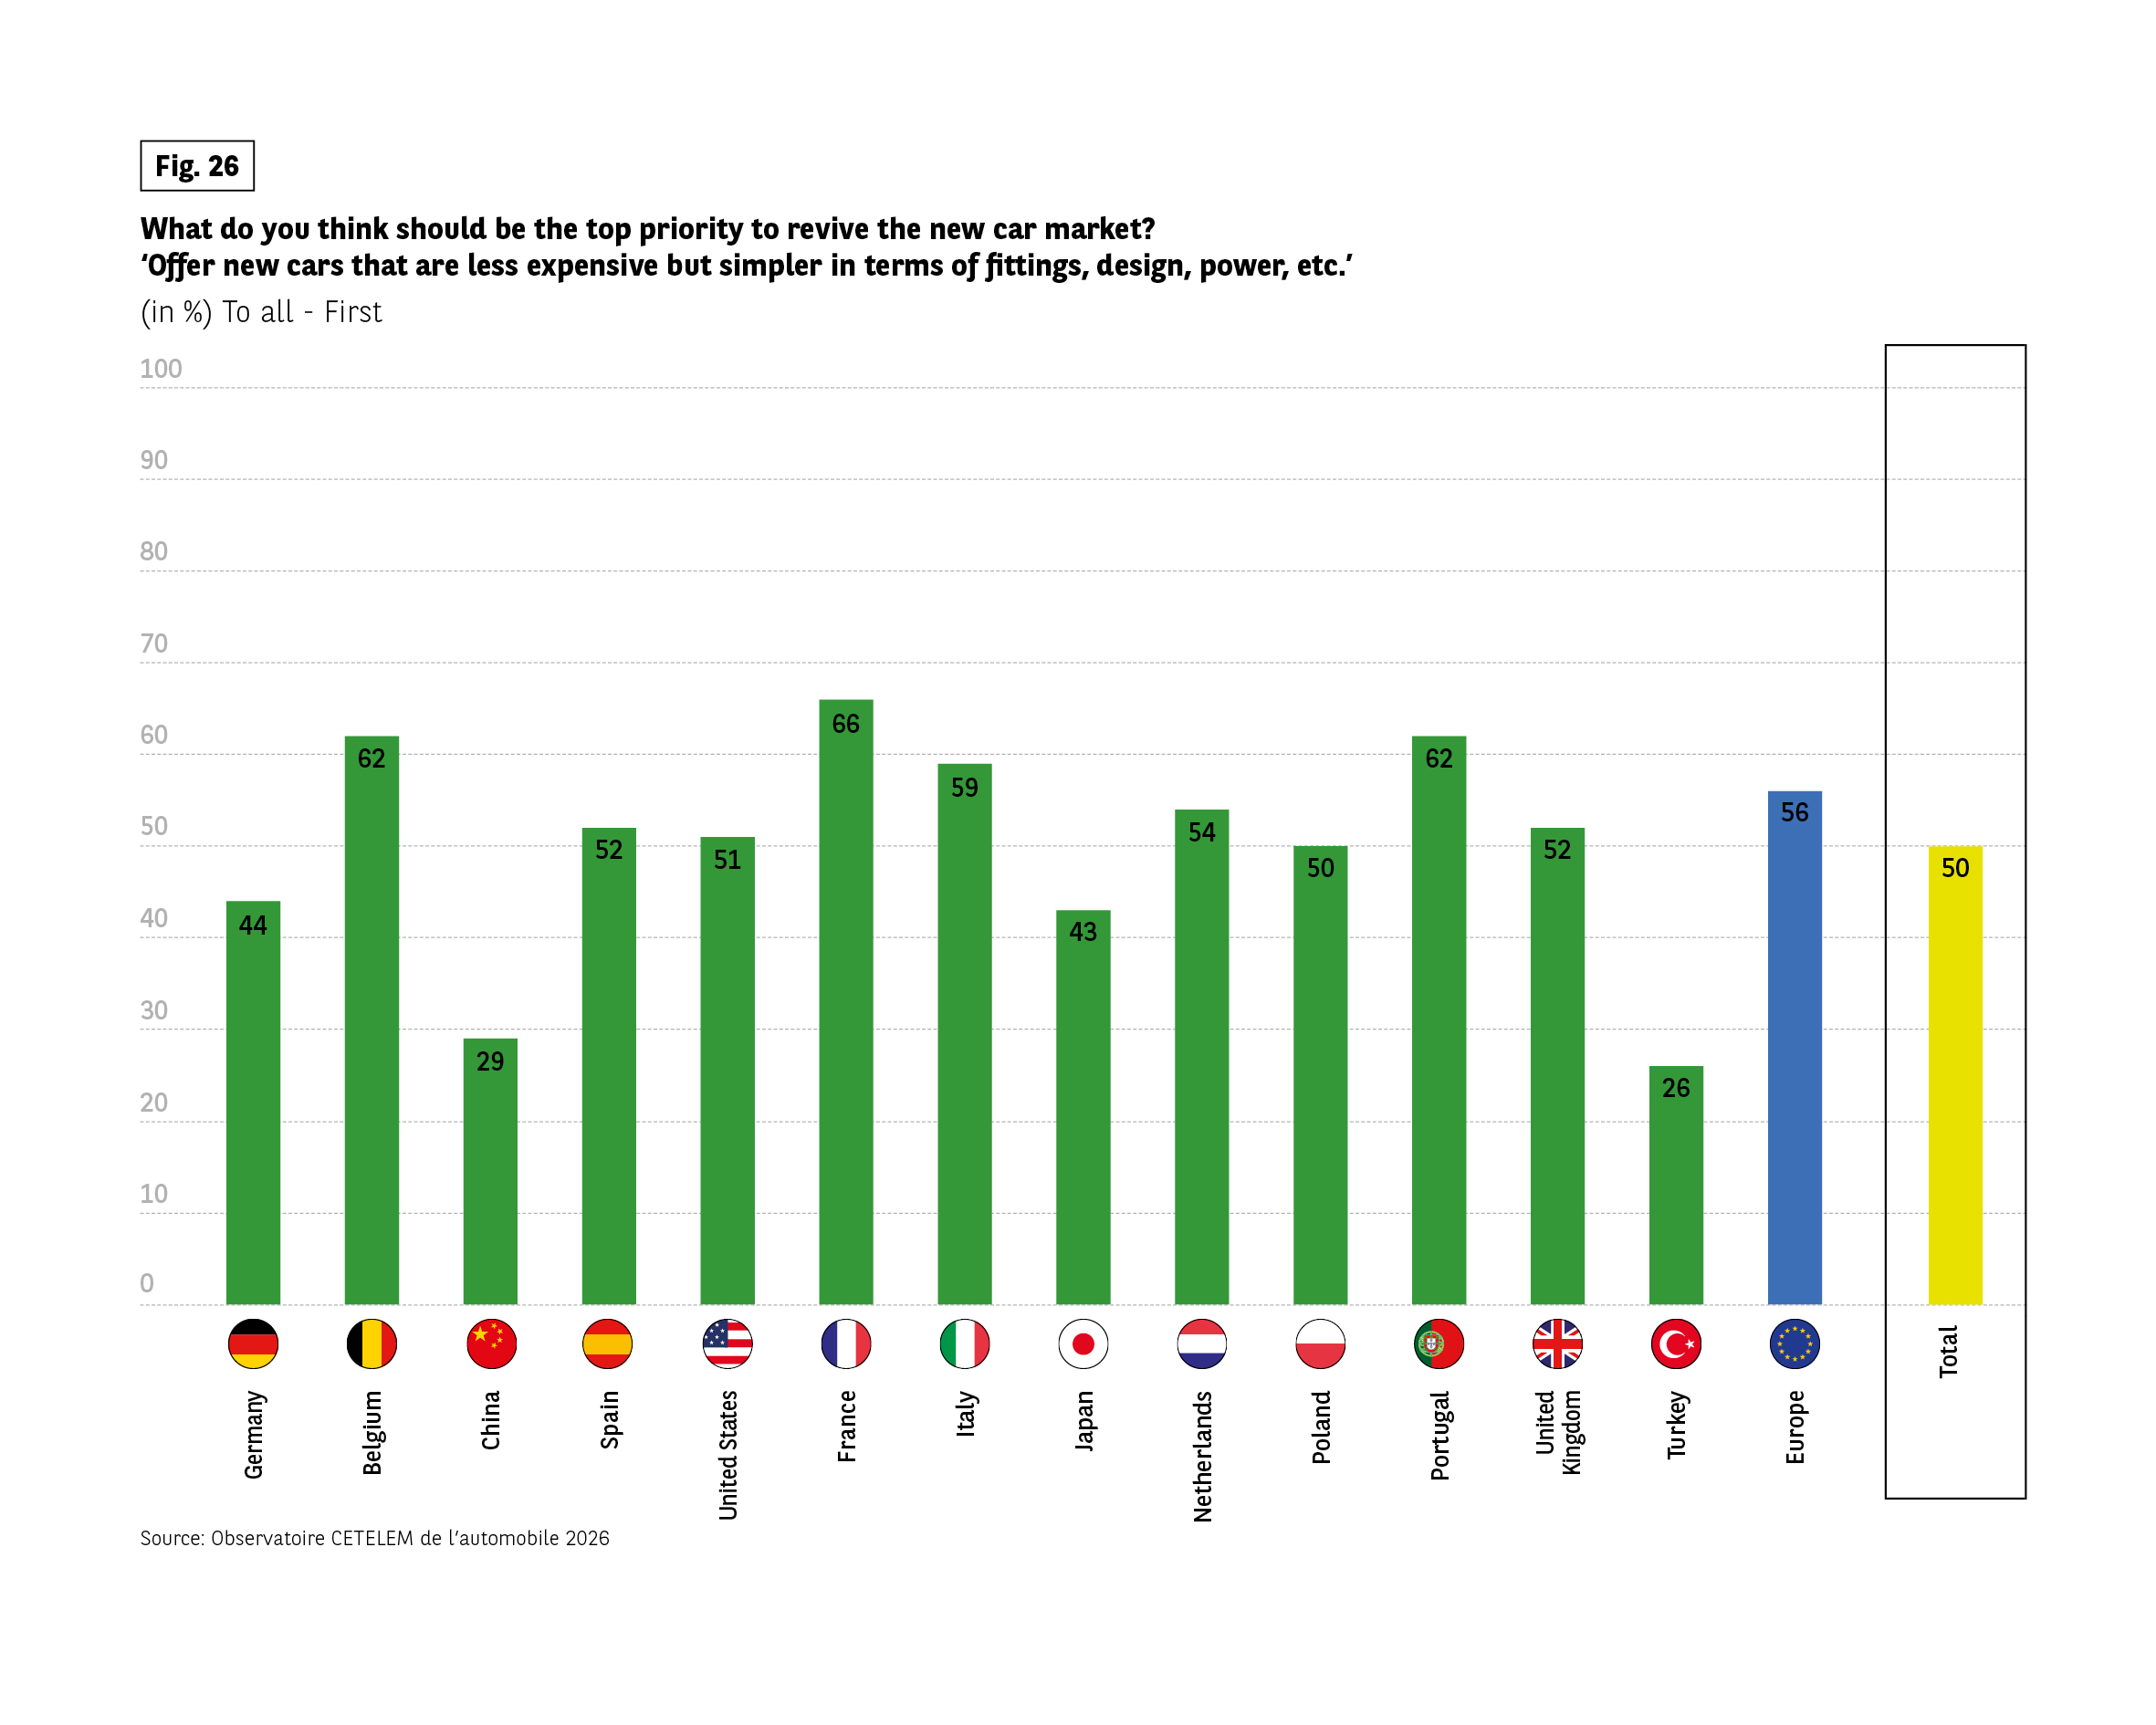 The bar chart shows the percentage of respondents who rank “offering new cars that are less expensive but simpler” as the top priority.
Germany: 44%
Belgium: 62%
China: 29%
Spain: 52%
United States: 51%
France: 66%
Italy: 59%
Japan: 43%
Netherlands: 54%
Poland: 50%
Portugal: 62%
United Kingdom: 52%
Turkey: 26%
Europe: 56%
Total: 50%
Source: Observatoire Cetelem de l’Automobile 2026.
The bar chart shows the percentage of respondents who rank “offering new cars that are less expensive but simpler” as the top priority.
Germany: 44%
Belgium: 62%
China: 29%
Spain: 52%
United States: 51%
France: 66%
Italy: 59%
Japan: 43%
Netherlands: 54%
Poland: 50%
Portugal: 62%
United Kingdom: 52%
Turkey: 26%
Europe: 56%
Total: 50%
Source: Observatoire Cetelem de l’Automobile 2026.
Lowering purchase and maintenance costs
This focus on price is also expressed through people’s appreciation of a cost of purchase that is compatible with their budget, as well as to limited maintenance costs. Only safety comes between these two aspects in the ranking of purchasing criteria.
Except in Japan, China and Poland, price always comes out on top. Seniors and people living in rural areas are the most sensitive to this factor. Particular attention is paid to maintenance costs in Poland, the Netherlands and the United Kingdom. This criterion is not given much prominence in China, where the electrification of vehicles generates lower costs
Fig 27 – Main buying criteria for a new car
Download this infographic for your presentations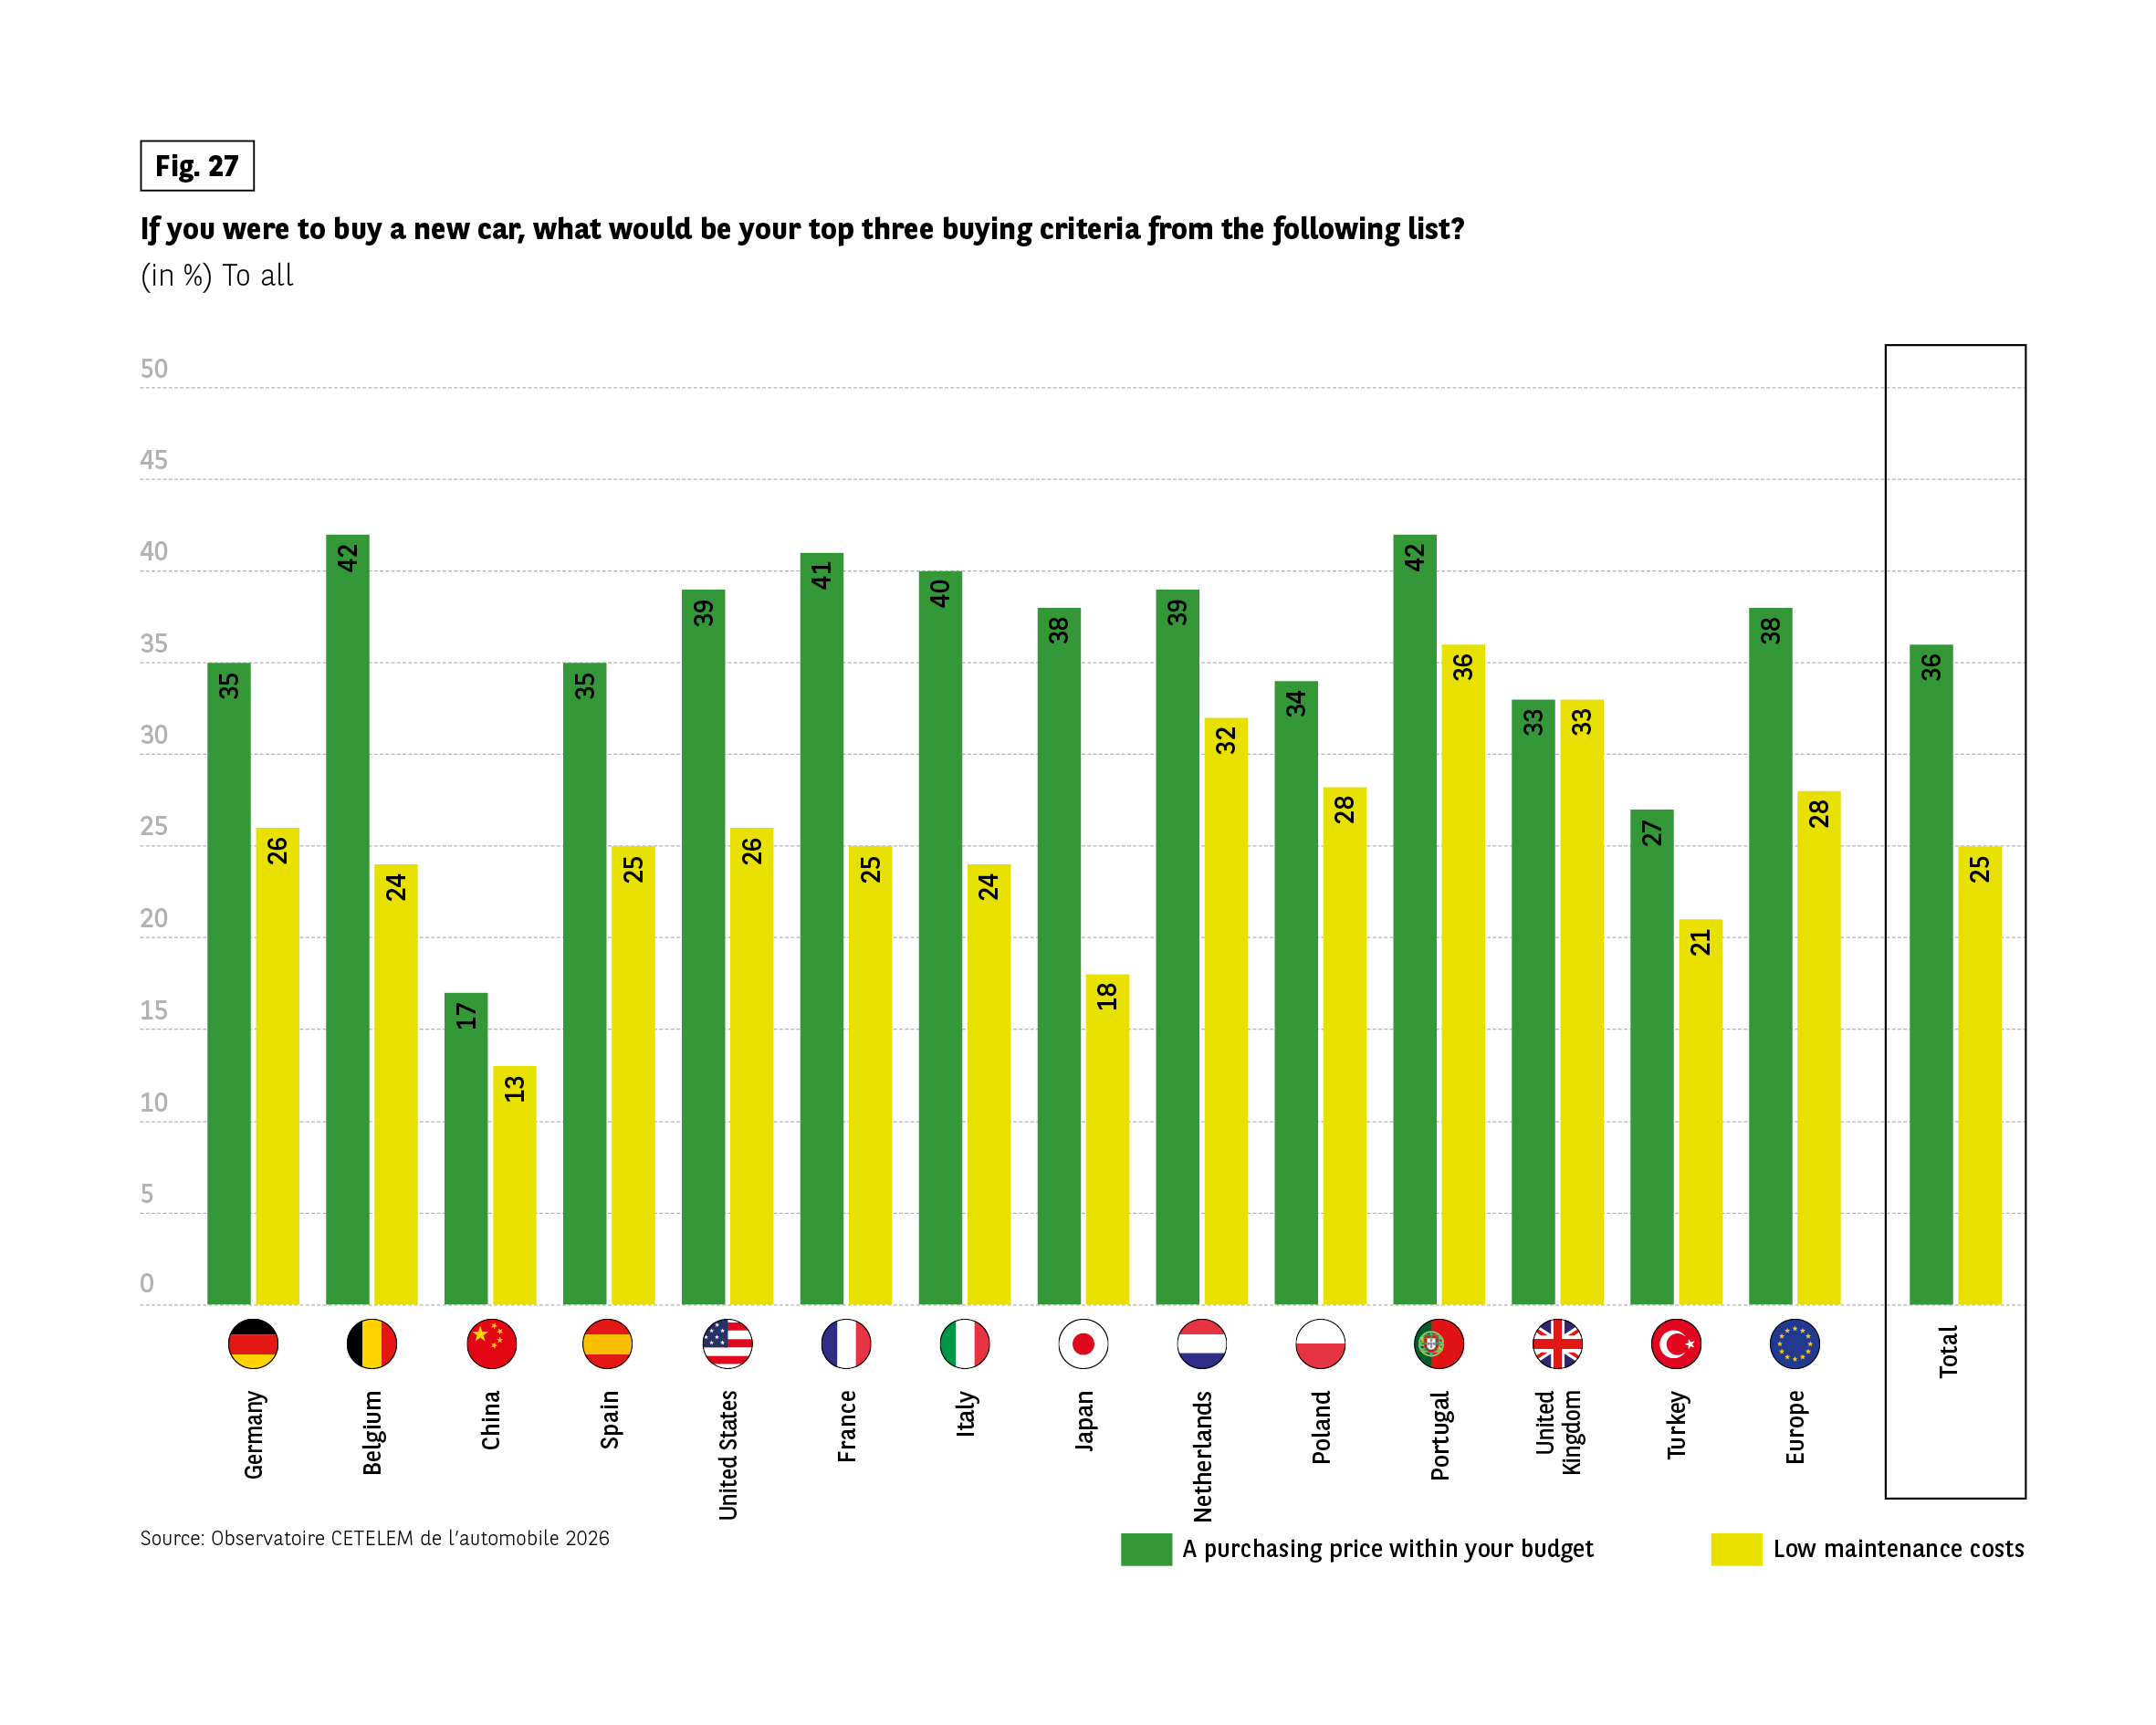 The chart shows the share of respondents who cite purchase price within budget and low maintenance costs among their top three buying criteria.
Purchase price within budget vs low maintenance costs:
Germany: 35% vs 26%
Belgium: 42% vs 24%
China: 17% vs 13%
Spain: 35% vs 25%
United States: 39% vs 26%
France: 41% vs 25%
Italy: 40% vs 24%
Japan: 38% vs 18%
Netherlands: 39% vs 32%
Poland: 34% vs 28%
Portugal: 42% vs 36%
United Kingdom: 33% vs 33%
Turkey: 27% vs 21%
Europe: 38% vs 28%
Total: 36% vs 25%
Source: Observatoire Cetelem de l’Automobile 2026.
The chart shows the share of respondents who cite purchase price within budget and low maintenance costs among their top three buying criteria.
Purchase price within budget vs low maintenance costs:
Germany: 35% vs 26%
Belgium: 42% vs 24%
China: 17% vs 13%
Spain: 35% vs 25%
United States: 39% vs 26%
France: 41% vs 25%
Italy: 40% vs 24%
Japan: 38% vs 18%
Netherlands: 39% vs 32%
Poland: 34% vs 28%
Portugal: 42% vs 36%
United Kingdom: 33% vs 33%
Turkey: 27% vs 21%
Europe: 38% vs 28%
Total: 36% vs 25%
Source: Observatoire Cetelem de l’Automobile 2026.
Lowering margins
So how do you bring down car prices to boost the market? In the eyes of three-quarters of motorists, this means lowering manufacturers’ margins.
Fig 28 – Cutting manufacturers’ margins to reduce new car prices
Download this infographic for your presentations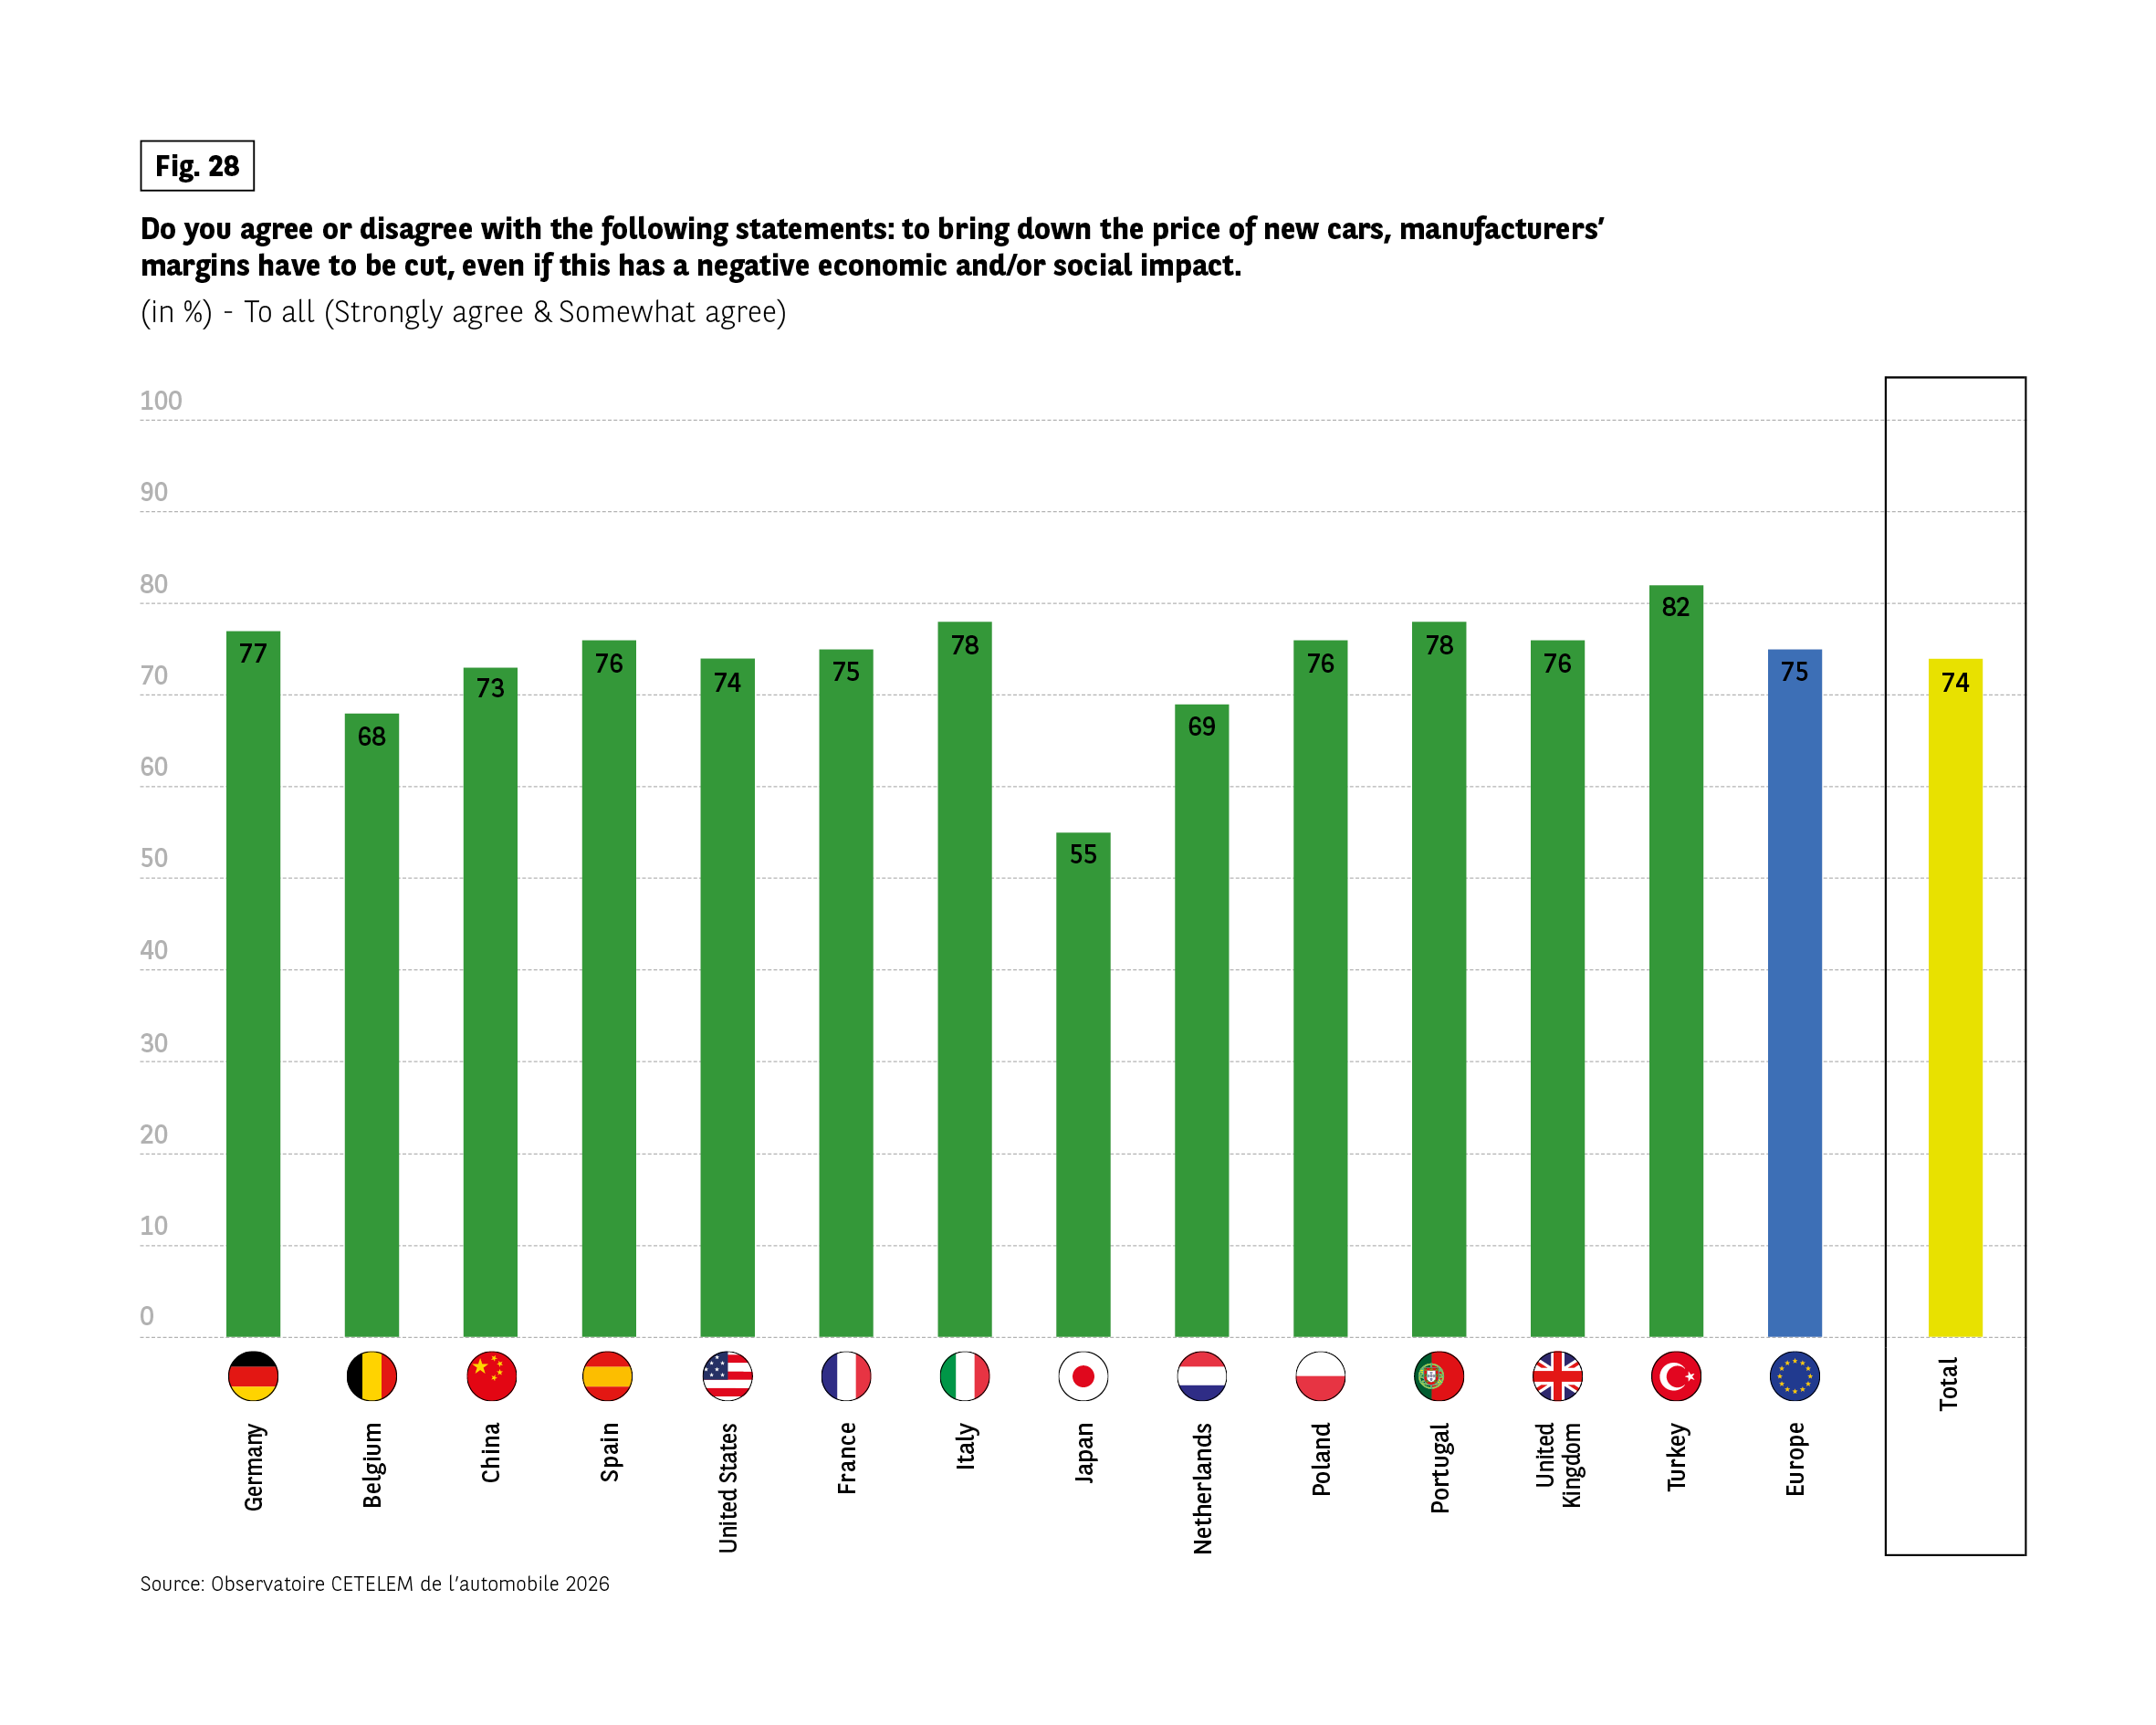 The bar chart shows the percentage of respondents who agree that manufacturers’ margins should be cut to reduce new car prices, even if this has a negative economic or social impact.
Germany: 77%
Belgium: 68%
China: 73%
Spain: 76%
United States: 74%
France: 75%
Italy: 78%
Japan: 55%
Netherlands: 69%
Poland: 76%
Portugal: 78%
United Kingdom: 76%
Turkey: 82%
Europe: 75%
Total: 74%
Source: Observatoire Cetelem de l’Automobile 2026.
The bar chart shows the percentage of respondents who agree that manufacturers’ margins should be cut to reduce new car prices, even if this has a negative economic or social impact.
Germany: 77%
Belgium: 68%
China: 73%
Spain: 76%
United States: 74%
France: 75%
Italy: 78%
Japan: 55%
Netherlands: 69%
Poland: 76%
Portugal: 78%
United Kingdom: 76%
Turkey: 82%
Europe: 75%
Total: 74%
Source: Observatoire Cetelem de l’Automobile 2026.
This opinion is shared in all countries except Japan (55%). It’s also worth noting that there is no clear-cut position according to income or geographical location. Only senior citizens are slightly more in agreement than younger people.
Fig 29 – EBIT results by car manufacturer location
Download this infographic for your presentations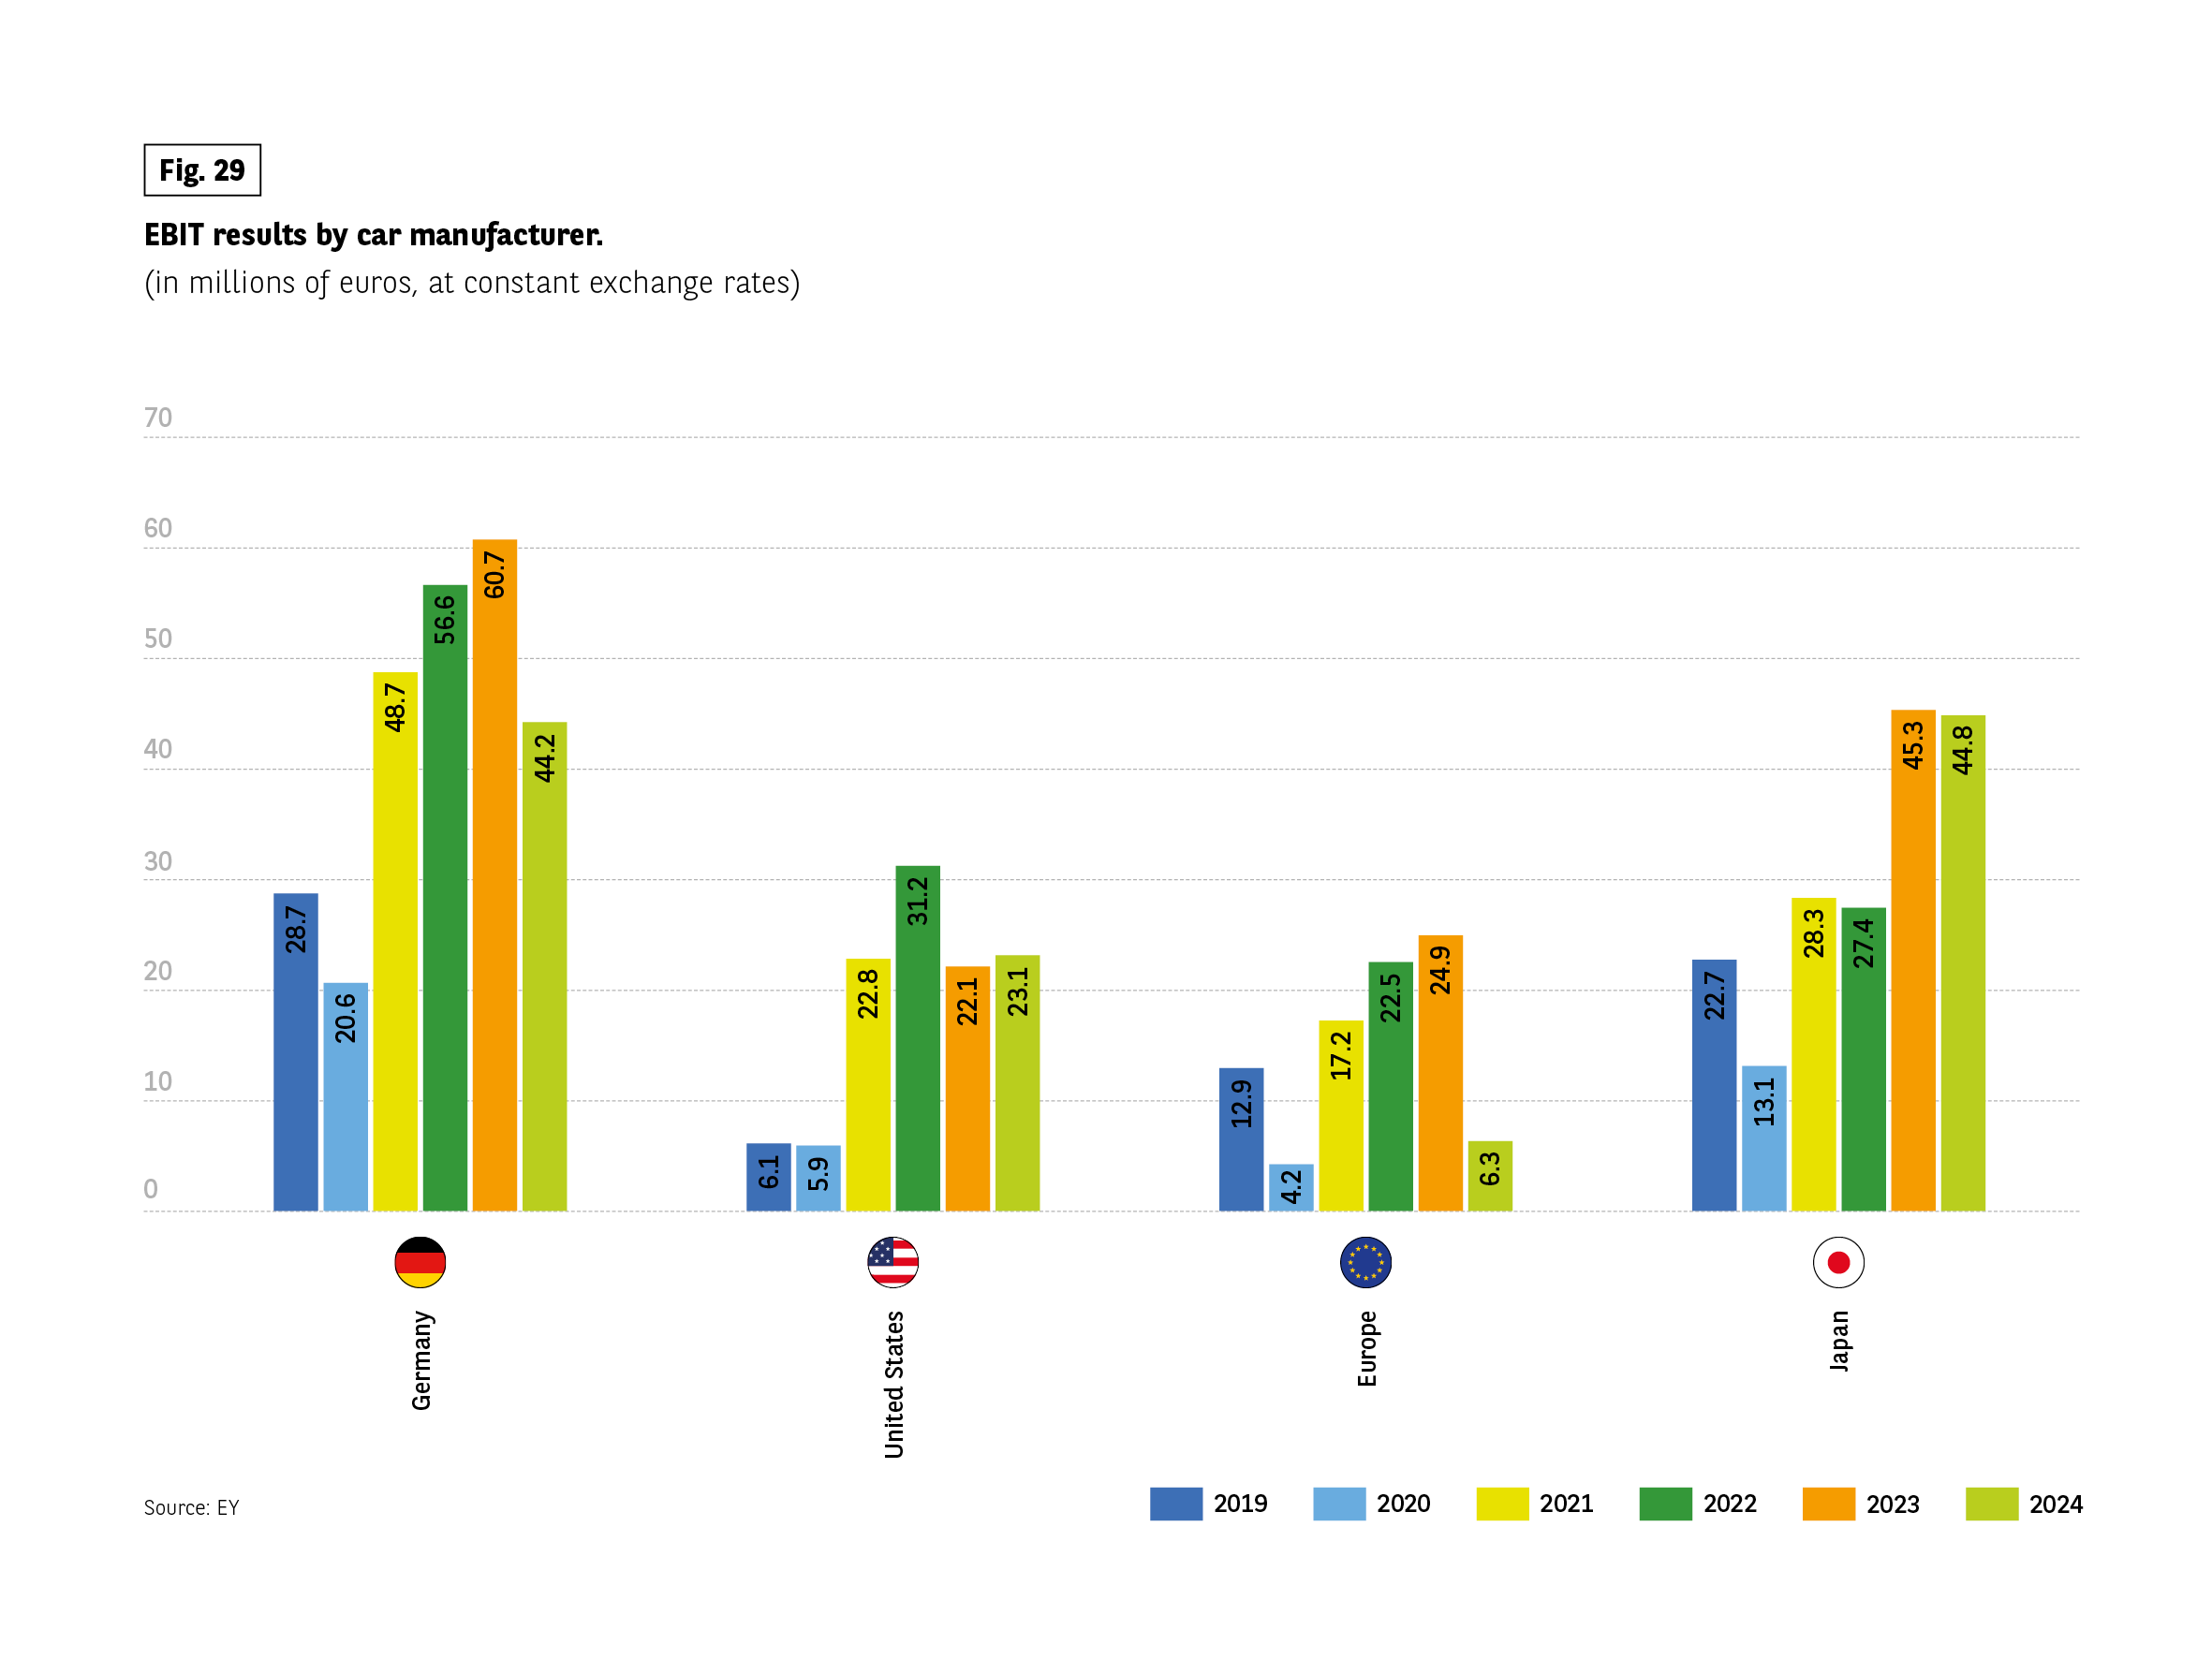 The grouped bar chart shows EBIT results in millions of euros at constant exchange rates.
Germany:
2019: 28.7, 2020: 20.6, 2021: 48.7, 2022: 56.6, 2023: 60.7, 2024: 44.2
United States:
2019: 6.1, 2020: 5.9, 2021: 22.8, 2022: 31.2, 2023: 22.1, 2024: 23.1
Europe:
2019: 12.9, 2020: 4.2, 2021: 17.2, 2022: 22.5, 2023: 24.9, 2024: 6.3
Japan:
2019: 22.7, 2020: 13.1, 2021: 28.3, 2022: 27.4, 2023: 45.3, 2024: 44.8
Source: EY.
The grouped bar chart shows EBIT results in millions of euros at constant exchange rates.
Germany:
2019: 28.7, 2020: 20.6, 2021: 48.7, 2022: 56.6, 2023: 60.7, 2024: 44.2
United States:
2019: 6.1, 2020: 5.9, 2021: 22.8, 2022: 31.2, 2023: 22.1, 2024: 23.1
Europe:
2019: 12.9, 2020: 4.2, 2021: 17.2, 2022: 22.5, 2023: 24.9, 2024: 6.3
Japan:
2019: 22.7, 2020: 13.1, 2021: 28.3, 2022: 27.4, 2023: 45.3, 2024: 44.8
Source: EY.
Manufacturing where it’s cheaper
Another solution to lowering car prices is to manufacture them in countries where labour is cheaper, even if this has a negative social or environmental impact. 6 out of 10 people support this idea. On this topic, China, Turkey and, to a lesser extent, Poland stand out as being particularly favourable. These are the three countries in this study where labour costs are the most affordable. Japan is the most committed to national production with only 42%, the only score below the average.
With an equal percentage for and against, the Germans, Italians and French were unable to make up their minds. Young people are by far more favourable to the idea than their elders, as are residents of large cities compared with those in rural areas. (Fig. 30).
This measure could have a negative economic impact on Europe’s pro-consumer bet. Producing cheaply elsewhere means job losses, so less income and less purchasing power.
Fig 30 – Prioritising car production in low-cost countries to reduce prices
Download this infographic for your presentations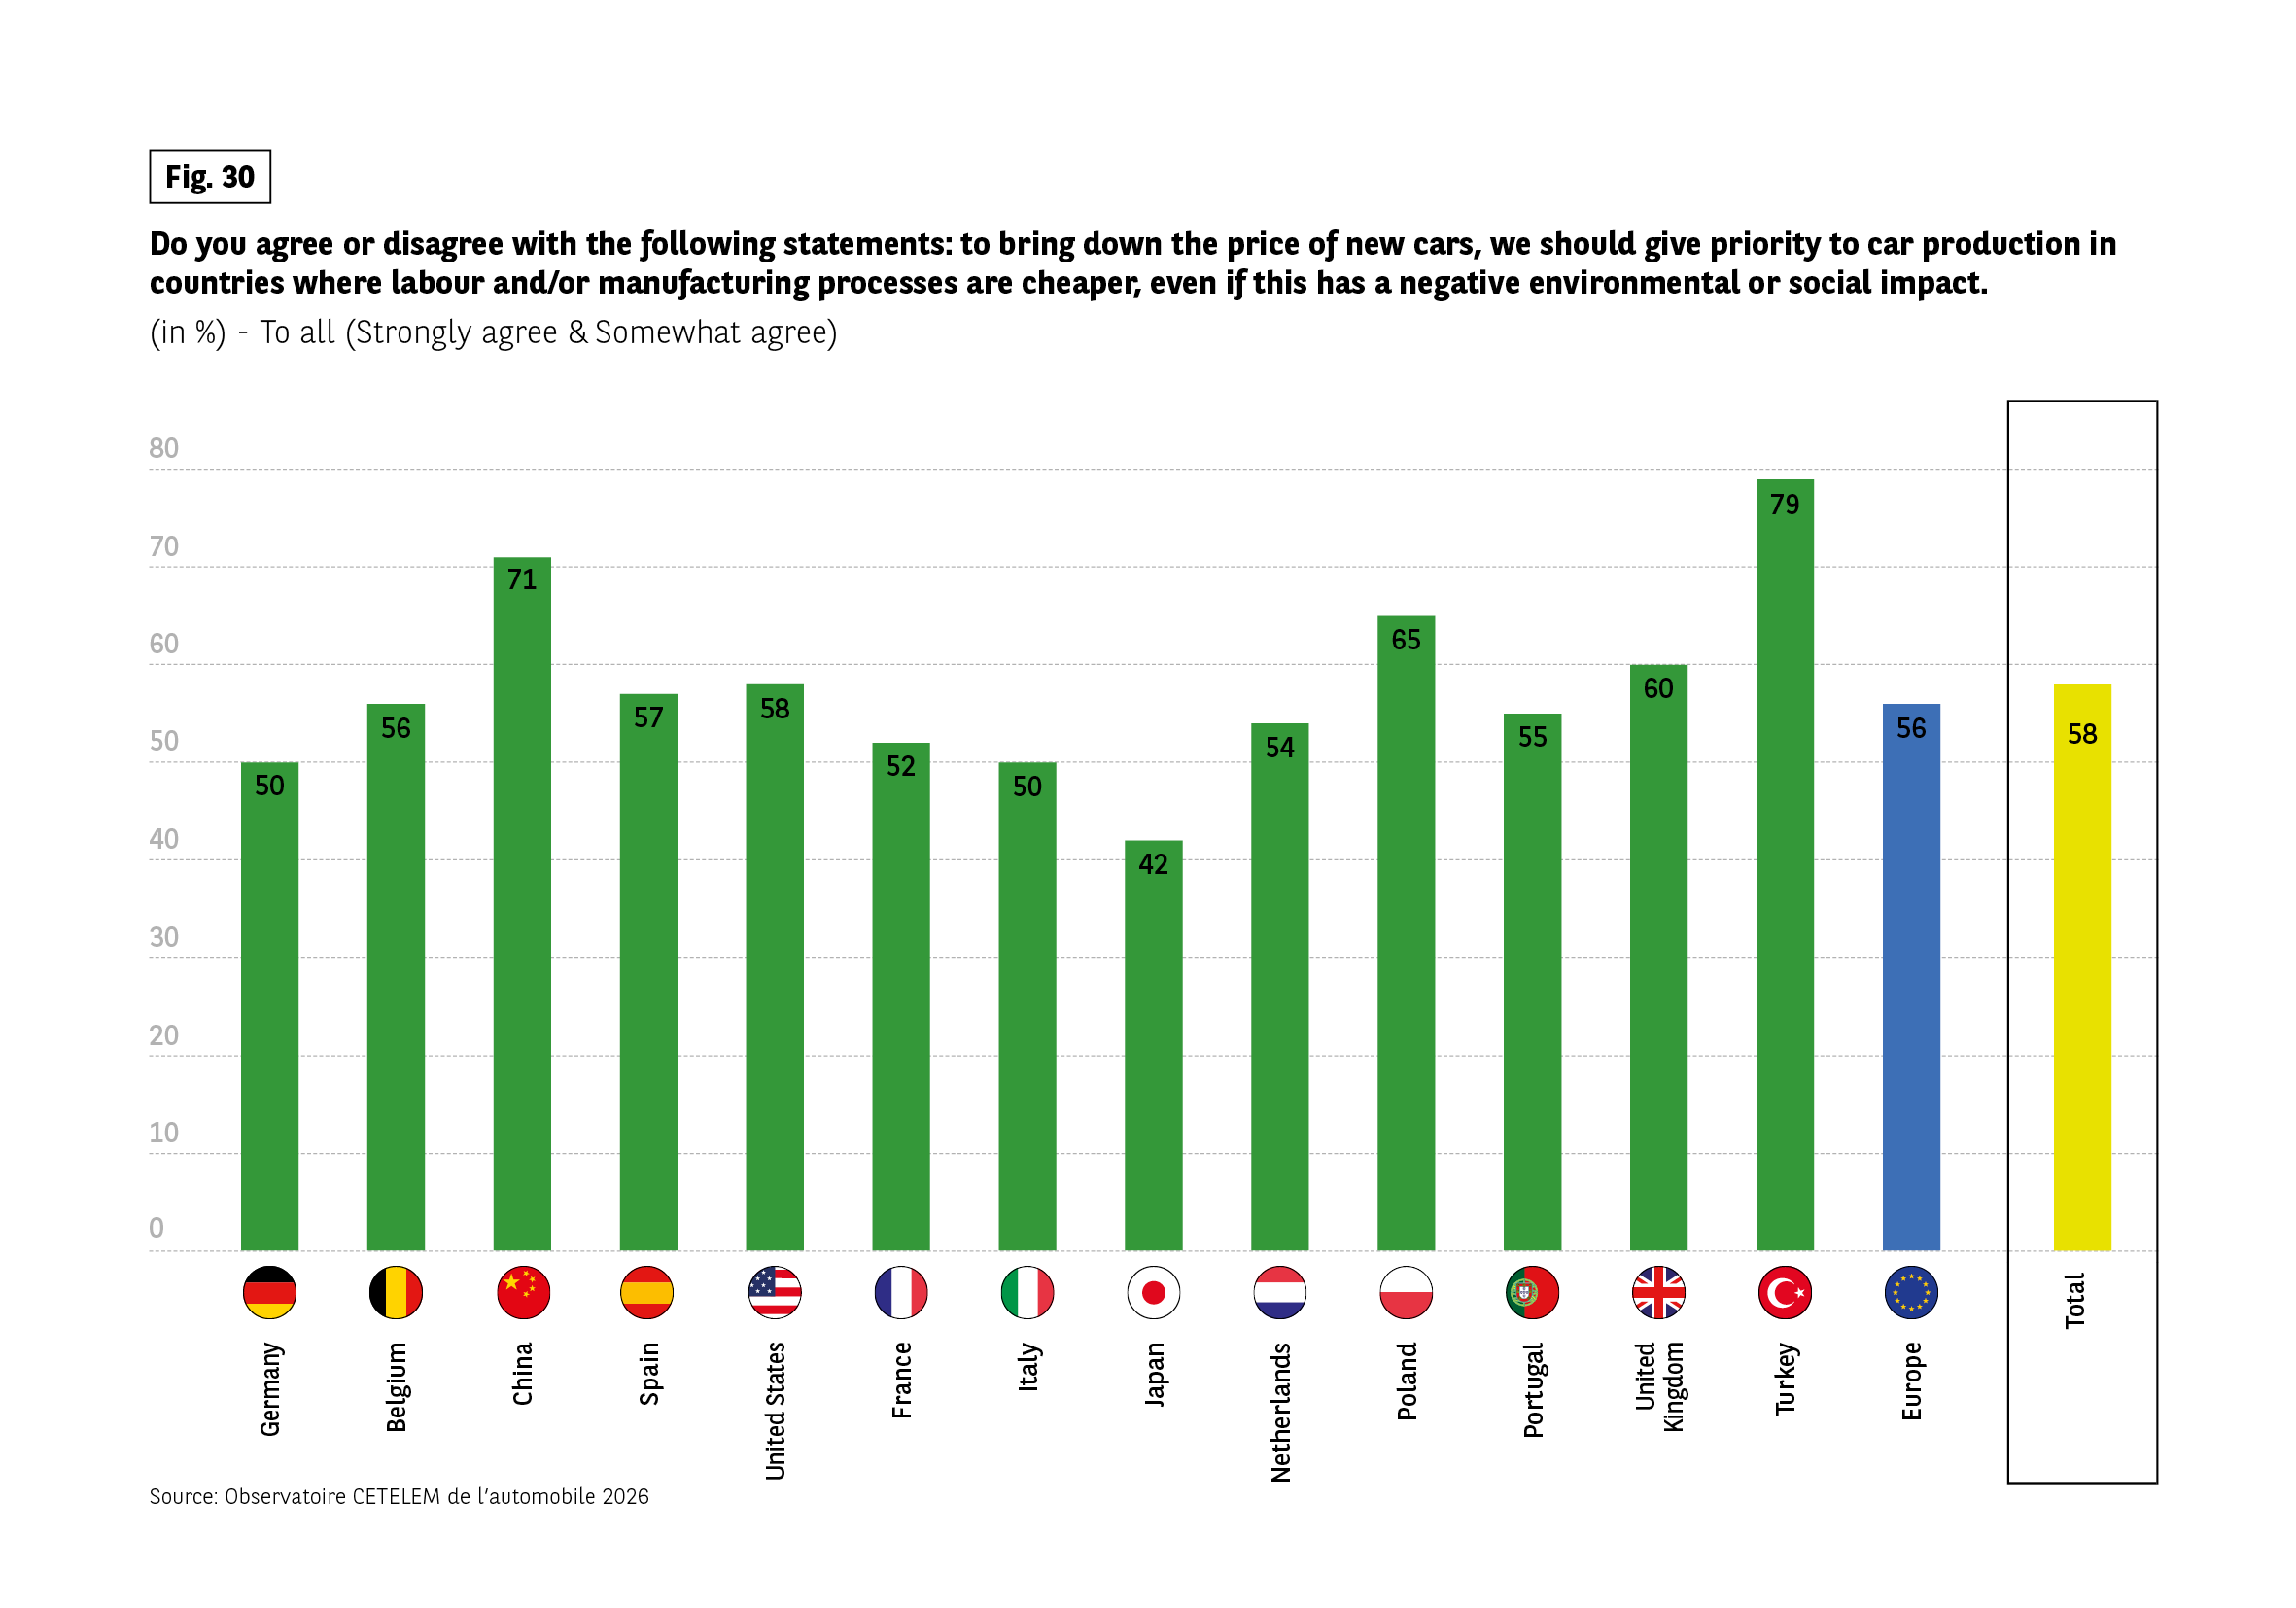 The bar chart shows the percentage of respondents who agree that to reduce new car prices, production should be prioritised in countries with cheaper labour or manufacturing processes, even if this has negative environmental or social impacts.
Germany: 50%
Belgium: 56%
China: 71%
Spain: 57%
United States: 58%
France: 52%
Italy: 50%
Japan: 42%
Netherlands: 54%
Poland: 65%
Portugal: 55%
United Kingdom: 60%
Turkey: 79%
Europe: 56%
Total: 58%
Source: Observatoire Cetelem de l’Automobile 2026.
The bar chart shows the percentage of respondents who agree that to reduce new car prices, production should be prioritised in countries with cheaper labour or manufacturing processes, even if this has negative environmental or social impacts.
Germany: 50%
Belgium: 56%
China: 71%
Spain: 57%
United States: 58%
France: 52%
Italy: 50%
Japan: 42%
Netherlands: 54%
Poland: 65%
Portugal: 55%
United Kingdom: 60%
Turkey: 79%
Europe: 56%
Total: 58%
Source: Observatoire Cetelem de l’Automobile 2026.