Retail

Appreciation for dealers…
This may seem like a tautology, but this new study by L’Observatoire Cetelem shows that if car sales are to be revived, those who sell them have an eminent role to play. To achieve this, they can rely on their positive image, as can manufacturers.
Car dealers are appreciated in all countries, in relatively equal measure, by 7 out of 10 people on average, with a high point as always in China, and to a lesser degree in Spain and Turkey. Respondents’ social and geographical origin, as well as their age, did not bring out any significant differences.
Fig 45 – Public image of car dealerships
Download this infographic for your presentations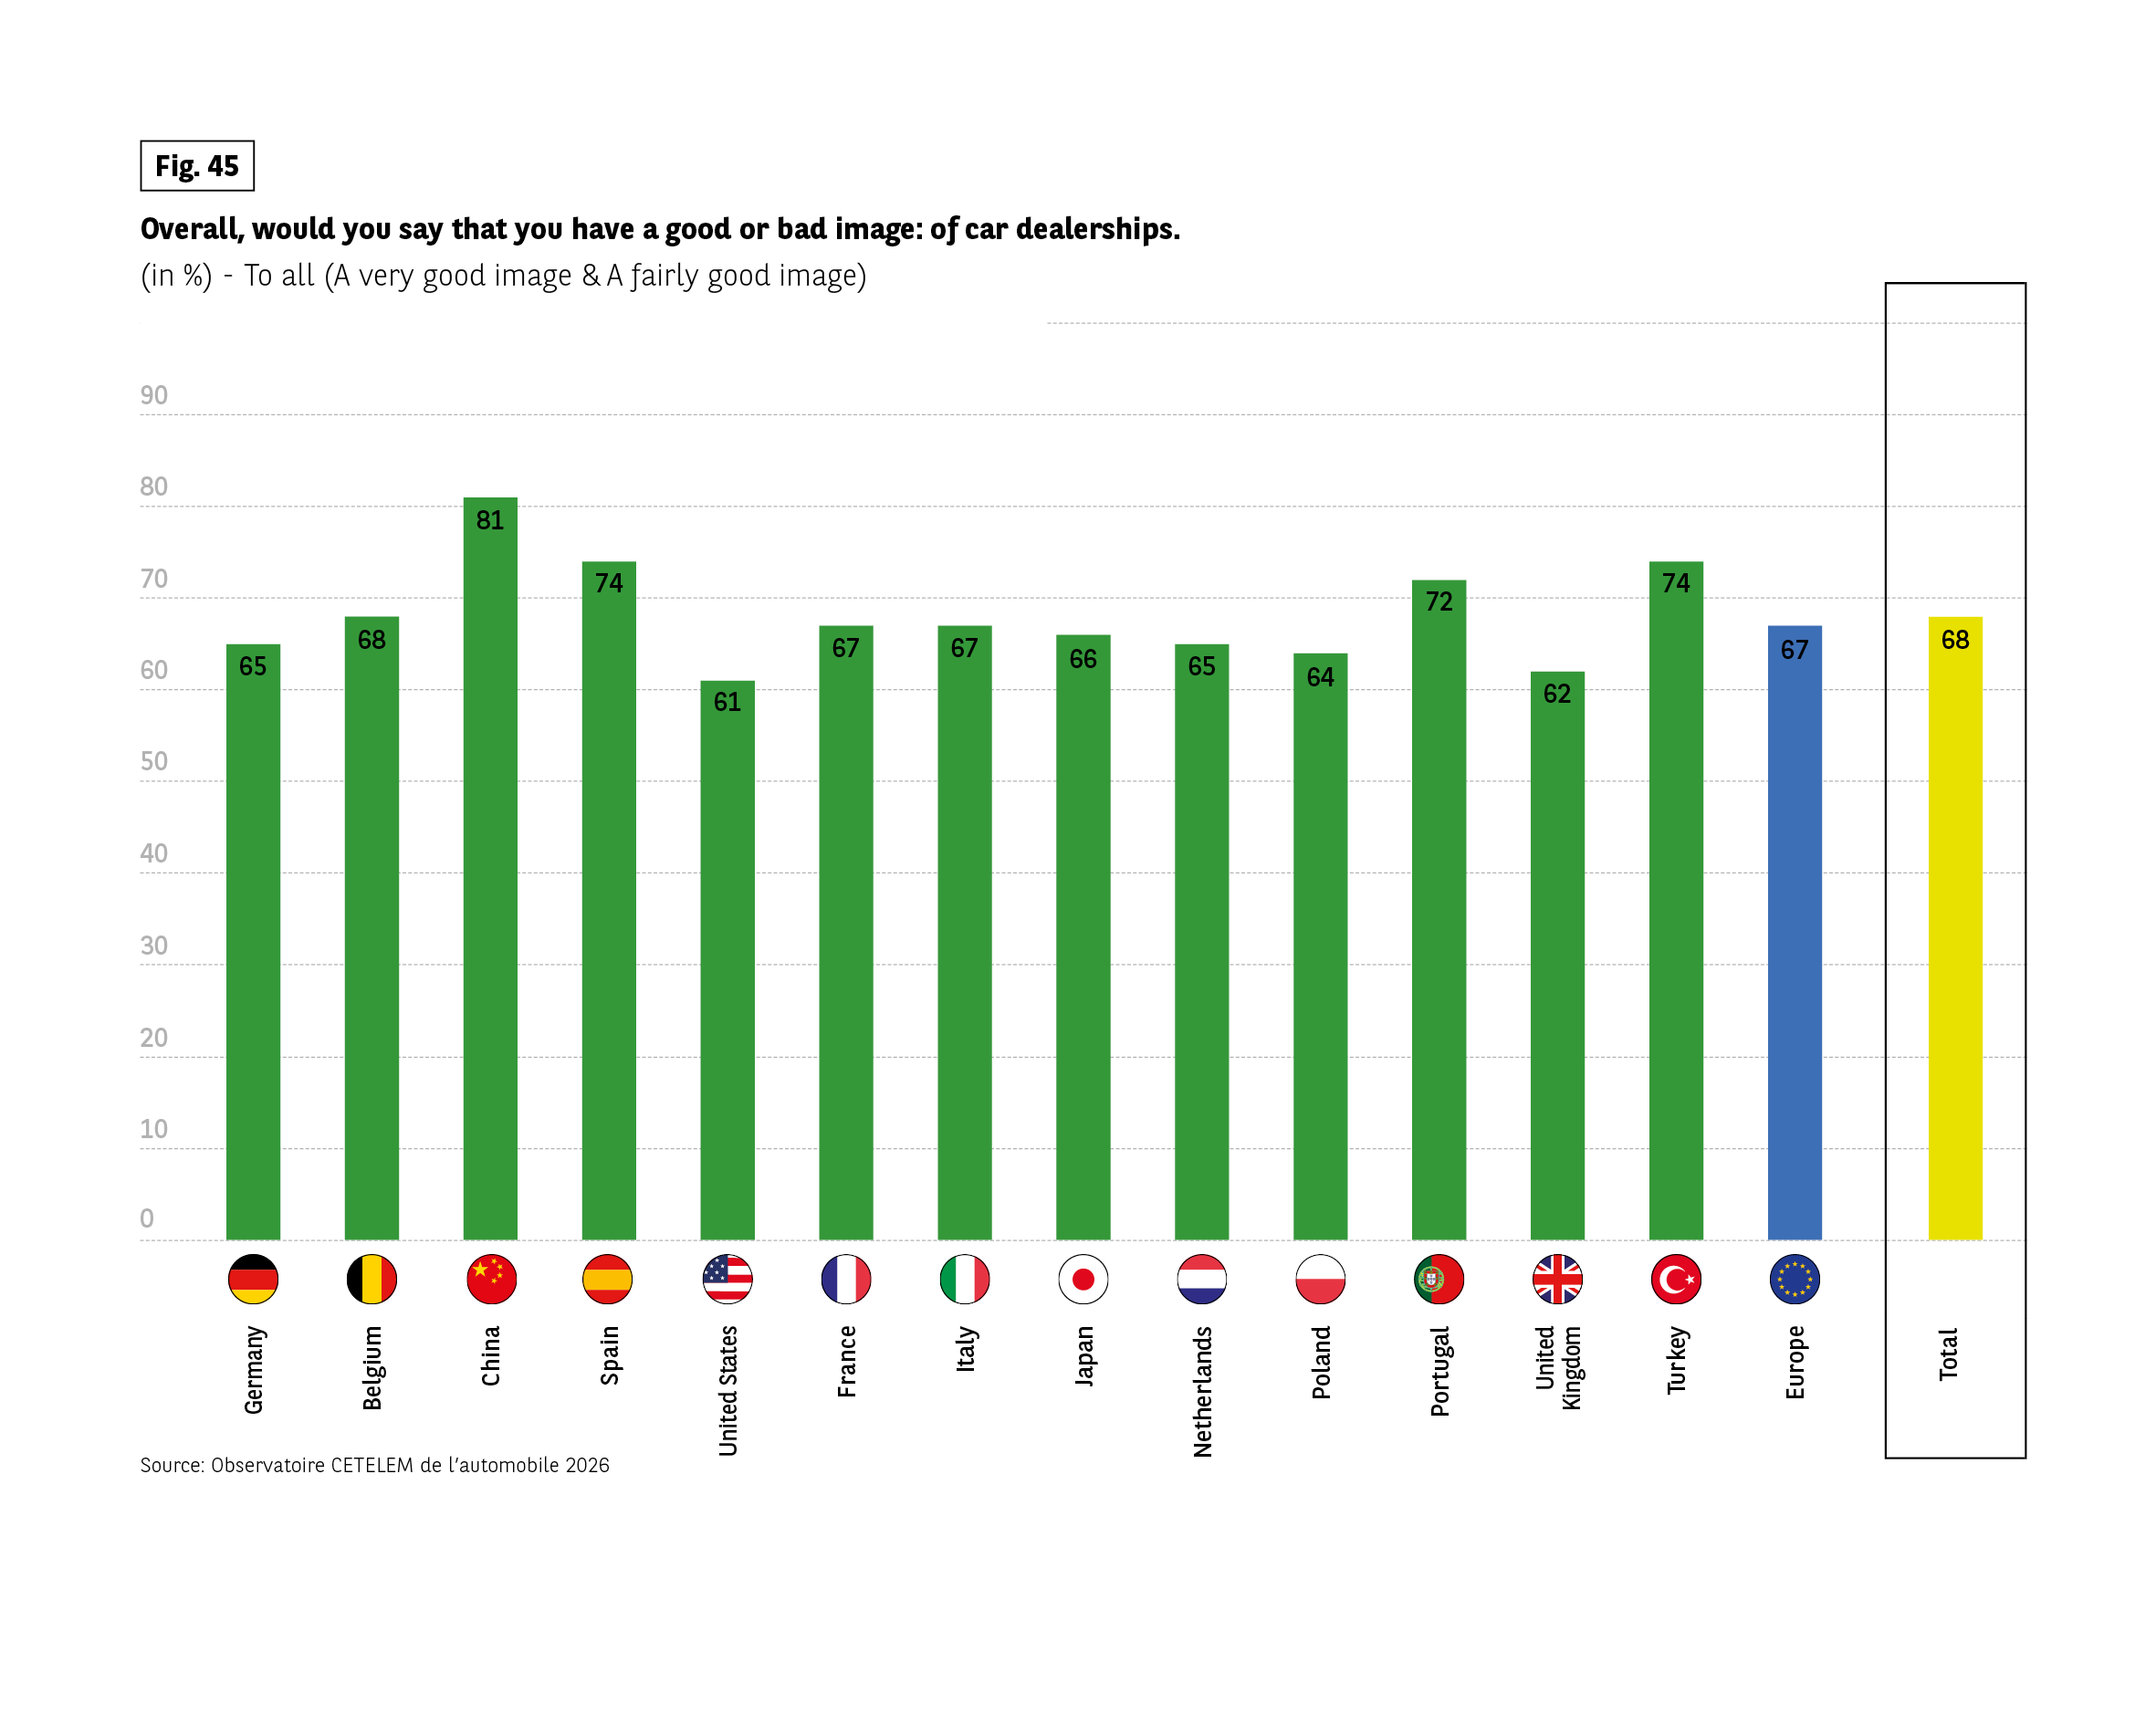 Context: Respondents assessed whether they have a good or bad image of car dealerships. Percentages represent combined “very good” and “fairly good”.
Data by country (in %):
Germany 65, Belgium 68, China 81, Spain 74, United States 61, France 67, Italy 67, Japan 66, Netherlands 65, Poland 64, Portugal 72, United Kingdom 62, Turkey 74, Europe 67, Total 68.
Key pattern: China and Turkey display the highest levels of positive perception. The United States shows the lowest.
Source: Observatoire CETELEM de l’automobile 2026.
Context: Respondents assessed whether they have a good or bad image of car dealerships. Percentages represent combined “very good” and “fairly good”.
Data by country (in %):
Germany 65, Belgium 68, China 81, Spain 74, United States 61, France 67, Italy 67, Japan 66, Netherlands 65, Poland 64, Portugal 72, United Kingdom 62, Turkey 74, Europe 67, Total 68.
Key pattern: China and Turkey display the highest levels of positive perception. The United States shows the lowest.
Source: Observatoire CETELEM de l’automobile 2026.
… and salespeople
Within these dealerships, the sales staff themselves have earned a considerable amount of goodwill, which puts them in a favourable position with motorists (Fig. 46). Two-thirds have a good image of salespeople, particularly the Chinese, Poles and Spanish.
Only the Dutch are cautious, with just 55% expressing a positive opinion. If we look at certain sociological segments, the differences are more marked. Young people appreciate them much more than their elders, as do people living in large cities compared to those in rural areas.
Fig 46 – Public image of car dealers as individuals
Download this infographic for your presentations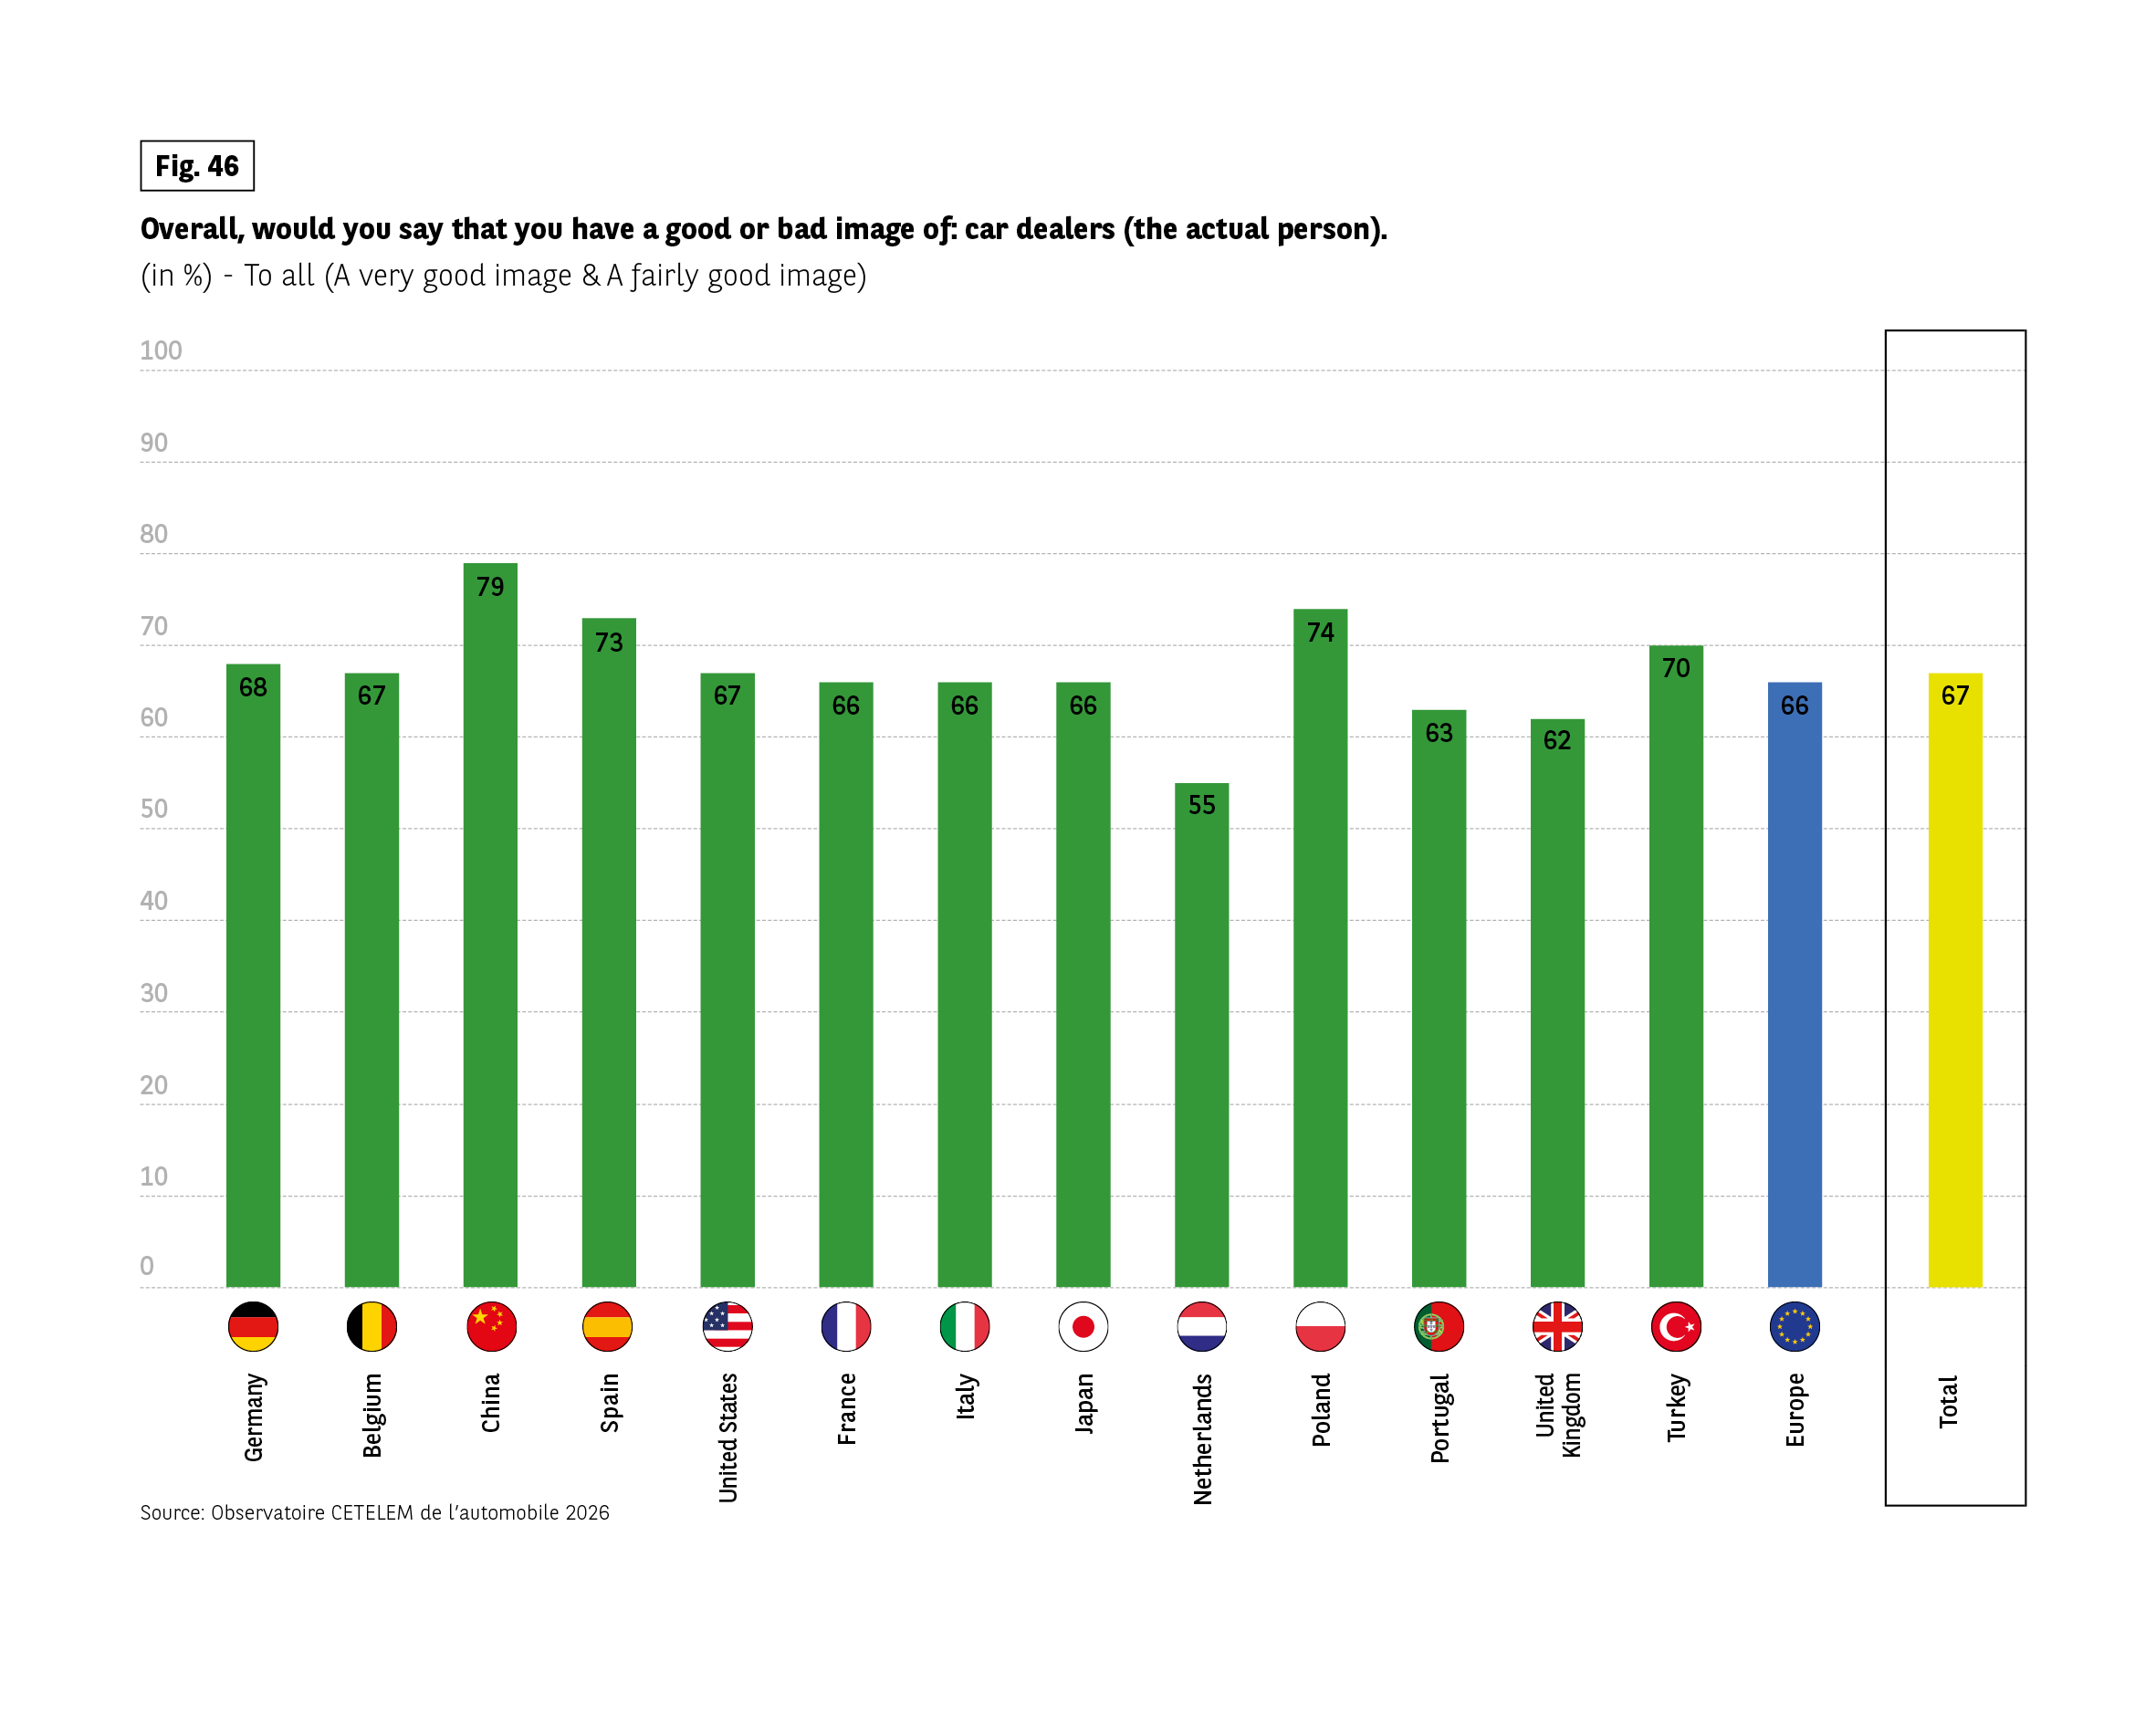 Context: Respondents were asked whether they have a good or bad image of car dealers as individuals. Percentages represent combined “very good” and “fairly good” image.
Data by country (in %):
Germany 68, Belgium 67, China 79, Spain 73, United States 67, France 66, Italy 66, Japan 66, Netherlands 55, Poland 74, Portugal 63, United Kingdom 62, Turkey 70, Europe 66, Total 67.
Key pattern: In all countries, a majority report a positive image of car dealers. Perception is highest in China and lowest in the Netherlands.
Source: Observatoire CETELEM de l’automobile 2026.
Context: Respondents were asked whether they have a good or bad image of car dealers as individuals. Percentages represent combined “very good” and “fairly good” image.
Data by country (in %):
Germany 68, Belgium 67, China 79, Spain 73, United States 67, France 66, Italy 66, Japan 66, Netherlands 55, Poland 74, Portugal 63, United Kingdom 62, Turkey 70, Europe 66, Total 67.
Key pattern: In all countries, a majority report a positive image of car dealers. Perception is highest in China and lowest in the Netherlands.
Source: Observatoire CETELEM de l’automobile 2026.
Trust throughout the purchasing process
This positive image is reflected in the overall trust placed in dealers and their sales staff to support motorists throughout the purchasing process. 7 times out of 10, motorists trust them, first and foremost, to understand their needs, which in turn leads to the right advice to help them make the right purchase.
These are useful assets when it comes to developing the offering and making the economic adjustments that motorists are looking for to meet their expectations. Let’s repeat this one last time: the Turks and the Chinese are the most satisfied. The Americans and the British are less so.
Fig 47 – Trust in car dealers when buying
Download this infographic for your presentations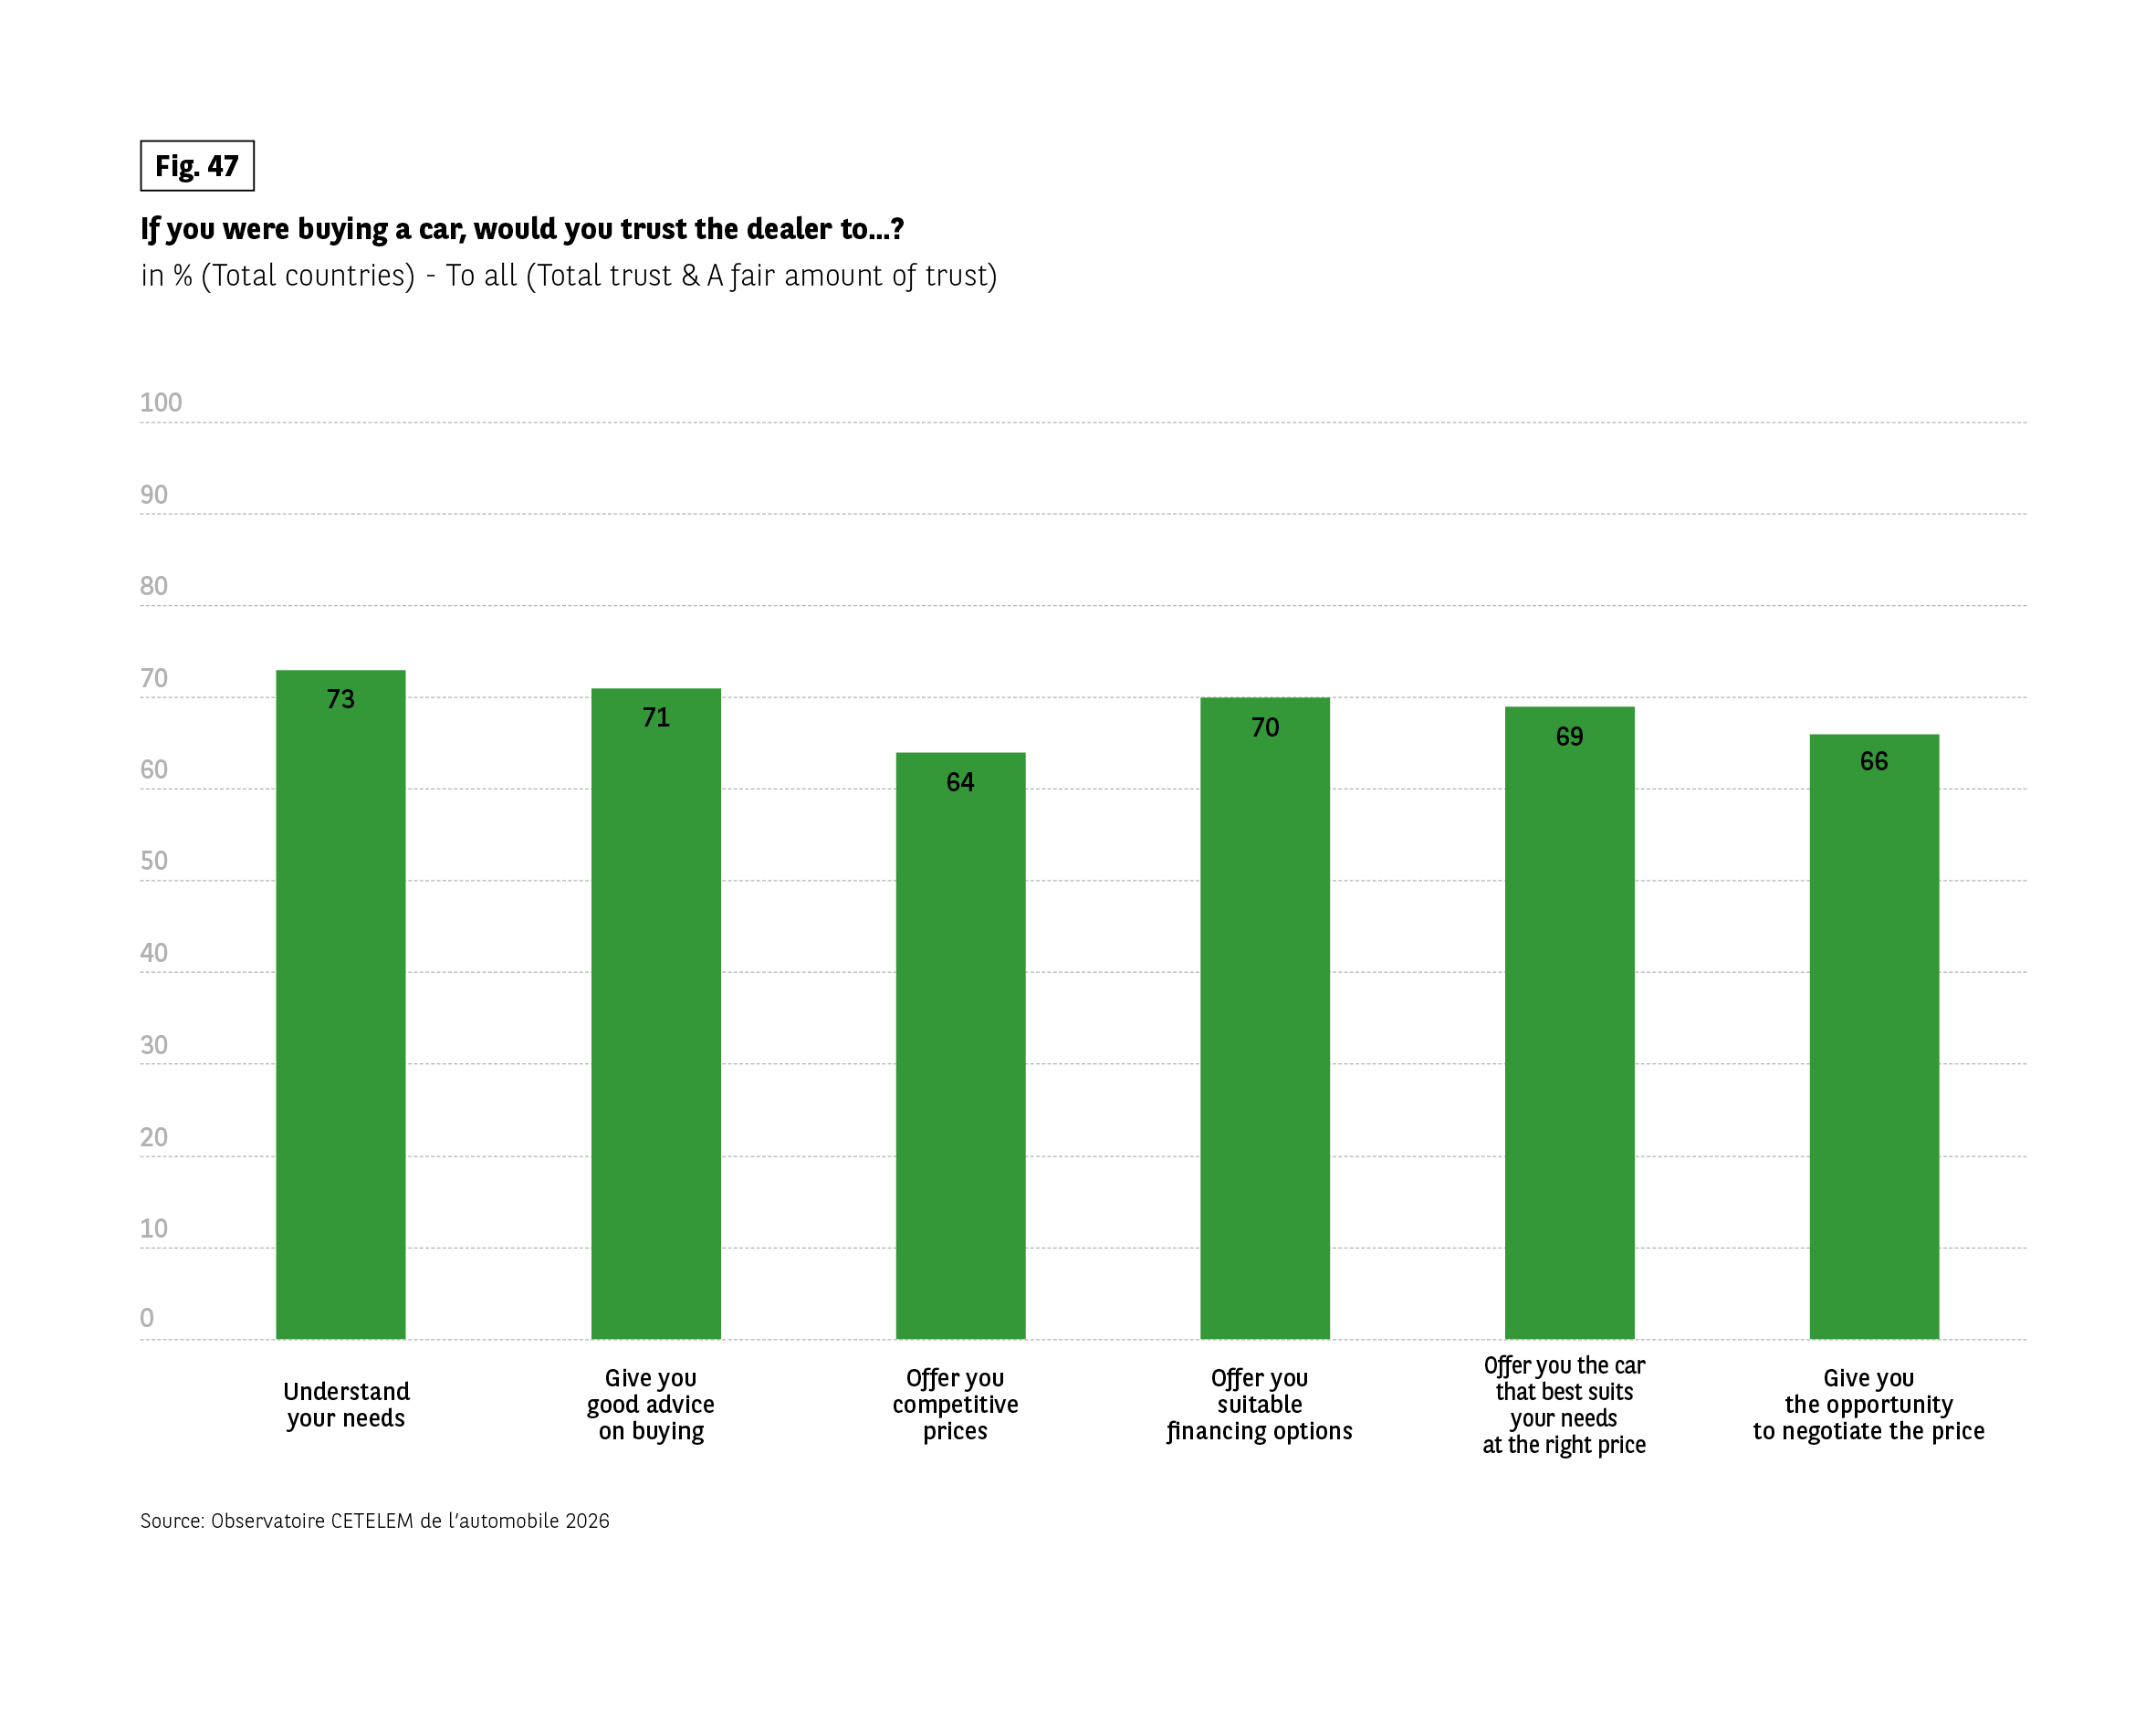 Context: Respondents were asked whether they would trust the dealer in different aspects of the buying process. Percentages represent total trust and a fair amount of trust (total countries).
Results (in %):
Understand your needs 73
Give good buying advice 71
Offer competitive prices 64
Offer suitable financing options 70
Offer the car that best suits needs at the right price 69
Give opportunity to negotiate the price 66
Key pattern: Trust is highest for understanding customer needs and providing advice, and lowest for price negotiation.
Source: Observatoire CETELEM de l’automobile 2026.
Context: Respondents were asked whether they would trust the dealer in different aspects of the buying process. Percentages represent total trust and a fair amount of trust (total countries).
Results (in %):
Understand your needs 73
Give good buying advice 71
Offer competitive prices 64
Offer suitable financing options 70
Offer the car that best suits needs at the right price 69
Give opportunity to negotiate the price 66
Key pattern: Trust is highest for understanding customer needs and providing advice, and lowest for price negotiation.
Source: Observatoire CETELEM de l’automobile 2026.
Distribution penalised by public policies, especially in Europe
However, if distribution is to play an effective role in revi- ving the industry, public policies must be better directed towards dealers. (Fig. 48).
1 in 2 people think this is currently the case. In Europe, this score is above average in only three countries. It is at its lowest in Germany and France, which express the strongest doubts about the direction taken by public policies intended to support car dealers.
Fig 48 – Perception of public policy on dealerships
Download this infographic for your presentations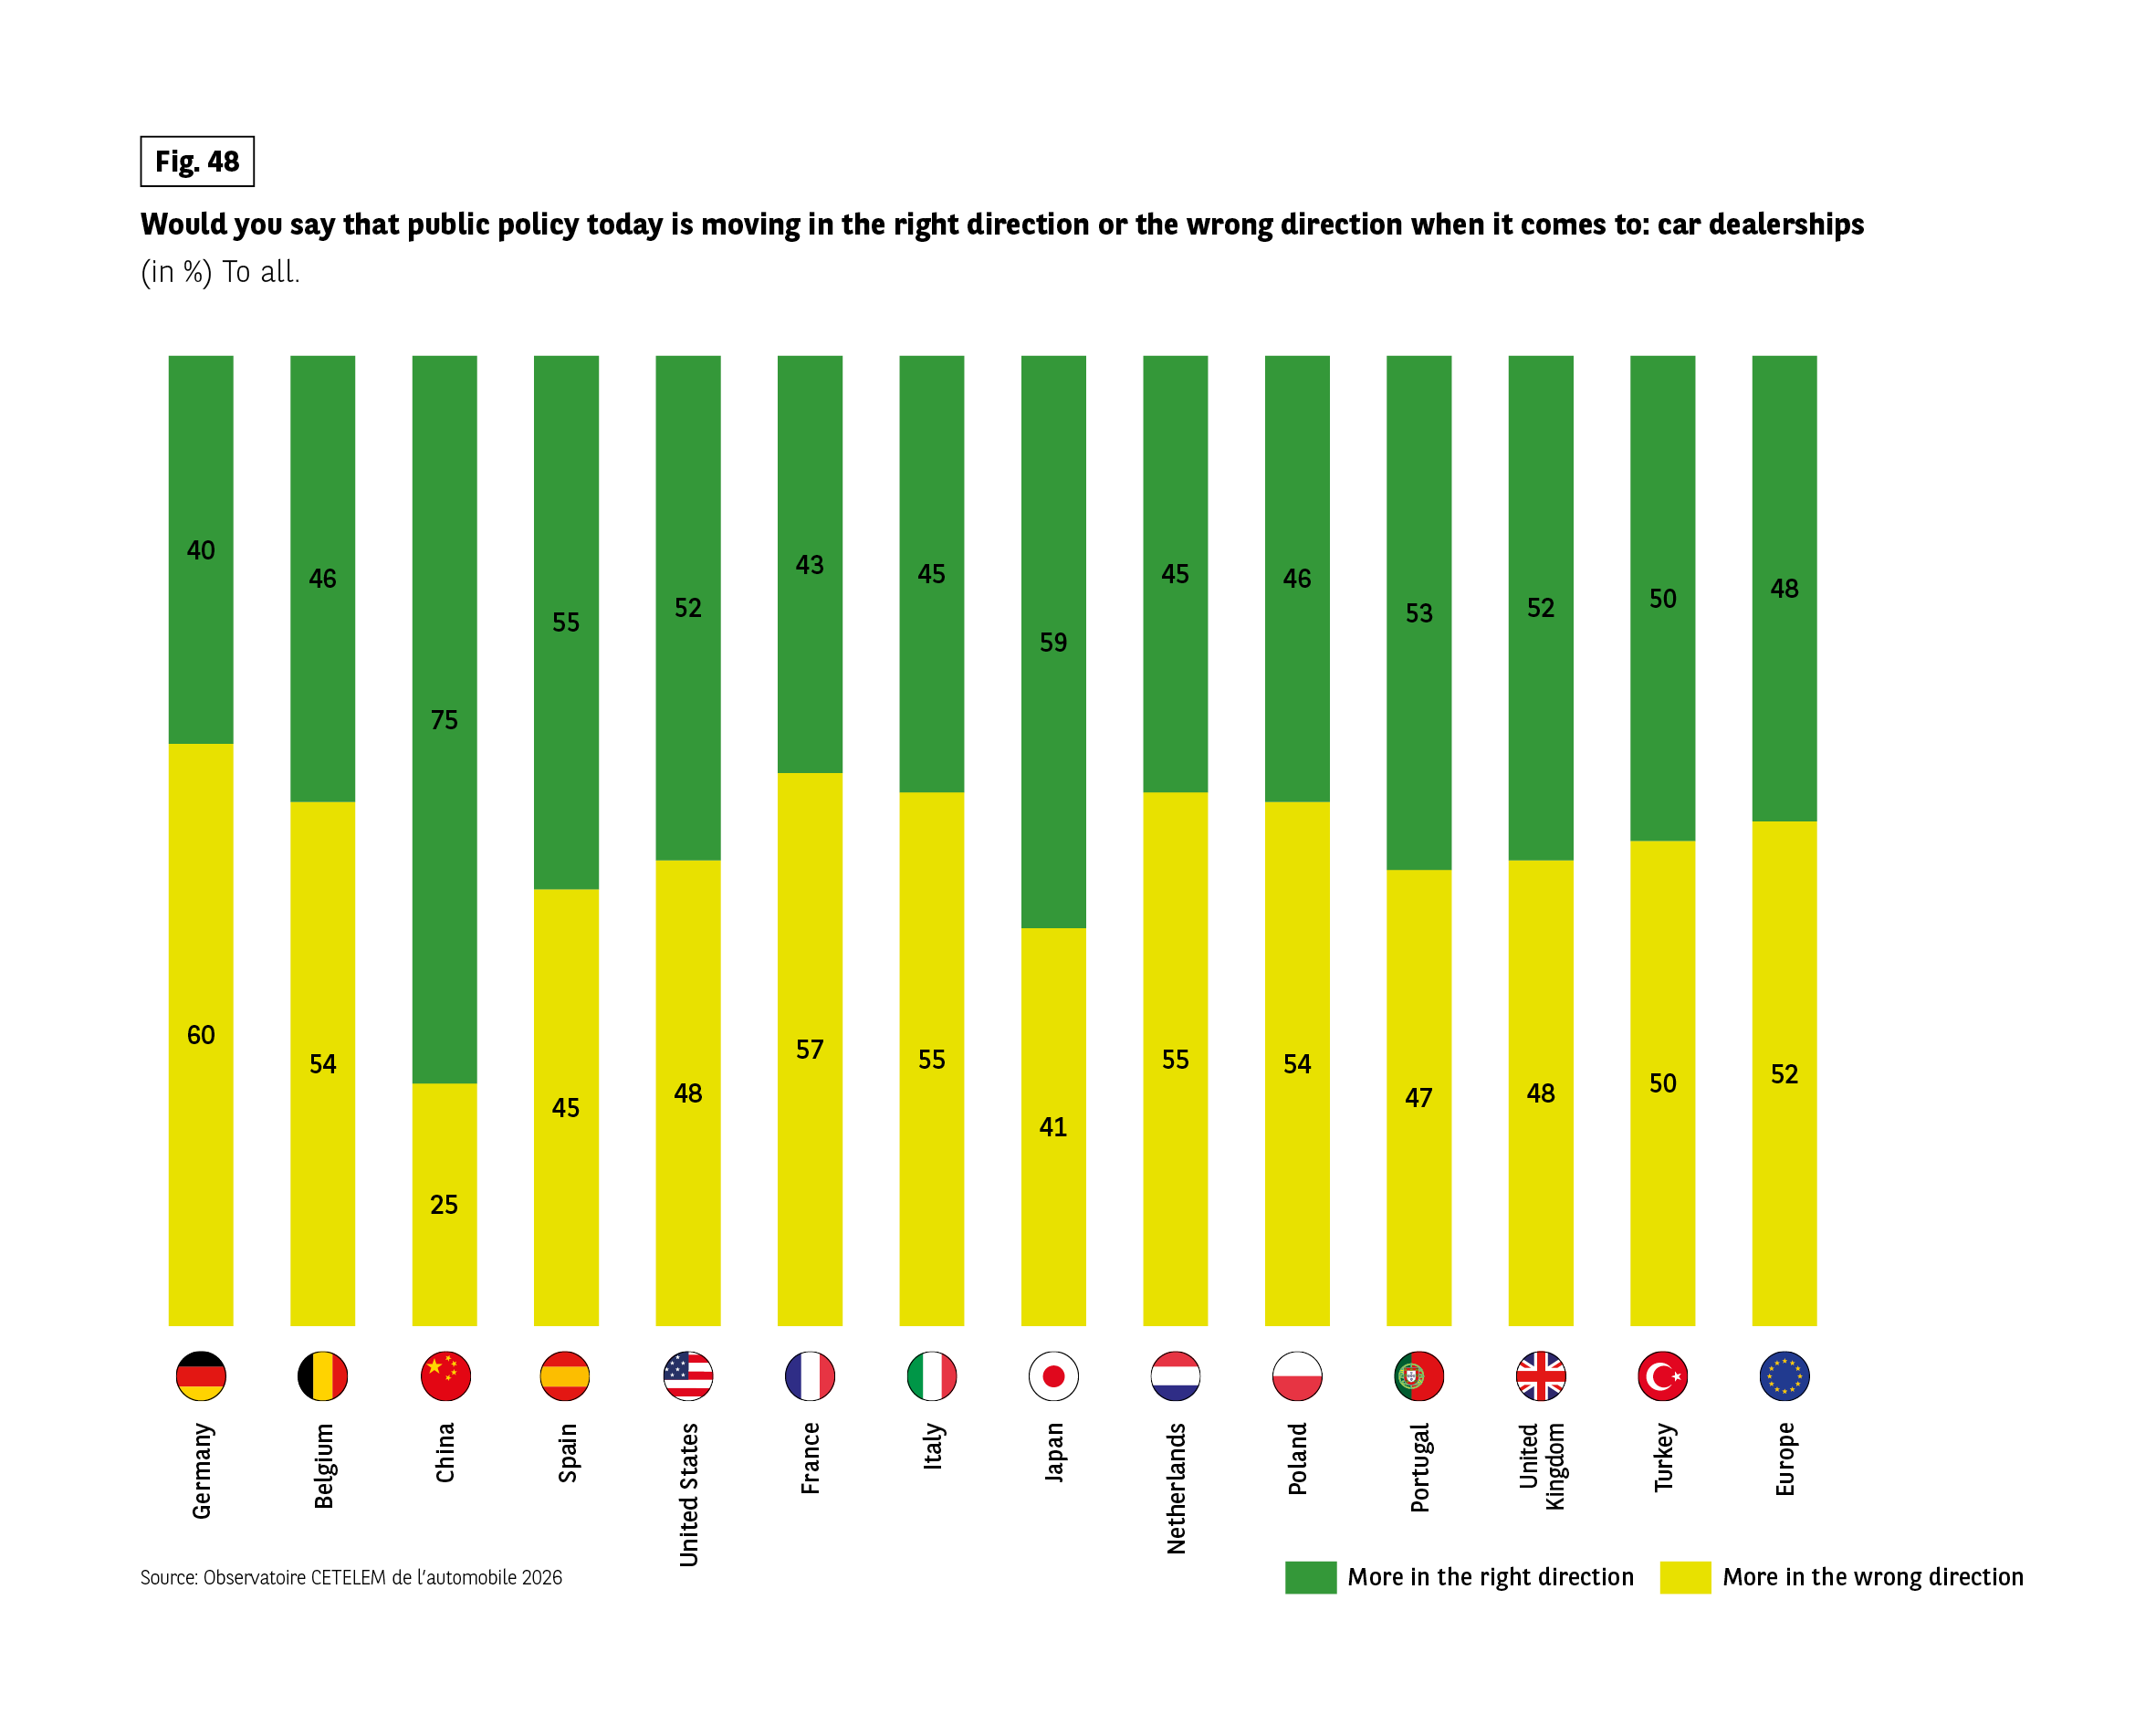 Context: Respondents evaluated whether current public policy regarding car dealerships is moving in the right or wrong direction.
Legend:
Green = More in the right direction
Yellow = More in the wrong direction
Data by country (right / wrong, in %):
Germany 40 / 60
Belgium 46 / 54
China 75 / 25
Spain 55 / 45
United States 52 / 48
France 43 / 57
Italy 45 / 55
Japan 59 / 41
Netherlands 45 / 55
Poland 46 / 54
Portugal 53 / 47
United Kingdom 52 / 48
Turkey 50 / 50
Europe 48 / 52
Key pattern: Opinions are divided in most countries. China is the only country with a strong imbalance toward a positive direction.
Source: Observatoire CETELEM de l’automobile 2026.
Context: Respondents evaluated whether current public policy regarding car dealerships is moving in the right or wrong direction.
Legend:
Green = More in the right direction
Yellow = More in the wrong direction
Data by country (right / wrong, in %):
Germany 40 / 60
Belgium 46 / 54
China 75 / 25
Spain 55 / 45
United States 52 / 48
France 43 / 57
Italy 45 / 55
Japan 59 / 41
Netherlands 45 / 55
Poland 46 / 54
Portugal 53 / 47
United Kingdom 52 / 48
Turkey 50 / 50
Europe 48 / 52
Key pattern: Opinions are divided in most countries. China is the only country with a strong imbalance toward a positive direction.
Source: Observatoire CETELEM de l’automobile 2026.
Using the internet to sell cars
Activating the retail lever also means potentially opening it up to digital channels. Potentially, because opinions are divided. On average, 1 in 2 motorists say they would be able to complete their entire buying journey on the internet. (Fig. 49). However, when it comes to this issue, opinions diverge significantly between countries, with the greatest differences recorded.
In China, where digital technology is an integral part of daily life and is already being applied to car purchases, 79% of people are in favour of a buying journey entirely conducted online. The Germans, Americans and Turks are also in favour. Conversely, in many countries, less than half of respondents approve, particularly in Japan and the Netherlands (26% and 33%). Unsurprisingly, young people and people living in large cities are in favour, as are families with children and high-income earners.
Fig 49 – Willingness to buy a car fully online
Download this infographic for your presentations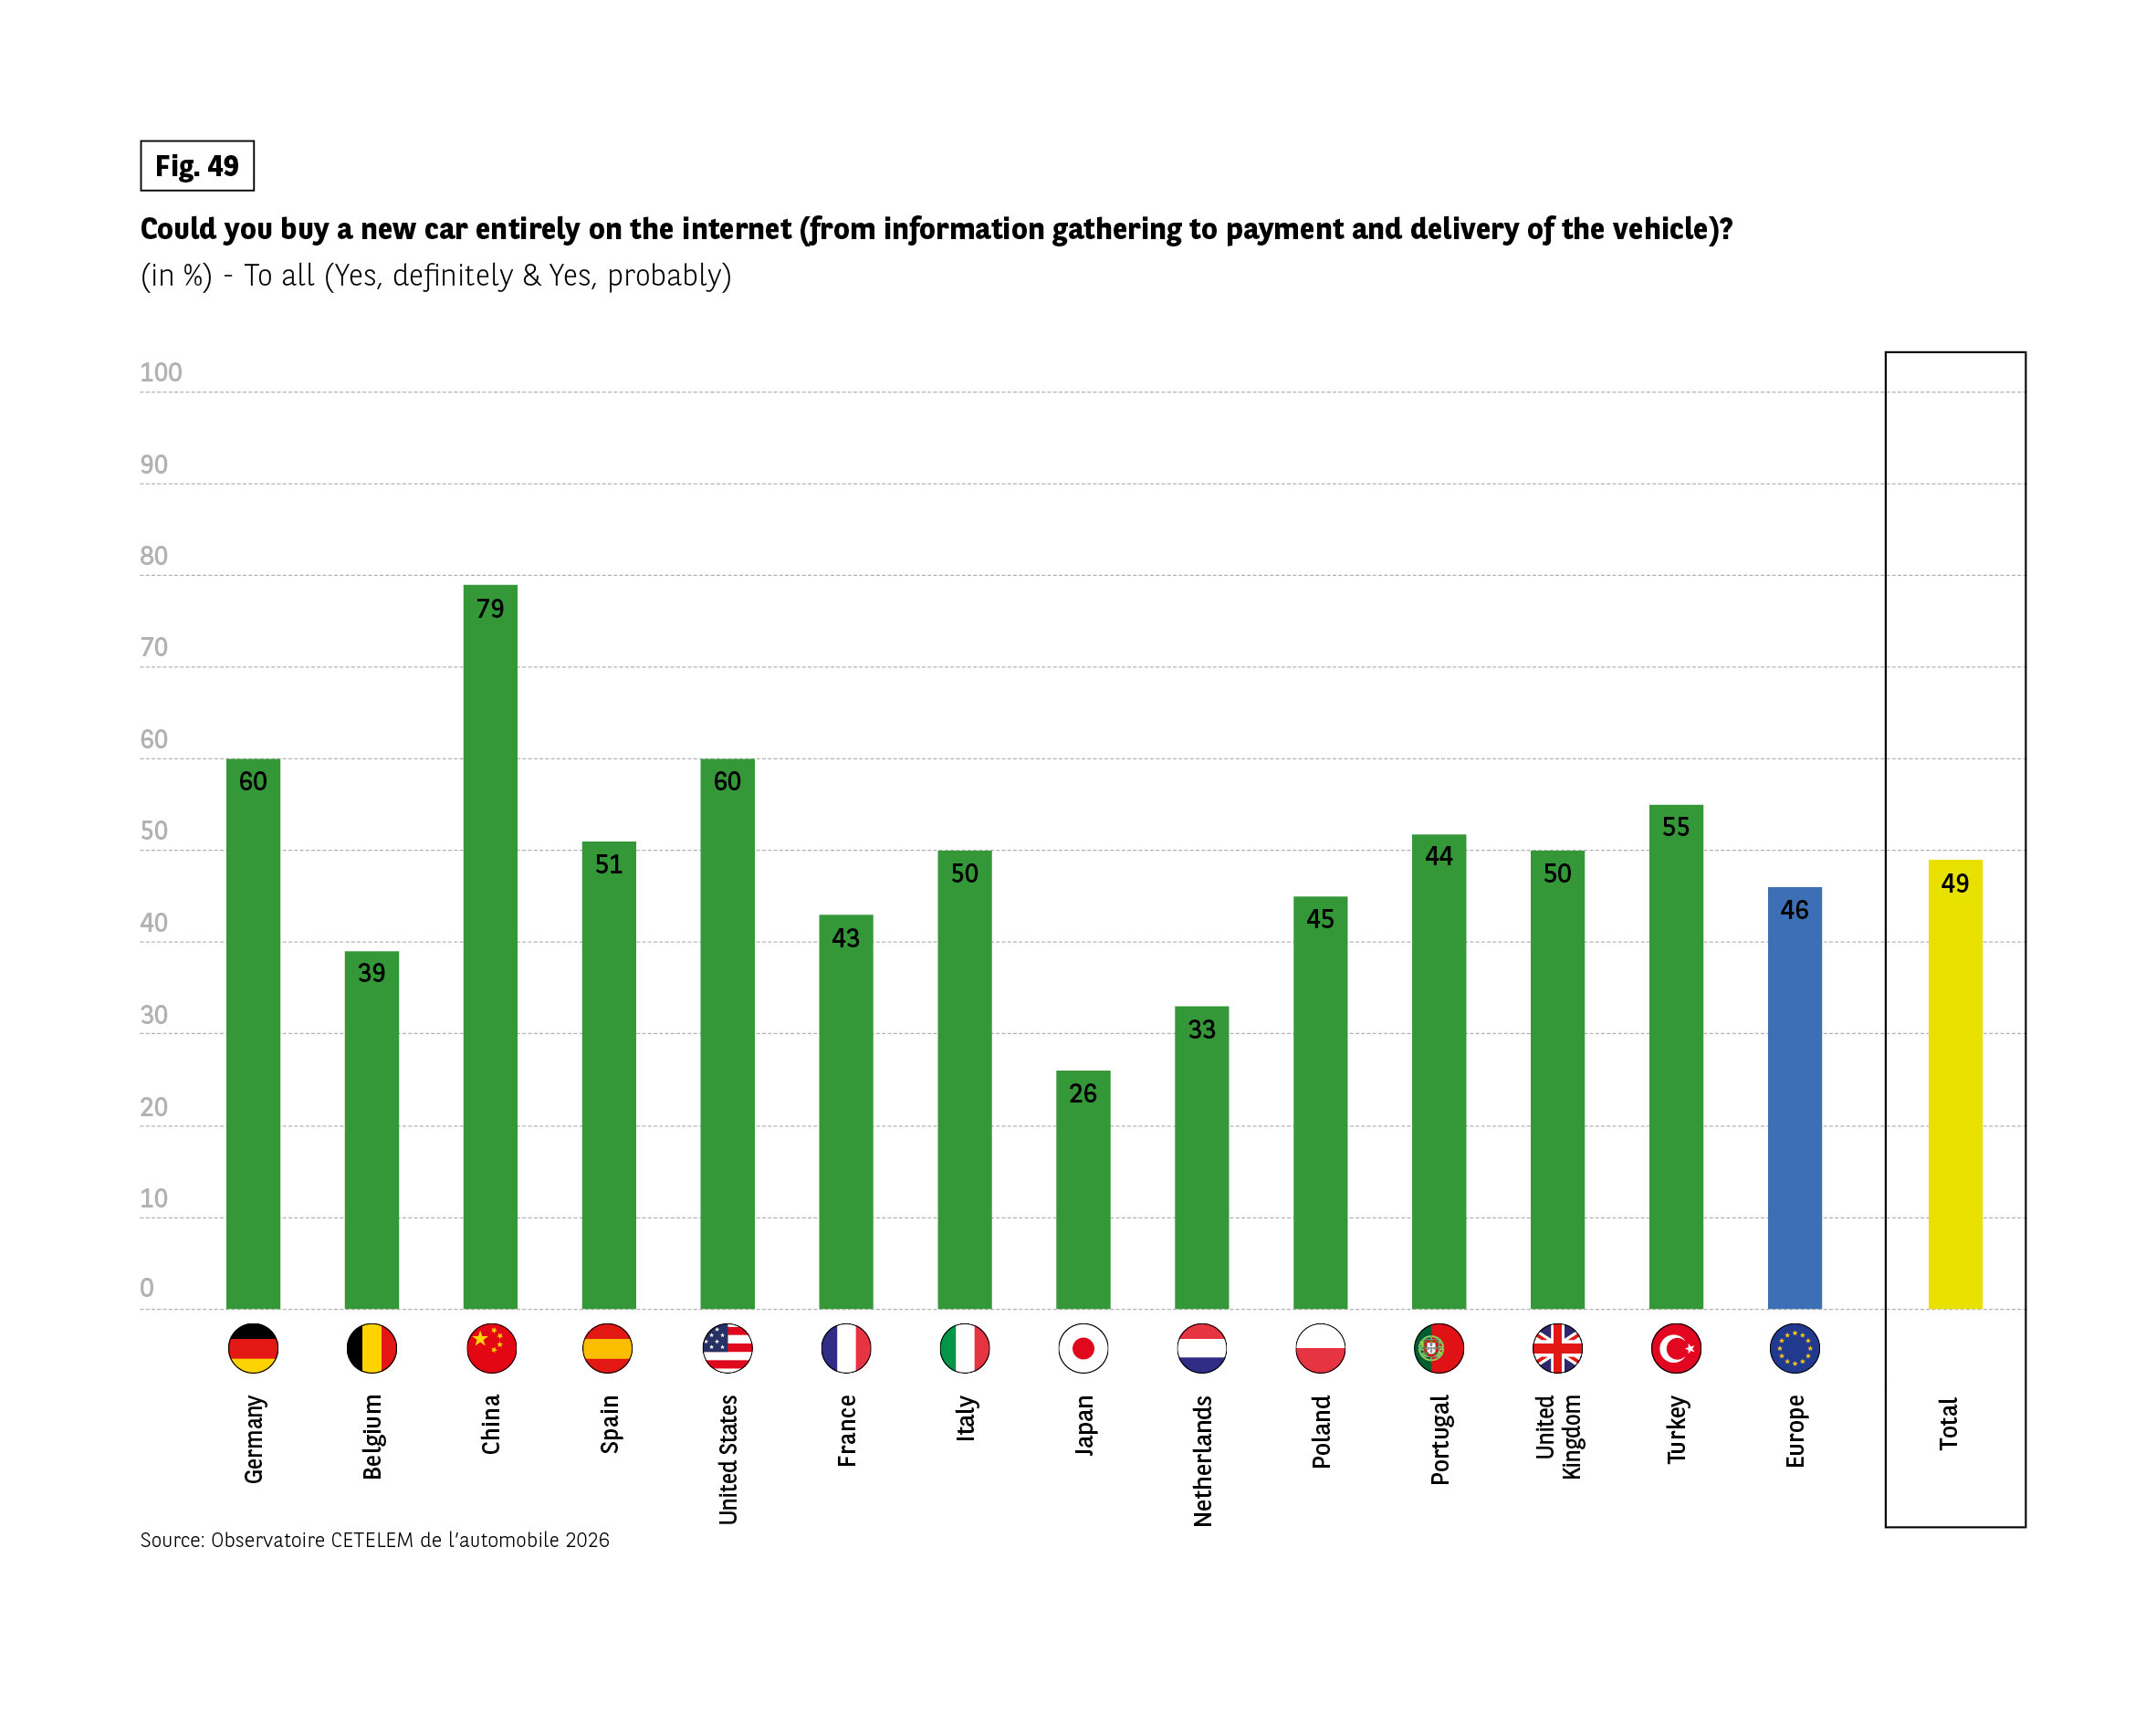 Context: Respondents were asked if they could buy a new car entirely online, from information gathering to payment and delivery. Percentages combine “yes, definitely” and “yes, probably”.
Data by country (in %):
Germany 60, Belgium 39, China 79, Spain 51, United States 60, France 43, Italy 50, Japan 26, Netherlands 33, Poland 45, Portugal 44, United Kingdom 50, Turkey 55, Europe 46, Total 49.
Key pattern: Willingness varies widely, from 26% in Japan to 79% in China. Fewer than half of Europeans overall express readiness for a fully online purchase.
Source: Observatoire CETELEM de l’automobile 2026.
Context: Respondents were asked if they could buy a new car entirely online, from information gathering to payment and delivery. Percentages combine “yes, definitely” and “yes, probably”.
Data by country (in %):
Germany 60, Belgium 39, China 79, Spain 51, United States 60, France 43, Italy 50, Japan 26, Netherlands 33, Poland 45, Portugal 44, United Kingdom 50, Turkey 55, Europe 46, Total 49.
Key pattern: Willingness varies widely, from 26% in Japan to 79% in China. Fewer than half of Europeans overall express readiness for a fully online purchase.
Source: Observatoire CETELEM de l’automobile 2026.
Favouring physical contact
This reluctance can be explained by the virtual nature of this approach, and therefore the absence of a human dimension. Not being able to see the vehicle, not being able to identify a fault in person and the preference for human contact are the main obstacles to switching to digital purchasing. Seniors are particularly sensitive to the absence of this human dimension.
Fig 50 – Main reasons against fully online car buying
Download this infographic for your presentations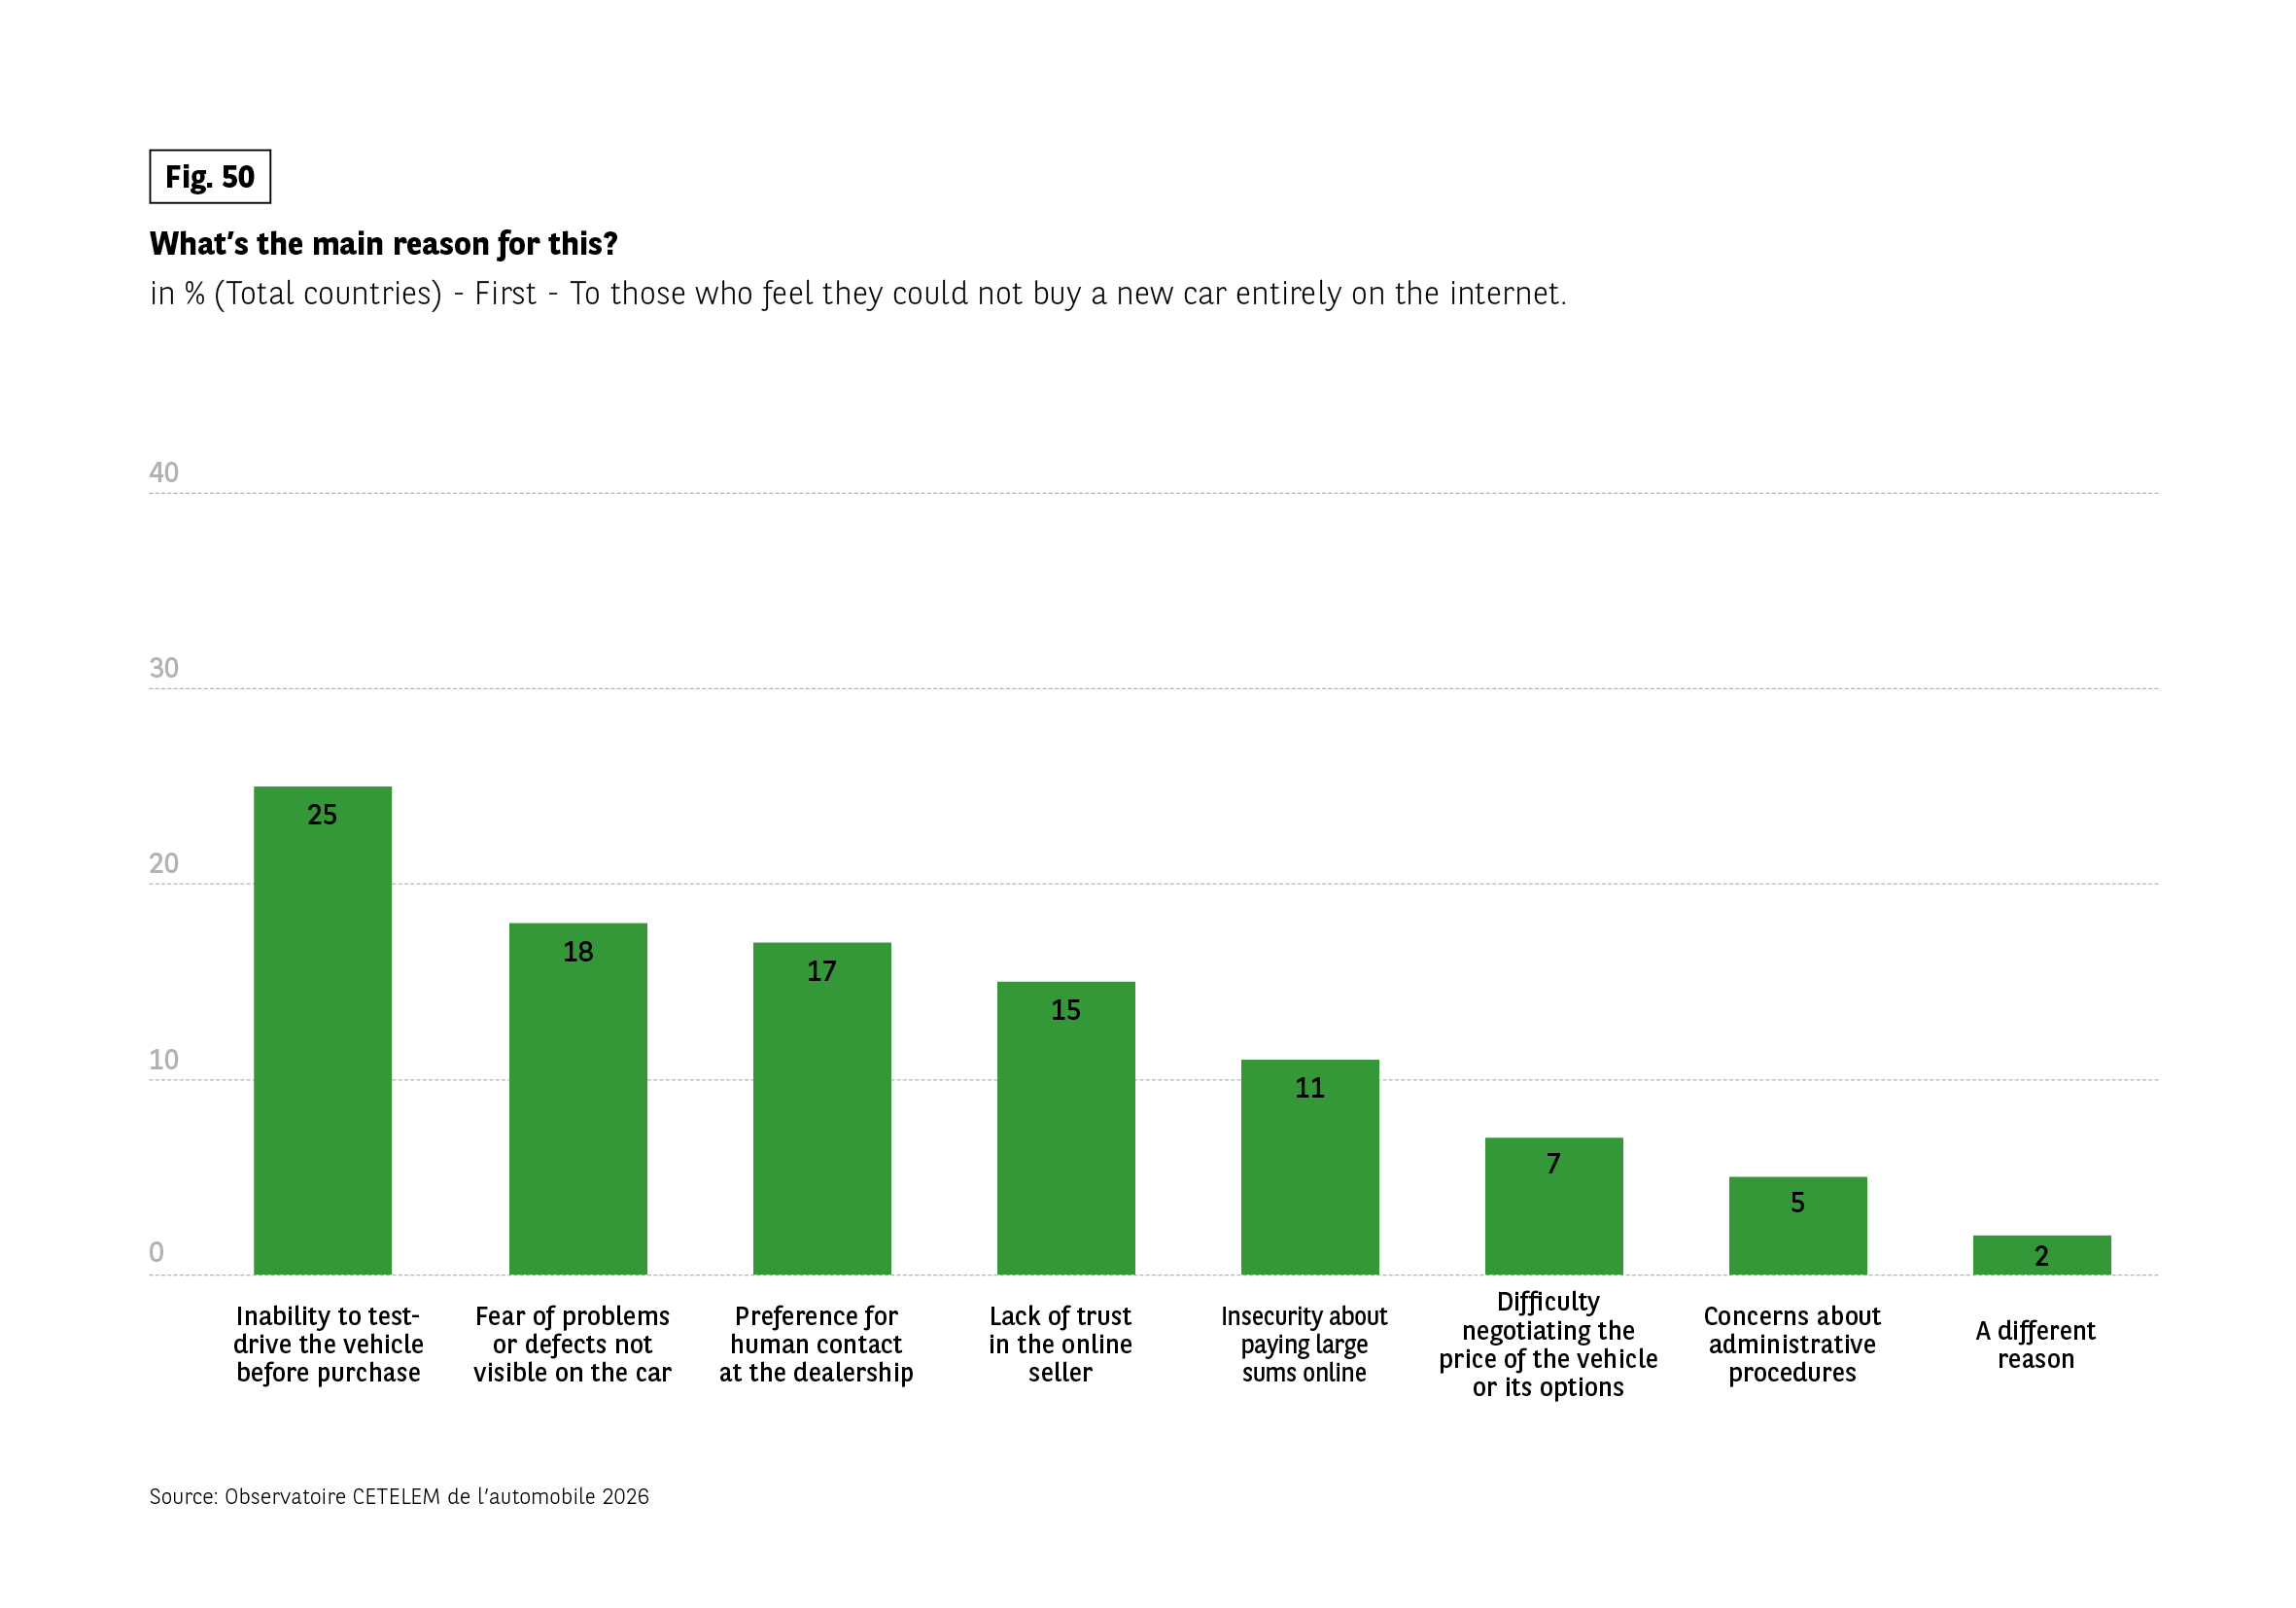 Context: Question asked to respondents who feel they could not buy a new car entirely on the internet. Only the main reason is shown.
Results (in %):
Inability to test-drive before purchase 25
Fear of hidden defects 18
Preference for human contact at dealership 17
Lack of trust in the online seller 15
Insecurity about paying large sums online 11
Difficulty negotiating the price 7
Concerns about administrative procedures 5
A different reason 2
Key pattern: The absence of test driving is the most cited barrier.
Source: Observatoire CETELEM de l’automobile 2026.
Context: Question asked to respondents who feel they could not buy a new car entirely on the internet. Only the main reason is shown.
Results (in %):
Inability to test-drive before purchase 25
Fear of hidden defects 18
Preference for human contact at dealership 17
Lack of trust in the online seller 15
Insecurity about paying large sums online 11
Difficulty negotiating the price 7
Concerns about administrative procedures 5
A different reason 2
Key pattern: The absence of test driving is the most cited barrier.
Source: Observatoire CETELEM de l’automobile 2026.