B2C and C2C are (almost) neck and neck

The circular economy is being fuelled by the emergence of new stakeholders, not least the pure plays that operate in the second-hand or refurbished markets. Faced with what might appear to be a redistribution of the roles assigned to these stakeholders, consumers will be keen to take maximum advantage of the competition generated. In this context, brands and retailers have many ways of appealing to these same consumers, the most effective being guarantees regarding durability and repairability, as well as their potential for innovation.
Every commercial transaction raises the question of the importance and role of the stakeholders involved. With the emergence of the circular economy, this question becomes even more crucial, because it asks whether or not “traditional” players, retailers and brands in particular, will be superseded
by new entrants.
The circular economy is quite closely associated with brands and retailers
The circular economy – and, one might even be tempted to say, circular retail – involves three main categories of stakeholder: retailers, brands and private individuals, with the latter making use of online platforms when acting as buyers or consumer sellers.
In the eyes of Europeans, “traditional” vendors continue to play a slightly more significant role, although it is not necessarily a dominant one. 57% believe that the circular economy revolves primarily around products offered by brands and retailers (Fig. 18). Under-30s are more inclined to highlight the role played by private individuals, notably through the use of online platforms (48% vs. 43% on average overall).
Fig. 18 Perception of Circular Economy
Download this infographic for your presentations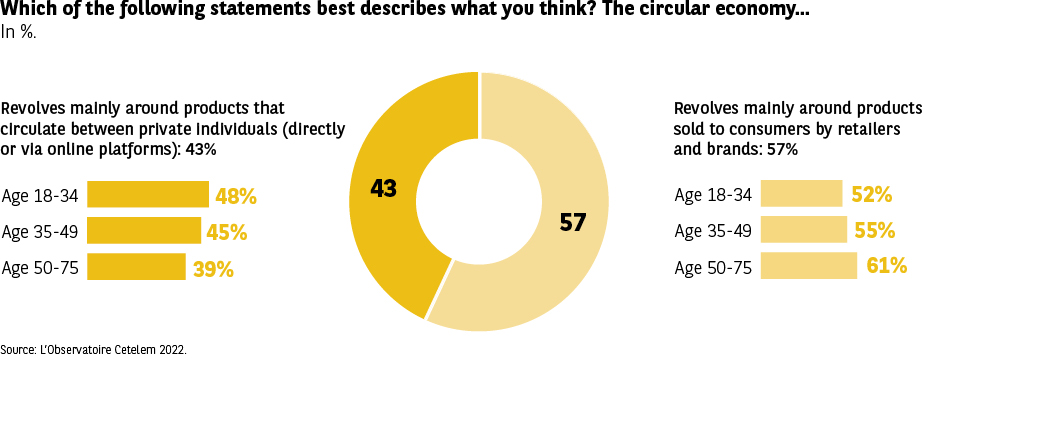 Context: Infographic showing two main interpretations of circular economy.
Visual elements: central donut chart and horizontal bars by age.
Data:
• Products circulating between individuals: 43%
– Ages 18–34: 48%
– Ages 35–49: 45%
– Ages 50–75: 39%
• Products offered by brands/retailers: 57%
– Ages 18–34: 52%
– Ages 35–49: 55%
– Ages 50–75: 61%
Main insight: Respondents more often associate circular economy with brand-driven resale
programs than with peer to peer exchanges.
Source: Observatoire Cetelem 2022.
Context: Infographic showing two main interpretations of circular economy.
Visual elements: central donut chart and horizontal bars by age.
Data:
• Products circulating between individuals: 43%
– Ages 18–34: 48%
– Ages 35–49: 45%
– Ages 50–75: 39%
• Products offered by brands/retailers: 57%
– Ages 18–34: 52%
– Ages 35–49: 55%
– Ages 50–75: 61%
Main insight: Respondents more often associate circular economy with brand-driven resale
programs than with peer to peer exchanges.
Source: Observatoire Cetelem 2022.
Second-hand/refurbished market players with the highest web traffic*
- Vinted (present mainly in Germany, Belgium, Spain, France, Poland and the Czech Republic)
- Willhaben (Austria)
- 2dehands (Belgium)
- Milanuncios (Spain)
- Leboncoin (France)
- Subito (Italy)
- Finn (Norway)
- Olx (present mainly in Bulgaria, Poland, Portugal and Romania)
- Bazos (present mainly in the Czech Republic and Slovakia)
- Bazar (present mainly in Bulgaria, the Czech Republic and Slovakia)
- Blocket (Sweden)
- Momox (Germany, Austria)
- Remix (Eastern Europe, acquired by US firm Thred Up)
* Top 3 based on the number of web searches, source C-Ways, Nextrends tool, data as of 7 December 2021.
An opportunity to diversify the sources of purchases
In the circular economy, competitive forces are just as powerful as those at play in the linear economy. This is particularly true when it comes to making a purchase (Fig. 19). Indeed, Europeans state that they are as likely to buy second-hand goods from a retailer or a shop as they are from a peer-to-peer buy/sell platform (41% and 39%). The former are preferred by the majority of Romanians, Bulgarians and Britons. The Germans and Austrians are keener on the latter. Flea markets and jumble sales, the ancestors of second-hand selling, are relegated to third place (26%), with the Danes, the French and the Italians being the keenest on these methods.
Fig. 19 Second Hand Buying and Selling Channels
Download this infographic for your presentations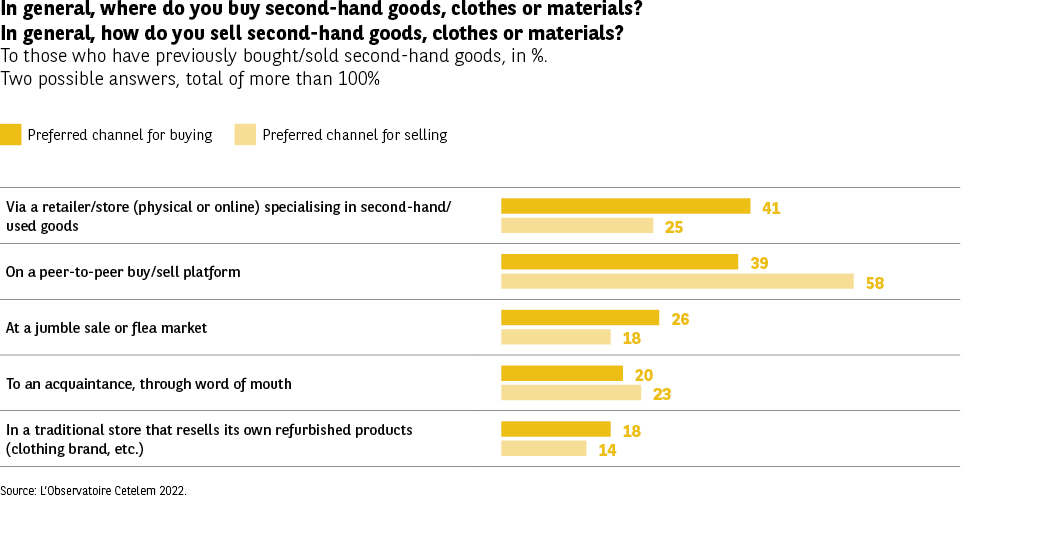 Context: Infographic comparing preferred channels for buying and selling second hand items.
Visual elements: yellow bars for buying and lighter bars for selling.
Data (buy / sell):
• Second hand specialist store: 41% / 25%
• Peer to peer platforms: 39% / 58%
• Flea market / car boot sale: 26% / 18%
• Word of mouth through acquaintances: 20% / 23%
• Traditional retailer reselling refurbished goods: 18% / 14%
Main insight: Purchases are mainly made in specialized stores, while most sales occur through
peer to peer platforms.
Source: Observatoire Cetelem 2022.
Context: Infographic comparing preferred channels for buying and selling second hand items.
Visual elements: yellow bars for buying and lighter bars for selling.
Data (buy / sell):
• Second hand specialist store: 41% / 25%
• Peer to peer platforms: 39% / 58%
• Flea market / car boot sale: 26% / 18%
• Word of mouth through acquaintances: 20% / 23%
• Traditional retailer reselling refurbished goods: 18% / 14%
Main insight: Purchases are mainly made in specialized stores, while most sales occur through
peer to peer platforms.
Source: Observatoire Cetelem 2022.
As regards selling, there is a much clearer preference for online platforms. 6 out of 10 Europeans opt for these tools when seeking to sell goods, with only a quarter preferring to sell through retailers and shops, closely followed by selling to acquaintances and through word of mouth. The Austrians, Portuguese and Swedes are the most active when it comes to selling via online platforms, while the Belgians, Hungarians and Italians tend to have more trust in retailers and shops.
The benefits are shared equally
The proportion of consumers who frequent retailers and shops is almost identical to the proportion who visit online platforms. A similar balance emerges if we consider the respective benefits that consumers and brands derive from these practices. 57% of Europeans believe that the resale of second-hand or refurbished products benefits both equally (Fig. 20). What’s more, respondents are equally as likely to believe that the system is of greater benefit to consumers (22%) as they are to think that it favours retailers (21%).
Across the countries surveyed, more than half of all respondents feel that the benefits are shared evenly, with the Eastern Europeans, the French and the Portuguese being most likely to hold this view.
Fig. 20 Brand Buy Back System Perception
Download this infographic for your presentations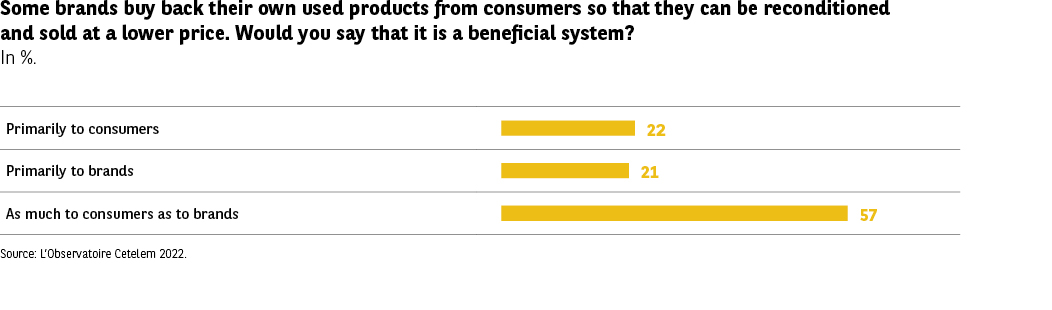 Context: Infographic assessing who benefits most from brand buy back programs for used items.
Visual elements: three horizontal bars.
Data:
• Mainly benefits consumers: 22%
• Mainly benefits brands: 21%
• Benefits both equally: 57%
Main insight: Most respondents believe benefits are shared between brands and consumers.
Source: Observatoire Cetelem 2022.
Context: Infographic assessing who benefits most from brand buy back programs for used items.
Visual elements: three horizontal bars.
Data:
• Mainly benefits consumers: 22%
• Mainly benefits brands: 21%
• Benefits both equally: 57%
Main insight: Most respondents believe benefits are shared between brands and consumers.
Source: Observatoire Cetelem 2022.