In the term “circular economy”, the word “economy” is crucial


Of the key findings produced by the latest edition of L’Observatoire Cetelem de la Consommation, one stands out. Indeed, with more and more consumers becoming sellers, a development made possible by platforms that allow people to connect, individuals are increasingly asserting their authority and gaining control over their consumption. When they act like “entrepreneurs”, consumers are particularly interested in generating extra income, especially given the ongoing public health crisis and its economic consequences. This will only serve to further highlight generational differences, with younger people finding it easier to embrace the role of consumer seller than their elders.
Consumer rationality has long been a key tenet of economics. Many authors have examined the question in the context of a linear economy. With the emergence of the circular economy, what will happen to this apparent rationality?
Sensible consumption
6 out of 10 Europeans tell us that they buy the same amount of goods, but reduce their waste by selling them on, donating them or keeping them for longer instead of throwing them away (Fig. 8). This attitude no doubt reflects a desire to avoid overconsumption or deconsumption, by adopting an approach that combines the quest for personal satisfaction with collective responsibility.
On this question, the differences between countries are significant, with no particular geographical clusters forming. The Spanish top the list (70%), while the Swedes bring up the rear (48%). Between the two, a number of nations, including the UK and Portugal, post near-average scores (59% and 58%).
Fig. 8 Situations related to reducing waste
Download this infographic for your presentations The infograph answers the question: “You have the feeling of reducing your waste. Which situation best corresponds to your personal case?” Unit: %. Source: Observatoire Cetelem 2022.
The horizontal bars are informative. Any icons are decorative.
Key visual elements
Three propositions are presented in the form of horizontal bars, associated with their percentage. Each proposition includes a parenthetical clarification (keeping objects longer, reselling, giving away).
Transcription of data
1. You buy as much but throw away less (keeping things longer, reselling, giving away) → 59%
2. You buy less → 32%
3. You buy more but throw away less (keeping things longer, reselling, giving away) → 9%
Main lesson
The majority declares reducing waste by changing the way objects are managed (duration of use, resale, donation) rather than modifying the quantity of purchases.
The infograph answers the question: “You have the feeling of reducing your waste. Which situation best corresponds to your personal case?” Unit: %. Source: Observatoire Cetelem 2022.
The horizontal bars are informative. Any icons are decorative.
Key visual elements
Three propositions are presented in the form of horizontal bars, associated with their percentage. Each proposition includes a parenthetical clarification (keeping objects longer, reselling, giving away).
Transcription of data
1. You buy as much but throw away less (keeping things longer, reselling, giving away) → 59%
2. You buy less → 32%
3. You buy more but throw away less (keeping things longer, reselling, giving away) → 9%
Main lesson
The majority declares reducing waste by changing the way objects are managed (duration of use, resale, donation) rather than modifying the quantity of purchases.
Earn more, spend less
And yet, more than the notion of sensible and responsible consumption, the true potential of the circular economy, and therefore its appeal, is very clear in the eyes of consumers and appears to revolve mainly around its various economic aspects.
What is the primary objective of Europeans? To earn more money (Fig. 9). Nearly 8 out of 10 Europeans see this as a reason to embrace the concept. The Portuguese and the Swedes are the most likely to be of this view (86% and 84%), while a smaller proportion of Britons and Danes are focused on the quest for financial gains (71% and 72%).
If earning more money is the “yin” of the circular economy, then spending less is evidently the “yang”, with 75% of Europeans being so minded. The Portuguese are again the keenest in this respect, along with the Hungarians (83%). The Poles and the Danes are the least frugal, with their intentions to spend less emerging as the lowest in the survey (65% and 66%). But rather than being geographical, the primary difference is generational, with 83% of over-50s planning to spend less, compared with only 65% of under-35s and 71% of 35-49 year olds.
Fig. 9 Perceived effects of second-hand purchases
Download this infographic for your presentations The infograph answers the question: “With the development of second-hand, recycled, and refurbished products, as well as the possibility of renting or repairing, do you have the feeling of… ?” Unit: %. Data is presented for all respondents, with a secondary mention of results for those under 35 and over 50. Source: Observatoire Cetelem 2022. The circular shapes (rings) are informative, and decorative graphic elements do not provide additional information.
Key visual elements
The infograph consists of three rings, each associated with a theme (buying more/less, spending more/less, earning/losing money). Each ring indicates two values: • a majority percentage, • a minority percentage.
The secondary line under each ring provides an age indication (for those under 35 or over 50).
Transcription of data
1. “Buying more / Buying less” • 44% → Buying more • 56% → Buying less Age mention: Under 35: 50% say they buy more; 50 and over: 61% say they buy less.
2. “Spending more / Spending less” • 25% → Spending more • 75% → Spending less Age mention: Under 35: 35% → spending more; 50 and over: 83% → spending less.
3. “Earning money / Losing money” • 22% → Earning money • 78% → Losing money Age mention: Under 35: 80% → earning money; 50 and over: 24% → losing money.
Main lesson
Second-hand purchases are largely perceived as allowing: • buying less, • spending less, • but also, among younger people, earning money rather than losing it.
The infograph answers the question: “With the development of second-hand, recycled, and refurbished products, as well as the possibility of renting or repairing, do you have the feeling of… ?” Unit: %. Data is presented for all respondents, with a secondary mention of results for those under 35 and over 50. Source: Observatoire Cetelem 2022. The circular shapes (rings) are informative, and decorative graphic elements do not provide additional information.
Key visual elements
The infograph consists of three rings, each associated with a theme (buying more/less, spending more/less, earning/losing money). Each ring indicates two values: • a majority percentage, • a minority percentage.
The secondary line under each ring provides an age indication (for those under 35 or over 50).
Transcription of data
1. “Buying more / Buying less” • 44% → Buying more • 56% → Buying less Age mention: Under 35: 50% say they buy more; 50 and over: 61% say they buy less.
2. “Spending more / Spending less” • 25% → Spending more • 75% → Spending less Age mention: Under 35: 35% → spending more; 50 and over: 83% → spending less.
3. “Earning money / Losing money” • 22% → Earning money • 78% → Losing money Age mention: Under 35: 80% → earning money; 50 and over: 24% → losing money.
Main lesson
Second-hand purchases are largely perceived as allowing: • buying less, • spending less, • but also, among younger people, earning money rather than losing it.
Achieving savings is a priority
The Observatoire Cetelem Barometer has highlighted the fact that, while Europeans are willing to consume more, it will not be at any price. This survey on the circular economy confirms this precautionary principle at a time when the health crisis, like the Loch Ness monster, keeps re-emerging only to dip beneath the surface once again, leading to profound and lasting changes in consumer behaviour. Thus, Europeans who buy second-hand products tend to do so to save money (52%) (Fig. 10). This financial motivation is clearly more prevalent than the desire to behave in an environmentally friendly manner (36%) or to consume more or in a more diverse way (29%). This response is most common in Portugal (63%), Slovakia (60%) and Sweden (59%), but somewhat less so in Italy (47%), Austria and the United Kingdom (48%).
Fig. 10 What do you do with the money saved when buying second-hand?
Download this infographic for your presentations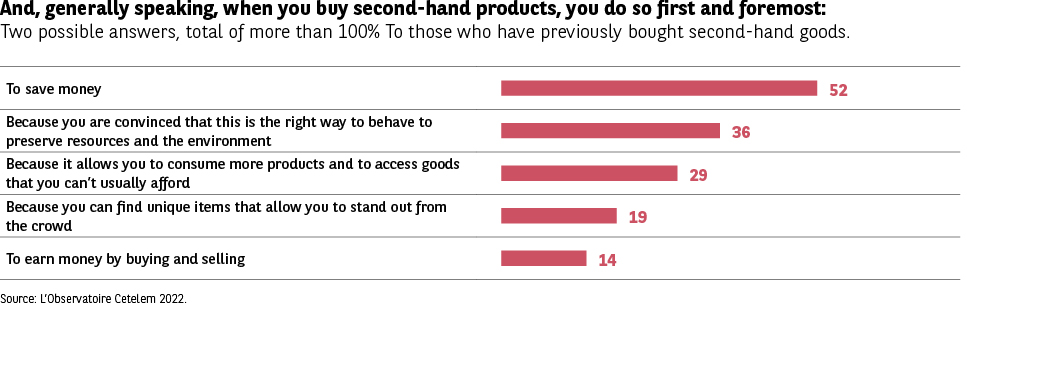 Compares two uses of money saved through second-hand purchases: reinvesting in other purchases or saving, with variations according to age.
So what will Europeans do with the money they save? First and foremost, they will use it to bolster their savings (52%), further confirmation that the desire to save remains strong in these uncertain times (see the Observatoire Cetelem Barometer) (Fig. 11). They will also use the cash to buy other products, something the under-50s are more willing to do than their elders.
However, in this area, people’s behaviours differ significantly from one country to the next. Once more, the Portuguese, but also the Belgians and the Swedes, appear most inclined to put money aside (69%, 64% and 63%). In contrast, the Bulgarians, Romanians, Hungarians and Germans seem determined to loosen their purse strings (66%, 58%, 55% and 54% respectively).
Fig. 11 Use of money saved when buying second-hand
Download this infographic for your presentations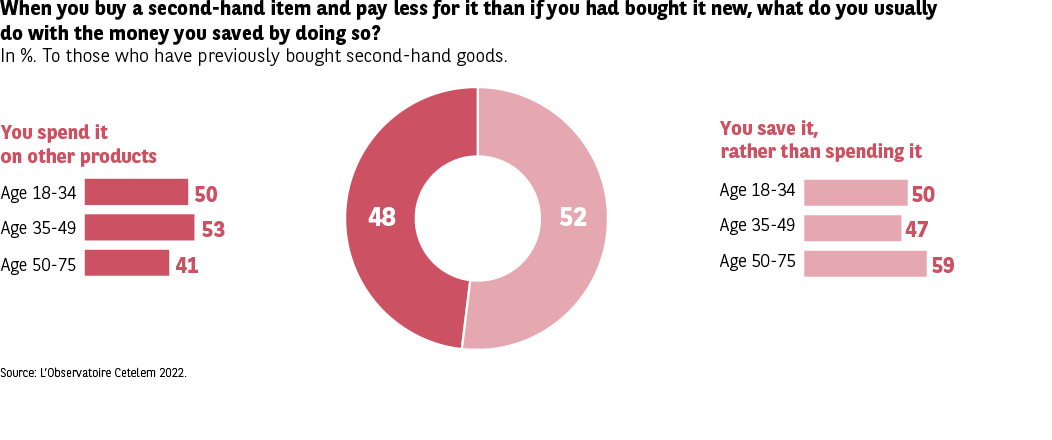 The infograph answers the question: “When you buy a second-hand product, cheaper than a new one, what do you generally do with the saved amount?” The analysis focuses on people who have already bought second-hand products. Unit: %. Source: Observatoire Cetelem 2022.
The horizontal bars and circular diagram are informative; the icon at the bottom right is decorative.
Key visual elements
The infograph is structured into three elements: • a ring diagram presenting overall results (two segments), • a column of bars indicating the percentage of people who reinvest the saved amount according to age, • another column of bars indicating the percentage of people who save the amount according to age.
Transcription of data
Overall results (ring) • 52% → You don’t spend it, it’s saved money • 48% → You spend it to buy other products
Detail by age — “You spend it to buy other products” • 18-34 years: 50% • 35-49 years: 53% • 50-75 years: 41%
Detail by age — “You don’t spend it, it’s saved money” • 18-34 years: 50% • 35-49 years: 47% • 50-75 years: 59%
Main lesson
Overall, the population is almost evenly divided between those who reinvest the saved money and those who save it. Younger people tend to reinvest more, while older people tend to save more.
The infograph answers the question: “When you buy a second-hand product, cheaper than a new one, what do you generally do with the saved amount?” The analysis focuses on people who have already bought second-hand products. Unit: %. Source: Observatoire Cetelem 2022.
The horizontal bars and circular diagram are informative; the icon at the bottom right is decorative.
Key visual elements
The infograph is structured into three elements: • a ring diagram presenting overall results (two segments), • a column of bars indicating the percentage of people who reinvest the saved amount according to age, • another column of bars indicating the percentage of people who save the amount according to age.
Transcription of data
Overall results (ring) • 52% → You don’t spend it, it’s saved money • 48% → You spend it to buy other products
Detail by age — “You spend it to buy other products” • 18-34 years: 50% • 35-49 years: 53% • 50-75 years: 41%
Detail by age — “You don’t spend it, it’s saved money” • 18-34 years: 50% • 35-49 years: 47% • 50-75 years: 59%
Main lesson
Overall, the population is almost evenly divided between those who reinvest the saved money and those who save it. Younger people tend to reinvest more, while older people tend to save more.
To the heart of the matter

Nonetheless, the purchases that such savings allow remain tethered to reason. Indeed, far from making frivolous purchases, 7 out of 10 Europeans use this money to buy products that serve their day-to-day needs or which maintain or even improve their living standards (Fig. 12). This financial prudence is particularly pronounced in Bulgaria and Hungary, while respondents in Belgium and the three Nordic countries are a little more moderate, but still exercise a relatively high degree of cautious consumerism.
Fig. 12 Types of purchases made with saved money
Download this infographic for your presentations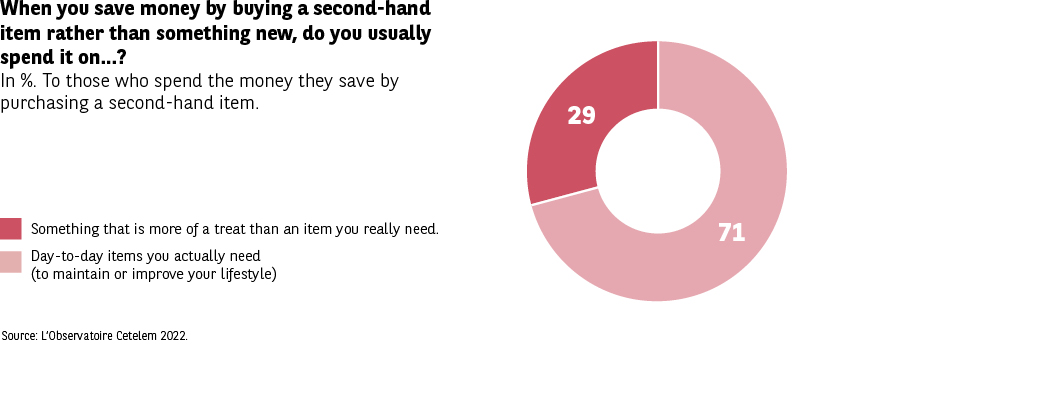 The infograph answers the question: “Regarding the amount saved by buying a second-hand product rather than a new one, do you spend it on… ?” The analysis focuses on people who actually spend the saved money. Unit: %. Source: Observatoire Cetelem 2022.
The circular diagram (ring) is informative; decorative graphic elements do not provide additional data.
Key visual elements
A segmented ring presents two categories: • pleasure purchase not necessary, • necessary purchase related to daily life.
The two segments display their percentages.
Transcription of data • 71% → Buying something that gives you pleasure but is not necessarily needed • 29% → Buying something you need for your daily life (maintaining or improving your standard of living)
Main lesson
The majority uses the saved money to treat themselves rather than for a necessary purchase.
The infograph answers the question: “Regarding the amount saved by buying a second-hand product rather than a new one, do you spend it on… ?” The analysis focuses on people who actually spend the saved money. Unit: %. Source: Observatoire Cetelem 2022.
The circular diagram (ring) is informative; decorative graphic elements do not provide additional data.
Key visual elements
A segmented ring presents two categories: • pleasure purchase not necessary, • necessary purchase related to daily life.
The two segments display their percentages.
Transcription of data • 71% → Buying something that gives you pleasure but is not necessarily needed • 29% → Buying something you need for your daily life (maintaining or improving your standard of living)
Main lesson
The majority uses the saved money to treat themselves rather than for a necessary purchase.