A must-have item


Although there have been signs in recent years that car sales are running out of steam, and not only because of the Covid crisis, motorists still seem unwilling to live without a vehicle, despite the financial burden that purchasing and using a car entails. The main driver of these budgetary tensions is fuel, with prices at the pump having risen dramatically. This new 2023 edition of L’Observatoire Cetelem de l’Automobile demonstrates that people are prepared to travel less to avoid too much financial suffering, but also that they do not want to be alone in taking action.
General context
A struggling market
Could the golden age of the automobile be behind us, at least in terms of sales? This is the message one might take away after glancing at global new passenger vehicle sales over the last few years. The curve illustrating these figures since 2005 appears to have peaked in 2017, when around 70 million units were sold (Fig 1). The sales bounce observed in 2021, following the Covid crash of 2020, has failed to mask the market’s decline. What’s more, supply chains are not expected to return to normal in the foreseeable future, particularly when it comes to semi-conductors and vehicle deliveries.
Fig 1 – Global sales of new passenger cars 2005–2023
Download this infographic for your presentations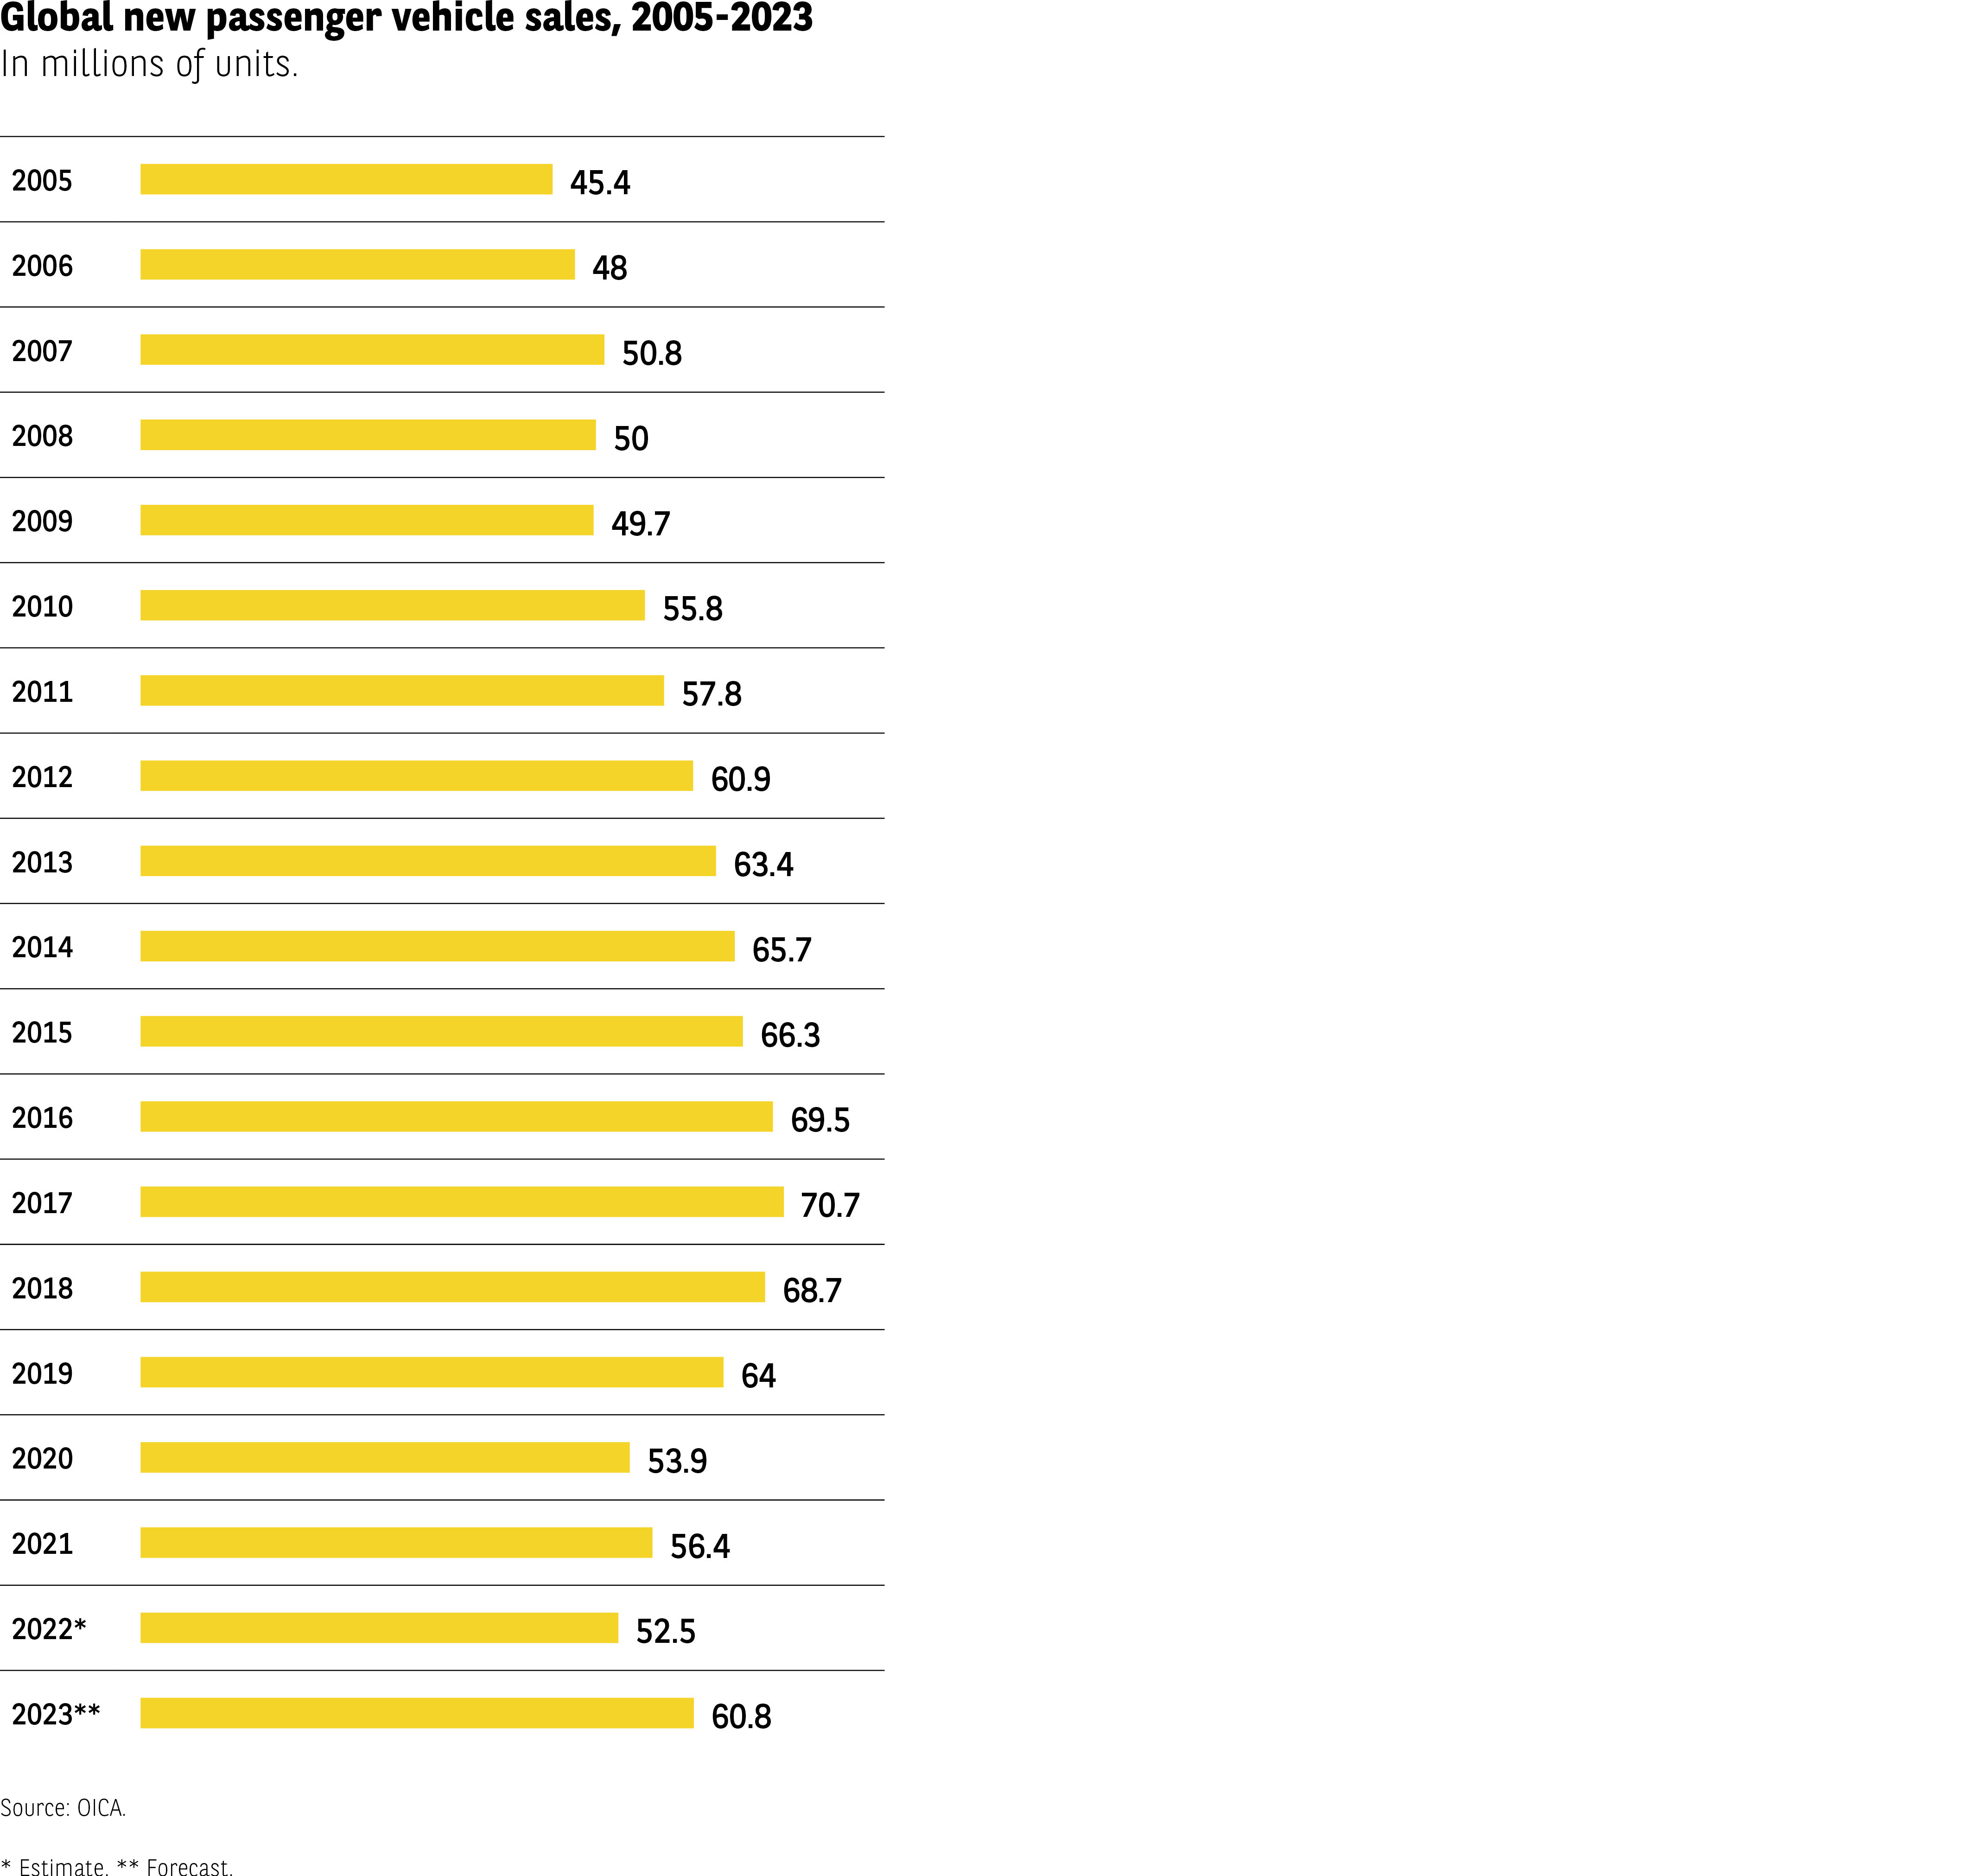 The infographic displays the evolution of global sales of new passenger vehicles between 2005 and 2023, expressed in millions of units.
Data:
2005: 45.4 million
2006: 48
2007: 50.8
2008: 50
2009: 49.7
2010: 55.8
2011: 57.8
2012: 60.9
2013: 63.4
2014: 65.7
2015: 66.3
2016: 69.5
2017: 70.7
2018: 68.7
2019: 64
2020: 53.9
2021: 56.4
2022*: 52.5 (estimate)
2023**: 60.8 (forecast)
Overall, the data shows a steady increase from 2005 to 2017, when sales peak at 70.7 million units. The following years show a gradual decline, with a significant drop in 2020 (53.9 million), then a partial recovery. The values for 2022 and 2023 are labelled as estimate and forecast.
Source: OICA.
The infographic displays the evolution of global sales of new passenger vehicles between 2005 and 2023, expressed in millions of units.
Data:
2005: 45.4 million
2006: 48
2007: 50.8
2008: 50
2009: 49.7
2010: 55.8
2011: 57.8
2012: 60.9
2013: 63.4
2014: 65.7
2015: 66.3
2016: 69.5
2017: 70.7
2018: 68.7
2019: 64
2020: 53.9
2021: 56.4
2022*: 52.5 (estimate)
2023**: 60.8 (forecast)
Overall, the data shows a steady increase from 2005 to 2017, when sales peak at 70.7 million units. The following years show a gradual decline, with a significant drop in 2020 (53.9 million), then a partial recovery. The values for 2022 and 2023 are labelled as estimate and forecast.
Source: OICA.
China and the United States, the world’s two largest markets, saw their sales peak in 2017 (25 million vehicles sold) and 2016 (18 million), respectively. This was followed by a sharp drop that cannot be blamed solely on the Covid pandemic (Fig 2).
Fig 2 – New vehicle sales in China and the United States from 2005 to 2021
Download this infographic for your presentations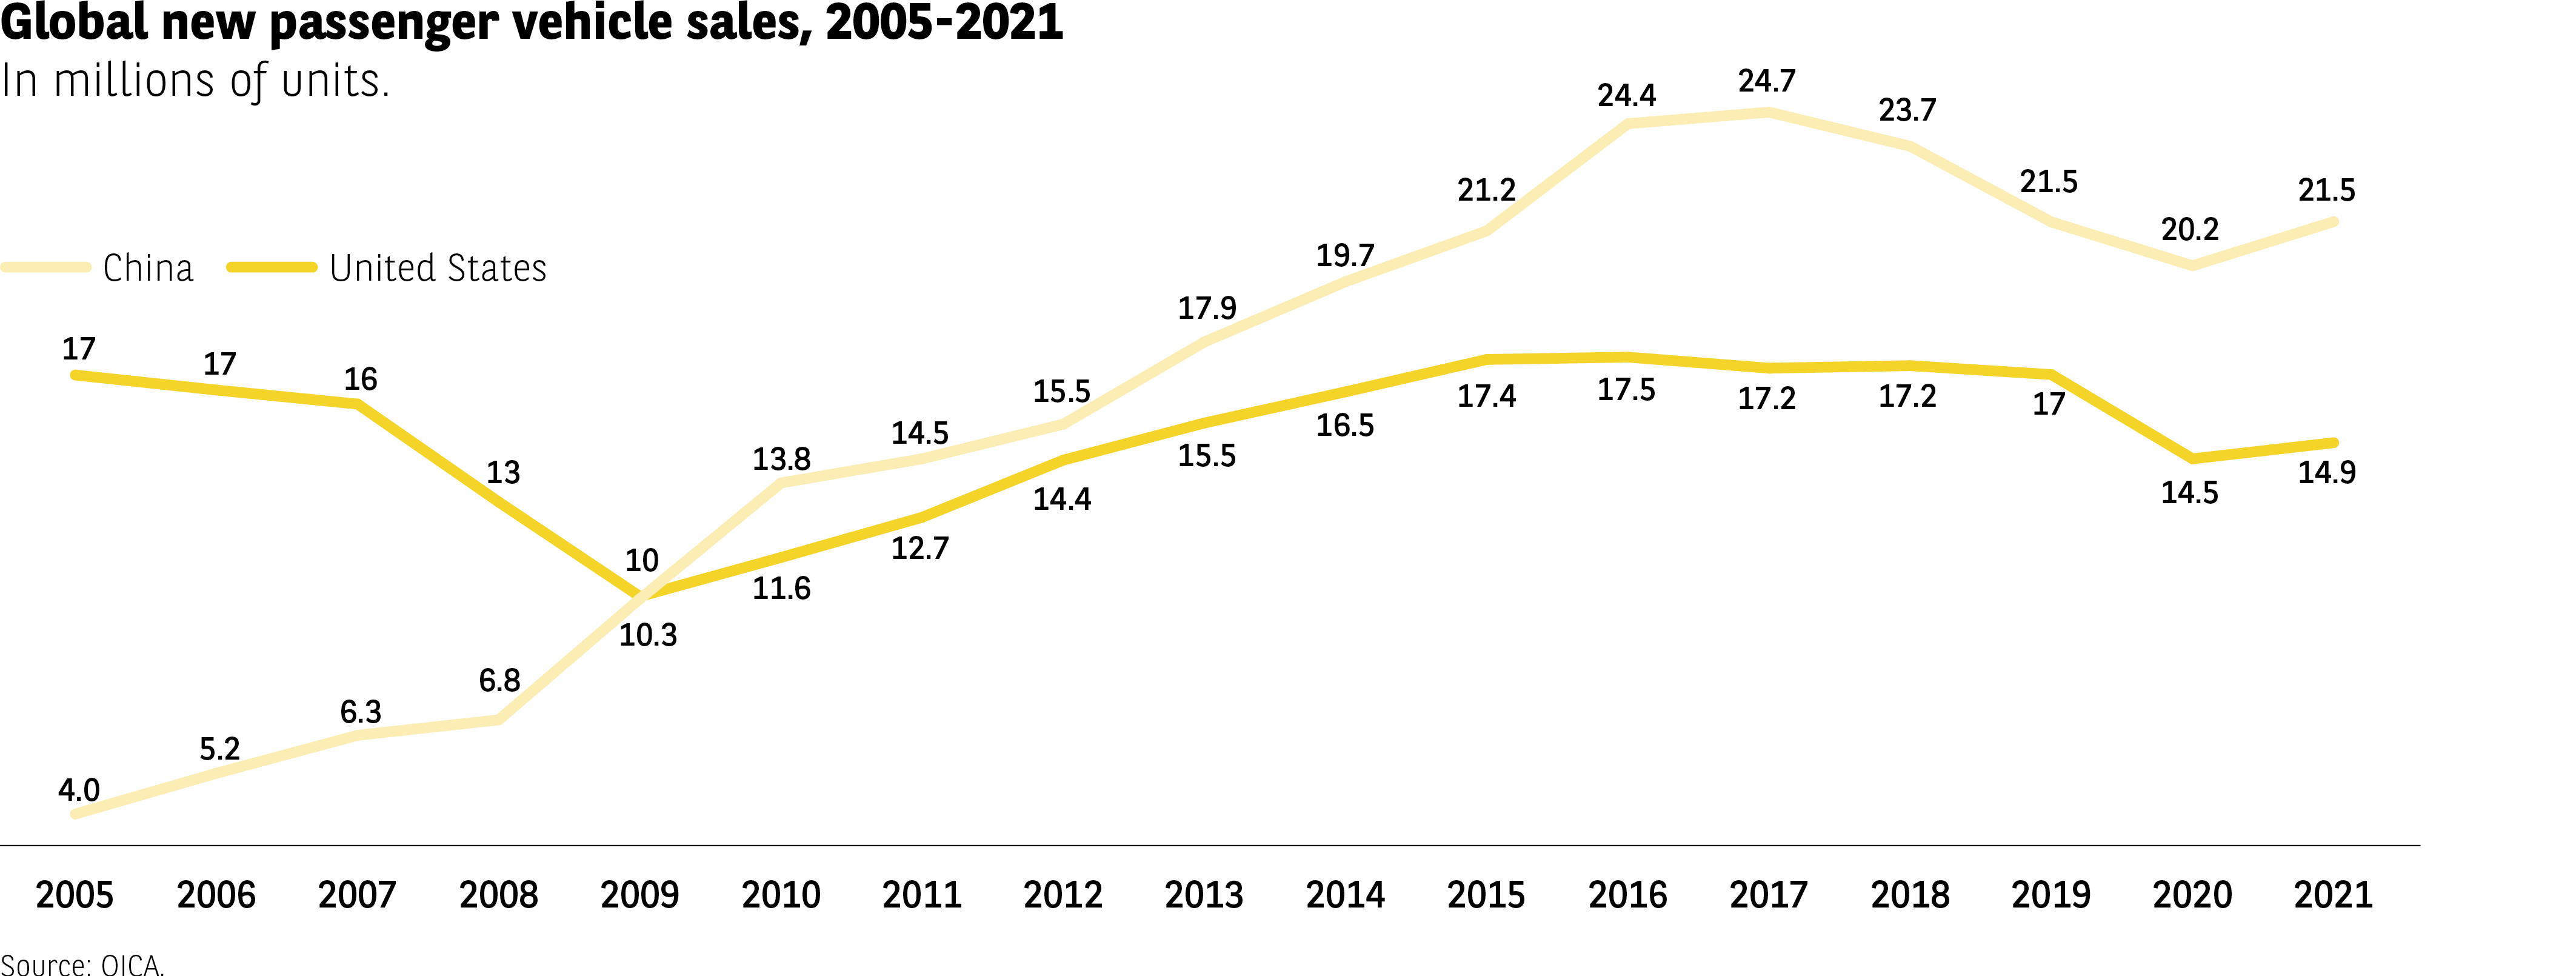 The infographic compares annual sales of new passenger vehicles in China and the United States between 2005 and 2021, in millions of units.
China
2005: 4.0
2006: 5.2
2007: 6.3
2008: 6.8
2009: 10
2010: 13.8
2011: 14.5
2012: 15.5
2013: 17.9
2014: 19.7
2015: 21.2
2016: 24.4
2017: 24.7
2018: 23.7
2019: 21.5
2020: 20.2
2021: 21.5
United States
2005: 17
2006: 17
2007: 16
2008: 13
2009: 10.3
2010: 11.6
2011: 12.7
2012: 14.4
2013: 15.5
2014: 16.5
2015: 17.4
2016: 17.5
2017: 17.2
2018: 17.2
2019: 17
2020: 14.5
2021: 14.9
The two series start from very different levels in 2005 (China: 4 million units / United States: 17 million units). China experienced rapid growth between 2005 and 2017, with a peak around 24–25 million units. After 2017, Chinese sales decrease but remain significantly higher than the starting level.
The United States show a notable decrease between 2005 and 2009, then a progressive increase until 2016, followed by a stabilization around 17 million units before a new decrease in 2020.
Source: OICA
The infographic compares annual sales of new passenger vehicles in China and the United States between 2005 and 2021, in millions of units.
China
2005: 4.0
2006: 5.2
2007: 6.3
2008: 6.8
2009: 10
2010: 13.8
2011: 14.5
2012: 15.5
2013: 17.9
2014: 19.7
2015: 21.2
2016: 24.4
2017: 24.7
2018: 23.7
2019: 21.5
2020: 20.2
2021: 21.5
United States
2005: 17
2006: 17
2007: 16
2008: 13
2009: 10.3
2010: 11.6
2011: 12.7
2012: 14.4
2013: 15.5
2014: 16.5
2015: 17.4
2016: 17.5
2017: 17.2
2018: 17.2
2019: 17
2020: 14.5
2021: 14.9
The two series start from very different levels in 2005 (China: 4 million units / United States: 17 million units). China experienced rapid growth between 2005 and 2017, with a peak around 24–25 million units. After 2017, Chinese sales decrease but remain significantly higher than the starting level.
The United States show a notable decrease between 2005 and 2009, then a progressive increase until 2016, followed by a stabilization around 17 million units before a new decrease in 2020.
Source: OICA
The situation has been less clear cut in Europe, Japan and Brazil, but the overall picture is more or less the same. Indeed, all the countries surveyed posted their highest sales figures before 2021, with fortunes varying from one year to the next (Fig 3).
Fig 3 – New passenger vehicle sales by countries from 2005 to 2021
Download this infographic for your presentations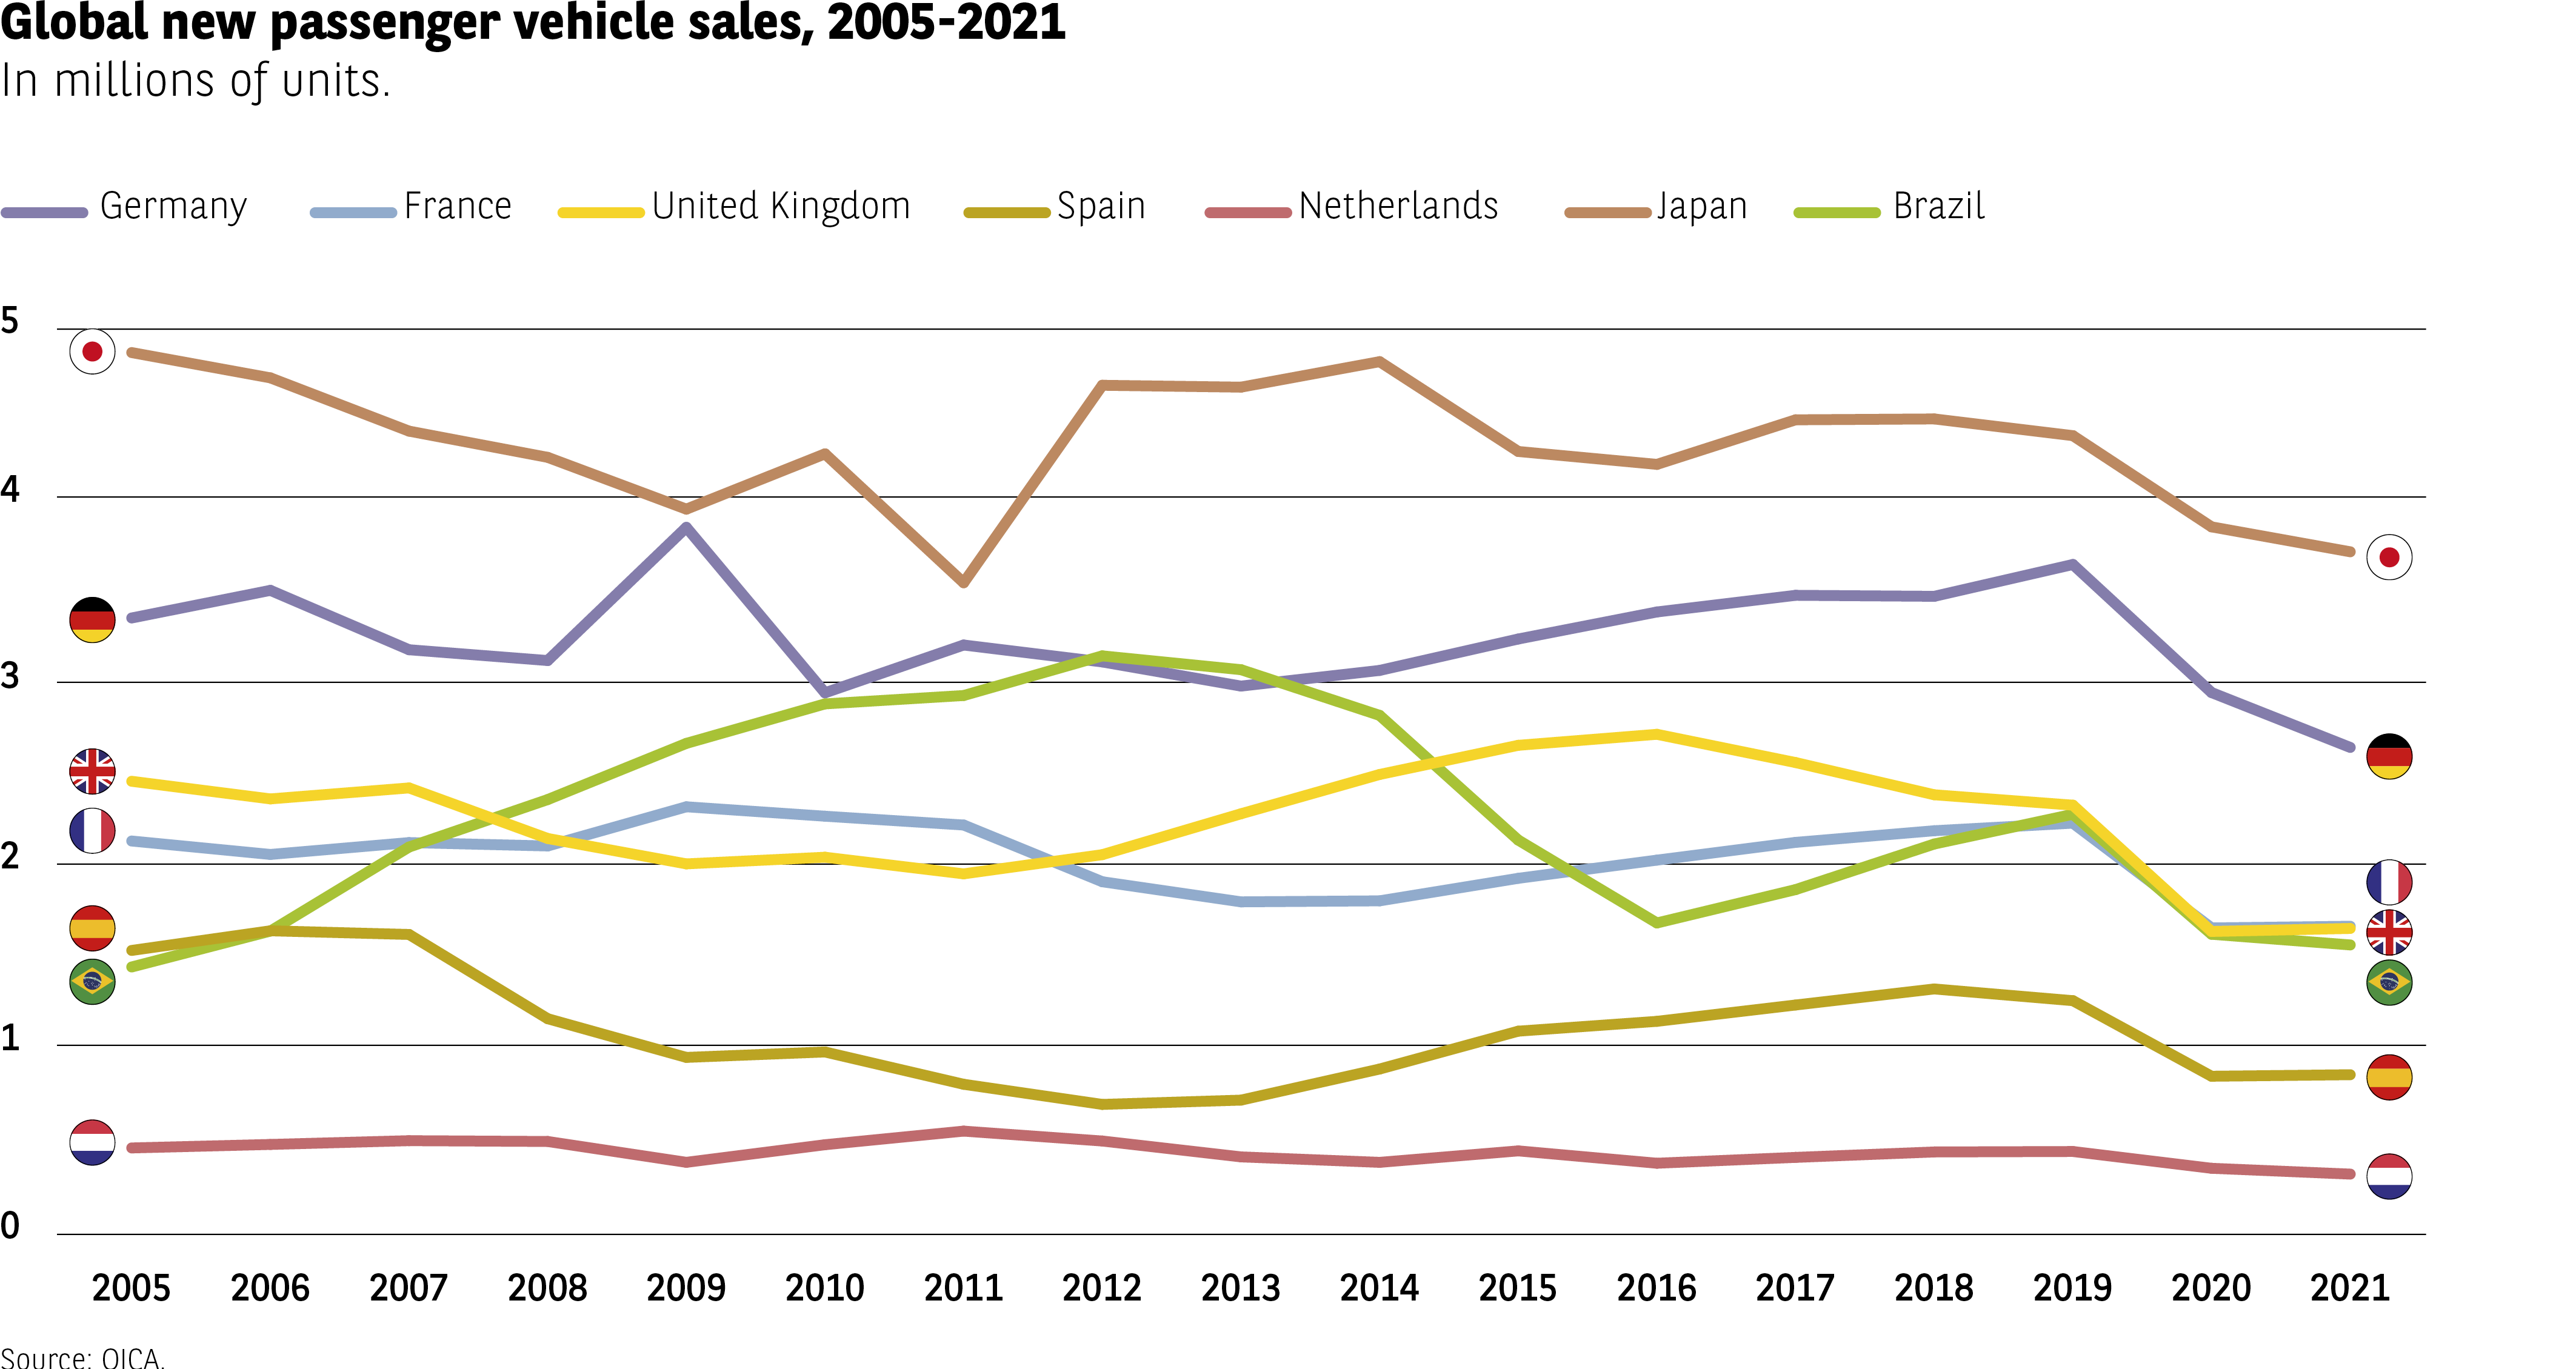 The infographic shows annual sales of new passenger vehicles, in millions of units, between 2005 and 2021 for seven countries: Germany, France, the United Kingdom, Spain, the Netherlands, Japan, and Brazil.
Country data (in millions of units):
Japan
2005: 4.8
2006: 4.7
2007: 4.4
2008: 4.1
2009: 3.9
2010: 4.2
2011: 4.4
2012: 4.4
2013: 4.6
2014: 4.7
2015: 4.2
2016: 4.1
2017: 4.4
2018: 4.3
2019: 4.0
2020: 3.7
2021: 3.8
Germany
2005: 3.3
2006: 3.5
2007: 3.1
2008: 3.1
2009: 3.8
2010: 3.2
2011: 3.3
2012: 3.1
2013: 3.0
2014: 3.2
2015: 3.2
2016: 3.3
2017: 3.4
2018: 3.4
2019: 3.6
2020: 2.9
2021: 2.6
United Kingdom
2005: 2.4
2006: 2.3
2007: 2.4
2008: 2.1
2009: 2.0
2010: 2.1
2011: 1.9
2012: 1.9
2013: 2.3
2014: 2.5
2015: 2.6
2016: 2.7
2017: 2.5
2018: 2.4
2019: 2.3
2020: 1.6
2021: 1.7
France
2005: 2.1
2006: 2.0
2007: 2.1
2008: 2.0
2009: 2.1
2010: 2.3
2011: 2.2
2012: 2.0
2013: 1.8
2014: 1.8
2015: 1.9
2016: 2.0
2017: 2.1
2018: 2.2
2019: 2.2
2020: 1.7
2021: 1.7
Brazil
2005: 1.4
2006: 1.8
2007: 2.2
2008: 2.4
2009: 2.6
2010: 3.0
2011: 3.1
2012: 3.0
2013: 3.0
2014: 2.8
2015: 2.5
2016: 2.0
2017: 2.1
2018: 2.3
2019: 2.1
2020: 1.7
2021: 1.6
Spain
2005: 1.5
2006: 1.6
2007: 1.6
2008: 1.2
2009: 1.1
2010: 0.9
2011: 0.8
2012: 0.7
2013: 0.7
2014: 0.9
2015: 1.0
2016: 1.1
2017: 1.2
2018: 1.2
2019: 1.3
2020: 0.9
2021: 0.9
Netherlands
2005: 0.5
2006: 0.5
2007: 0.5
2008: 0.4
2009: 0.5
2010: 0.6
2011: 0.6
2012: 0.5
2013: 0.4
2014: 0.4
2015: 0.4
2016: 0.4
2017: 0.4
2018: 0.4
2019: 0.4
2020: 0.3
2021: 0.3
Japan remains the largest market in the group throughout the period, though on a general downward trend.
Germany is second, stable around 3 to 3.5 million units until 2019, then declining.
The UK and France display similar volumes (1.8 to 2.6 million units), with a sharp drop in 2020.
Brazil grows rapidly until 2010, then declines steadily after 2014.
Spain drops sharply from 2007 to 2013 before recovering moderately.
The Netherlands remain around 0.4–0.6 million units, with a gradual decline at the end.
Source: OICA
The infographic shows annual sales of new passenger vehicles, in millions of units, between 2005 and 2021 for seven countries: Germany, France, the United Kingdom, Spain, the Netherlands, Japan, and Brazil.
Country data (in millions of units):
Japan
2005: 4.8
2006: 4.7
2007: 4.4
2008: 4.1
2009: 3.9
2010: 4.2
2011: 4.4
2012: 4.4
2013: 4.6
2014: 4.7
2015: 4.2
2016: 4.1
2017: 4.4
2018: 4.3
2019: 4.0
2020: 3.7
2021: 3.8
Germany
2005: 3.3
2006: 3.5
2007: 3.1
2008: 3.1
2009: 3.8
2010: 3.2
2011: 3.3
2012: 3.1
2013: 3.0
2014: 3.2
2015: 3.2
2016: 3.3
2017: 3.4
2018: 3.4
2019: 3.6
2020: 2.9
2021: 2.6
United Kingdom
2005: 2.4
2006: 2.3
2007: 2.4
2008: 2.1
2009: 2.0
2010: 2.1
2011: 1.9
2012: 1.9
2013: 2.3
2014: 2.5
2015: 2.6
2016: 2.7
2017: 2.5
2018: 2.4
2019: 2.3
2020: 1.6
2021: 1.7
France
2005: 2.1
2006: 2.0
2007: 2.1
2008: 2.0
2009: 2.1
2010: 2.3
2011: 2.2
2012: 2.0
2013: 1.8
2014: 1.8
2015: 1.9
2016: 2.0
2017: 2.1
2018: 2.2
2019: 2.2
2020: 1.7
2021: 1.7
Brazil
2005: 1.4
2006: 1.8
2007: 2.2
2008: 2.4
2009: 2.6
2010: 3.0
2011: 3.1
2012: 3.0
2013: 3.0
2014: 2.8
2015: 2.5
2016: 2.0
2017: 2.1
2018: 2.3
2019: 2.1
2020: 1.7
2021: 1.6
Spain
2005: 1.5
2006: 1.6
2007: 1.6
2008: 1.2
2009: 1.1
2010: 0.9
2011: 0.8
2012: 0.7
2013: 0.7
2014: 0.9
2015: 1.0
2016: 1.1
2017: 1.2
2018: 1.2
2019: 1.3
2020: 0.9
2021: 0.9
Netherlands
2005: 0.5
2006: 0.5
2007: 0.5
2008: 0.4
2009: 0.5
2010: 0.6
2011: 0.6
2012: 0.5
2013: 0.4
2014: 0.4
2015: 0.4
2016: 0.4
2017: 0.4
2018: 0.4
2019: 0.4
2020: 0.3
2021: 0.3
Japan remains the largest market in the group throughout the period, though on a general downward trend.
Germany is second, stable around 3 to 3.5 million units until 2019, then declining.
The UK and France display similar volumes (1.8 to 2.6 million units), with a sharp drop in 2020.
Brazil grows rapidly until 2010, then declines steadily after 2014.
Spain drops sharply from 2007 to 2013 before recovering moderately.
The Netherlands remain around 0.4–0.6 million units, with a gradual decline at the end.
Source: OICA
The ever-rising price of new vehicles
While sales volumes have fallen, the same cannot be said for the price of new cars. In most of the countries covered by this survey, prices have been rising steadily for almost a decade, with increases of over 20% in China, the US and the UK. In France, Germany and Spain, price rises have been more gradual, but they remain significant (7%, 9% and 7% respectively). Only in Brazil and Japan, where trends have been strikingly similar, has the price curve remained relatively flat in recent years, after a sharp increase in 2015 (Fig 4).
Fig 4 – Change in the average new vehicle price trends 2013–2021
Download this infographic for your presentations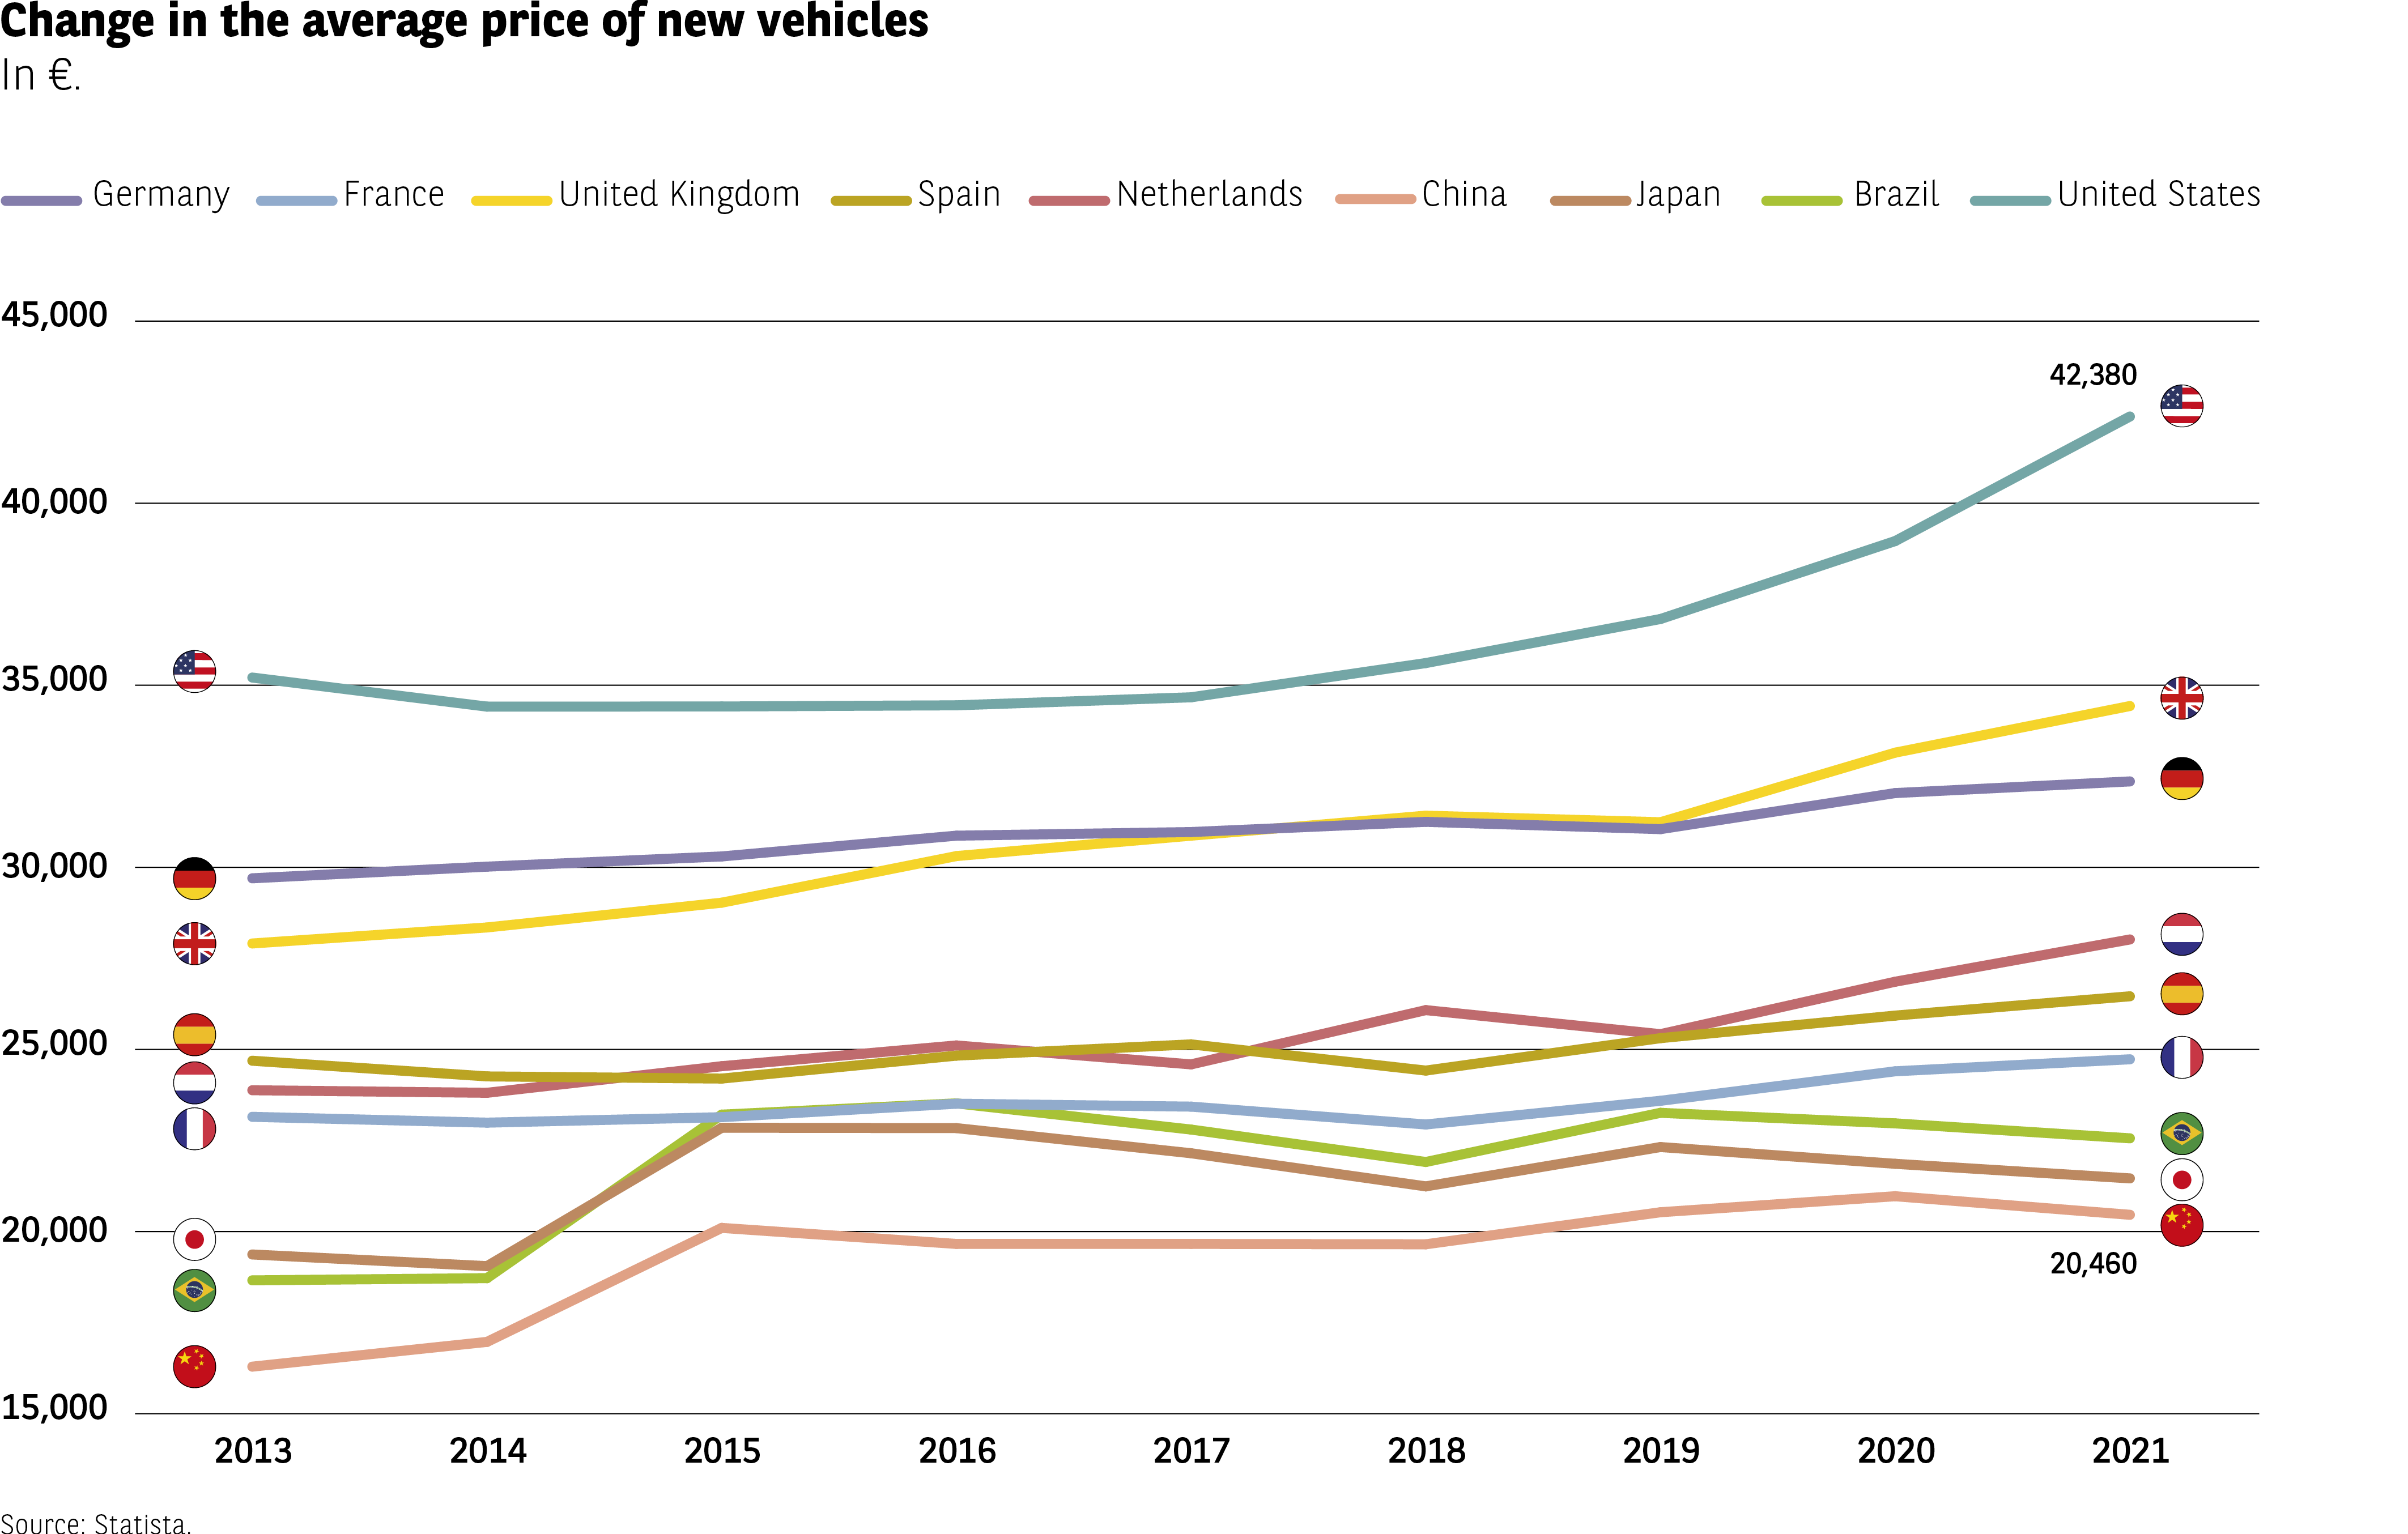 The infographic shows the evolution of the average price of new vehicles from 2013 to 2021 for ten countries: Germany, France, the United Kingdom, Spain, the Netherlands, China, Japan, Brazil, and the United States.
Country data (in euros):
United States
2013: 35,000
2014: 34,000
2015: 34,000
2016: 35,000
2017: 36,000
2018: 37,000
2019: 39,000
2020: 41,000
2021: 42,380
United Kingdom
2013: 27,000
2014: 28,000
2015: 29,000
2016: 30,000
2017: 30,500
2018: 30,500
2019: 31,000
2020: 33,000
2021: 34,500
Germany
2013: 29,000
2014: 29,500
2015: 30,000
2016: 30,000
2017: 30,500
2018: 30,500
2019: 31,000
2020: 31,000
2021: 32,000
France
2013: 24,500
2014: 24,000
2015: 24,000
2016: 24,000
2017: 23,000
2018: 23,500
2019: 24,000
2020: 24,000
2021: 25,000
Spain
2013: 24,000
2014: 24,000
2015: 24,500
2016: 25,000
2017: 25,000
2018: 24,000
2019: 24,000
2020: 25,000
2021: 26,000
Netherlands
2013: 23,000
2014: 23,000
2015: 24,000
2016: 25,000
2017: 24,000
2018: 25,000
2019: 26,000
2020: 27,000
2021: 27,500
Brazil
2013: 19,000
2014: 18,500
2015: 20,000
2016: 21,000
2017: 21,000
2018: 20,000
2019: 20,000
2020: 21,500
2021: 22,000
Japan
2013: 18,000
2014: 18,000
2015: 19,000
2016: 19,000
2017: 18,500
2018: 19,000
2019: 19,500
2020: 20,000
2021: 20,000
China
2013: 15,000
2014: 16,000
2015: 19,000
2016: 20,000
2017: 20,000
2018: 19,000
2019: 19,000
2020: 20,000
2021: 20,460
The United States is the country where prices increase the most over the period.
European countries show a gradual but moderate rise.
China and Brazil start from lower levels but increase steadily.
Source: Statista
The infographic shows the evolution of the average price of new vehicles from 2013 to 2021 for ten countries: Germany, France, the United Kingdom, Spain, the Netherlands, China, Japan, Brazil, and the United States.
Country data (in euros):
United States
2013: 35,000
2014: 34,000
2015: 34,000
2016: 35,000
2017: 36,000
2018: 37,000
2019: 39,000
2020: 41,000
2021: 42,380
United Kingdom
2013: 27,000
2014: 28,000
2015: 29,000
2016: 30,000
2017: 30,500
2018: 30,500
2019: 31,000
2020: 33,000
2021: 34,500
Germany
2013: 29,000
2014: 29,500
2015: 30,000
2016: 30,000
2017: 30,500
2018: 30,500
2019: 31,000
2020: 31,000
2021: 32,000
France
2013: 24,500
2014: 24,000
2015: 24,000
2016: 24,000
2017: 23,000
2018: 23,500
2019: 24,000
2020: 24,000
2021: 25,000
Spain
2013: 24,000
2014: 24,000
2015: 24,500
2016: 25,000
2017: 25,000
2018: 24,000
2019: 24,000
2020: 25,000
2021: 26,000
Netherlands
2013: 23,000
2014: 23,000
2015: 24,000
2016: 25,000
2017: 24,000
2018: 25,000
2019: 26,000
2020: 27,000
2021: 27,500
Brazil
2013: 19,000
2014: 18,500
2015: 20,000
2016: 21,000
2017: 21,000
2018: 20,000
2019: 20,000
2020: 21,500
2021: 22,000
Japan
2013: 18,000
2014: 18,000
2015: 19,000
2016: 19,000
2017: 18,500
2018: 19,000
2019: 19,500
2020: 20,000
2021: 20,000
China
2013: 15,000
2014: 16,000
2015: 19,000
2016: 20,000
2017: 20,000
2018: 19,000
2019: 19,000
2020: 20,000
2021: 20,460
The United States is the country where prices increase the most over the period.
European countries show a gradual but moderate rise.
China and Brazil start from lower levels but increase steadily.
Source: Statista
Wide variations in average prices
Against this backdrop of rising prices, the average sum paid by the motorists surveyed for this edition of L’Observatoire Cetelem is €16,181, a figure that is slightly higher in Europe (€16,712). This narrow difference between the two main geographical regions under consideration, Europe and “the rest of the world”, can be largely explained by the very high average price of €27,794 observed in China, the world’s largest market (Fig 5).
Fig 5 – Vehicle purchase price by country
Download this infographic for your presentations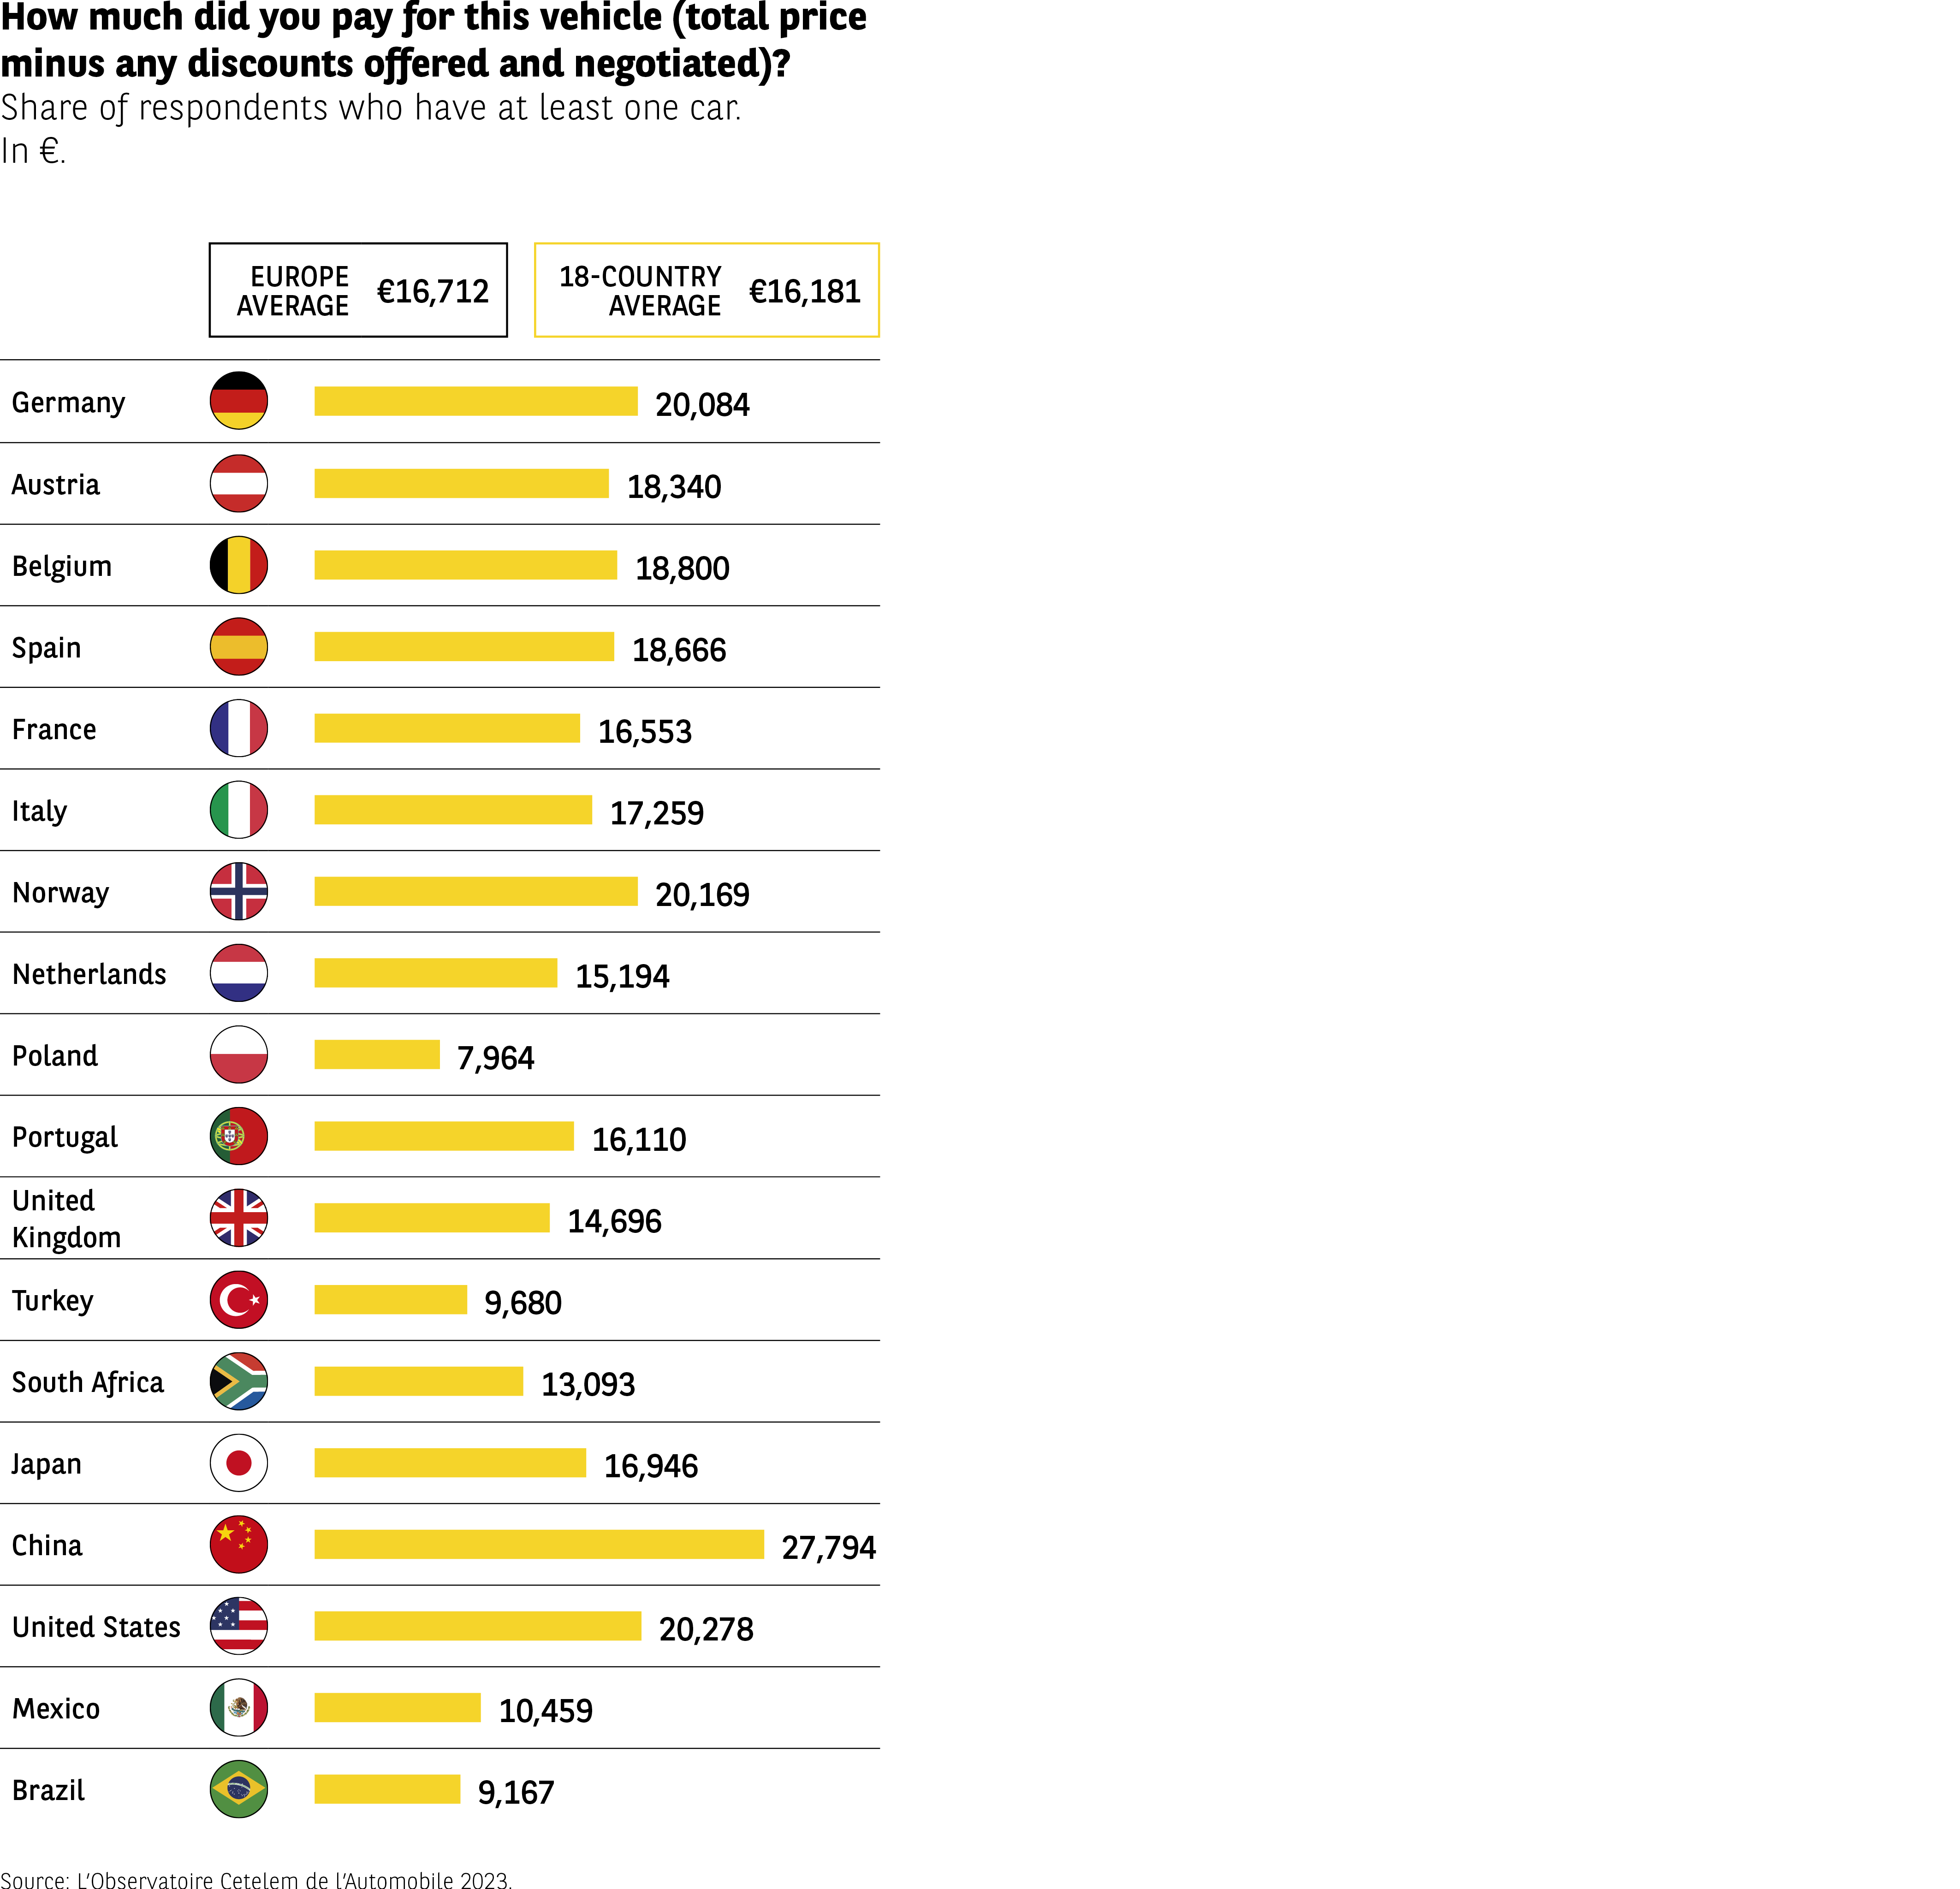 The infographic shows the actual average price paid for a vehicle (including all discounts and negotiations) across 18 countries.
Reference values:
– Europe average: €16,712
– Average across 18 countries: €16,181
Country data (in euros):
Germany: 20,084
Austria: 18,340
Belgium: 18,800
Spain: 18,666
France: 16,553
Italy: 17,259
Norway: 20,169
Netherlands: 15,194
Poland: 7,964
Portugal: 16,110
United Kingdom: 14,696
Turkey: 9,680
South Africa: 13,093
Japan: 16,946
China: 27,794
United States: 20,278
Mexico: 10,459
Brazil: 9,167
China has the highest average price (€27,794).
Poland, Brazil, and Turkey have the lowest prices.
Western Europe (Germany, Belgium, Norway) is generally above both averages.
Source: Observatoire Cetelem de l’Automobile 2023
The infographic shows the actual average price paid for a vehicle (including all discounts and negotiations) across 18 countries.
Reference values:
– Europe average: €16,712
– Average across 18 countries: €16,181
Country data (in euros):
Germany: 20,084
Austria: 18,340
Belgium: 18,800
Spain: 18,666
France: 16,553
Italy: 17,259
Norway: 20,169
Netherlands: 15,194
Poland: 7,964
Portugal: 16,110
United Kingdom: 14,696
Turkey: 9,680
South Africa: 13,093
Japan: 16,946
China: 27,794
United States: 20,278
Mexico: 10,459
Brazil: 9,167
China has the highest average price (€27,794).
Poland, Brazil, and Turkey have the lowest prices.
Western Europe (Germany, Belgium, Norway) is generally above both averages.
Source: Observatoire Cetelem de l’Automobile 2023
This is a relatively new market in which new-car sales have been particularly strong compared to other countries. With the exception of Poland, the European country where the average price of a vehicle is the lowest (€7,964), one must head to the emerging economies of Brazil, Mexico and Turkey to find the lowest average prices. In contrast, Germany, where large saloon cars reign, Norway, where electric cars are king, and the United States, the world’s second largest market, post an average price of over €20,000. At €16,553, France is in line with the average figure.
A weighty price
The 2022 edition of L’Observatoire Cetelem focused on the SUV craze. This is a class of vehicle whose weight is an inherent characteristic. Given that this edition centres on costs, we thought it would be interesting to examine how the price per kilogramme of vehicles has evolved over the last few years. Isn’t this the ratio to which consumers refer when they do their food shopping (Fig 6) ?
Fig 6 – Evolution of price per kilo of a car from 2001 to 2020
Download this infographic for your presentations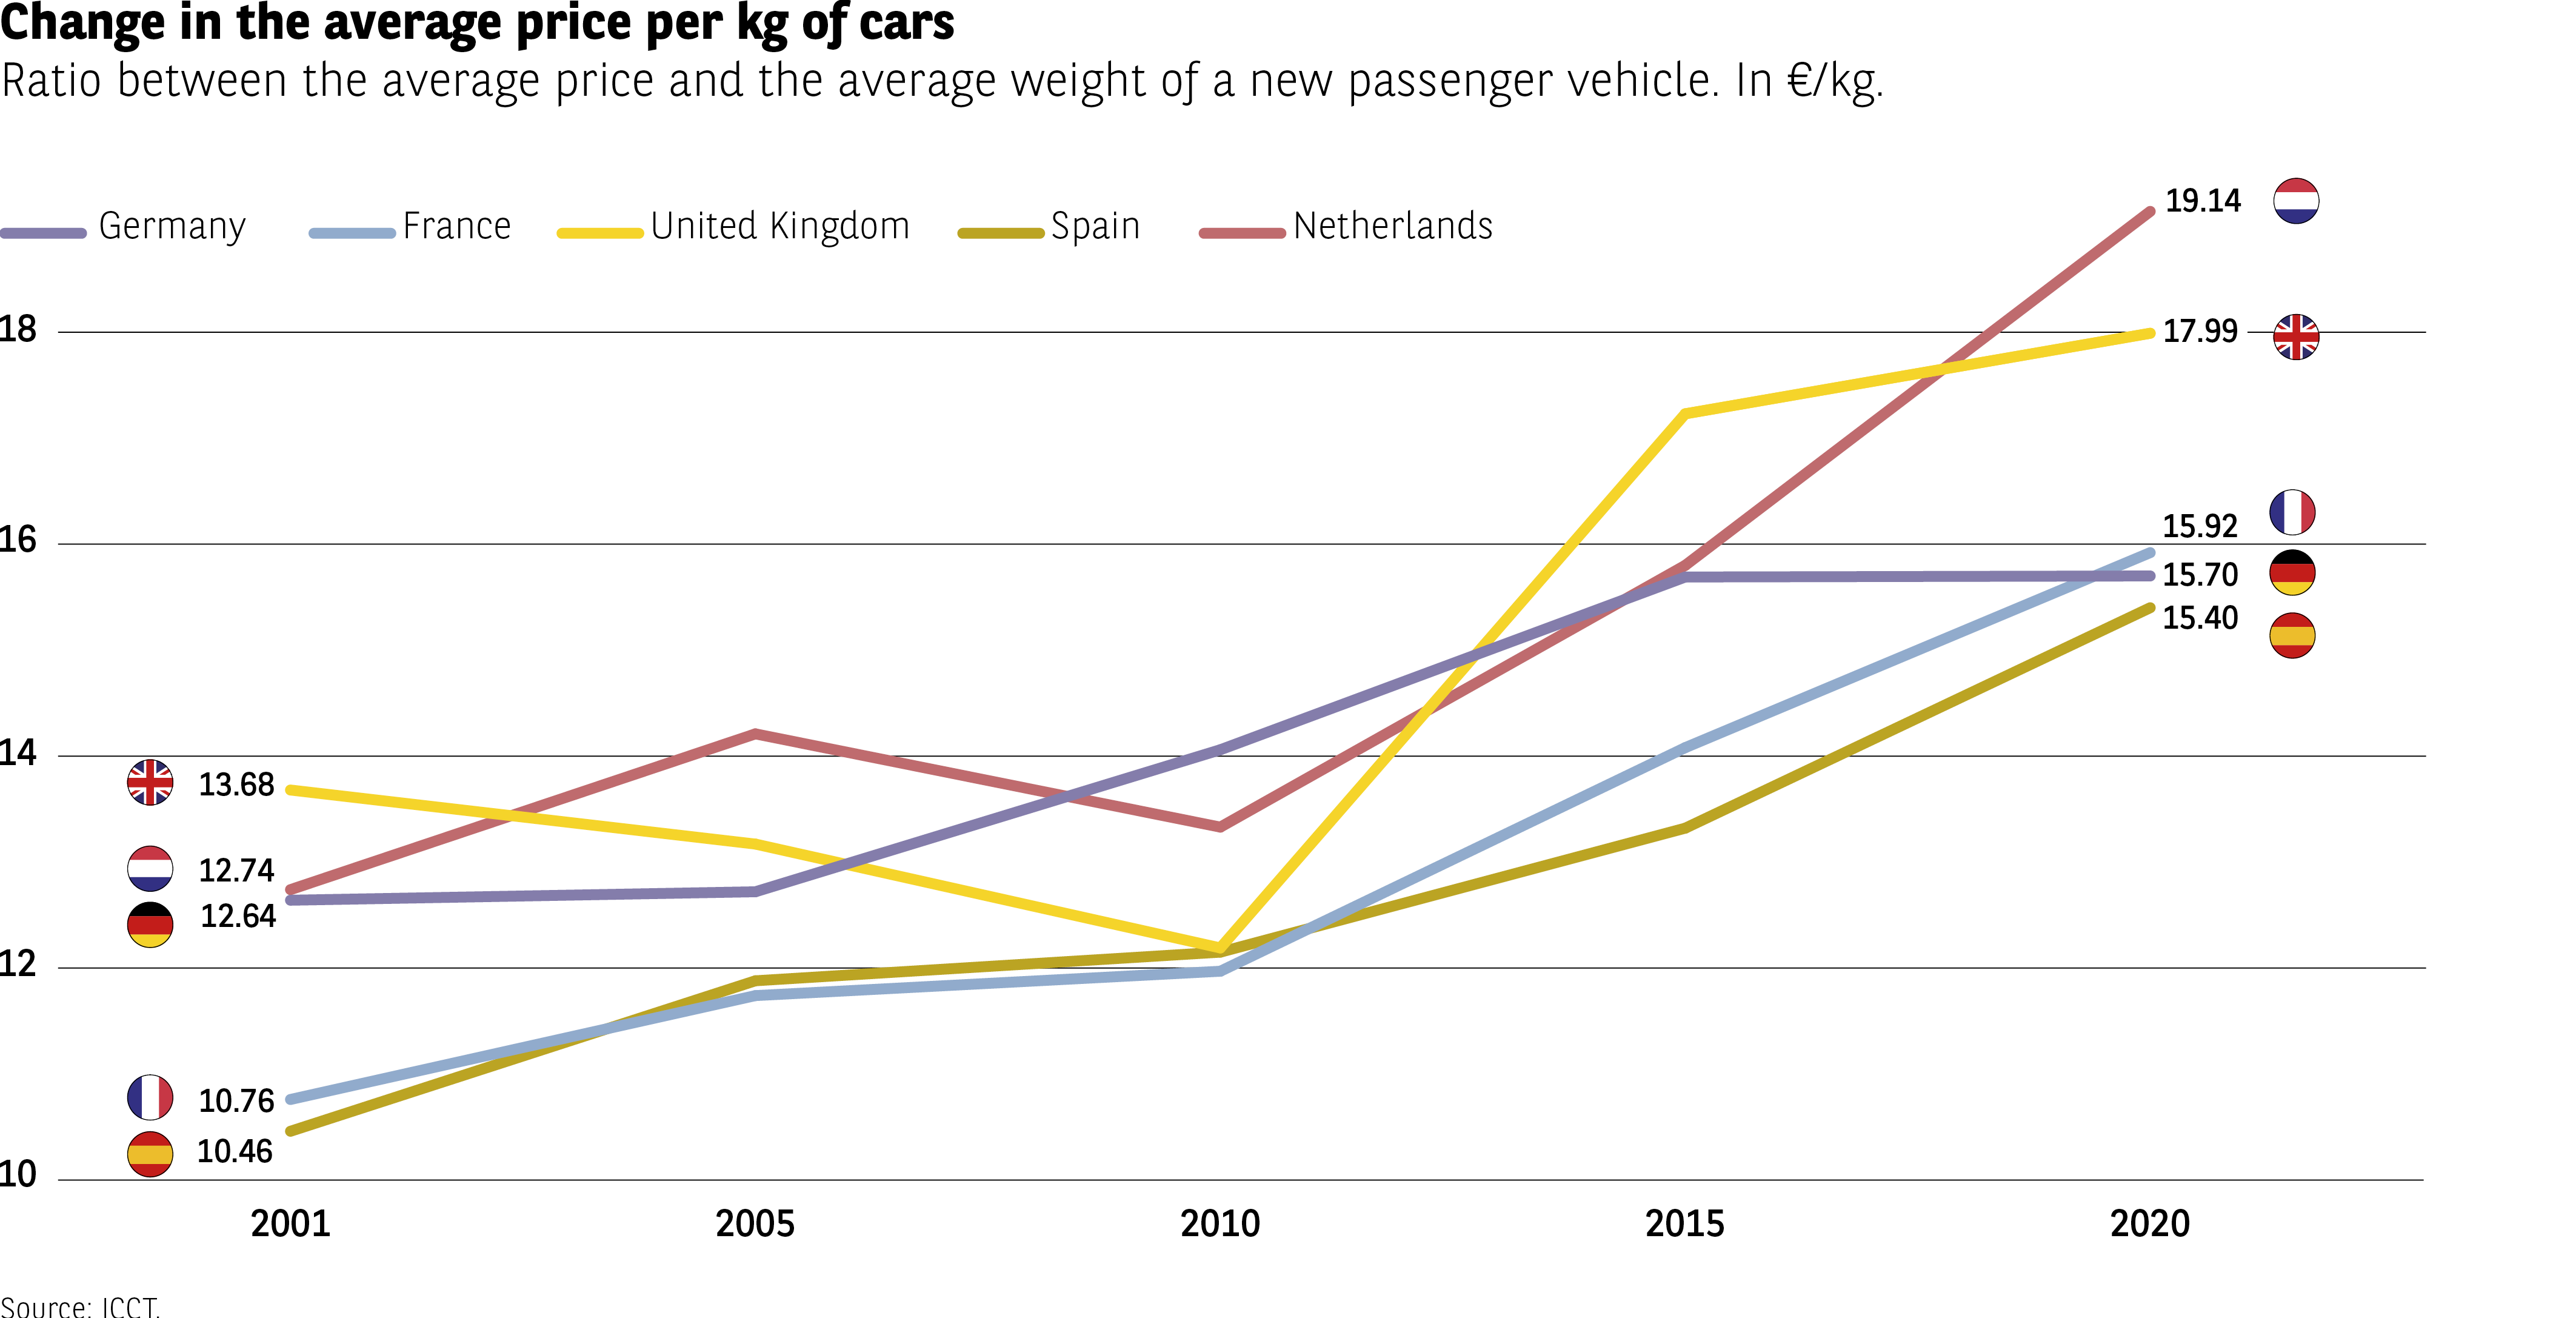 The infographic compares the price per kilogram of a vehicle, based on the ratio between average price and average weight of a passenger car.
Five countries are shown: Germany, France, the United Kingdom, Spain, and the Netherlands.
Data (in €/kg)
2001 — Germany: 12.64 / France: 10.76 / UK: 13.68 / Spain: 10.46 / Netherlands: 12.74
2005 — Germany: 12.40 / France: 11.40 / UK: 12.20 / Spain: 11.20 / Netherlands: 13.80
2010 — Germany: 13.00 / France: 12.00 / UK: 11.50 / Spain: 11.80 / Netherlands: 13.00
2015 — Germany: 14.50 / France: 13.40 / UK: 14.00 / Spain: 13.20 / Netherlands: 14.80
2020 — Germany: 15.70 / France: 15.92 / UK: 17.99 / Spain: 15.40 / Netherlands: 19.14
All countries show an increase over 20 years.
The Netherlands and the United Kingdom show the strongest rises.
Source: ICCT
The infographic compares the price per kilogram of a vehicle, based on the ratio between average price and average weight of a passenger car.
Five countries are shown: Germany, France, the United Kingdom, Spain, and the Netherlands.
Data (in €/kg)
2001 — Germany: 12.64 / France: 10.76 / UK: 13.68 / Spain: 10.46 / Netherlands: 12.74
2005 — Germany: 12.40 / France: 11.40 / UK: 12.20 / Spain: 11.20 / Netherlands: 13.80
2010 — Germany: 13.00 / France: 12.00 / UK: 11.50 / Spain: 11.80 / Netherlands: 13.00
2015 — Germany: 14.50 / France: 13.40 / UK: 14.00 / Spain: 13.20 / Netherlands: 14.80
2020 — Germany: 15.70 / France: 15.92 / UK: 17.99 / Spain: 15.40 / Netherlands: 19.14
All countries show an increase over 20 years.
The Netherlands and the United Kingdom show the strongest rises.
Source: ICCT
It is worth noting that despite the rise of SUVs, which became slightly leaner between 2011 and 2020 in their petrol and diesel guises, but became heavier when equipped with electric motors, due to the presence of batteries, the average weight of European vehicles has remained stable since 2011, at under 1,400 kg.
However, the price per kilo of cars has risen steeply over the last decade, driven by the cost of materials and equipment that improve quality. For instance, prices in the UK have risen by almost 30%. In France, the increase has been a little less dramatic, at around 25%, with the price per kg reaching €15.92. Incidentally, this is the same price as a kilogramme of minced beef.
A purchase that is not taken for granted
A reasonable price… second hand

The steady increase in the price of cars does not appear to overly trouble those who own one.
6 out of 10 respondents believe that they paid a reasonable price for their vehicle. Europeans are considerably more likely to hold this view (7 out of 10). If we examine the results in greater geographical detail, we see that the Portuguese and Austrians are the most satisfied (8 out of 10), while the Brazilians and South Africans are far more split (4 out of 10) (Fig 7). It is apparent throughout this report that these two countries often coalesce around certain views.
Fig 7 – Perception of price of a vehicle at purchase
Download this infographic for your presentations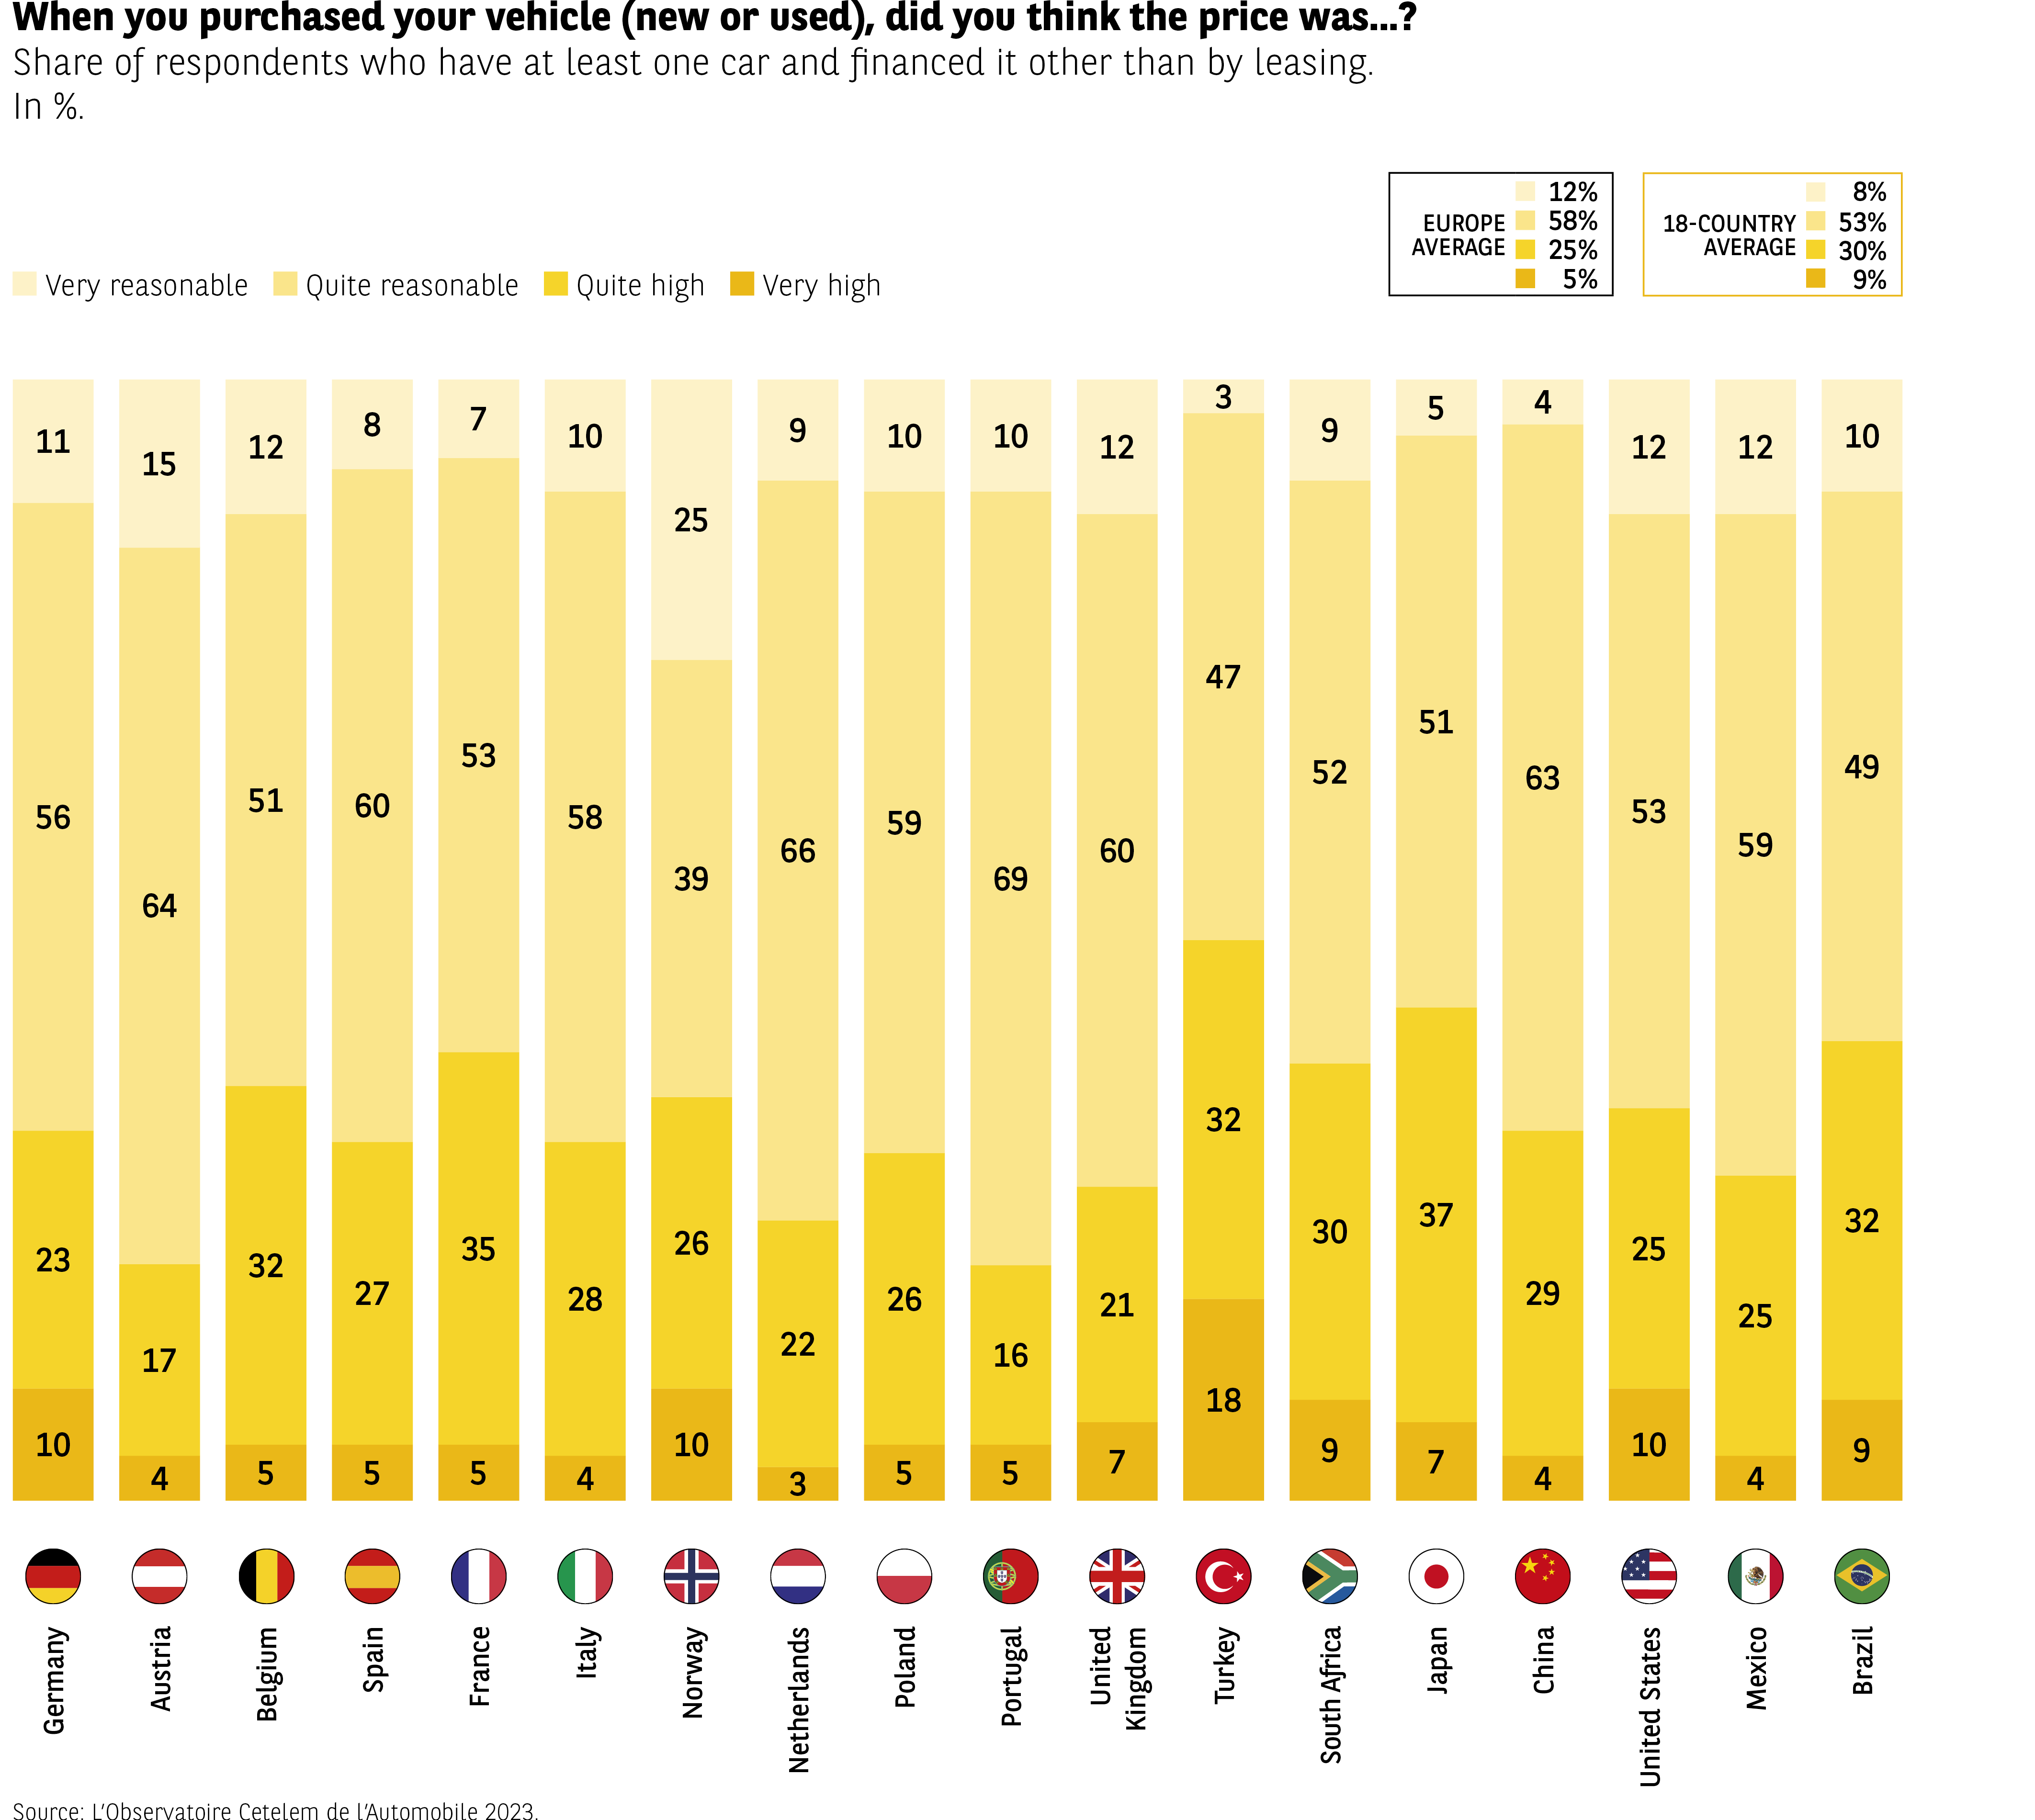 The infographic shows how buyers perceived the price of their vehicle (new or used) at the time of purchase in 18 countries. It covers respondents who own at least one car and did not finance it through leasing.
The readable values are (very reasonable, rather reasonable, rather high, and very high):
Germany: 10 %, 23 %, 56 %, 11 %
Austria: 4 %, 32 %, 64 %, 15 %
Belgium: 5 %, 27 %, 51 %, 17 %
Spain: 5 %, 32 %, 60 %, 12 %
France: 5 %, 35 %, 53 %, 8 %
Italy: 4 %, 28 %, 58 %, 10 %
Norway: 3 %, 26 %, 39 %, 25 %
Netherlands: 5 %, 22 %, 66 %, 7 %
Poland: 5 %, 26 %, 59 %, 10 %
Portugal: 7 %, 21 %, 60 %, 12 %
United Kingdom: 5 %, 30 %, 69 %, 3 %
Turkey: 4 %, 37 %, 52 %, 9 %
South Africa: 4 %, 29 %, 63 %, 5 %
Japan: 4 %, 25 %, 53 %, 12 %
China: 10 %, 25 %, 59 %, 6 %
United States: 4 %, 32 %, 49 %, 15 %
Mexico: 9 %, 25 %, 59 %, 7 %
Brazil: 9 %, 32 %, 49 %, 10 %
A summary box displays averages:
– Europe average: 12 %, 58 %, 25 %, 5 %
– 18-country average: 8 %, 53 %, 30 %, 9 %
Overall, the data shows substantial differences between countries: some see vehicle prices as mostly reasonable (Italy, Spain), while others perceive them predominantly as high (United Kingdom, South Africa). The very high category remains a minority in most countries.
Source: Observatoire Cetelem de l’Automobile 2023.
The infographic shows how buyers perceived the price of their vehicle (new or used) at the time of purchase in 18 countries. It covers respondents who own at least one car and did not finance it through leasing.
The readable values are (very reasonable, rather reasonable, rather high, and very high):
Germany: 10 %, 23 %, 56 %, 11 %
Austria: 4 %, 32 %, 64 %, 15 %
Belgium: 5 %, 27 %, 51 %, 17 %
Spain: 5 %, 32 %, 60 %, 12 %
France: 5 %, 35 %, 53 %, 8 %
Italy: 4 %, 28 %, 58 %, 10 %
Norway: 3 %, 26 %, 39 %, 25 %
Netherlands: 5 %, 22 %, 66 %, 7 %
Poland: 5 %, 26 %, 59 %, 10 %
Portugal: 7 %, 21 %, 60 %, 12 %
United Kingdom: 5 %, 30 %, 69 %, 3 %
Turkey: 4 %, 37 %, 52 %, 9 %
South Africa: 4 %, 29 %, 63 %, 5 %
Japan: 4 %, 25 %, 53 %, 12 %
China: 10 %, 25 %, 59 %, 6 %
United States: 4 %, 32 %, 49 %, 15 %
Mexico: 9 %, 25 %, 59 %, 7 %
Brazil: 9 %, 32 %, 49 %, 10 %
A summary box displays averages:
– Europe average: 12 %, 58 %, 25 %, 5 %
– 18-country average: 8 %, 53 %, 30 %, 9 %
Overall, the data shows substantial differences between countries: some see vehicle prices as mostly reasonable (Italy, Spain), while others perceive them predominantly as high (United Kingdom, South Africa). The very high category remains a minority in most countries.
Source: Observatoire Cetelem de l’Automobile 2023.
However, a more detailed analysis of the data uncovers a clearer divide between buyers of used cars and those who buy new vehicles. 77% of the former say they are happy with the price they paid for their vehicle, compared with just 57% of the latter. This is a substantial gap and one that can be observed in all the countries surveyed.
Taking a financial hit is unavoidable
However, a reasonable price does not necessarily make a car easy to purchase. Although buying a car may generally seem affordable, it requires sacrifices that make owning a vehicle less enjoyable. 7 out of 10 motorists believe that it can be done, but not without a degree of financial sacrifice (Fig 8). On this issue, respondents in Europe and in the rest of the world are more or less in agreement. One country stands apart somewhat, by offering a much more positive outlook. Only 53% of Chinese respondents believe that buying a car and making financial sacrifices go hand in hand, but more importantly, 44% think that it is feasible for everyone. Constantly and rapidly improving access to cars for a broad section of the population in recent years is undoubtedly a factor in these responses.

In contrast, 43% of Turks believe that buying a car is only for those who can afford it, compared with an overall average of only 15%. The tough economic and financial circumstances the country has been facing for many months now go a long way to explaining this result. With inflation rising at a rate far beyond that of other countries and the value of the Turkish lira falling sharply, it is difficult for the population to be optimistic about buying a car. It should also be noted that the feeling that cars are only for the wealthy is generally more pronounced among non-vehicle owners, with 3 in 10 being of this opinion.
Fig 8 – Perceived financial accessibility of car ownership
Download this infographic for your presentations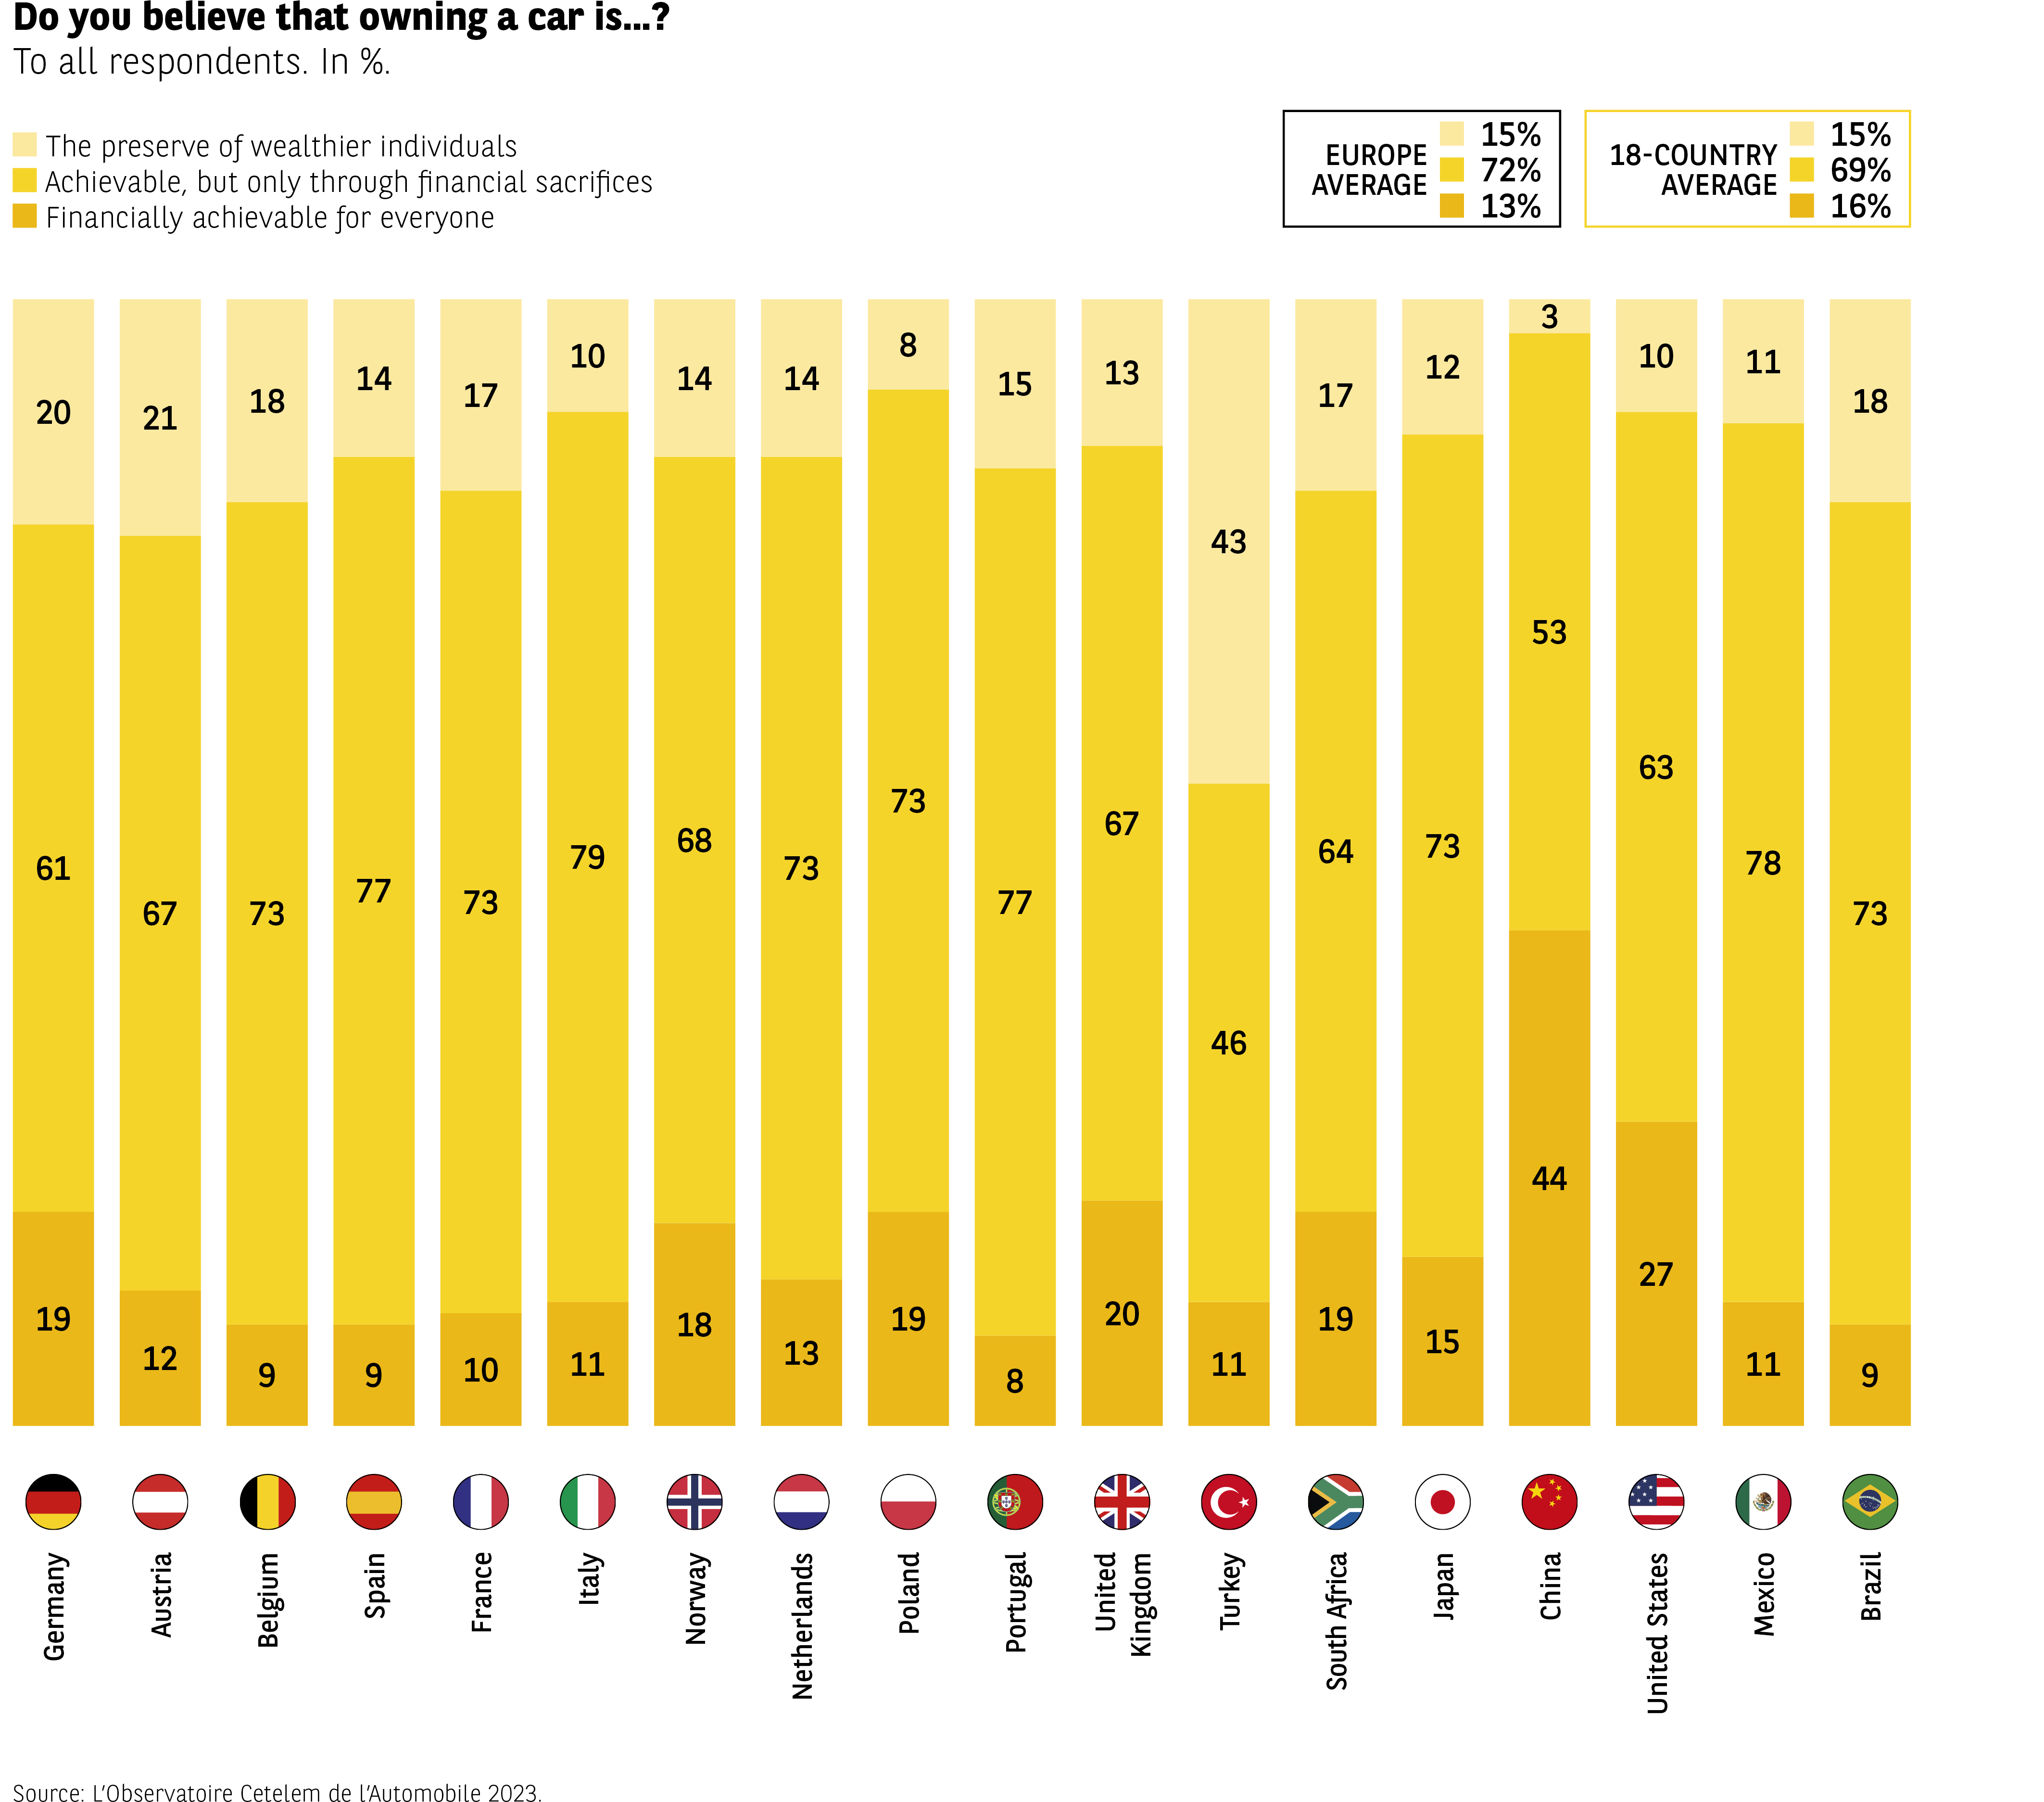 The infographic shows how residents of 18 countries assess the financial accessibility of owning a car. Results are expressed in percentages and distributed across three categories: reserved for the wealthiest, affordable but requiring financial sacrifices, and financially accessible to all.
The readable values for each country are (accessible to all, accessible with sacrifices, reserved):
Germany: 19 %, 61 %, 20 %
Austria: 12 %, 67 %, 21 %
Belgium: 9 %, 73 %, 18 %
Spain: 9 %, 77 %, 14 %
France: 10 %, 73 %, 17 %
Italy: 11 %, 79 %, 10 %
Norway: 18 %, 68 %, 14 %
Netherlands: 13 %, 73 %, 14 %
Poland: 19 %, 77 %, 8 %
Portugal: 20 %, 67 %, 13 %
United Kingdom: 11 %, 64 %, 25 %
Turkey: 19 %, 46 %, 35 %
South Africa: 11 %, 73 %, 17 %
Japan: 15 %, 44 %, 41 %
China: 27 %, 63 %, 10 %
United States: 11 %, 78 %, 10 %
Mexico: 11 %, 73 %, 16 %
Brazil: 9 %, 73 %, 18 %
Two summary boxes show average values (accessible to all, accessible with sacrifices, reserved):
– Europe average: 13%, 72%, 15%
– 18-country average: 16%, 69%, 15%
General patterns indicate strong differences between countries. In Western Europe (France, Spain, Italy), car ownership is mainly seen as accessible but requiring sacrifices. Turkey, Japan and China show higher proportions considering it reserved for wealthier households. Several countries (United States, Poland, Spain) show a large majority viewing it as accessible with financial effort.
Source: Observatoire Cetelem de l’Automobile 2023.
The infographic shows how residents of 18 countries assess the financial accessibility of owning a car. Results are expressed in percentages and distributed across three categories: reserved for the wealthiest, affordable but requiring financial sacrifices, and financially accessible to all.
The readable values for each country are (accessible to all, accessible with sacrifices, reserved):
Germany: 19 %, 61 %, 20 %
Austria: 12 %, 67 %, 21 %
Belgium: 9 %, 73 %, 18 %
Spain: 9 %, 77 %, 14 %
France: 10 %, 73 %, 17 %
Italy: 11 %, 79 %, 10 %
Norway: 18 %, 68 %, 14 %
Netherlands: 13 %, 73 %, 14 %
Poland: 19 %, 77 %, 8 %
Portugal: 20 %, 67 %, 13 %
United Kingdom: 11 %, 64 %, 25 %
Turkey: 19 %, 46 %, 35 %
South Africa: 11 %, 73 %, 17 %
Japan: 15 %, 44 %, 41 %
China: 27 %, 63 %, 10 %
United States: 11 %, 78 %, 10 %
Mexico: 11 %, 73 %, 16 %
Brazil: 9 %, 73 %, 18 %
Two summary boxes show average values (accessible to all, accessible with sacrifices, reserved):
– Europe average: 13%, 72%, 15%
– 18-country average: 16%, 69%, 15%
General patterns indicate strong differences between countries. In Western Europe (France, Spain, Italy), car ownership is mainly seen as accessible but requiring sacrifices. Turkey, Japan and China show higher proportions considering it reserved for wealthier households. Several countries (United States, Poland, Spain) show a large majority viewing it as accessible with financial effort.
Source: Observatoire Cetelem de l’Automobile 2023.
An effort rate that is peaking
According to motorists, buying a car is achievable but requires sacrifices to be made. The indicator appropriately named the “effort rate” shows this in stark relief. Measured by calculating the ratio between the price of a car and the average annual income, this rate is close to or greater than 1 in some countries (Fig 9): buying a car costs some individuals their entire annual wage.
In the absence of homogeneous global statistics, establishing precise and accurate trends for this effort rate over time is almost impossible. However, when one considers the stagnation – or even the reversal – of income rises in recent times, together with the increasing amount of technology that goes into cars, electric vehicles in particular, it is not difficult to imagine how tough these rates are becoming.
In Europe alone, car prices have risen twice as fast as household incomes, and that was before the 2020-2022 price shock triggered by the pandemic and its impact in terms of restricting supplies. When the effort required becomes too great, people give up on the idea. When will breaking point be reached?
Fig 9 – Effort rate for the purchase of a new vehicle in 2021
Download this infographic for your presentations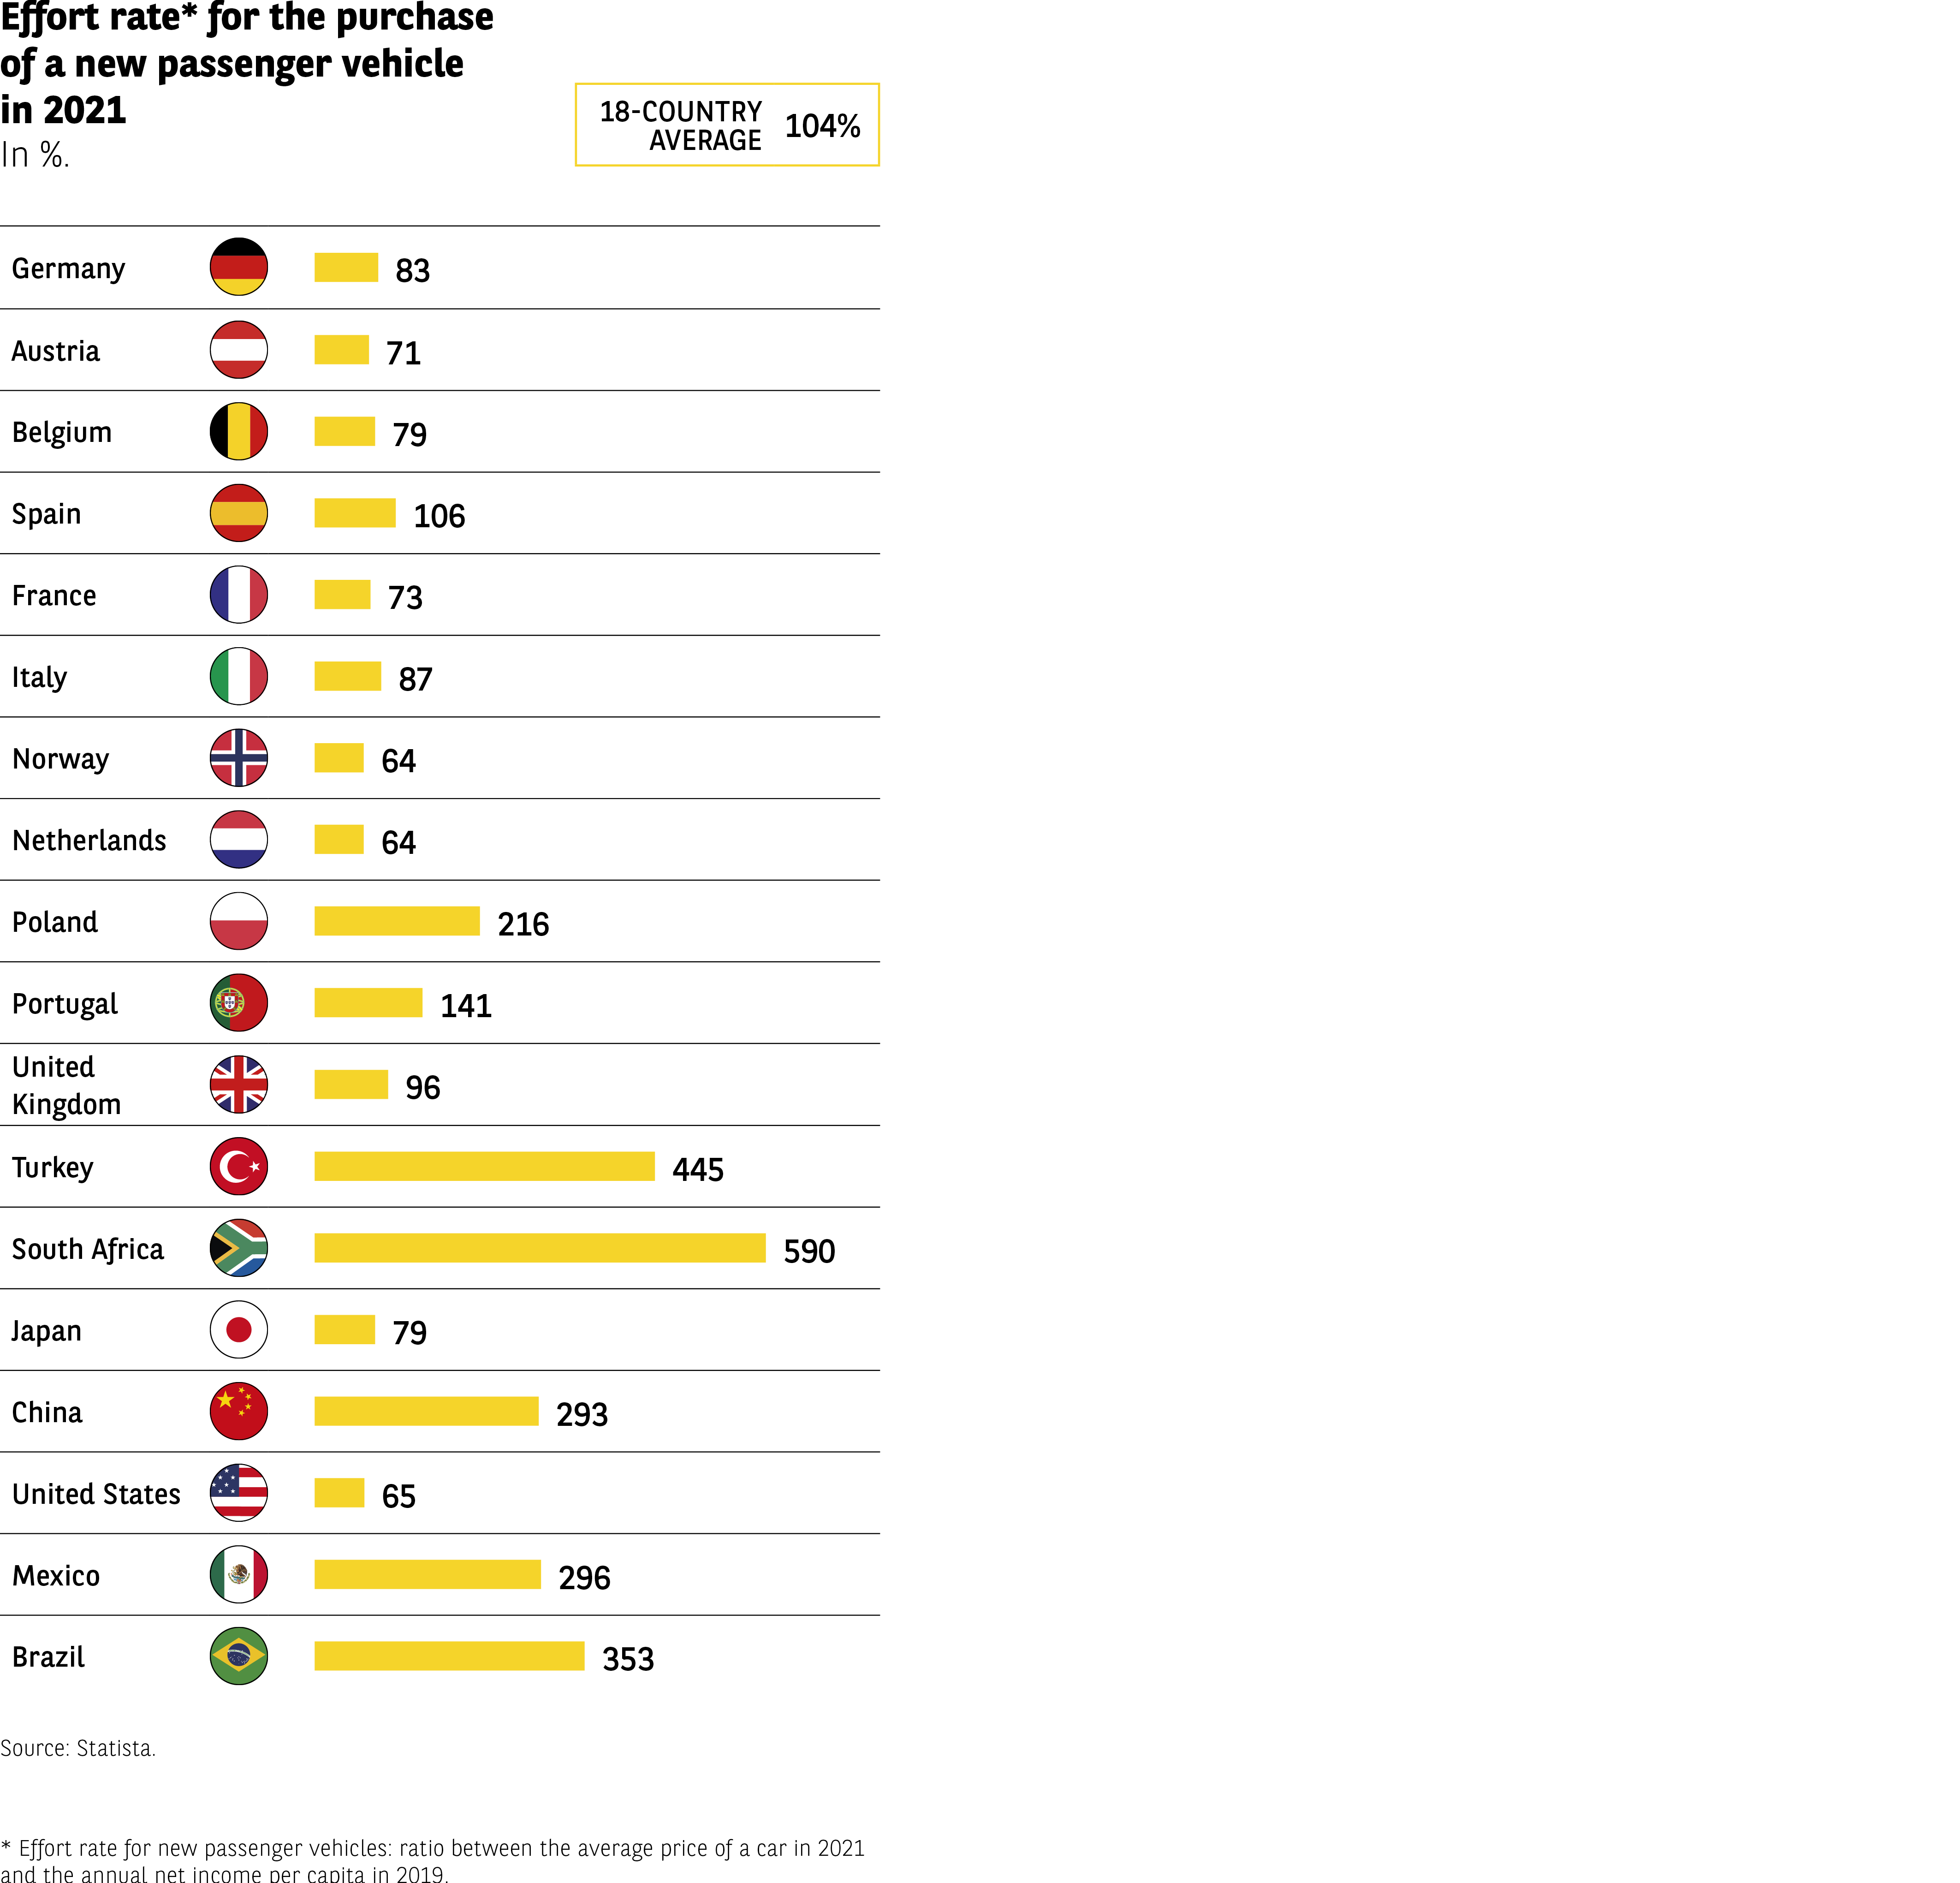 The infographic shows the effort rate* required to purchase a new passenger vehicle in 2021.
A reference value is provided:
Average across 18 countries = 104%.
Country data (in %):
Germany: 83
Austria: 71
Belgium: 79
Spain: 106
France: 73
Italy: 87
Norway: 64
Netherlands: 64
Poland: 216
Portugal: 141
United Kingdom: 96
Turkey: 445
South Africa: 590
Japan: 79
China: 293
United States: 65
Mexico: 296
Brazil: 353
South Africa and Turkey show the highest effort rates.
Western Europe generally remains below the average.
Poland, Portugal, and China show levels significantly above the average.
*Effort rate: ratio of the average price of a new vehicle in 2021 to adjusted annual income per capita (2019).
Source: Statista
The infographic shows the effort rate* required to purchase a new passenger vehicle in 2021.
A reference value is provided:
Average across 18 countries = 104%.
Country data (in %):
Germany: 83
Austria: 71
Belgium: 79
Spain: 106
France: 73
Italy: 87
Norway: 64
Netherlands: 64
Poland: 216
Portugal: 141
United Kingdom: 96
Turkey: 445
South Africa: 590
Japan: 79
China: 293
United States: 65
Mexico: 296
Brazil: 353
South Africa and Turkey show the highest effort rates.
Western Europe generally remains below the average.
Poland, Portugal, and China show levels significantly above the average.
*Effort rate: ratio of the average price of a new vehicle in 2021 to adjusted annual income per capita (2019).
Source: Statista
Indispensable just as they are
Motorists are not prepared to give up their cars
Cars are considered accessible if certain sacrifices are made, but they remain fundamentally expensive in the eyes of motorists, even if the consensus is that they remain essential. Three-quarters believe it is impossible or almost impossible to do without a car, a view commonly held in European countries and the rest of the world alike.
The populations who are the most attached to their vehicle(s) can be found in the Netherlands, Austria, Belgium and South Africa. The Brazilians, Japanese and Norwegians are the least likely to feel this way. In France, the figure is consistent with the average, with 72% of respondents being unable to imagine a car-free existence (Fig 10).
Fig 10 – Willingness to give up owning a car by countries
Download this infographic for your presentations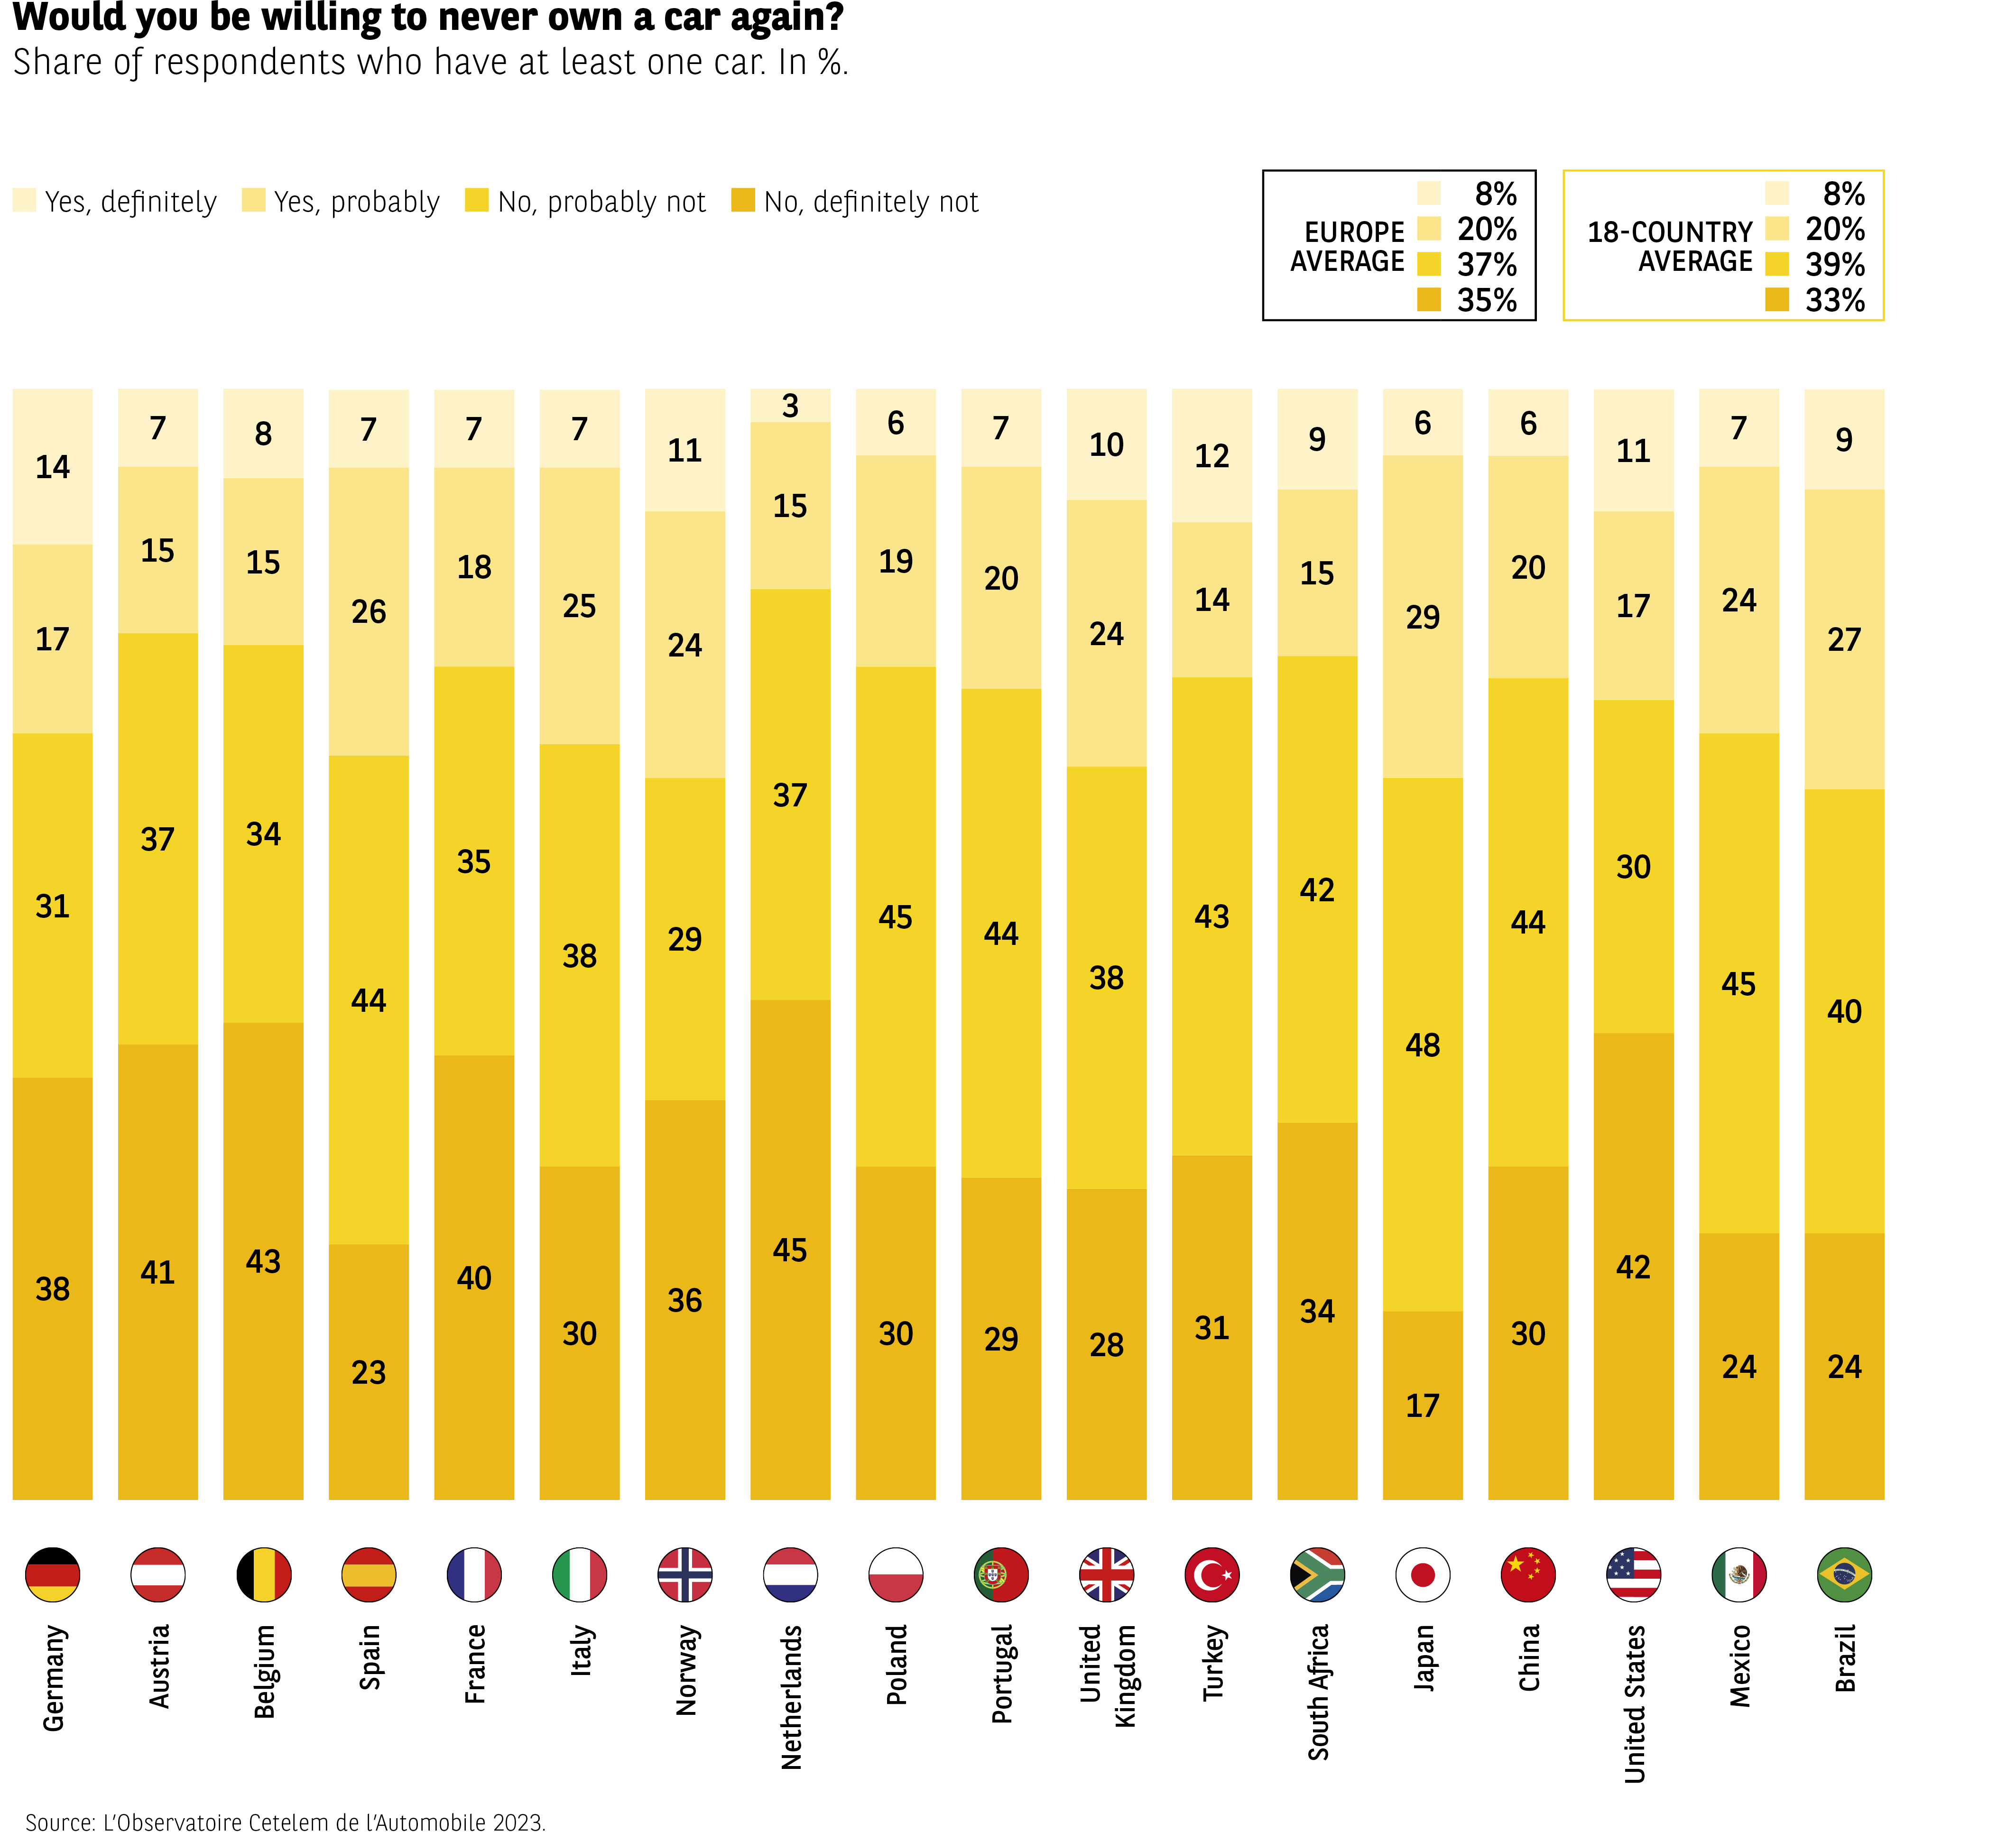 The infographic displays four categories of answers to the question: “Would you be willing to give up owning a car permanently?”
The values are given for 18 countries.
Two averages are shown:
– Europe: 8% / 20% / 37% / 35%
– 18 countries: 8% / 20% / 39% / 33%
The categories are:
– Yes, certain
– Yes, probably
– No, probably not
– No, definitely not
Data (order from top to bottom: yes certain / yes probable / no probable / no definitely):
Germany: 14 / 17 / 31 / 38
Austria: 7 / 15 / 37 / 41
Belgium: 8 / 15 / 34 / 43
Spain: 7 / 26 / 35 / 23
France: 7 / 18 / 38 / 30
Italy: 7 / 25 / 29 / 36
Norway: 11 / 15 / 37 / 45
Netherlands: 3 / 19 / 45 / 30
Poland: 6 / 20 / 44 / 30
Portugal: 7 / 14 / 38 / 41
United Kingdom: 10 / 24 / 43 / 24
Turkey: 12 / 29 / 38 / 21
South Africa: 9 / 15 / 42 / 34
Japan: 6 / 20 / 48 / 17
China: 11 / 17 / 30 / 42
United States: 7 / 24 / 45 / 24
Mexico: 9 / 27 / 40 / 24
Brazil: 9 / 24 / 45 / 22
In most countries, more than 60% of respondents say “no” (probably + definitely).
Japan and Portugal show the highest levels of “definitely not.”
Source: Observatoire Cetelem 2023
The infographic displays four categories of answers to the question: “Would you be willing to give up owning a car permanently?”
The values are given for 18 countries.
Two averages are shown:
– Europe: 8% / 20% / 37% / 35%
– 18 countries: 8% / 20% / 39% / 33%
The categories are:
– Yes, certain
– Yes, probably
– No, probably not
– No, definitely not
Data (order from top to bottom: yes certain / yes probable / no probable / no definitely):
Germany: 14 / 17 / 31 / 38
Austria: 7 / 15 / 37 / 41
Belgium: 8 / 15 / 34 / 43
Spain: 7 / 26 / 35 / 23
France: 7 / 18 / 38 / 30
Italy: 7 / 25 / 29 / 36
Norway: 11 / 15 / 37 / 45
Netherlands: 3 / 19 / 45 / 30
Poland: 6 / 20 / 44 / 30
Portugal: 7 / 14 / 38 / 41
United Kingdom: 10 / 24 / 43 / 24
Turkey: 12 / 29 / 38 / 21
South Africa: 9 / 15 / 42 / 34
Japan: 6 / 20 / 48 / 17
China: 11 / 17 / 30 / 42
United States: 7 / 24 / 45 / 24
Mexico: 9 / 27 / 40 / 24
Brazil: 9 / 24 / 45 / 22
In most countries, more than 60% of respondents say “no” (probably + definitely).
Japan and Portugal show the highest levels of “definitely not.”
Source: Observatoire Cetelem 2023
As one might intuitively assume, residents of rural areas are significantly more likely to be car friendly. 77% cannot imagine living without a car, compared with only 70% of urban dwellers. The highest proportion can be found in the Netherlands, while Turkey and Mexico boast the lowest.
The contrasts are starker when we compare the different generations. 34% of under-35s would be prepared to no longer own a car, compared with just 26% of over-35s. In Germany and Norway, 1 in 2 people can see themselves doing so, versus only 1 in 4 in Turkey and 1 in 5 in China. In France, 4 out of 10 under-35s hold this view.
People love cars just as they are
So we have seen that cars are considered indispensable, but this is even truer in their current guises. In this sense, whether it be in terms of equipment, on-board technology or innovation, automakers have done an excellent job of convincing a majority of motorists not to abandon the advances made. Indeed, 6 out of 10 respondents chose not to forego certain items of equipment or features when they bought their vehicle, for the sake of paying less. There are significant geographical disparities, however, with the least economically developed countries proving less intransigent. In Brazil, Turkey, South Africa, but also Portugal, only 4 out of 10 motorists chose not to forego these features, whereas in Austria, the Netherlands, Japan and Poland, the figure is close to 7 out of 10 (Fig 11).
Only a few percentage points separate buyers of new and used vehicles, with 55% of the former choosing not to give up these features, compared with 59% of the latter. It is obviously a stretch to ask a used-car dealer to remove an optional extra so as to lower the price. However, this is easier to do in the case of a new car, before the purchase order has been signed.
Fig 11 – Renunciation of options when buying a vehicle
Download this infographic for your presentations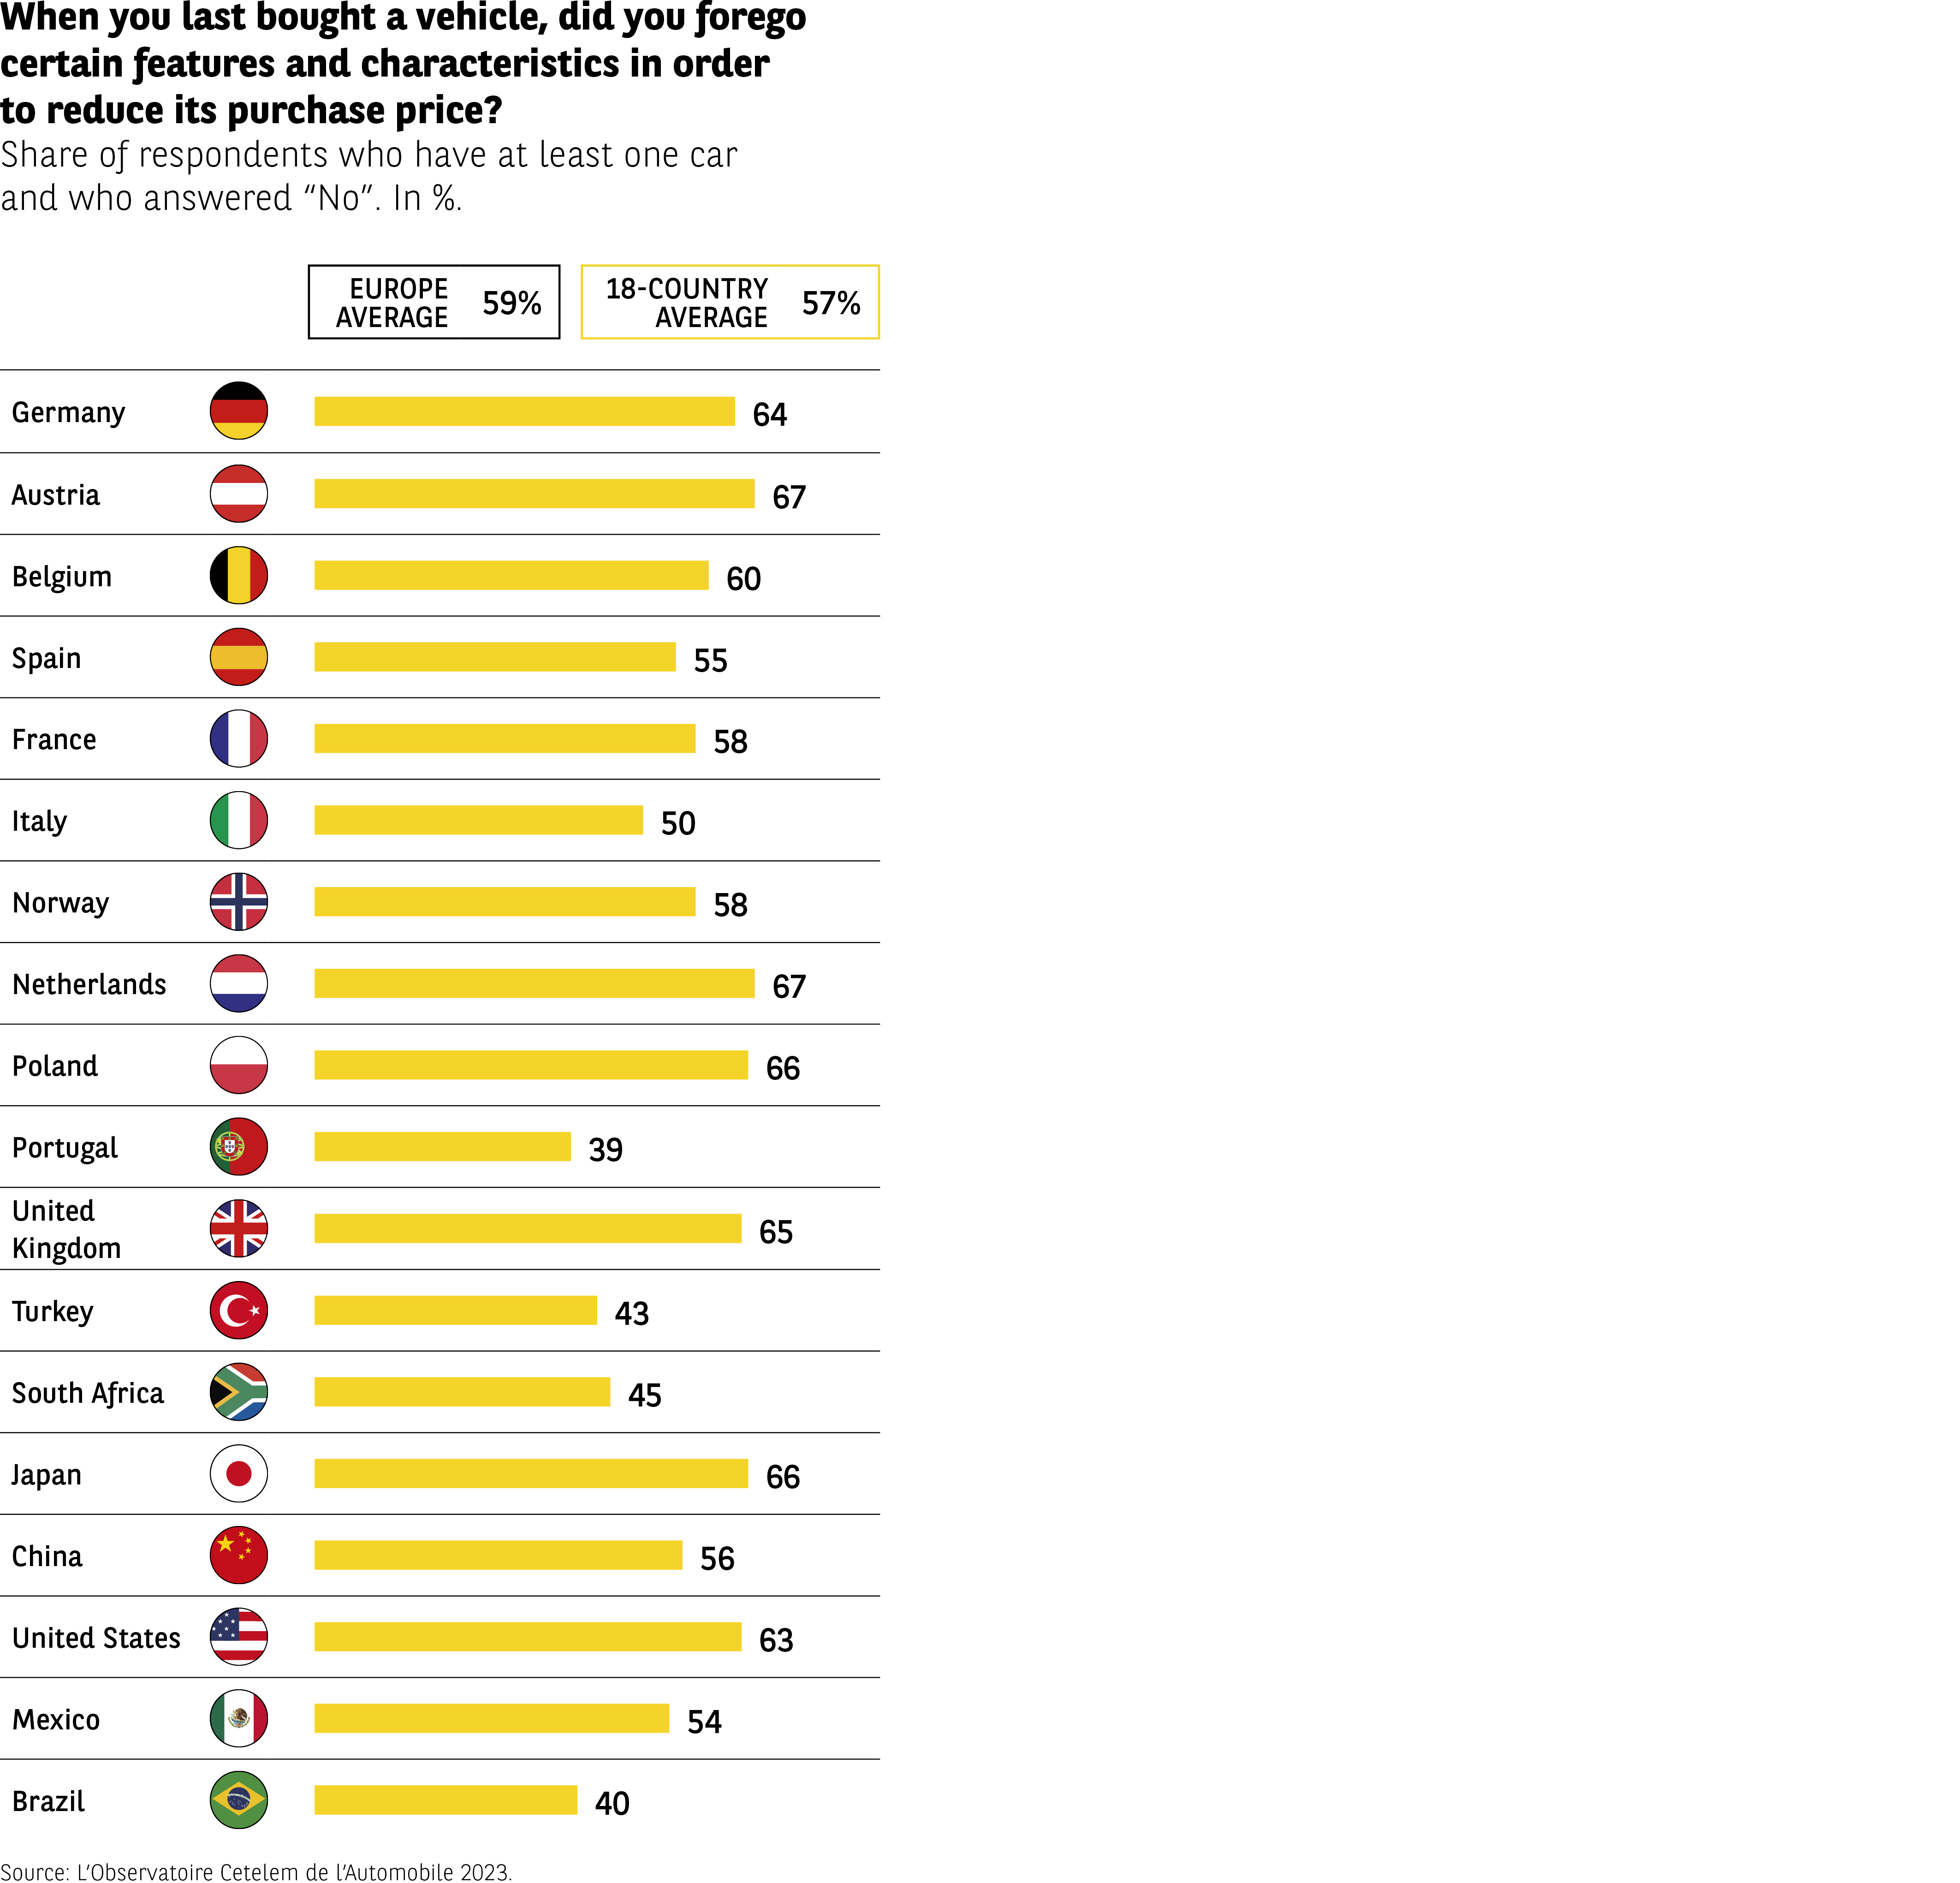 The infographic shows the proportion of people who bought a vehicle (new or used) and who did not give up certain features or equipment in order to reduce the price.
Two reference values are shown:
– Europe average: 59%
– Average across 18 countries: 57%
Country data (in %):
Germany: 64
Austria: 67
Belgium: 60
Spain: 55
France: 58
Italy: 50
Norway: 58
Netherlands: 67
Poland: 66
Portugal: 39
United Kingdom: 65
Turkey: 43
South Africa: 45
Japan: 66
China: 56
United States: 63
Mexico: 54
Brazil: 40
The highest rates are found in Austria, the Netherlands, Poland, and Japan.
The lowest values are found in Portugal, Brazil, and Turkey.
Most countries are close to or slightly above the Europe and 18-country averages.
Source: Observatoire Cetelem 2023
The infographic shows the proportion of people who bought a vehicle (new or used) and who did not give up certain features or equipment in order to reduce the price.
Two reference values are shown:
– Europe average: 59%
– Average across 18 countries: 57%
Country data (in %):
Germany: 64
Austria: 67
Belgium: 60
Spain: 55
France: 58
Italy: 50
Norway: 58
Netherlands: 67
Poland: 66
Portugal: 39
United Kingdom: 65
Turkey: 43
South Africa: 45
Japan: 66
China: 56
United States: 63
Mexico: 54
Brazil: 40
The highest rates are found in Austria, the Netherlands, Poland, and Japan.
The lowest values are found in Portugal, Brazil, and Turkey.
Most countries are close to or slightly above the Europe and 18-country averages.
Source: Observatoire Cetelem 2023