The electric coup de grâce


A tough climate… but carmakers remain greedy
The end of combustion engines in 2035
At a time when demand for new vehicles is relatively low, one might imagine that with the environmental crisis now weighing on the minds of people around the world, this would be a good opportunity to boost sales of electric cars.
A crucial step in this direction was the European Parliament’s vote on 8 June to ban the sale of new internal combustion engine vehicles from 2035. This was the first time a decision of this kind had been made on a continental scale. Many manufacturers have chosen to be proactive and switch to 100% electric production before the deadline. In 2024, Alpine will become the first brand to take the plunge. The Stellantis megacorp will also be at the vanguard of this change, with DS following suit in 2027, Opel in 2028 and Fiat in 2030. 2030 is also the year that Ford (in Europe only), Mercedes, Peugeot and Renault have set as their cut-off date.
Profit margins could not be heathier
The magic of electricity has provided manufacturers with an opportunity to further increase margins that have already been rising steadily on the whole. Between 2012 and 2018, they averaged around 6%. They then fell to 4.8% in 2019 and 3.5% in 2020. 2021 saw them rebound sharply. The average profit margin of the world’s 16 leading manufacturers now stands at 8.5% (Fig 56). A strategic shift has led to them raising their prices to offset reduced sales volumes. This promises a decent financial outcome for shareholders, but less so for motorists. However, significant differences can be observed from one brand to the next. For instance, the gap between Tesla and Mitsubishi is 10 points. Enough to make other automakers want to imitate the “king” of the electric-vehicle world, which, one should remember, was founded barely 20 years ago.
Fig 56 – Operating margins of carmakers in 2021
Download this infographic for your presentations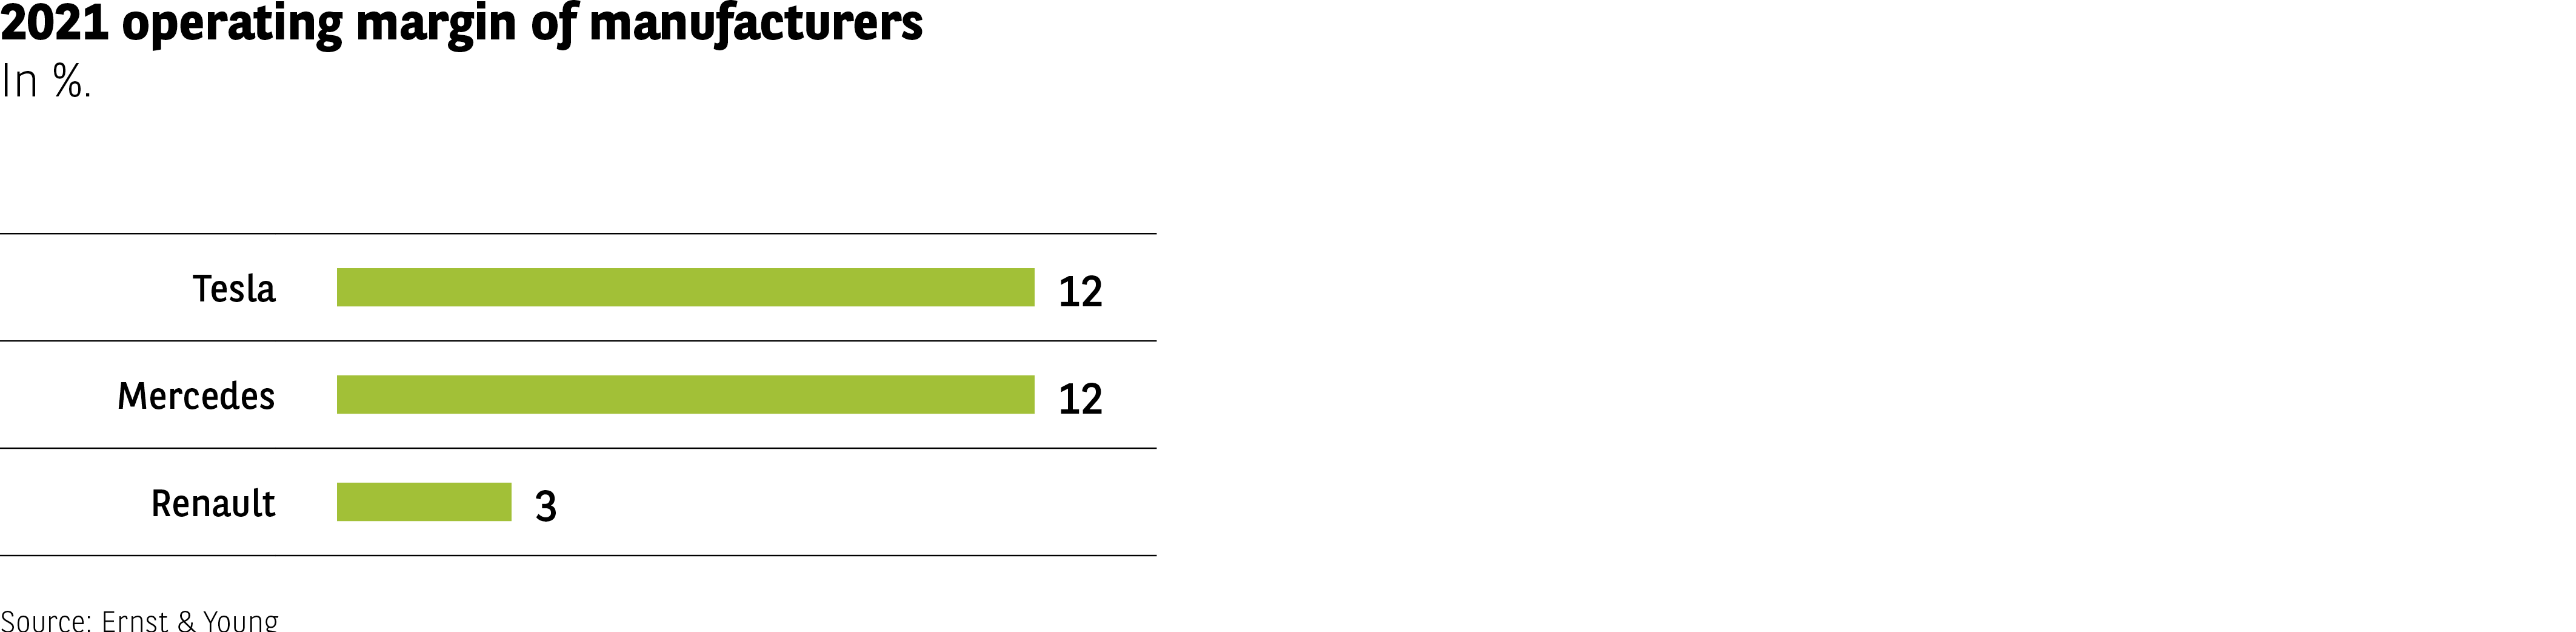 The infographic shows the operating margin for three car manufacturers in 2021, expressed as a percentage.
Values:
Tesla: 12%
Mercedes: 12%
Renault: 3%
The data shows that Tesla and Mercedes achieved similar margins, both significantly higher than Renault.
Source: Ernst & Young.
The infographic shows the operating margin for three car manufacturers in 2021, expressed as a percentage.
Values:
Tesla: 12%
Mercedes: 12%
Renault: 3%
The data shows that Tesla and Mercedes achieved similar margins, both significantly higher than Renault.
Source: Ernst & Young.
Widescale investment in electric vehicles
According to Global Data, manufacturers are set to invest heavily in the development of electric vehicles.
These companies are expected to spend €600bn over the next decade. Heading the field are the Volkswagen group ($100bn), Stellantis and General Motors ($80bn), Toyota ($70bn), Mercedes and the Renault-Nissan-Mitsubishi alliance ($40bn).
Rare and costly materials
However, the rise of electric vehicles and the profit margins they bring is likely to come up against a major obstacle. The raw materials most commonly used in the manufacture of battery cells, which are a fundamental part of these vehicles and account for around 75% of the cost of batteries, are becoming increasingly expensive. This is particularly true for lithium, one of the three essential materials found in electric vehicles along with cobalt and nickel, although its cost is expected to fall by 2023 (Fig 57).
Two additional issues could also make it more difficult for production of these materials to be ramped up. Indeed, they are mined in only a very small number of countries and are therefore very sensitive to geopolitical conditions. For example, 10% of the world’s nickel is produced in Russia. What’s more, the mining methods employed are not especially eco-friendly. Lithium extraction, for instance, requires huge quantities of water.
Fig 57 – Raw materials price trends
Download this infographic for your presentations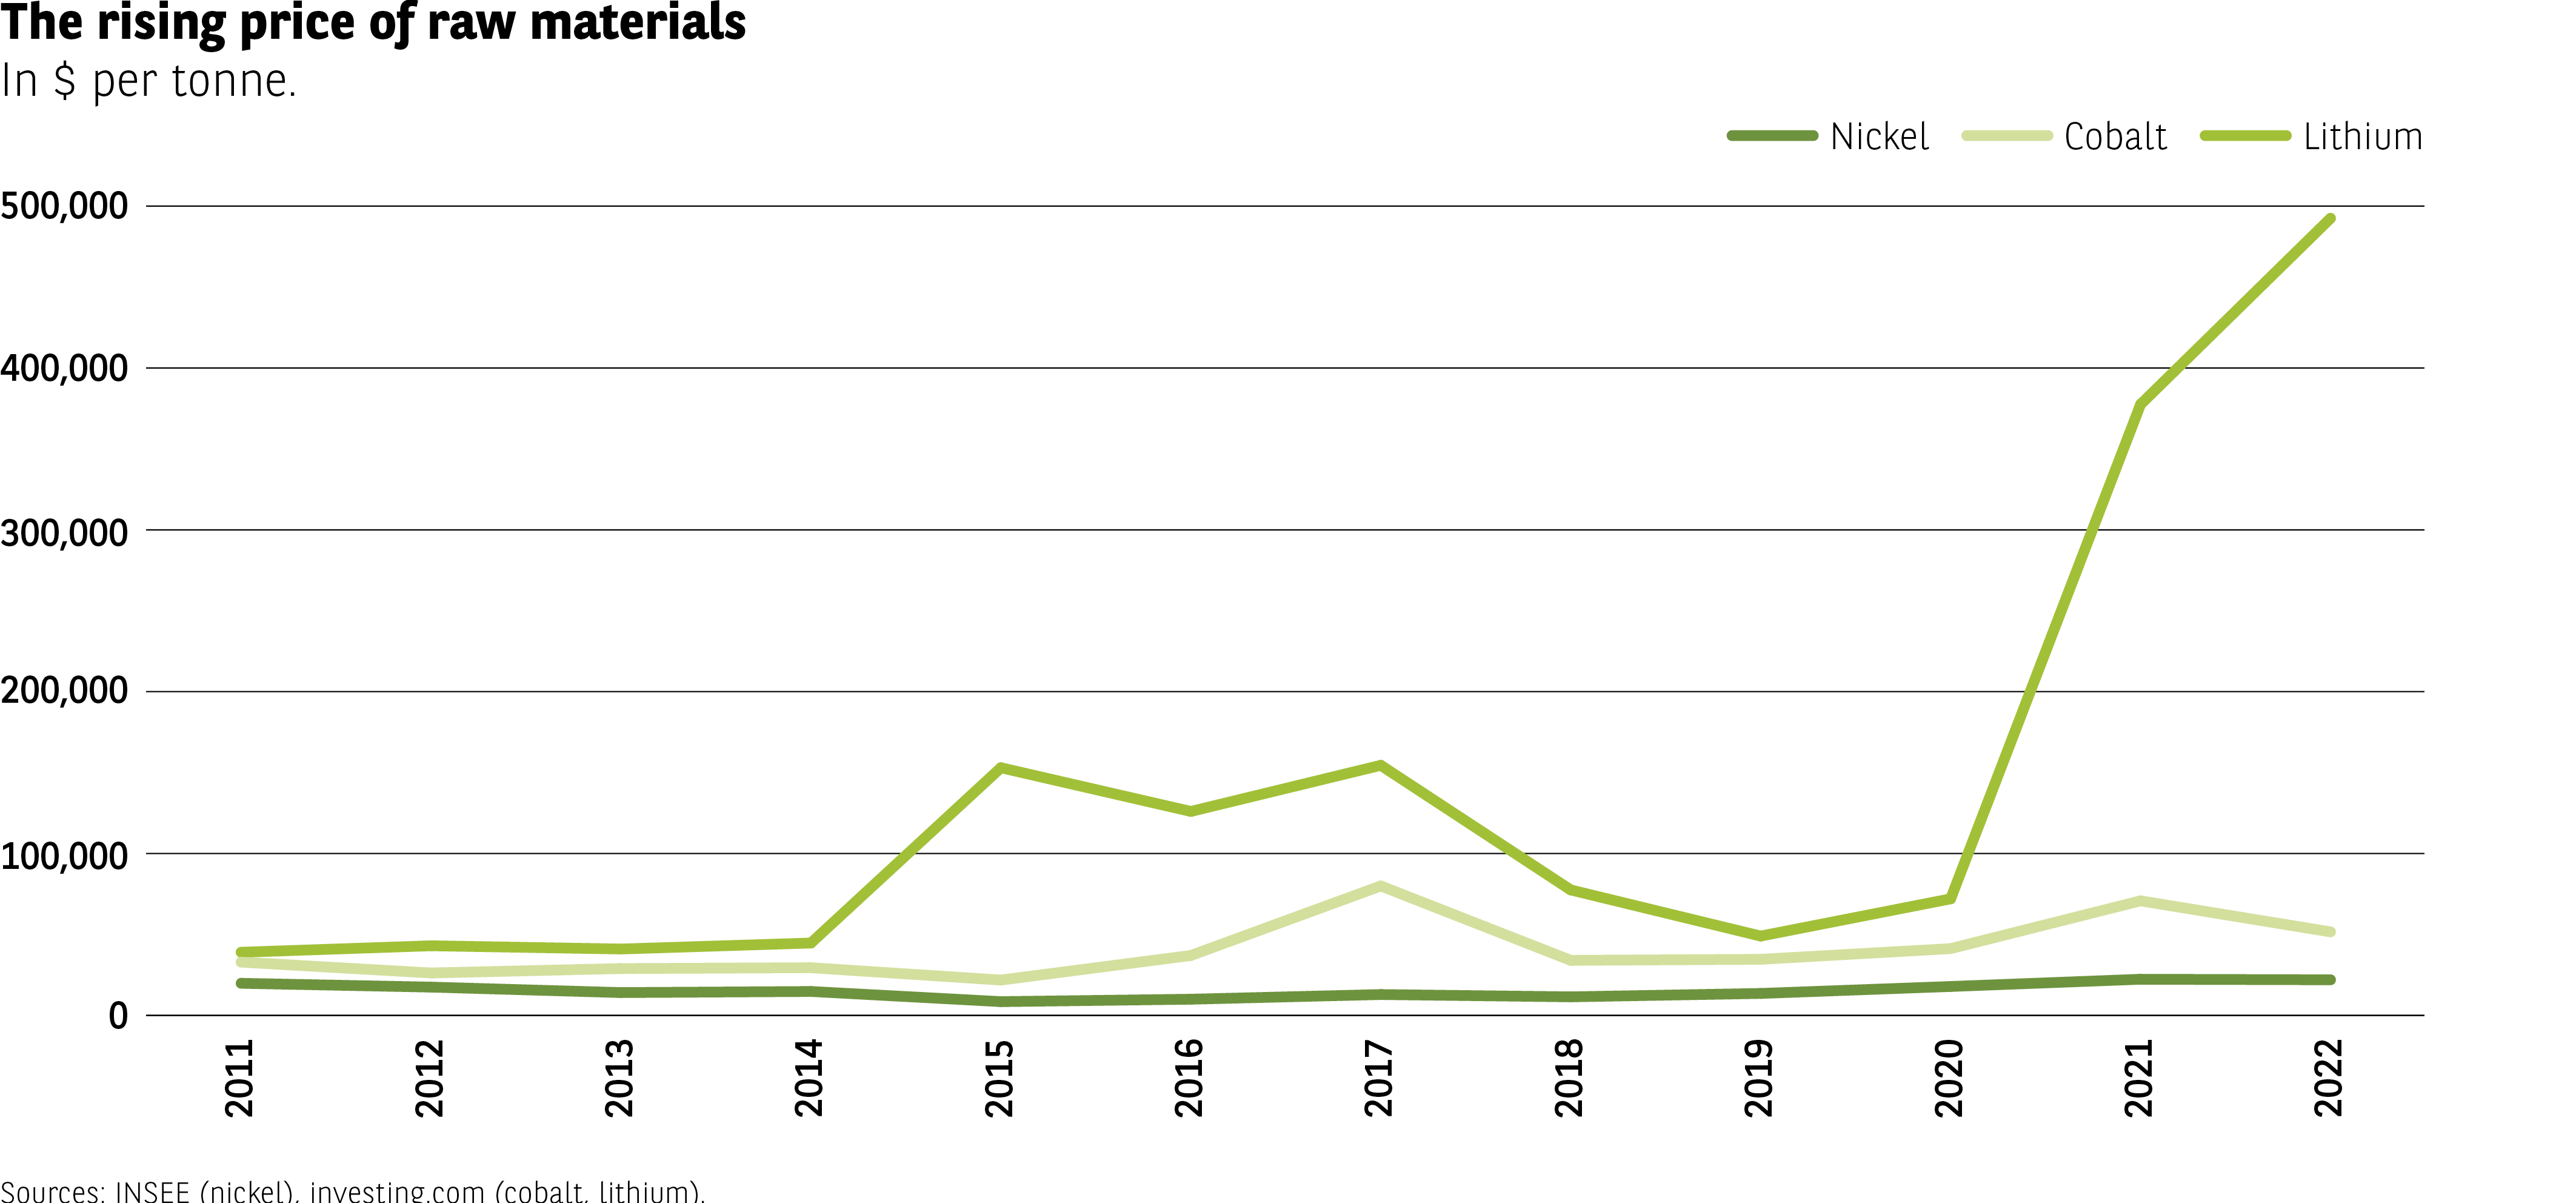 The infographic shows the evolution of nickel, cobalt, and lithium prices from 2011 to 2022, in dollars per tonne.
Approximate values and trends:
– Nickel: around 25,000 $/t in 2011, fluctuating moderately between 20,000 and 30,000 $/t by 2022.
– Cobalt: around 40,000–50,000 $/t early in the period, rising to a peak close to 80,000 $/t in 2017, then decreasing to about 60,000 $/t in 2022.
– Lithium: around 20,000 $/t until 2014, sharp increase in 2015 (around 150,000 $/t), decline in 2018, then a dramatic rise after 2020 reaching roughly 500,000 $/t in 2022.
The most significant trend is the steep surge in lithium prices from 2021 onward, far exceeding changes in nickel and cobalt.
Sources: INSEE (nickel), investing.com (cobalt, lithium).
The infographic shows the evolution of nickel, cobalt, and lithium prices from 2011 to 2022, in dollars per tonne.
Approximate values and trends:
– Nickel: around 25,000 $/t in 2011, fluctuating moderately between 20,000 and 30,000 $/t by 2022.
– Cobalt: around 40,000–50,000 $/t early in the period, rising to a peak close to 80,000 $/t in 2017, then decreasing to about 60,000 $/t in 2022.
– Lithium: around 20,000 $/t until 2014, sharp increase in 2015 (around 150,000 $/t), decline in 2018, then a dramatic rise after 2020 reaching roughly 500,000 $/t in 2022.
The most significant trend is the steep surge in lithium prices from 2021 onward, far exceeding changes in nickel and cobalt.
Sources: INSEE (nickel), investing.com (cobalt, lithium).
The electricity in the air is weak
Thus, while the current success of electric vehicles is undeniable and while the regulations that will be coming into force over the next few years will undoubtedly boost sales, the price factor again prompts motorists to express reservations.
1 in 10 respondents state that they own a hybrid or electric vehicle (Fig 58). It is no surprise that this category of motorist is most likely to be found in Norway, Japan and China. In South Africa and Mexico, however, such vehicles are almost non-existent. This is also the case on the used-car market. Only 4% of the motorists who bought their vehicle second hand report that they drive a hybrid or electric vehicle. Obviously, the result can be explained in great part by the fact that this is a relatively new market. Once more, Norway and Japan, but also Brazil, are the countries in which the market is the most developed (13%, 9% and 8%).
Why are electric vehicles struggling to win people over? 7 out of 10 respondents point to their excessive price, which puts them off buying one. This is a majority opinion in all but two of the countries covered by the survey. Naturally, the nations in question are Norway and China, whose electric vehicle markets are the most mature and the most successful.
Fig 58 – Energy type of owned vehicles
Download this infographic for your presentations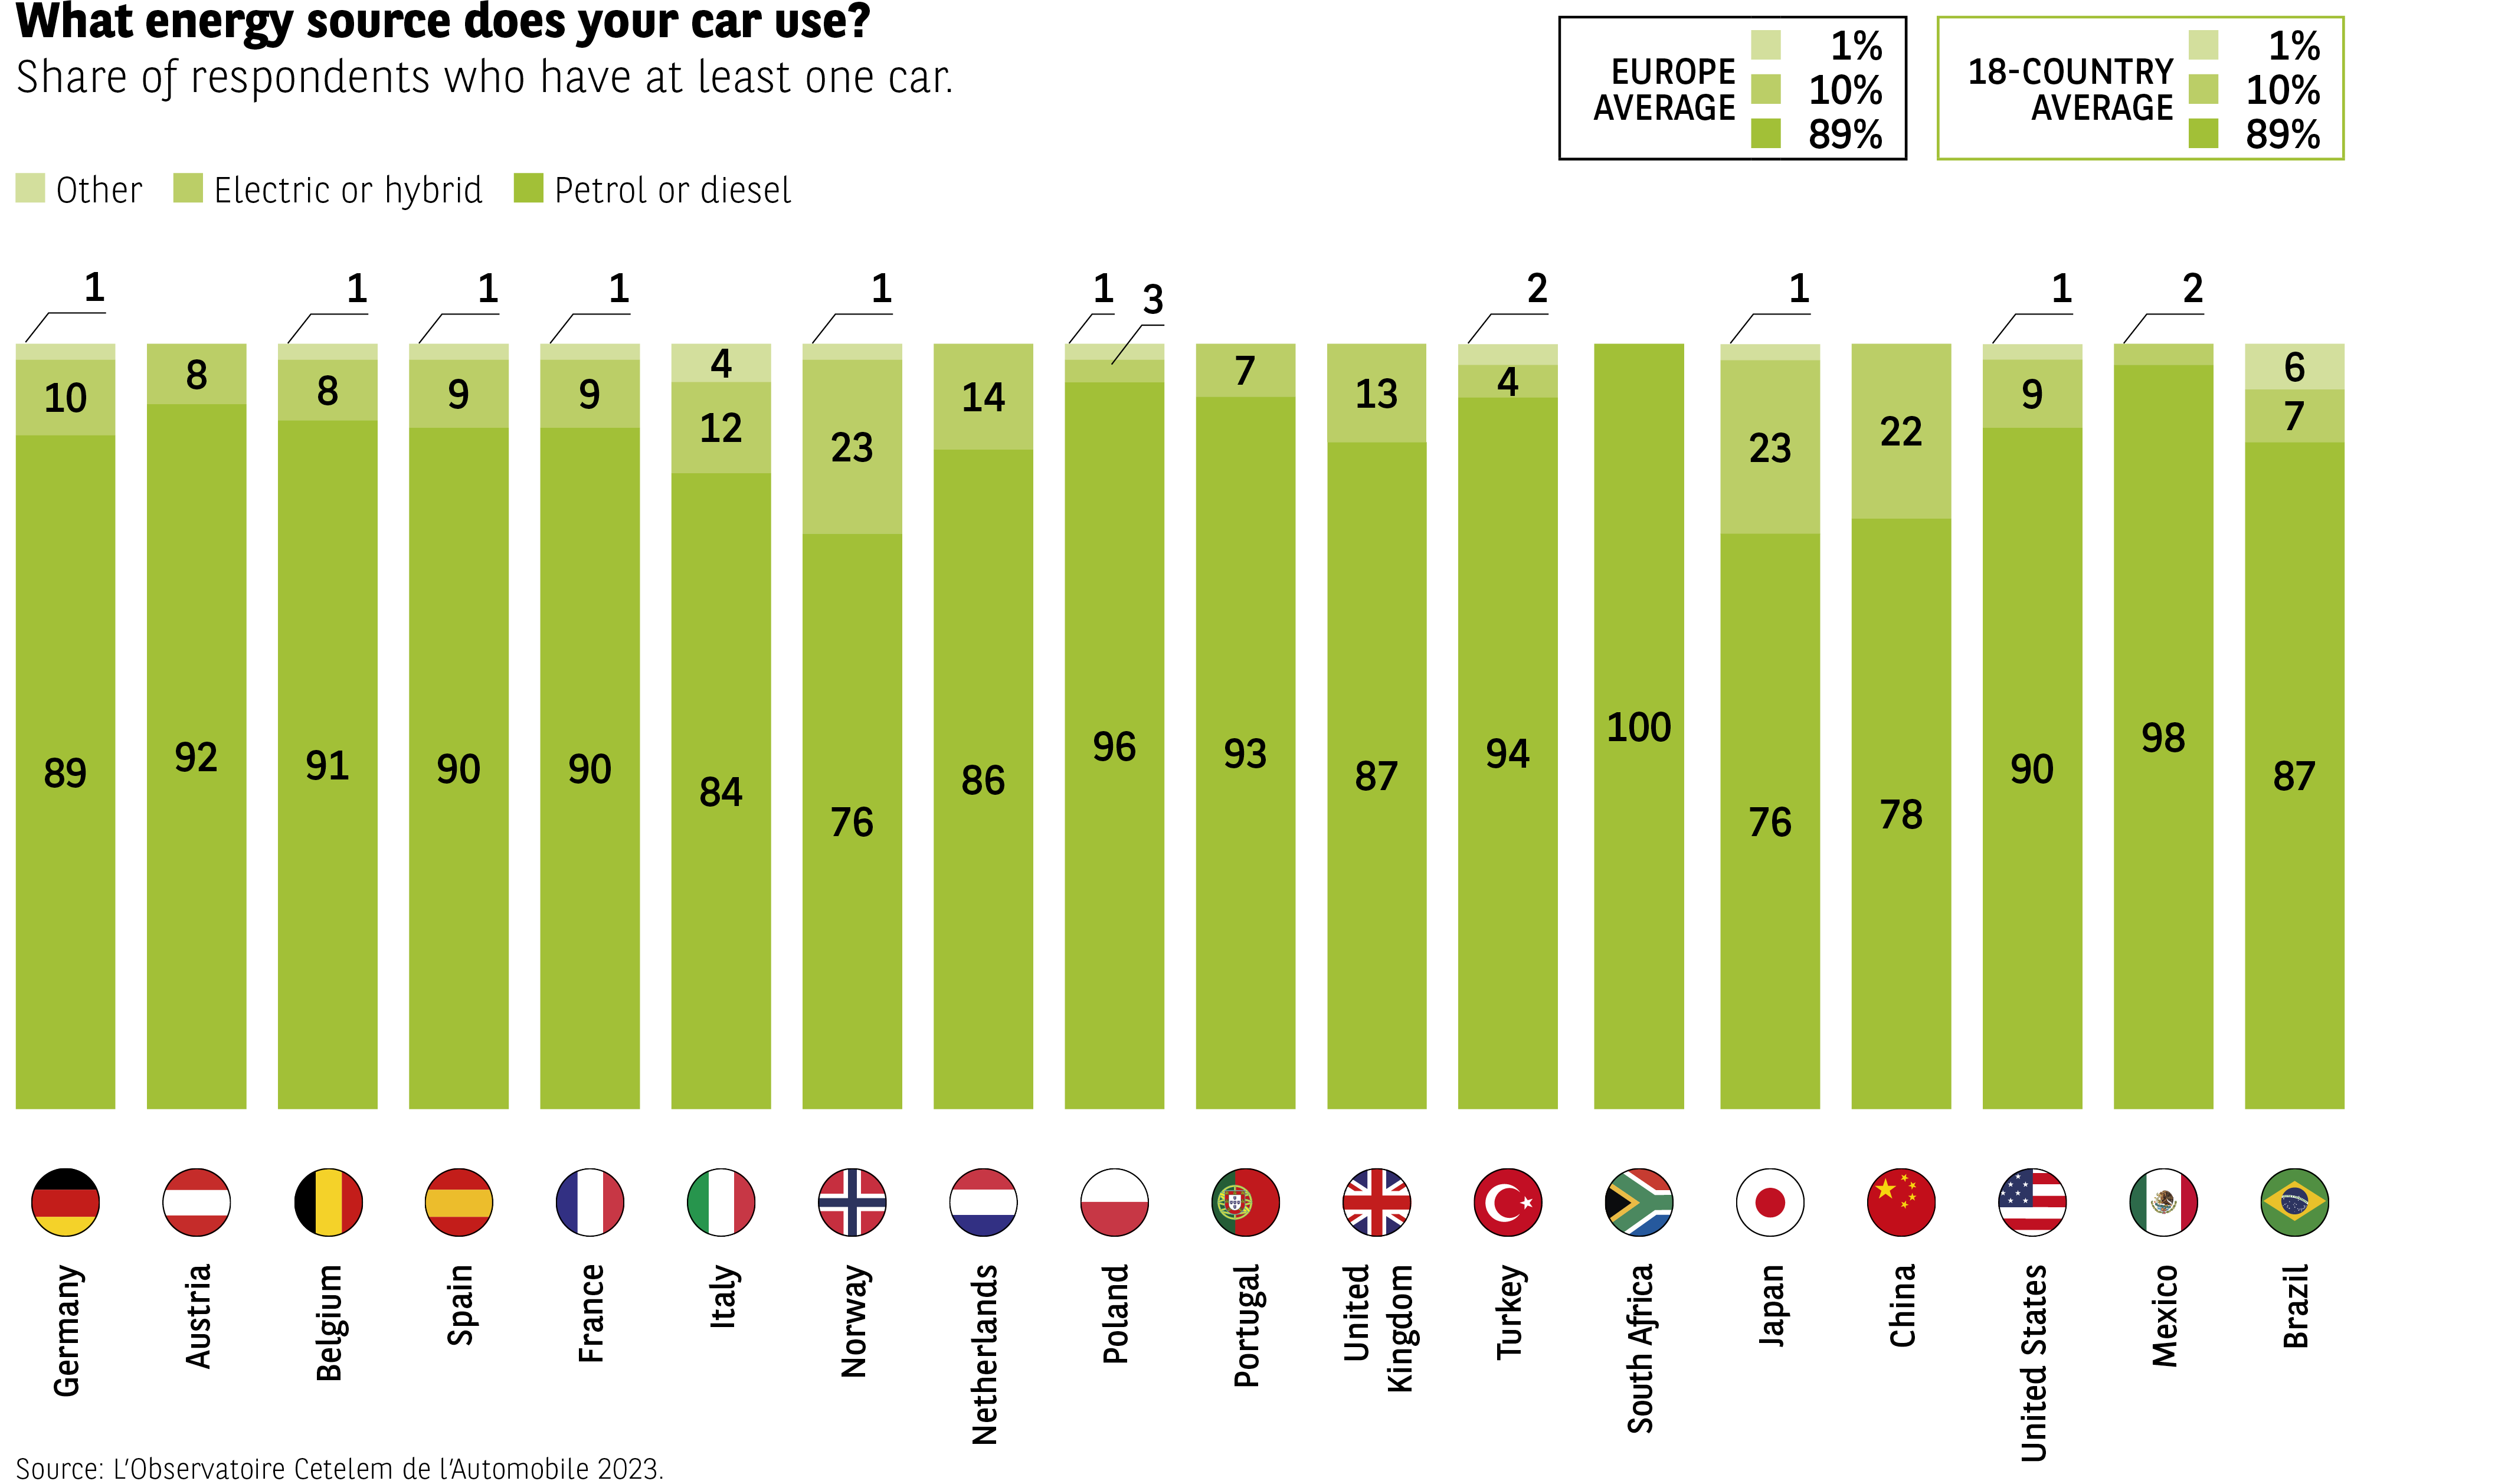 The infographic shows the distribution of energy types for vehicles owned by respondents: petrol or diesel, electric or hybrid, or other.
Averages (petrol/diesel / electric-hybrid / other):
Europe: 89%, 10%, 1% other
18-country average: same proportions (89%, 10%, 1%)
Country results (petrol/diesel / electric-hybrid / other):
Germany: 89 / 10 / 1
Austria: 92 / 8 / 1
Belgium: 91 / 8 / 1
Spain: 90 / 9 / 1
France: 90 / 9 / 1
Italy: 84 / 12 / 4
Norway: 76 / 23 / 1
Netherlands: 86 / 14 / 1
Poland: 96 / 3 / 1
Portugal: 93 / 7 / 0
United Kingdom: 87 / 13 / 0
Turkey: 94 / 4 / 2
South Africa: 100 / 0 / 0
Japan: 76 / 22 / 1
China: 78 / 22 / 1
United States: 90 / 9 / 1
Mexico: 98 / 6 / 2
Brazil: 87 / 7 / 6
Overall, petrol and diesel vehicles dominate in nearly all countries, with exceptions such as Norway and China where electric/hybrid penetration is higher.
Source: Observatoire Cetelem de l’Automobile 2023.
The infographic shows the distribution of energy types for vehicles owned by respondents: petrol or diesel, electric or hybrid, or other.
Averages (petrol/diesel / electric-hybrid / other):
Europe: 89%, 10%, 1% other
18-country average: same proportions (89%, 10%, 1%)
Country results (petrol/diesel / electric-hybrid / other):
Germany: 89 / 10 / 1
Austria: 92 / 8 / 1
Belgium: 91 / 8 / 1
Spain: 90 / 9 / 1
France: 90 / 9 / 1
Italy: 84 / 12 / 4
Norway: 76 / 23 / 1
Netherlands: 86 / 14 / 1
Poland: 96 / 3 / 1
Portugal: 93 / 7 / 0
United Kingdom: 87 / 13 / 0
Turkey: 94 / 4 / 2
South Africa: 100 / 0 / 0
Japan: 76 / 22 / 1
China: 78 / 22 / 1
United States: 90 / 9 / 1
Mexico: 98 / 6 / 2
Brazil: 87 / 7 / 6
Overall, petrol and diesel vehicles dominate in nearly all countries, with exceptions such as Norway and China where electric/hybrid penetration is higher.
Source: Observatoire Cetelem de l’Automobile 2023.
Prices* that make you think
When comparing similar models, the energy source used has a significant influence on the price. This is demonstrated by 5 examples taken from the French market.
- Hyundai Kona I 48V mild hybrid: €22,500, hybrid: €25,000, electric: €34,150
- Peugeot 208 I diesel: €22,500, petrol: €16,400, electric: €34,500
- Renault Twingo I combustion: €15,750, electric: €24,050
- Renault Mégane I combustion: €28,800, electric: €35,200
- Volkswagen up! I combustion: €16,550, electric: €25,400
* catalogue price, excluding grant.
The Essential

- 6 out of 10 people fear that they will not be able to afford to own a car in the future
- 4 out of 10 motorists think it is more difficult to own a car today than it was in the past
- 4 out of 10 people who do not own a car today have owned one in the past
- A world without cars is one where travelling is more difficult and more arduous
- 6 out of 10 people who are carless explain that the reason is the cost of vehicles
- 84% of the individuals surveyed are not willing to switch from used to new because of the excessive cost
- 1 in 2 people have reduced or plan to reduce the number of vehicles in their household
- 7 out of 10 people believe that the price of electric vehicles is too high