The mobility mix: an urban trend


The uneven emergence of soft mobility
Marked geographical disparities
The relative dominance of cars for everyday use, going away on holiday and leisure purposes has done nothing to halt the rising popularity of soft mobility. Indeed, with almost 1 in 2 people using a bicycle, scooter or motorised two-wheeler, it is clear that this is not just a niche preference, but a real and increasingly appealing alternative. Admittedly, this is more prevalent in European countries. Moreover, the disparities are more significant than for most of the other topics examined by this survey so far. In the Netherlands, where 85% of respondents have made soft mobility a part of their lives, this is a widespread societal attitude in all parts of the country (see below). The Chinese, who tend to be just as readily associated with cycling, but also the Poles, favour soft mobility as a complement to car use. In contrast, the Americans, Portuguese and South Africans have been slow to embrace these modes of travels (1 in 3).
In France, half of the motorists questioned claim to have done so (Fig 41).
Fig 41 – Equipment used for travel outside the car
Download this infographic for your presentations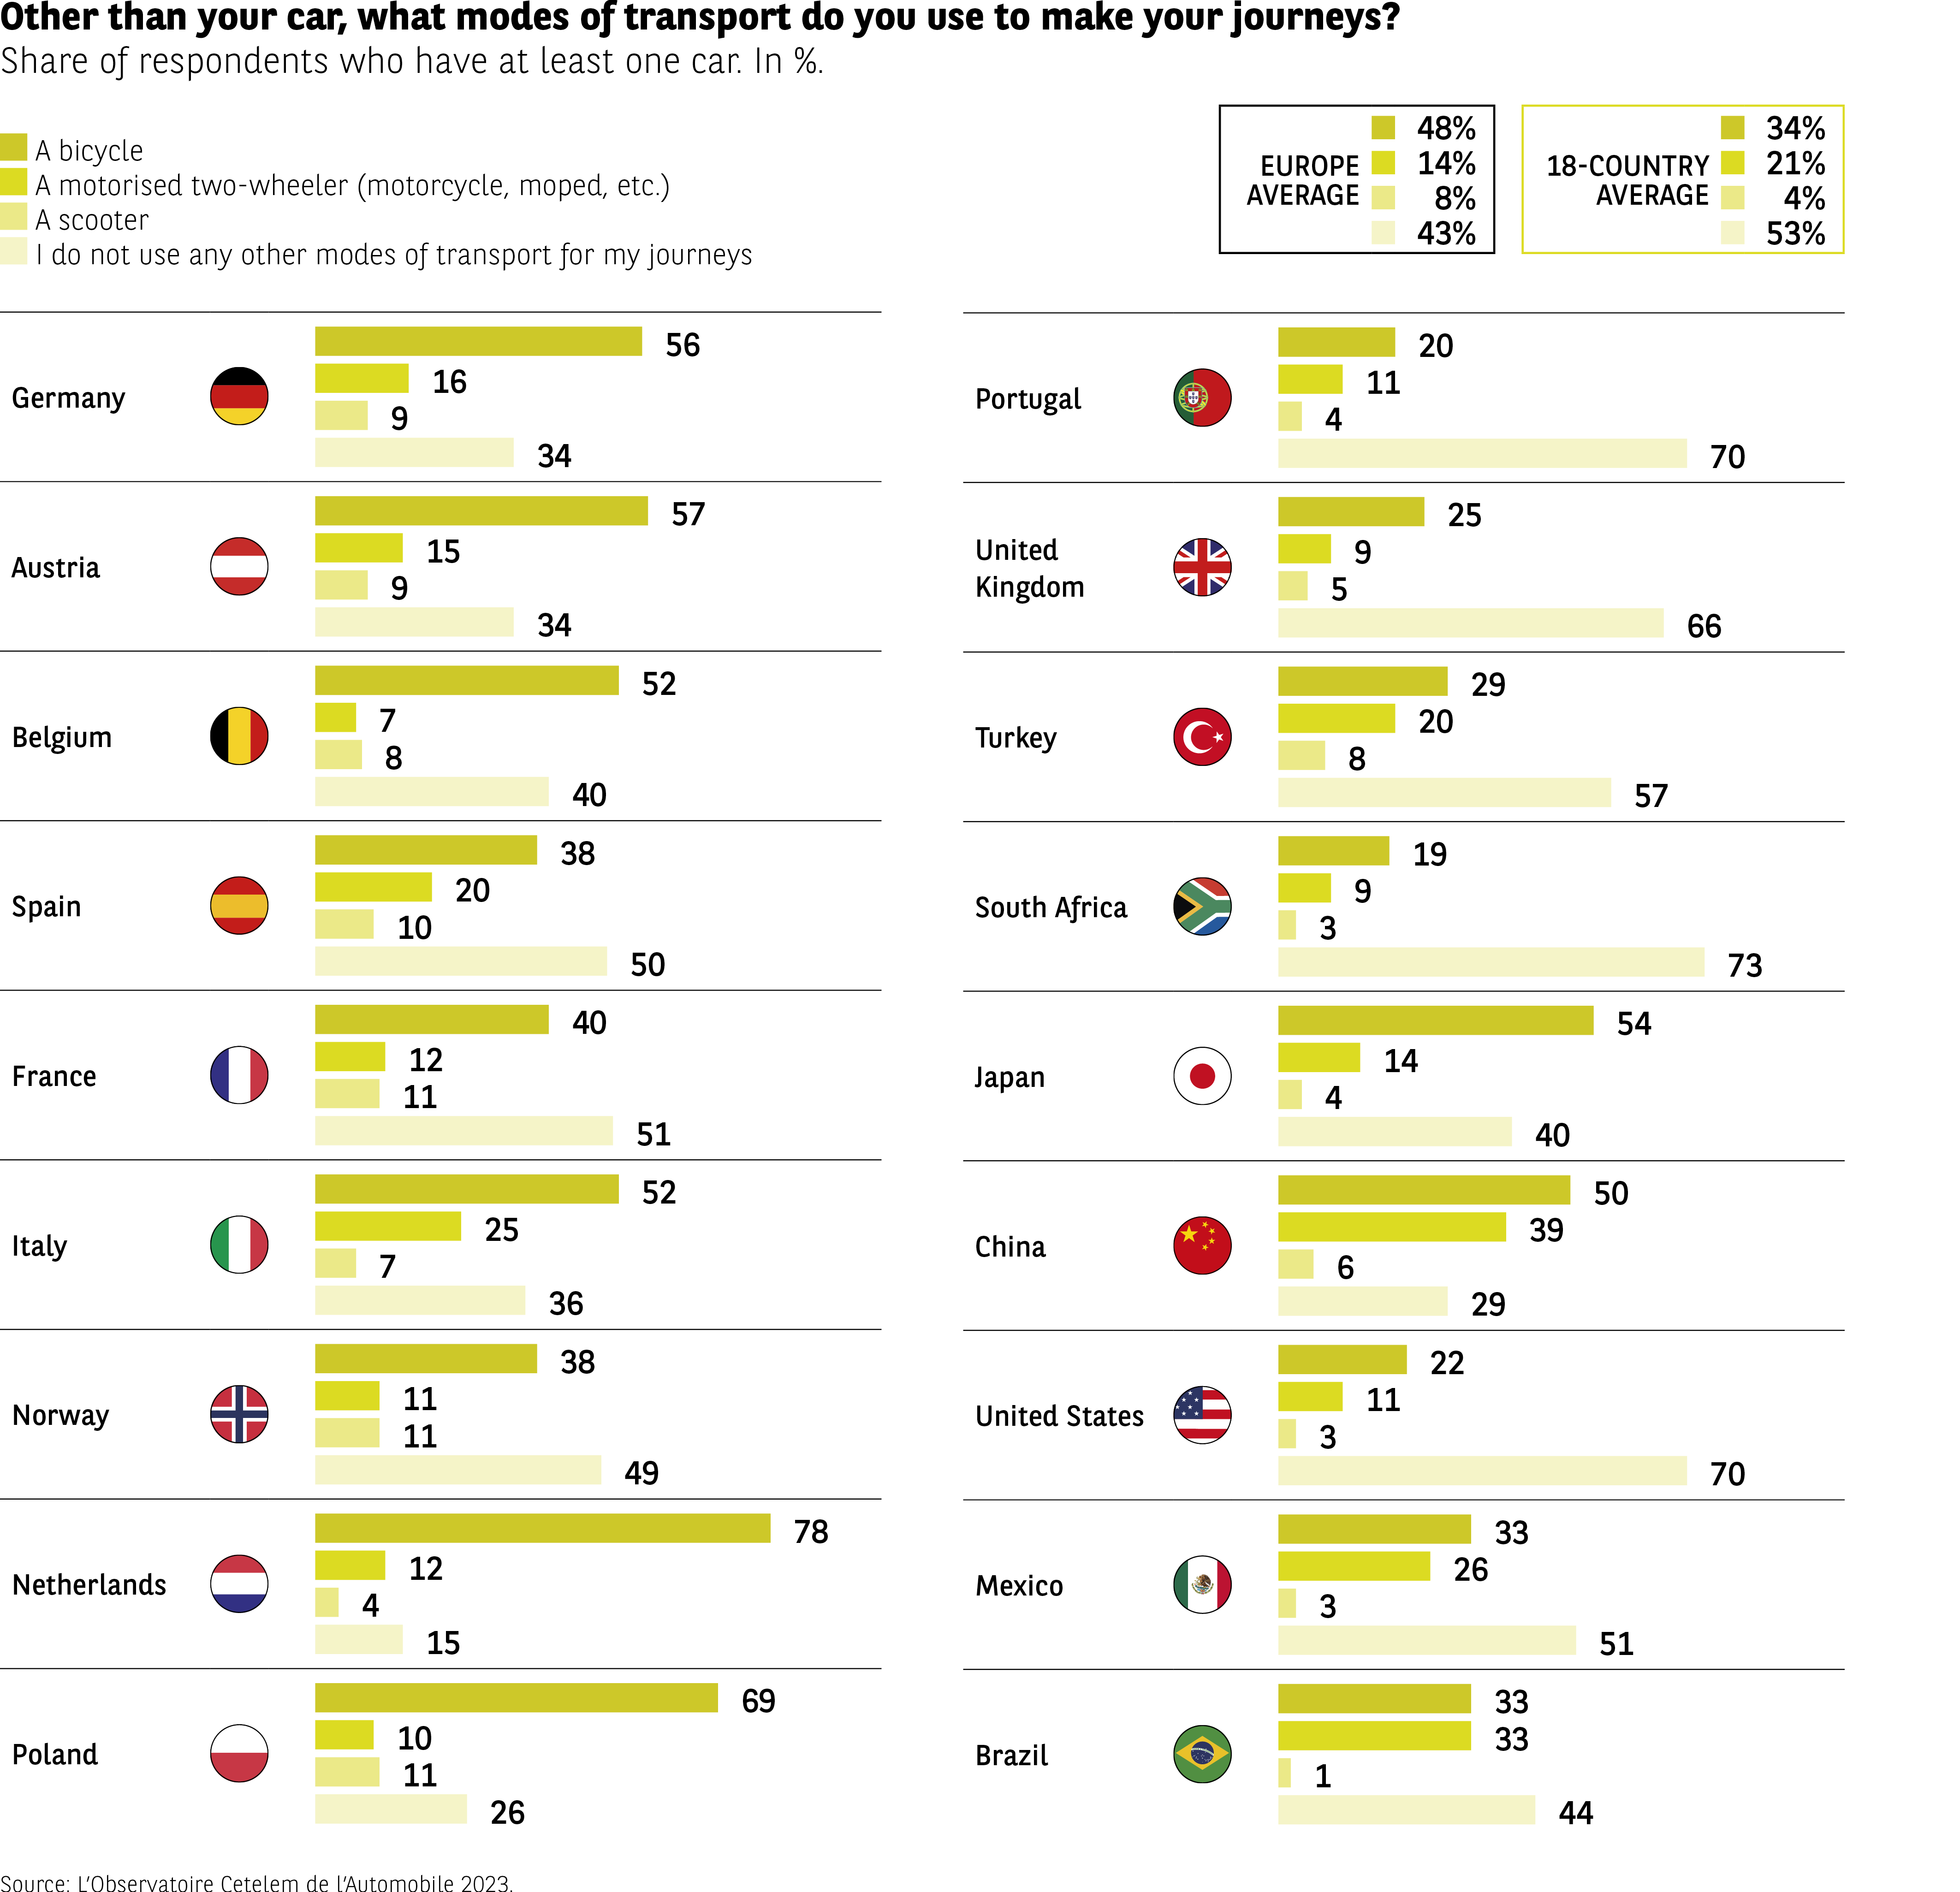 The infographic presents the share of respondents using different types of equipment to move around without a car: bicycles, motorised two-wheelers, scooters, or no alternative equipment.
Europe averages:
– Bicycle 48%
– Motorised two-wheeler 14%
– Scooter 8%
– None 43%
18-country average:
– Bicycle 34%
– Motorised 21%
– Scooter 4%
– None 53%
Selected countries (bicycle, motorised, scooter, none):
Germany: 56 / 16 / 9 / 34
Austria: 57 / 15 / 9 / 34
Belgium: 52 / 7 / 8 / 40
Spain: 38 / 20 / 10 / 50
France: 40 / 12 / 11 / 51
Italy: 52 / 25 / 7 / 36
Norway: 38 / 11 / 11 / 49
Netherlands: 78 / 12 / 4 / 15
Poland: 69 / 10 / 11 / 26
Portugal: 20 / 11 / 4 / 70
United Kingdom: 25 / 9 / 5 / 66
Turkey: 29 / 20 / 8 / 57
South Africa: 19 / 9 / 3 / 73
Japan: 54 / 14 / 4 / 40
China: 50 / 39 / 6 / 29
United States: 22 / 11 / 3 / 70
Mexico: 33 / 26 / 3 / 51
Brazil: 33 / 33 / 1 / 44
Cycling rates vary widely, with very high usage in the Netherlands and Poland, while several non-European countries show a high share of “no equipment”.
Source: Observatoire Cetelem de l’Automobile 2023.
The infographic presents the share of respondents using different types of equipment to move around without a car: bicycles, motorised two-wheelers, scooters, or no alternative equipment.
Europe averages:
– Bicycle 48%
– Motorised two-wheeler 14%
– Scooter 8%
– None 43%
18-country average:
– Bicycle 34%
– Motorised 21%
– Scooter 4%
– None 53%
Selected countries (bicycle, motorised, scooter, none):
Germany: 56 / 16 / 9 / 34
Austria: 57 / 15 / 9 / 34
Belgium: 52 / 7 / 8 / 40
Spain: 38 / 20 / 10 / 50
France: 40 / 12 / 11 / 51
Italy: 52 / 25 / 7 / 36
Norway: 38 / 11 / 11 / 49
Netherlands: 78 / 12 / 4 / 15
Poland: 69 / 10 / 11 / 26
Portugal: 20 / 11 / 4 / 70
United Kingdom: 25 / 9 / 5 / 66
Turkey: 29 / 20 / 8 / 57
South Africa: 19 / 9 / 3 / 73
Japan: 54 / 14 / 4 / 40
China: 50 / 39 / 6 / 29
United States: 22 / 11 / 3 / 70
Mexico: 33 / 26 / 3 / 51
Brazil: 33 / 33 / 1 / 44
Cycling rates vary widely, with very high usage in the Netherlands and Poland, while several non-European countries show a high share of “no equipment”.
Source: Observatoire Cetelem de l’Automobile 2023.
Ever increasing appeal
Even more positively, these greener approaches to mobility are gradually gaining ground. Soft forms of mobility are increasingly being used by almost a third of the motorists surveyed, a figure higher than the share who say they are using them less and less. As for all the other items, the proportion of motorists who no longer use certain means of transport is higher than the proportion who now use them more frequently (Fig 42).
Fig 42 – Evolution of transport means usage
Download this infographic for your presentations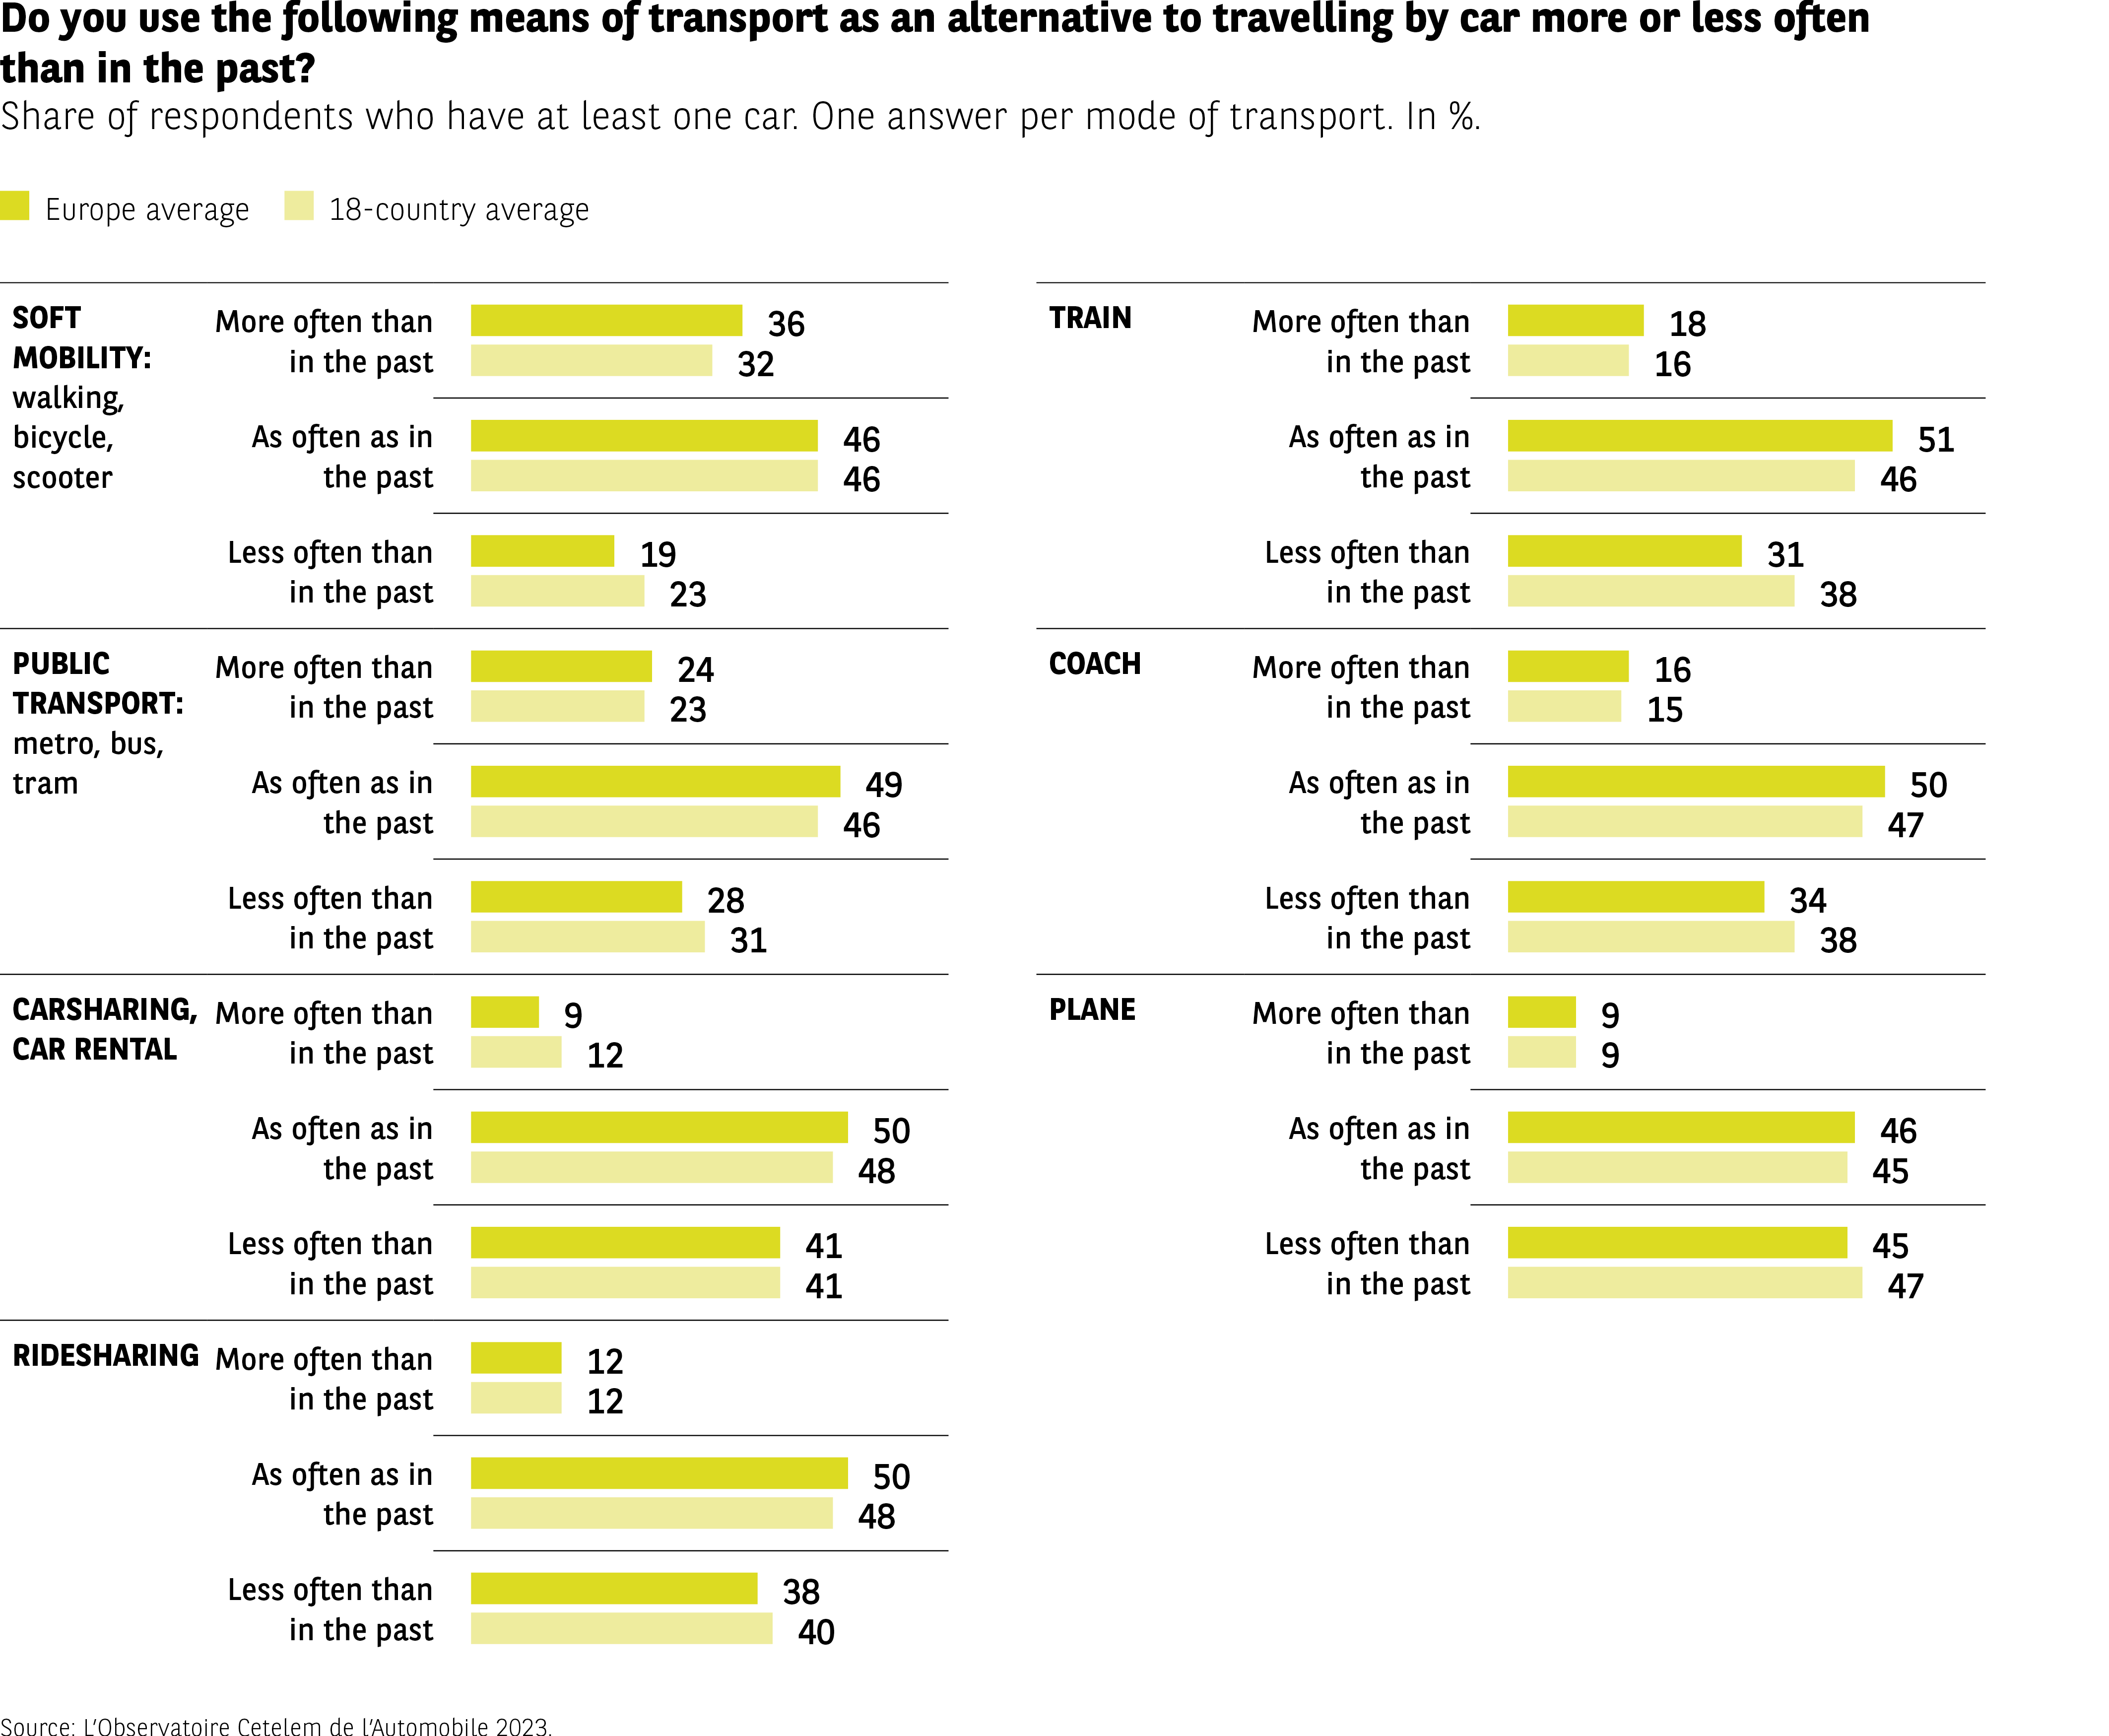 The infographic shows how often people who own at least one car use various transport modes compared with before. Two data series are displayed: the Europe average and the 18-country average.
Values provided (Europe, 18 countries):
Walking, cycling, scooters
More often: 36%, 32%
Same: 46%, 46%
Less often: 19%, 23%
Public transport (metro, bus, tram)
More often: 24%, 23%
Same: 49%, 46%
Less often: 28%, 31%
Car-sharing / rental cars
More often: 9%, 12%
Same: 50%, 48%
Less often: 41%, 41%
Carpooling
More often: 12%, 12%
Same: 50%, 48%
Less often: 38%, 40%
Train
More often: 18%, 16%
Same: 51%, 46%
Less often: 31%, 38%
Coach
More often: 16%, 15%
Same: 50%, 47%
Less often: 34%, 38%
Airplane
More often: 9%, 9%
Same: 46%, 45%
Less often: 45%, 47%
Overall, most modes are used “as often as before”, while long-distance modes (train, coach, air travel) are more often cited as being used less.
Source: Observatoire Cetelem de l’Automobile 2023.
The infographic shows how often people who own at least one car use various transport modes compared with before. Two data series are displayed: the Europe average and the 18-country average.
Values provided (Europe, 18 countries):
Walking, cycling, scooters
More often: 36%, 32%
Same: 46%, 46%
Less often: 19%, 23%
Public transport (metro, bus, tram)
More often: 24%, 23%
Same: 49%, 46%
Less often: 28%, 31%
Car-sharing / rental cars
More often: 9%, 12%
Same: 50%, 48%
Less often: 41%, 41%
Carpooling
More often: 12%, 12%
Same: 50%, 48%
Less often: 38%, 40%
Train
More often: 18%, 16%
Same: 51%, 46%
Less often: 31%, 38%
Coach
More often: 16%, 15%
Same: 50%, 47%
Less often: 34%, 38%
Airplane
More often: 9%, 9%
Same: 46%, 45%
Less often: 45%, 47%
Overall, most modes are used “as often as before”, while long-distance modes (train, coach, air travel) are more often cited as being used less.
Source: Observatoire Cetelem de l’Automobile 2023.
However, public transport, trains and coaches have been newly embraced by 23%, 16% and 15% of respondents, respectively. Generally speaking, the status quo remains to an extent, with about half of all car owners having made no changes to their travel habits.
To give a specific geographical example, respondents in Turkey seem to be the most willing to try every possible mode of transport that might offer a viable alternative to car use, which they consider too costly. Whether we are talking about soft mobility, public transport, trains, coaches, planes or carsharing, the Turks come top of the 18-country ranking. It is only beaten by China (by 2 pts) when it comes to ridesharing.
The electric bike and scooter phenomenon
On the topic of soft mobility, it is worth taking a closer look at bicycle and scooter use in Europe.
When one thinks of cycling, one inevitably thinks of the Netherlands, a country with an average of 1.3 bicycles per capita and whose city of Utrecht boasts the world’s largest dedicated bicycle parking area*. But if one talks about bicycles, it is impossible today to avoid combining it with the word “electric”.In 5 years, European sales of electric pedal-assist bicycles (or e-bikes) have almost tripled and now comfortably exceed 3 million units per year (Fig 43). As for traditional bicycles, their sales have remained relatively stable at 22 million in 2020, across 28 European countries.
By comparison, Chinese sales of e-bikes alone reached 16 million units in 2020.
In France, they accounted for 24% of total sales in 2021. In Germany, the market share of e-bikes is even higher, at 40%. A report on mobility published in 2019 revealed that sales were highest in rural areas and among seniors. In the Netherlands, more and more traditional cyclists are also switching to e-bikes.
As for scooters, the picture is even rosier. In France, sales increased ninefold between 2017 and 2021. The million unit sales per year mark will very soon be passed.
* Source : deustschland.de
Fig 43 – Electric bike sales trends
Download this infographic for your presentations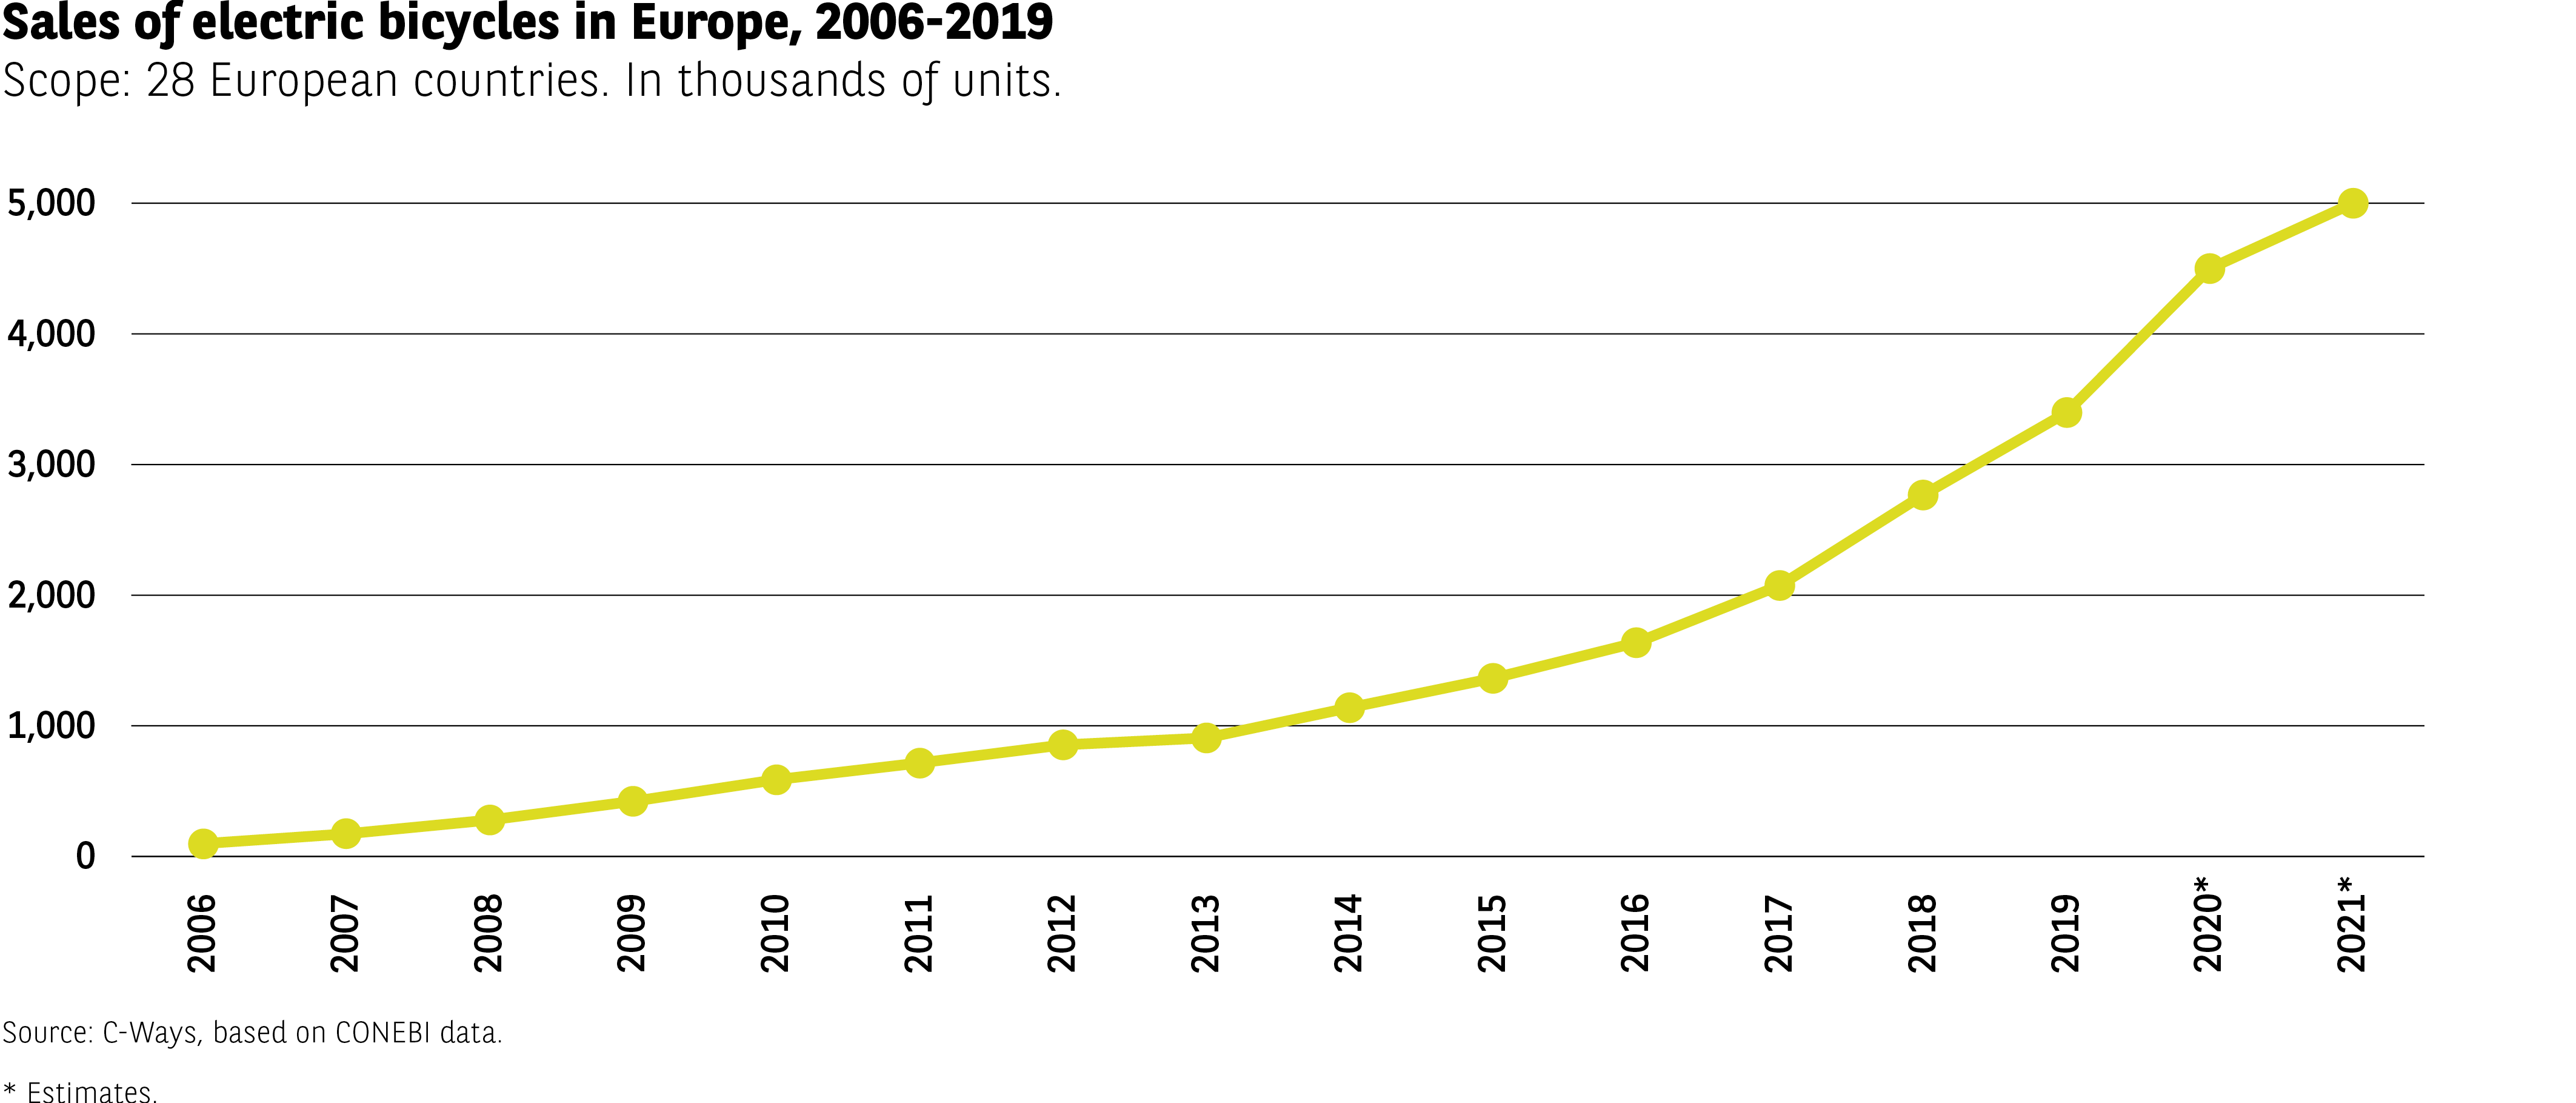 The infographic shows the evolution of electric bike sales in Europe between 2006 and 2019, expressed in thousands of units, across 28 European countries. Data for 2020 and 2021 are marked as estimates.
Approximate values:
2006: ~100
2007: ~150
2008: ~250
2009: ~350
2010: ~450
2011: ~550
2012: ~700
2013: ~750
2014: ~900
2015: ~1100
2016: ~1400
2017: ~2000
2018: ~2700
2019: ~3300
2020*: ~4500
2021*: ~5000
The overall trend shows a steady and pronounced increase over the entire period.
Source: C-Ways based on CONEBI.
*Estimates.
The infographic shows the evolution of electric bike sales in Europe between 2006 and 2019, expressed in thousands of units, across 28 European countries. Data for 2020 and 2021 are marked as estimates.
Approximate values:
2006: ~100
2007: ~150
2008: ~250
2009: ~350
2010: ~450
2011: ~550
2012: ~700
2013: ~750
2014: ~900
2015: ~1100
2016: ~1400
2017: ~2000
2018: ~2700
2019: ~3300
2020*: ~4500
2021*: ~5000
The overall trend shows a steady and pronounced increase over the entire period.
Source: C-Ways based on CONEBI.
*Estimates.
The widely varying cost of alternative forms of mobility
Comparing the cost of alternative modes of transport reveals significant variations between the countries. It should be noted that France has put in place a number of incentives to encourage its citizens to switch to other modes of transport (Fig 44 and 45).
Fig 44 – Cost of different alternative mobilities
Download this infographic for your presentations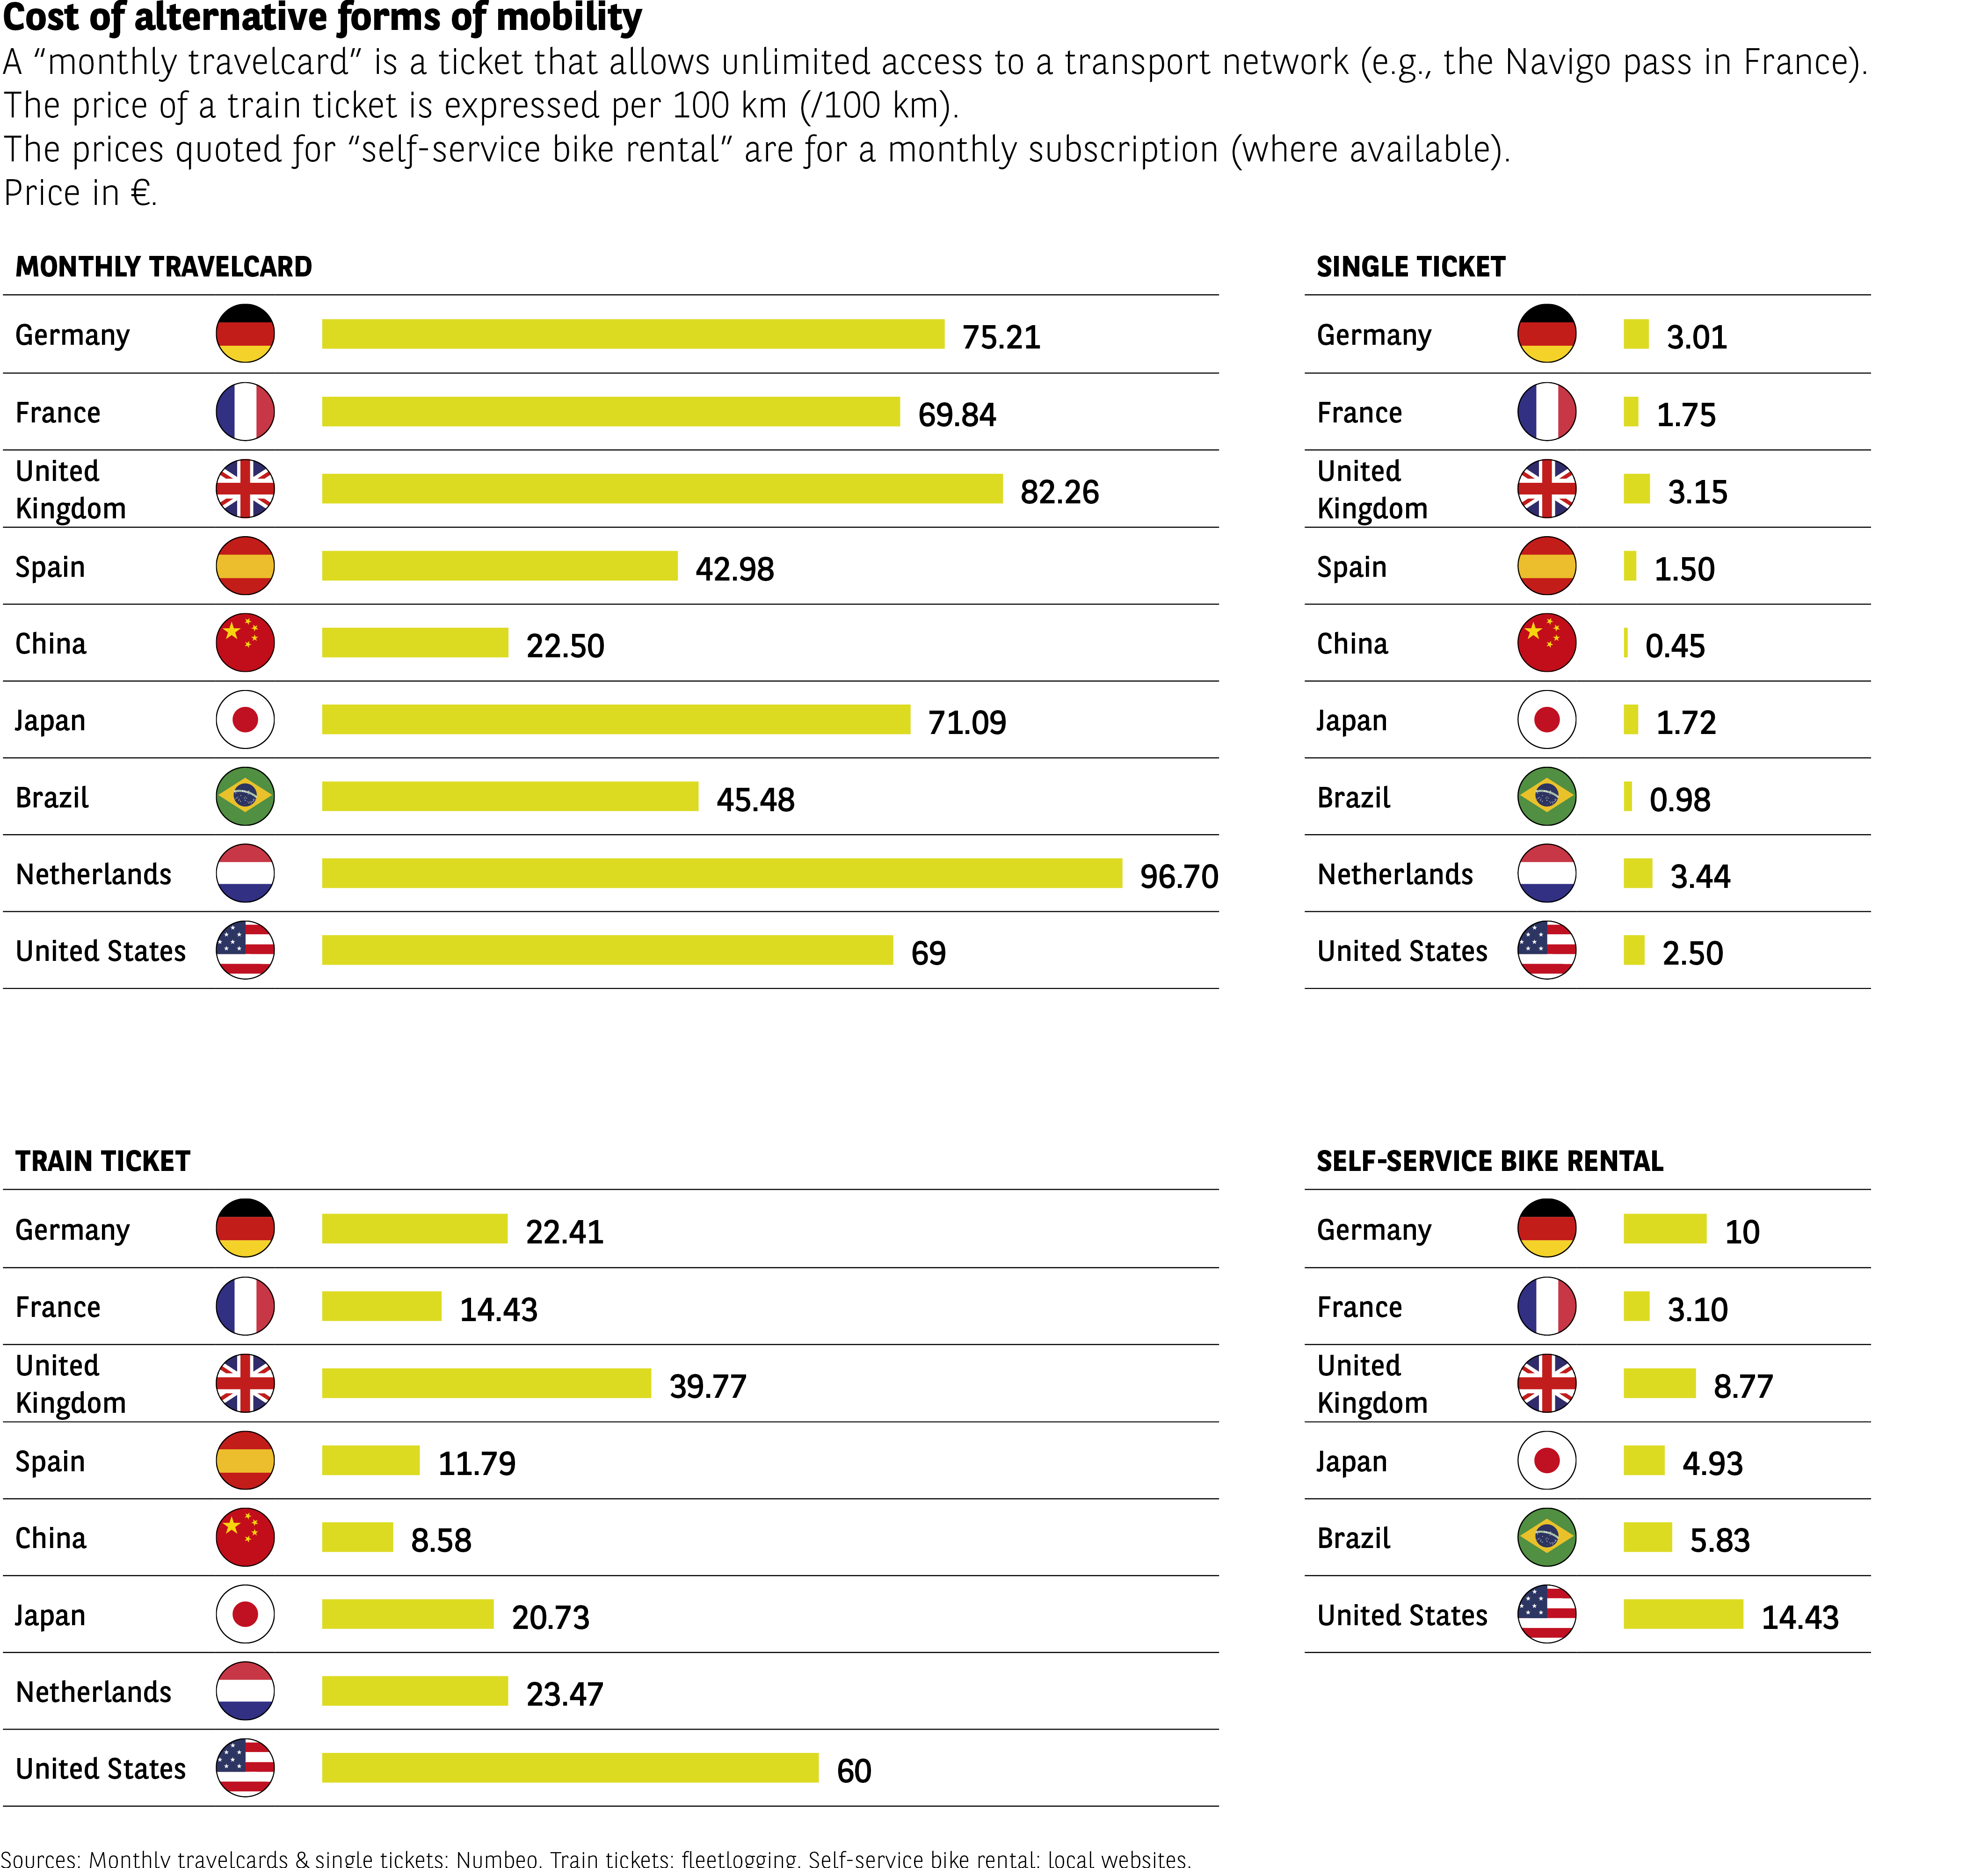 The infographic presents four types of costs related to alternative mobility: monthly public transport pass, single transport ticket, 100-km train ticket, and bike-sharing usage price.
Monthly pass (€):
Germany 75.21
France 69.84
United Kingdom 82.26
Spain 42.98
China 22.50
Japan 71.09
Brazil 45.48
Netherlands 96.70
United States 69
Single ticket (€):
Germany 3.01
France 1.75
United Kingdom 3.15
Spain 1.50
China 0.45
Japan 1.72
Brazil 0.98
Netherlands 3.44
United States 2.50
Train ticket, 100 km (€):
Germany 22.41
France 14.43
United Kingdom 39.77
Spain 11.79
China 8.58
Japan 20.73
Netherlands 23.47
United States 60
Bike-sharing (€ per use):
Germany 10
France 3.10
United Kingdom 8.77
Japan 4.93
Brazil 5.83
United States 14.43
The data highlights strong variation across countries, especially for monthly passes and long-distance train tickets.
Sources: Numbeo (passes & tickets), fleetlogging (train tickets), national bike-sharing sites.
The infographic presents four types of costs related to alternative mobility: monthly public transport pass, single transport ticket, 100-km train ticket, and bike-sharing usage price.
Monthly pass (€):
Germany 75.21
France 69.84
United Kingdom 82.26
Spain 42.98
China 22.50
Japan 71.09
Brazil 45.48
Netherlands 96.70
United States 69
Single ticket (€):
Germany 3.01
France 1.75
United Kingdom 3.15
Spain 1.50
China 0.45
Japan 1.72
Brazil 0.98
Netherlands 3.44
United States 2.50
Train ticket, 100 km (€):
Germany 22.41
France 14.43
United Kingdom 39.77
Spain 11.79
China 8.58
Japan 20.73
Netherlands 23.47
United States 60
Bike-sharing (€ per use):
Germany 10
France 3.10
United Kingdom 8.77
Japan 4.93
Brazil 5.83
United States 14.43
The data highlights strong variation across countries, especially for monthly passes and long-distance train tickets.
Sources: Numbeo (passes & tickets), fleetlogging (train tickets), national bike-sharing sites.
Fig 45 – Price comparison between single ticket and monthly pass
Download this infographic for your presentations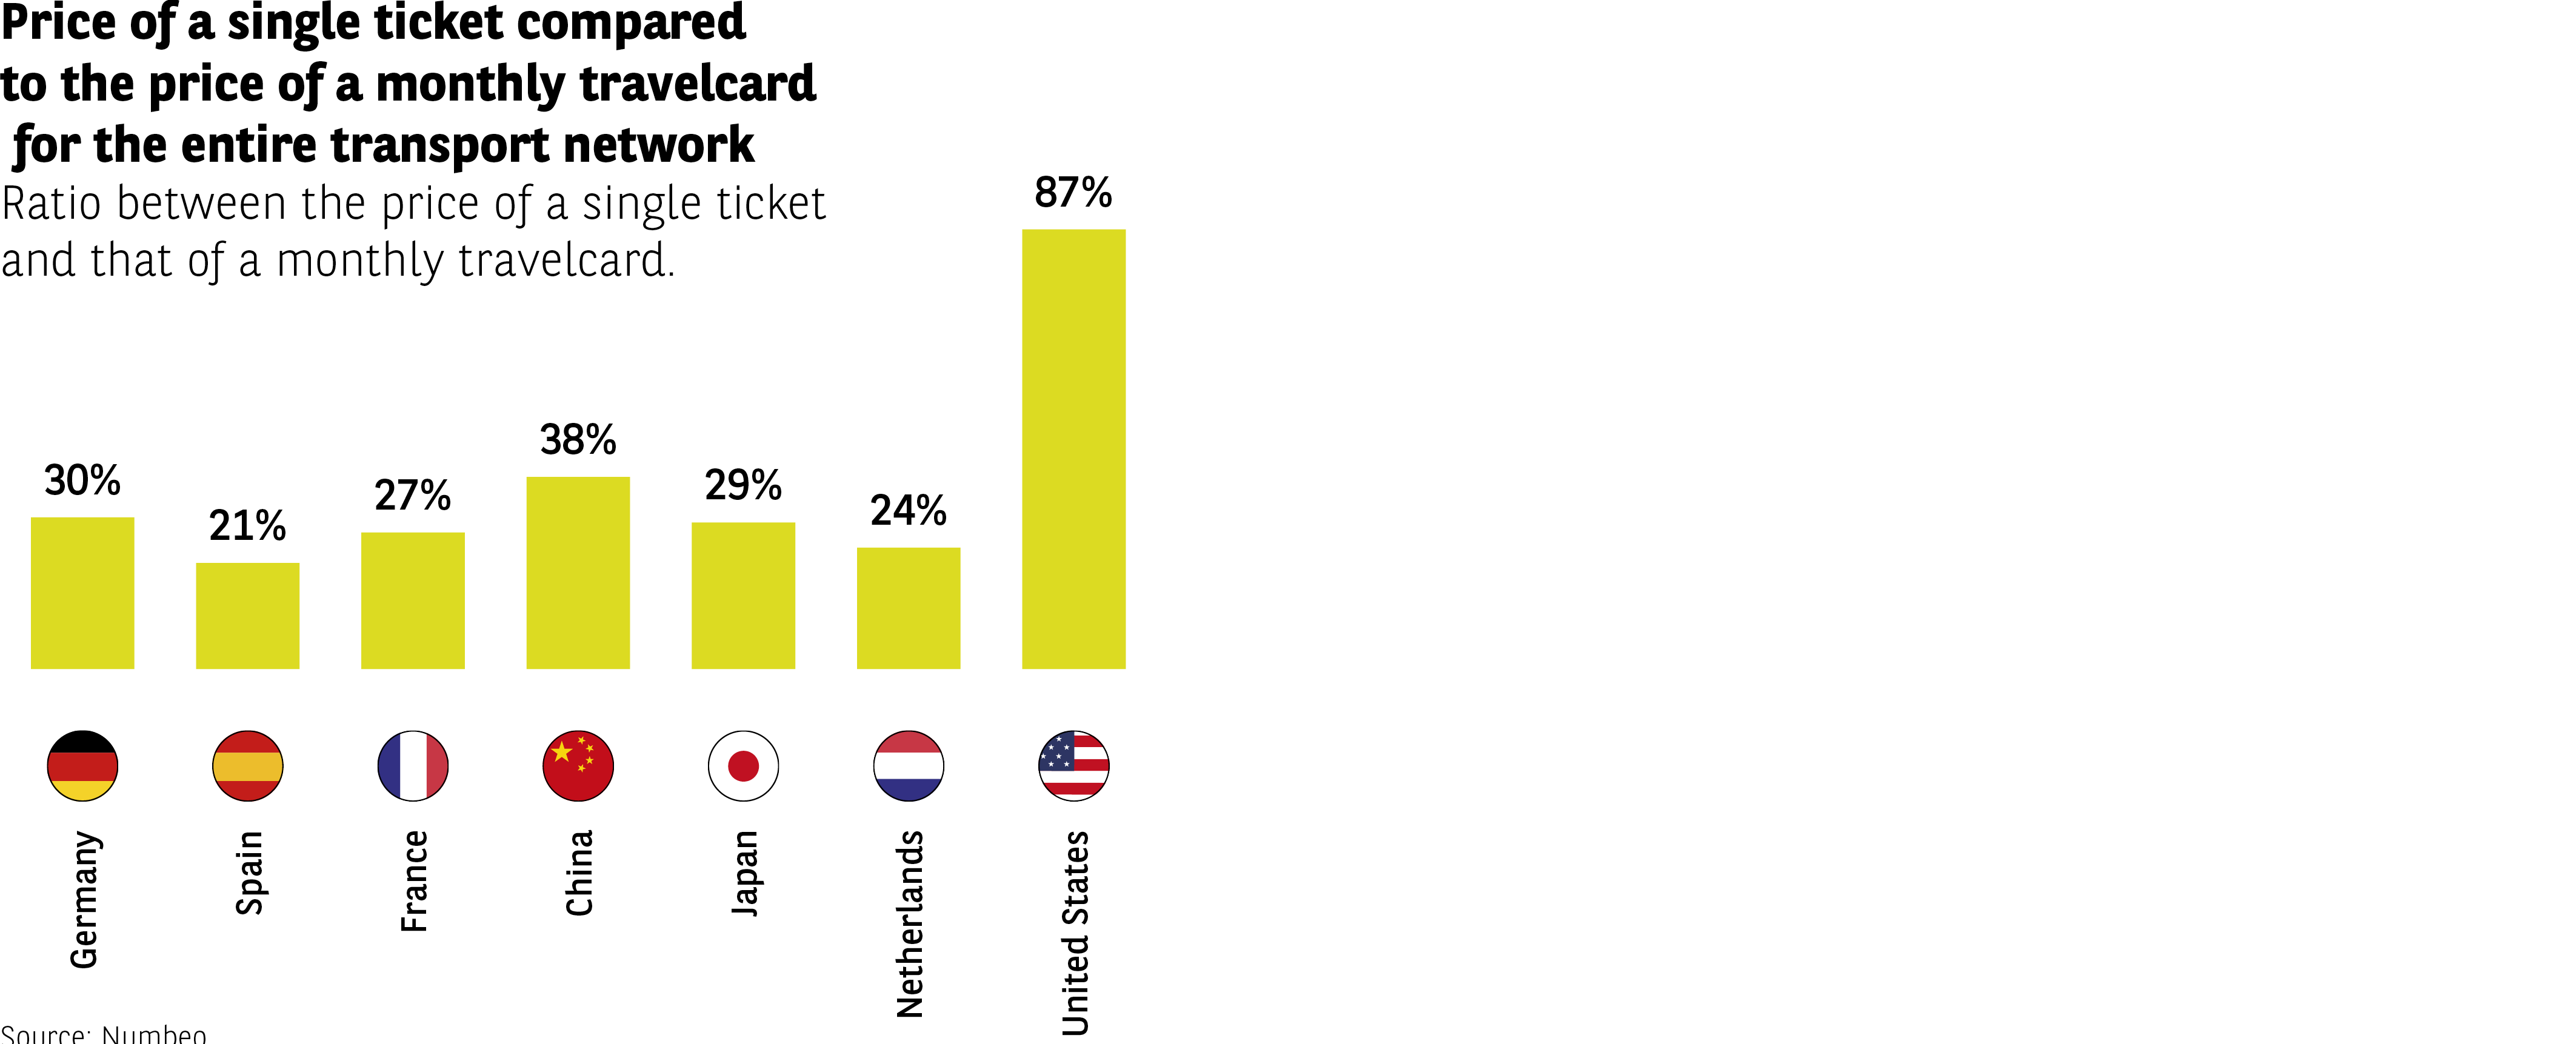 The infographic compares the ratio between the price of a single transport ticket and the cost of a monthly pass in several countries.
Values:
Germany: 30%
Spain: 21%
France: 27%
China: 38%
Japan: 29%
Netherlands: 24%
United States: 87%
Ratios vary widely, with relatively low levels in Europe and a notably high ratio in the United States.
Source: Numbeo.
The infographic compares the ratio between the price of a single transport ticket and the cost of a monthly pass in several countries.
Values:
Germany: 30%
Spain: 21%
France: 27%
China: 38%
Japan: 29%
Netherlands: 24%
United States: 87%
Ratios vary widely, with relatively low levels in Europe and a notably high ratio in the United States.
Source: Numbeo.
Soft mobility and rurality do not mix
The previous results show that there are fundamental differences of opinion between the rural world and the urban world when it comes to soft mobility. Two specific findings uncovered by this survey support this analysis.
In terms of daily journeys, a stark difference can be seen between rural dwellers, who have no choice but to use a car, and urbanites, who can do without one more easily. Indeed, 56% of those in rural areas rely on their vehicle each day, while this is true for just 35% of urban residents (Fig 46). Daily car use in rural areas is primarily a Western phenomenon. This is backed up by the fact that the highest rates are to be found in the United States, the United Kingdom, Germany and France, four countries where the automotive sector plays a key economic role.
Fig 46 – Preferred modes of transport other than car for work
Download this infographic for your presentations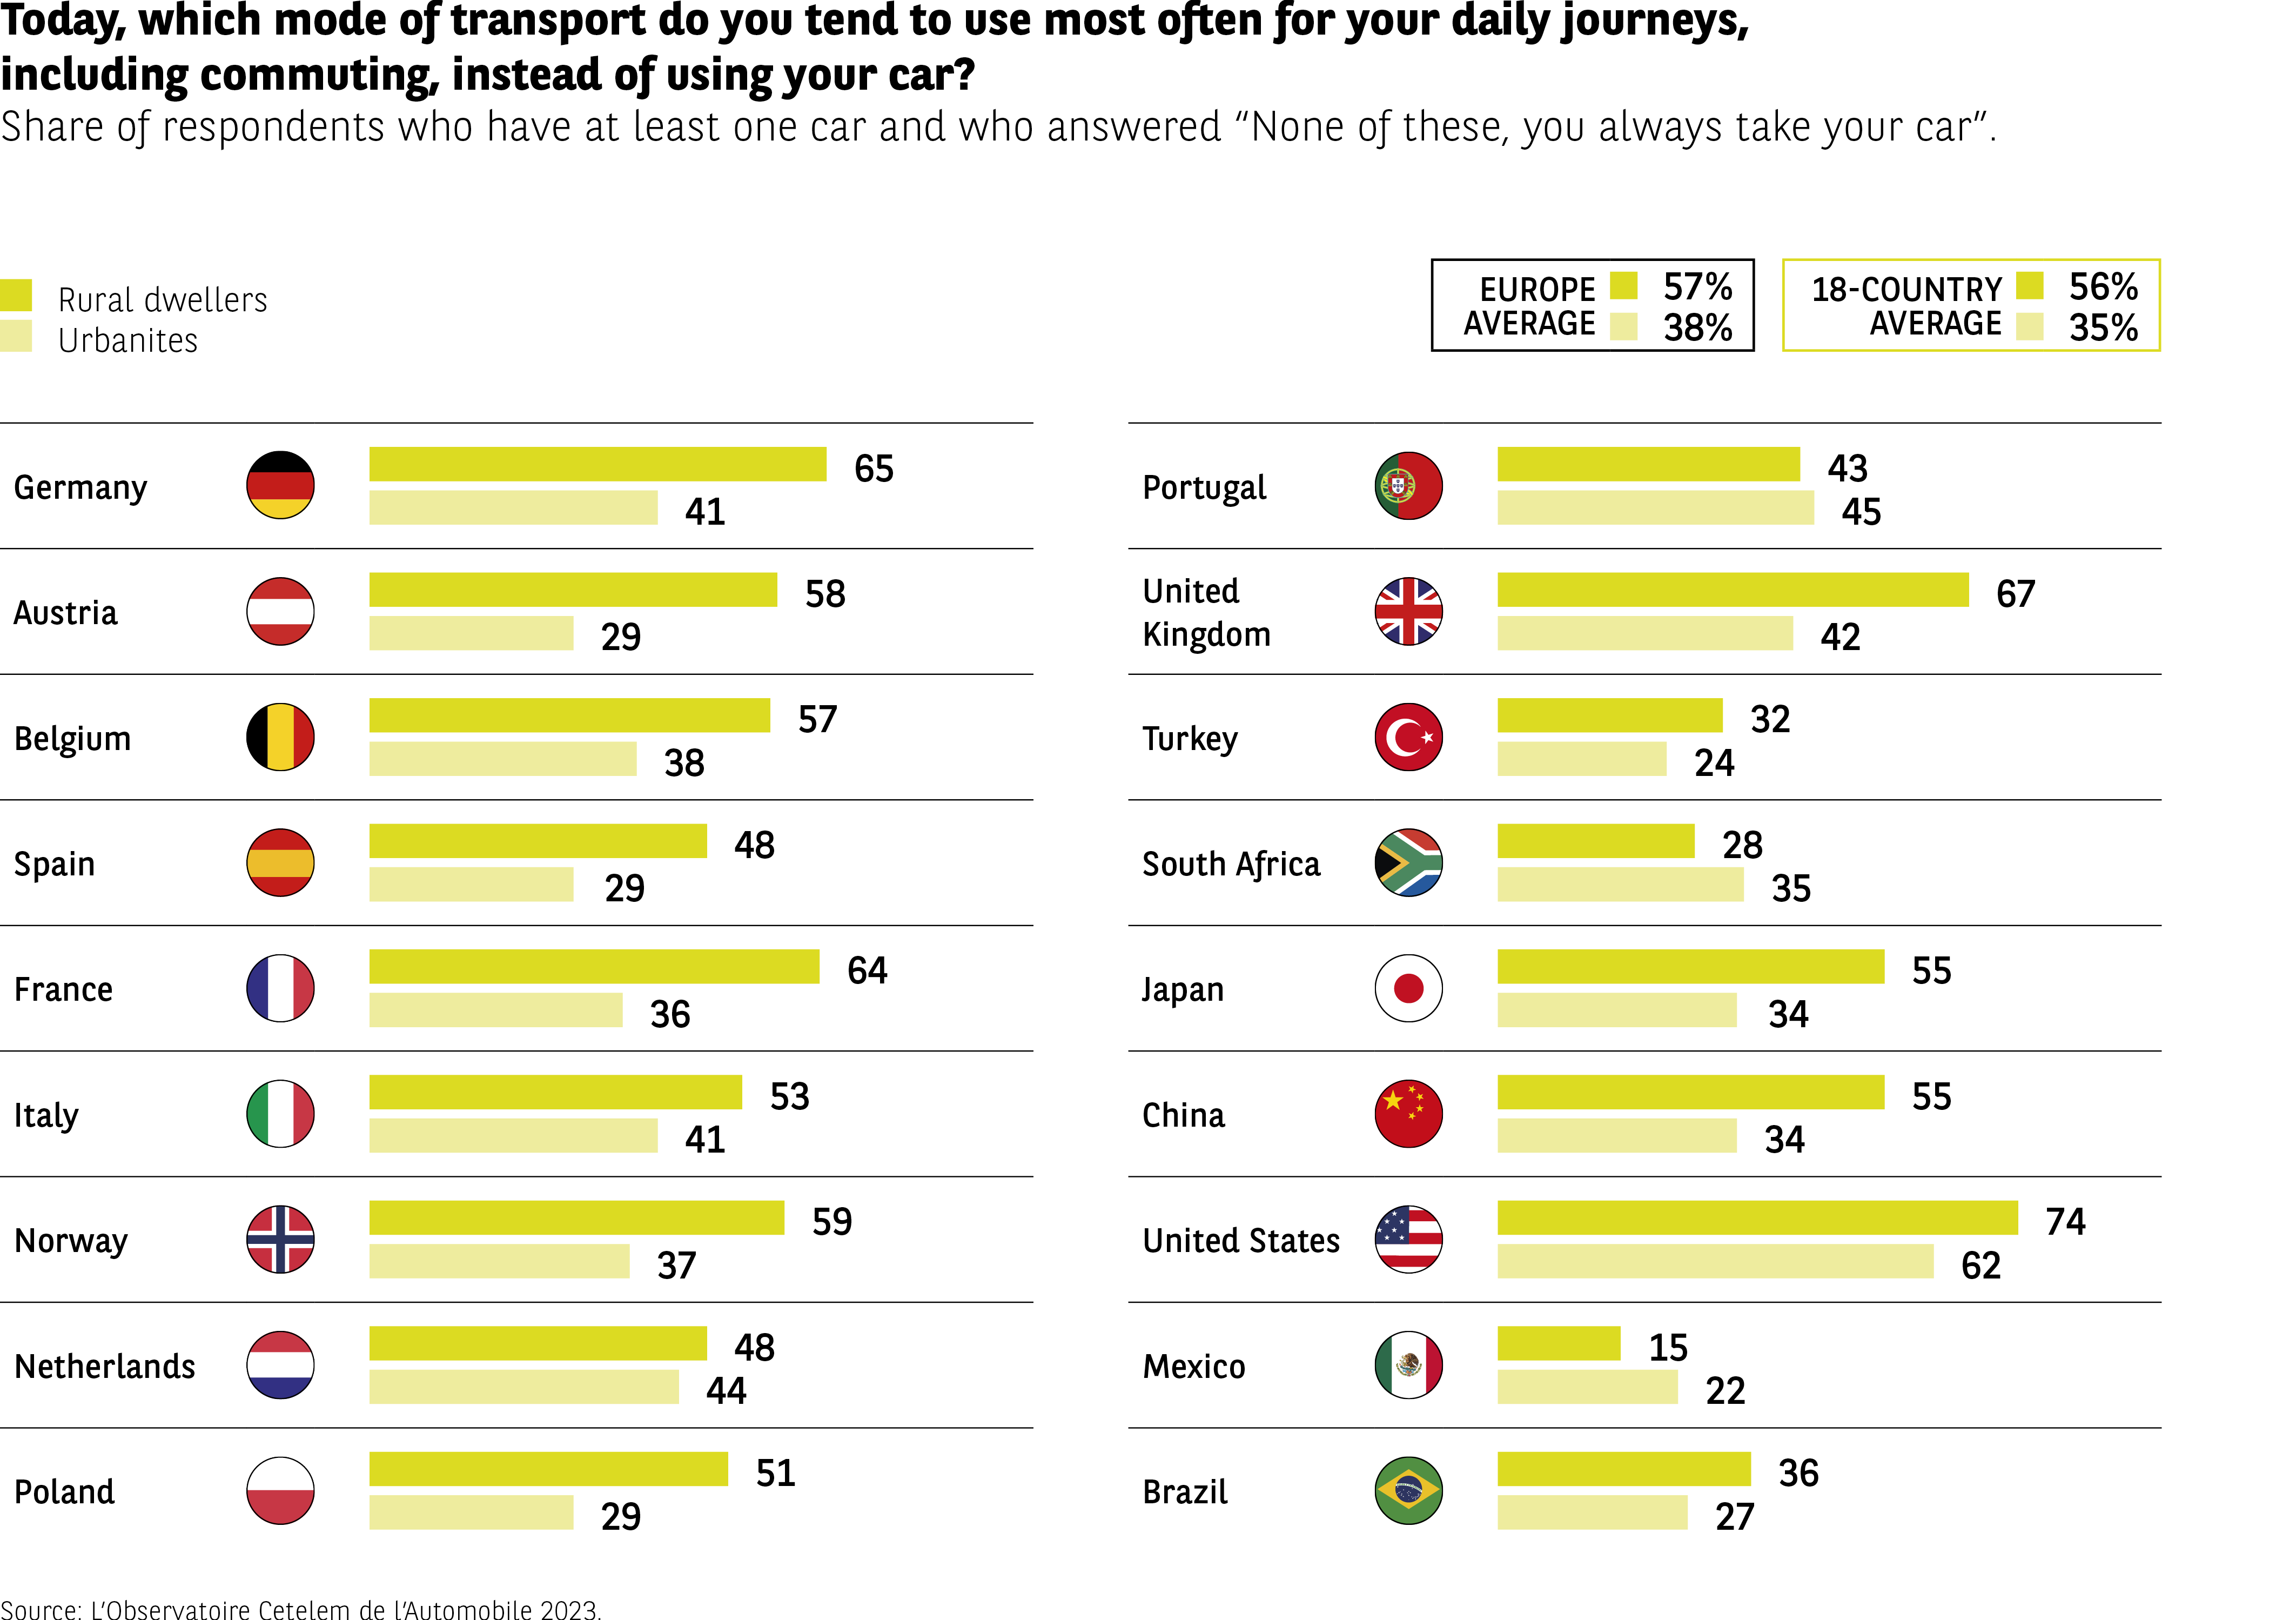 The infographic shows, for each country, the share of respondents identifying the mode they prefer when not using their car to commute. Data are shown separately for rural and urban respondents.
Averages (rural / urban):
Europe: 57%, 38%
18-country average: 56%, 35%
Country values (rural / urban):
Germany 65 / 41
Austria 58 / 29
Belgium 57 / 38
Spain 48 / 29
France 64 / 36
Italy 53 / 41
Norway 59 / 37
Netherlands 48 / 44
Poland 51 / 29
Portugal 43 / 45
United Kingdom 67 / 42
Turkey 32 / 24
South Africa 28 / 35
Japan 55 / 34
China 55 / 34
United States 74 / 62
Mexico 15 / 22
Brazil 36 / 27
In most countries, rural respondents are more likely than urban respondents to choose a non-car mode.
Source: Observatoire Cetelem de l’Automobile 2023.
The infographic shows, for each country, the share of respondents identifying the mode they prefer when not using their car to commute. Data are shown separately for rural and urban respondents.
Averages (rural / urban):
Europe: 57%, 38%
18-country average: 56%, 35%
Country values (rural / urban):
Germany 65 / 41
Austria 58 / 29
Belgium 57 / 38
Spain 48 / 29
France 64 / 36
Italy 53 / 41
Norway 59 / 37
Netherlands 48 / 44
Poland 51 / 29
Portugal 43 / 45
United Kingdom 67 / 42
Turkey 32 / 24
South Africa 28 / 35
Japan 55 / 34
China 55 / 34
United States 74 / 62
Mexico 15 / 22
Brazil 36 / 27
In most countries, rural respondents are more likely than urban respondents to choose a non-car mode.
Source: Observatoire Cetelem de l’Automobile 2023.
The Essential

- 9 out of 10 people regularly use their car for leisure purposes or to do their shopping
- 1 in 2 motorists use soft forms of mobility in a complementary way
- 1 in 3 people use soft forms of mobility more often
- 56% of rural dwellers always use their car to travel to work